Voltammetry vs. Spectroscopy for Trace Analysis: A Comprehensive Guide for Researchers and Drug Development Professionals
This article provides a comparative analysis of voltammetry and spectroscopy for trace analysis, catering to researchers and scientists in pharmaceutical and environmental fields.
Voltammetry vs. Spectroscopy for Trace Analysis: A Comprehensive Guide for Researchers and Drug Development Professionals
Abstract
This article provides a comparative analysis of voltammetry and spectroscopy for trace analysis, catering to researchers and scientists in pharmaceutical and environmental fields. It explores the foundational principles of both techniques, with a focus on voltammetry's unique capability for metal speciation analysis and its application in detecting trace metals and bioactive compounds. The scope includes methodological applications across different sample matrices, advanced troubleshooting protocols, and a direct validation of performance metrics against established spectroscopic methods. The article synthesizes key takeaways to guide method selection and discusses future trends, including the integration of nanotechnology and AI, to address evolving challenges in biomedical research and quality control.
Core Principles and Analytical Scope: Understanding Voltammetry's Edge in Speciation
In the critical field of trace metal analysis, the choice of analytical technique profoundly influences the quality and applicability of research outcomes. The central thesis of this guide is that while spectroscopic methods are powerful for determining total metal concentrations, voltammetric techniques provide a distinct and often superior advantage for speciation analysis, which is essential for understanding metal bioavailability, toxicity, and environmental cycling. This article provides an objective, data-driven comparison of these two methodological families, equipping researchers and drug development professionals with the evidence needed to select the optimal tool for their specific trace analysis challenges.
Fundamental Principles: A Tale of Two Techniques
Understanding the core operational principles of voltammetry and spectroscopy is key to appreciating their comparative strengths and applications.
The Voltammetric Approach
Voltammetry is an electrochemical technique where a varying potential is applied to an electrode in an electrolyte solution, and the resulting current is measured. The redox reactions of the analyte at the electrode surface generate a current proportional to its concentration [1]. A typical setup uses a three-electrode system: a working electrode, a reference electrode, and a counter electrode [1]. Stripping voltammetry, a particularly sensitive branch, involves a two-stage process: first, a preconcentration step where metal ions are accumulated onto the electrode surface, and second, a stripping step where they are released back into solution, producing a measurable current signal [2] [3]. This pre-concentration is the key to its exceptional sensitivity.
The Spectroscopic Approach
Spectroscopic techniques, such as Inductively Coupled Plasma Mass Spectrometry (ICP-MS) and Atomic Absorption Spectroscopy (AAS), operate on different principles. They typically involve atomizing the sample in a high-energy source (e.g., a plasma or flame) and measuring the interaction of light with the atoms or ions. This interaction can be the absorption of specific wavelengths (AAS) or the detection of mass-to-charge ratios (ICP-MS). While these methods are excellent for determining the total concentration of metals, they generally cannot distinguish between different chemical species of the same metal without coupling to separation techniques like chromatography [2].
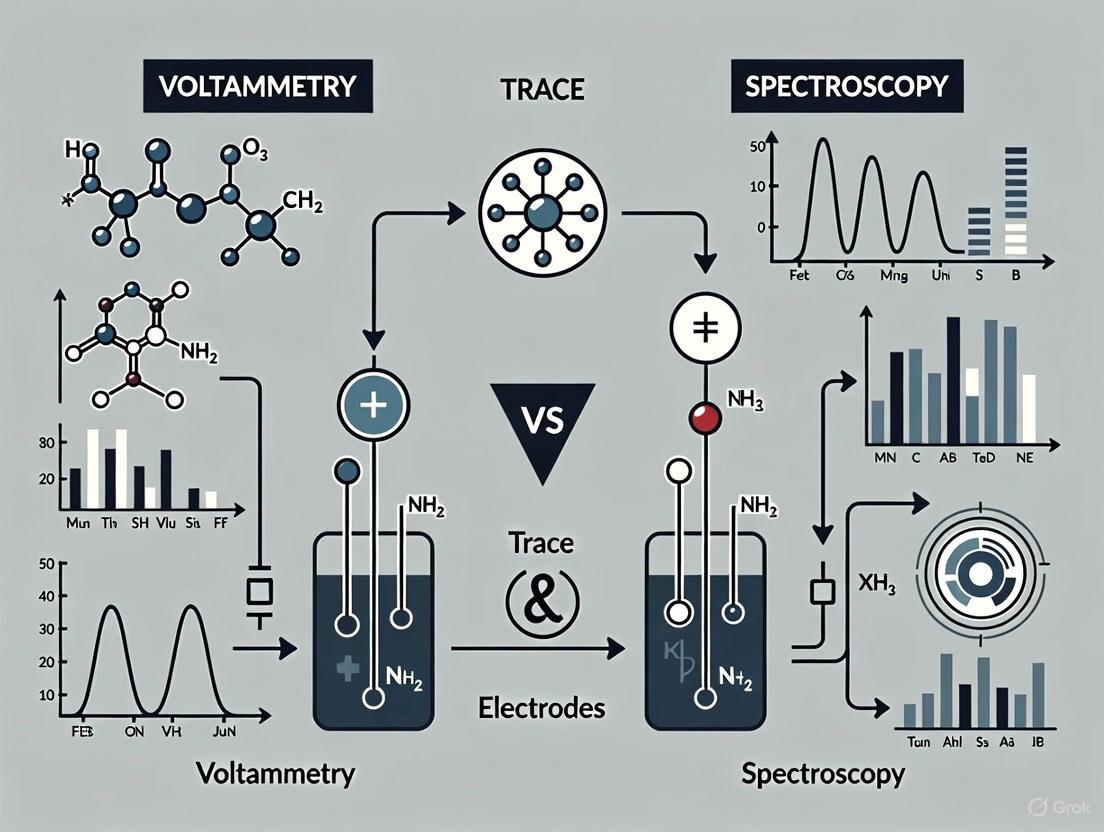
Fundamental Workflows of Voltammetry and Spectroscopy
Performance Comparison: Data-Driven Decision Making
The following tables summarize key performance metrics and application-specific strengths of voltammetric and spectroscopic techniques, based on experimental data from the literature.
Table 1: Overall Analytical Performance Comparison
| Parameter | Voltammetric Techniques | Spectroscopic Techniques (e.g., ICP-MS) |
|---|---|---|
| Typical Detection Limits | ppt to ppb range (e.g., Cd: 0.045 μg/L, Pb: 0.045 μg/L) [4] | ppt to ppb range (often superior for total metal analysis) |
| Analysis Speed | Minutes per sample (Rapid techniques like FSCV can operate at sub-second resolution) [5] | Seconds to minutes per sample (for multi-element analysis) |
| Speciation Capability | Direct speciation (Labile/inert fractions, redox species) [2] | Requires coupling with separation techniques (e.g., HPLC-ICP-MS) |
| Portability & On-Site Use | High (Miniaturizable electrodes, portable potentiostats) [4] [5] | Low (Typically requires laboratory infrastructure) |
| Cost & Operational Complexity | Lower cost, simpler operation [3] [5] | High capital and maintenance cost, complex operation |
| Sample Preparation | Minimal; direct analysis often possible [2] | Often extensive; may require acid digestion |
Table 2: Application-Based Technique Selection
| Research Goal | Recommended Technique | Supporting Experimental Evidence |
|---|---|---|
| Metal Speciation in Natural Waters | Voltammetry (ASV, CLE-AdCSV) | Direct discrimination of labile metal fractions and complexation strength (log K = 12-14 for strong ligands, <10 for weak ligands) [2] |
| Total Trace Metal Content | Spectroscopy (ICP-MS) | High sensitivity for total concentration of multiple elements simultaneously [3] |
| On-Site/In-Situ Monitoring | Voltammetry | Successful field deployment for Pb and Cd in plants; fulfills "6 S's" criteria (Sensitivity, Selectivity, Size, Stability, Safe materials, Speed) [4] [5] |
| Rare Earth Element (REE) Analysis | Adsorptive Stripping Voltammetry (AdSV) | Determination of Ce, Eu, and other lanthanides via their complexes with ligands like alizarin S [3] |
Experimental Protocols: A Look Under the Hood
To illustrate the practical application of these techniques, below are detailed methodologies for key experiments cited in the performance comparison.
Voltammetric Protocol for Trace Metal Speciation
Method: Competitive Ligand Exchange-Adsorptive Cathodic Stripping Voltammetry (CLE-AdCSV) for Iron Speciation in Seawater [2].
- 1. Sample Collection & Preservation: Collect water samples using trace-metal-clean protocols. Filter through a 0.2 μm membrane to separate dissolved metals. Preserve at pH 1.8-2.0 if not analyzed immediately.
- 2. Ligand Addition: Add a well-defined competitive ligand (e.g., salicylaldoxime) to a known volume of the filtered sample. The ligand competes with natural organic ligands for binding to the target metal ions.
- 3. Adsorptive Accumulation: Apply a constant potential to the working electrode (e.g., a hanging mercury drop electrode) for a set time (e.g., 30-60 seconds). During this step, the metal-ligand complex adsorbs onto the electrode surface.
- 4. Potential Scan: Initiate a cathodic potential scan. The adsorbed metal complex is reduced, generating a peak current.
- 5. Titration & Data Modeling: Repeat steps 2-4 after standard additions of the target metal ion. The resulting titration data is fitted to a complexation model to determine the concentration of natural ligands and their conditional stability constants (log K).
Voltammetric Protocol for On-Site Analysis
Method: Differential Pulse Anodic Stripping Voltammetry (DP-ASV) for Lead and Cadmium in Officinal Plants [4].
- 1. On-Site Sample Preparation: Grind the plant leaf sample and leach it with dilute acid (e.g., 0.1 M HNO₃) directly in the field.
- 2. Electrode Modification: Use a portable potentiostat with a glassy carbon electrode (GCE). Form an in-situ mercury film (iMF) on the GCE by adding a mercury salt to the measurement solution.
- 3. Optimized Deposition: Apply a deposition potential of -1.20 V for 195 seconds to reduce and accumulate Pb²⁺ and Cd²⁺ onto the iMF-GCE.
- 4. Stripping Scan: Apply a differential pulse waveform to strip the metals from the electrode. The oxidation of each metal produces a distinct current peak at a characteristic potential.
- 5. Quantification: Use the standard addition method with the portable instrument to quantify concentrations, achieving detection limits of 0.045 μg/L for Pb and 0.63 μg/L for Cd [4].
The Scientist's Toolkit: Essential Research Reagents
The following table details key materials and reagents required for voltammetric trace metal analysis, drawing from the experimental protocols discussed.
Table 3: Key Research Reagent Solutions for Voltammetric Analysis
| Reagent/Material | Function | Application Example |
|---|---|---|
| Glassy Carbon Electrode (GCE) | A common working electrode substrate; provides a stable, renewable surface for analysis. | Determination of Pb and Cd in plant materials [4]. |
| Bismuth Film Electrode | A "green" alternative to mercury electrodes; forms alloys with target metals for stripping analysis. | Portable and disposable sensors for environmental monitoring [5]. |
| Competitive Ligands | Binds to target metals, forming electroactive complexes for highly sensitive adsorptive measurements. | Speciation of Fe, Cu, and Co in natural waters (e.g., using salicylaldoxime, tropolone) [2]. |
| Alizarin S | A complexing agent that forms adsorptive complexes with specific rare earth elements. | Determination of Cerium (Ce) and other lanthanides in environmental samples [3]. |
| Supporting Electrolyte | Carries current and minimizes electromigration of analytes; defines the electrochemical window. | Acetate buffer for Pb/Cd analysis; KCl or KNO₃ for general purpose [4]. |
The battle between voltammetric and spectroscopic techniques is not about declaring an overall winner, but about strategic alignment with research objectives. The experimental data and protocols presented herein lead to a clear conclusion:
Voltammetry is the unequivocal choice for research requiring metal speciation, on-site or in-situ measurements, and for projects with limited budgets without compromising on sensitivity. Its ability to directly probe labile fractions and complexation kinetics provides insights into biogeochemical processes that spectroscopy alone cannot offer.
Spectroscopy, particularly ICP-MS, remains the gold standard for the rapid, ultra-sensitive determination of total multi-element concentrations in a sample, especially within a centralized laboratory setting.
Therefore, the research question itself defines the battlefield. For studies of metal bioavailability, toxicity, and dynamic environmental processes, voltammetry provides the fundamental toolkit to define and win that battle.
In both environmental and pharmacological research, the total concentration of a metal is a poor indicator of its potential biological effect or toxicity. The bioavailability of a metal—its ability to be taken up and interact with living organisms—is predominantly governed by its specific chemical form, or species, rather than its total quantity [2]. For instance, more than 99% of copper in natural waters can be complexed by organic ligands, dramatically reducing its bioavailability and toxicity to phytoplankton and other organisms [2]. This principle is foundational to ecotoxicological models like the Free Ion Activity Model (FIAM) and the Biotic Ligand Model (BLM), which posit that the free hydrated metal ion is often the primary bioavailable species [6] [7].
The ability to distinguish between these different metal species is known as speciation analysis. While spectroscopic techniques like Inductively Coupled Plasma-Mass Spectrometry (ICP-MS) excel at quantifying total metal concentrations with high sensitivity, they are generally incapable of discriminating between different chemical forms without coupling to separation techniques, which can alter the original speciation [2] [3]. In contrast, voltammetric methods are inherently capable of direct metal speciation analysis with minimal sample preparation, making them uniquely suited for assessing metal bioavailability [2] [7]. This article provides a objective comparison of these two analytical approaches, underscoring why voltammetry offers a distinct advantage in speciation studies critical for environmental monitoring and drug development.
Fundamental Principles: How Voltammetry Accesses Speciation Information
Core Voltammetric Techniques for Speciation
Voltammetry is a branch of electroanalytical chemistry that measures current as a function of an applied potential. For trace metal analysis, stripping voltammetry is the most sensitive family of techniques, characterized by a two-stage process: a preconcentration (deposition) step followed by a measurement (stripping) step [2] [3]. The key techniques for speciation analysis include:
- Anodic Stripping Voltammetry (ASV): The metal is electrochemically reduced and preconcentrated as an amalgam at the electrode surface (e.g., a mercury or bismuth film electrode). Subsequently, it is re-oxidized (stripped), producing a current peak used for quantification. The ASV-labile fraction is considered highly relevant for toxicity and bioavailability [2] [7].
- Competitive Ligand Exchange-Adsorptive Cathodic Stripping Voltammetry (CLE-AdCSV): This powerful equilibrium-based method determines complexation parameters. An added ligand competes with natural ligands for the target metal, forming an electroactive complex that adsorbs on the electrode surface. This allows for the indirect determination of the free metal ion concentration and the characterization of natural organic ligands [2] [6].
- Absence of Gradients and Nernstian Equilibrium Stripping (AGNES): This technique provides direct access to the free metal ion concentration by applying a specific potential program that establishes equilibrium between the metal in the electrode and the free metal ion in solution, effectively isolating this critical species [6] [7].
The Speciation Advantage: Labile vs. Inert Fractions
The principal strength of voltammetry lies in its operational nature. The electrochemical response is dependent on the kinetics and thermodynamics of metal complex dissociation. During the deposition step, only metal species that can dissociate rapidly enough to contribute to the diffusion flux to the electrode are measured. This fraction is termed "labile" and includes free metal ions and weak, rapidly dissociating complexes [2]. In contrast, strongly bound or "inert" complexes do not dissociate on the experimental timescale and are not detected [2]. This lability is directly related to bioavailability, as the same kinetic principles govern metal uptake by biological membranes [2] [7]. Consequently, voltammetry provides a functionally relevant measurement that spectroscopic totals cannot.
Direct Comparison: Voltammetry vs. Spectroscopy for Metal Analysis
The following table summarizes the core differences between voltammetric and spectroscopic techniques for trace metal analysis, particularly in the context of speciation and bioavailability.
Table 1: Comparative Analysis: Voltammetry vs. Spectroscopy for Trace Metal Analysis
| Feature | Voltammetric Techniques | Spectroscopic Techniques (ICP-MS, AAS, ICP-OES) |
|---|---|---|
| Primary Output | Free ion concentration, labile fraction, complexation parameters | Total elemental concentration |
| Speciation Capability | Direct, often with minimal sample preparation | Requires coupling to separation techniques (e.g., HPLC-ICP-MS) |
| Information on Bioavailability | High (measures kinetically labile fractions correlated with uptake) | Indirect (requires inference from total concentration) |
| Sensitivity | Excellent (trace to ultra-trace levels) | Excellent to superior (especially ICP-MS) |
| Sample Preparation | Minimal; suitable for direct, on-site analysis | Often extensive (digestion, acidification) |
| Portability & Cost | High portability; relatively low cost and operational expenses | Laboratory-bound; high capital and operational costs |
| Multi-Element Capacity | Limited, typically a few elements simultaneously | Excellent, true multi-element capability |
| Key Applicable Models | FIAM, BLM (provides direct input parameters) | FIAM, BLM (requires assumption or independent measurement of free ion) |
Experimental Protocols & Data: Illustrating the Voltammetric Advantage
Protocol: Determining Bioavailable Copper via CLE-AdCSV
The following workflow is standard for assessing copper speciation in natural waters, such as seawater or freshwater, to evaluate its potential bioavailability and toxicity [2].
Title: CLE-AdCSV Workflow for Copper Speciation
Detailed Procedure:
- Sample Collection and Pretreatment: Collect water samples with minimal perturbation to avoid altering speciation. Filter through a 0.2 or 0.45 μm membrane to obtain the "dissolved" fraction [6].
- Ligand Addition and Equilibration: Spike the sample with a well-characterized competitive ligand (e.g., salicylaldoxime) at a known concentration. The system is allowed to equilibrate (typically for several hours) so that the added ligand competes with natural ligands for binding to copper [2].
- Voltammetric Measurement: The pH is adjusted to an optimal value. An adsorptive accumulation potential is applied to the working electrode (e.g., a hanging mercury drop electrode), causing the Cu-Ladd complex to adsorb to the surface. A cathodic potential sweep is then applied, reducing the metal in the adsorbed complex and generating a stripping current peak [2] [7].
- Titration and Data Analysis: The measurement is repeated after multiple standard additions of copper to the sample. The resulting titration data is modeled using established methods (e.g., Van den Berg/Ružić linearization) to determine the concentration of natural ligands and their conditional stability constants (K). From these parameters, the free Cu²⁺ concentration ([Cu²⁺]) is calculated [2].
Protocol: Direct Free Ion Measurement with AGNES
AGNES is specifically designed to quantify the free metal ion concentration, a key parameter in the FIAM and BLM models [7].
Detailed Procedure:
- Deposition to Equilibrium: A potential (E1) is applied to the working electrode (a mercury-based electrode) that is sufficiently negative to reduce the target metal ion (e.g., Zn²⁺, Cd²⁺, Pb²⁺) and preconcentrate it as an amalgam. The key is that this step is prolonged until Nernstian equilibrium is established between the metal in the amalgam and the free metal ion in solution, with an absence of concentration gradients in the diffusion layer [7].
- Equilibrium Stripping: The preconcentrated metal is stripped back into the solution, typically using a differential pulse voltammetry scan. The measured stripping signal is directly proportional to the free metal ion concentration in the sample [7].
Comparative Experimental Data
The following table compiles illustrative data from voltammetric studies, demonstrating its capability to speciate metals at environmentally and biologically relevant concentrations.
Table 2: Experimental Data from Voltammetric Speciation Studies in Aqueous Media
| Metal | Technique | Matrix | Measured Fraction / Parameter | Reported Value | Key Finding |
|---|---|---|---|---|---|
| Copper (Cu) | CLE-AdCSV | Seawater [2] | Free Cu²⁺ Concentration | Often < 0.01 nM (non-toxic levels) | >99% of dissolved Cu is organically complexed, mitigating toxicity. |
| Iron (Fe) | CLE-AdCSV | Ocean Water (Surface) [2] | Organically Complexed Fe | >99% of total dissolved Fe | Explains "iron limitation" in HNLC* regions despite total Fe. |
| Lead (Pb) | SWASV [8] | Drinking Water | ASV-labile Pb | LOD below WHO/EPA limits | The labile fraction is monitored for direct compliance with health standards. |
| Zinc (Zn), Cadmium (Cd) | AGNES [7] | Freshwater/Synthetic | Free Ion Concentration [Zn²⁺], [Cd²⁺] | Direct quantification possible | Validates models like FIAM and BLM with direct input parameters. |
| Multiple (Cd, Pb, Cu, Zn) | SWASV with Bi-film GCE [9] | Water | ASV-labile Metals | LOD: 0.65-1.07 ppb | Demonstrates portability and multi-metal capability for labile fractions. |
HNLC: High Nutrient-Low Chlorophyll; *LOD: Limit of Detection*
The Scientist's Toolkit: Essential Reagents and Materials
Successful voltammetric speciation requires a set of specific reagents and materials.
Table 3: Key Research Reagent Solutions for Voltammetric Speciation
| Item | Function / Description | Example Use |
|---|---|---|
| Working Electrode | Surface where electrochemical reaction occurs. Defines sensitivity and applicability. | Hg-drop (HMDE) for CLE-AdCSV; Bismuth-film (BiFE) for ASV; Solid Au/CNT-modified electrodes [10] [9]. |
| Competitive Ligand | A known ligand added to compete with natural ligands for the target metal. | Salicylaldoxime (for Fe, Cu); DMG (for Ni); Cupferron (for Ga, V) [2] [10]. |
| Supporting Electrolyte | Provides ionic strength and controls electrical migration; can be a buffer. | Acetate buffer (pH ~4.5); Ammonia buffer; HEPES for biological samples [8]. |
| Standard Metal Solutions | High-purity solutions for standard addition calibration. | Used in titration to determine complexation capacity and free ion concentration [2] [7]. |
| Complexing Agent for AdSV | Forms an adsorbable complex with metals that are not easily reduced. | Alizarin S (for Eu); DTPA or Morin (for other REEs) [3]. |
The choice between voltammetry and spectroscopy is not a matter of which technique is universally "better," but which is more appropriate for the scientific question at hand. For research demanding a simple, accurate, and total elemental concentration, particularly for multiple elements, ICP-MS remains the gold standard. However, when the objective is to understand the environmental impact, bioavailability, or toxicity of trace metals, voltammetry provides irreplaceable speciation data.
Its unique ability to discriminate between labile and inert metal fractions directly, without altering the sample's equilibrium, offers a functional perspective that aligns with biological uptake processes. Coupled with its portability, low cost, and capability for on-site and in-situ measurements, voltammetry establishes itself as an indispensable tool for any researcher or professional seeking to move beyond total concentrations and truly decipher the bioavailable world of trace metals.
The accurate detection of trace-level analytes is a cornerstone of modern analytical chemistry, with profound implications for environmental monitoring, pharmaceutical development, and clinical diagnostics. The selection of an appropriate analytical method hinges on a fundamental understanding of its sensitivity and detection limit—the lowest concentration of an analyte that can be reliably distinguished from the absence of that analyte. Detection limit defines this minimum detectable quantity with acceptable certainty, while sensitivity refers to the ability of a method to discriminate between small differences in analyte concentration. Within this landscape, voltammetry and spectroscopy represent two powerful, yet fundamentally different, approaches for quantitative trace analysis. Voltammetric techniques measure current resulting from the reduction or oxidation of electroactive species at an electrode interface, whereas spectroscopic methods typically quantify the absorption of light by analyte molecules.
The core thesis of this guide posits that while spectroscopic methods offer robust, general-purpose analysis for a wide range of compounds, advanced voltammetric techniques, particularly those employing specialized electrode configurations and signal-enhancement strategies, can achieve unparalleled sensitivity for specific electroactive analytes, often surpassing optical methods in detection power for trace metal and organic compound analysis. This article provides a systematic comparison of the sensitivity and detection limits of these techniques, supported by experimental data and detailed protocols, to guide researchers in selecting the optimal method for their specific trace analysis challenges.
Voltammetric Techniques: Principles and Performance Data
Fundamentals of Voltammetry for Trace Detection
Voltammetry encompasses a family of electroanalytical techniques that measure current as a function of applied potential. The exceptional sensitivity of certain voltammetric methods for trace analysis stems from their ability to incorporate a pre-concentration step, where the analyte is accumulated onto or into the working electrode before the actual measurement. This principle is most effectively employed in stripping voltammetry, which operates in two distinct stages: first, an electroactive species is deposited onto the electrode surface at a constant potential; second, the concentrated species is "stripped" back into solution using a potential sweep, generating a highly sensitive current response [11]. The signal is directly proportional to the analyte's concentration, while the applied potential at which stripping occurs provides qualitative identification.
The design and material of the working electrode are critical for optimizing voltammetric sensitivity. Common electrodes include the glassy carbon electrode (GCE), mercury-based electrodes (e.g., HMDE, Hg(Ag)FE) renowned for their high hydrogen overvoltage and renewable surface, and advanced modified electrodes where the surface is coated with a chemical film or nanomaterial to enhance selectivity and signal amplification [12] [11]. The recent development of ultramicroelectrode arrays (UMEAs) has further pushed the boundaries of sensitivity. These arrays consist of thousands of microscopic electrodes operating in parallel, which significantly amplify the faradaic current while minimizing detrimental effects like capacitive charging currents and solution resistance, enabling detection in low-electrolyte environments and achieving very low detection limits [13] [14].
Quantitative Detection Limits in Voltammetry
The following table summarizes the typical detection limits achievable with various voltammetric techniques for a selection of analytes, underscoring the method's capability for ultra-trace determination.
Table 1: Detection Limits of Voltammetric Techniques for Various Analytes
| Analyte | Voltammetric Technique | Working Electrode | Detection Limit | Linear Range | Reference |
|---|---|---|---|---|---|
| BDE-47 (Flame Retardant) | Cyclic Voltammetry (CV) | Sludge Biochar-modified GCE | 5 ng L⁻¹ (≈ 1 x 10⁻¹¹ M) | 0.005 - 0.6 μg L⁻¹ | [12] |
| Ga(III) (Gallium) | Adsorptive Stripping Voltammetry (AdSV) | PbFE/MWCNT/SGCE | 9.5 x 10⁻¹⁰ M | 3.0 x 10⁻⁹ – 4.0 x 10⁻⁷ M | [11] |
| Ga(III) (Gallium) | Anodic Stripping Voltammetry (ASV) | HMDE | 5.7 x 10⁻¹¹ M | Not Specified | [11] |
| Ga(III) (Gallium) | Adsorptive Stripping Voltammetry (AdSV) | Hg(Ag)FE | 3.6 x 10⁻¹⁰ M | 1.25 x 10⁻⁹ – 9.0 x 10⁻⁸ M | [11] |
| Heavy Metals (e.g., Cd, Pb) | Anodic Stripping Voltammetry (ASV) | Ultramicroelectrode Arrays (UMEAs) | ppt to ppb range | Not Specified | [14] |
The data reveals that stripping voltammetry consistently achieves detection limits in the nanomolar to picomolar range (10⁻⁹ to 10⁻¹¹ M), making it one of the most sensitive analytical techniques available. The use of modified electrodes, such as the sludge biochar-modified GCE, demonstrates how material science can be leveraged to create highly adsorptive and conductive surfaces, further pushing detection limits for persistent organic pollutants like BDE-47 into the ng/L range [12].
Experimental Protocol: Adsorptive Stripping Voltammetry for Gallium
The following detailed methodology, adapted from procedures for determining trace gallium, exemplifies the careful optimization required for a highly sensitive voltammetric analysis [11].
- Electrode and Apparatus Preparation: Utilize a three-electrode system. The working electrode is a mercury-based film electrode (Hg(Ag)FE). A Pt wire serves as the counter electrode, and an Ag/AgCl (3 M KCl) electrode is the reference. All potentials are reported versus this reference. Polish the electrode surface (if solid) to a mirror finish with alumina slurry (0.05 μm) before each experiment.
- Reagent and Solution Preparation: Prepare a 0.1 M acetate buffer supporting electrolyte at pH 4.8. The complexing agent is a 0.01 M catechol solution. Prepare a 1000 mg L⁻¹ Ga(III) stock standard solution from high-purity gallium salt. Dilute this stock daily to prepare working standards. Use ultra-pure water (18.2 MΩ·cm) for all solutions.
- Pre-concentration/Accumulation Step: Transfer 10 mL of the supporting electrolyte and the Ga(III) standard/sample into the voltammetric cell. Deoxygenate the solution by purging with high-purity nitrogen gas for 600 seconds. While stirring the solution, deposit the analyte onto the electrode at a potential of -0.5 V for 60 seconds. During this step, Ga(III) forms a complex with catechol that adsorbs onto the electrode surface.
- Stripping and Measurement: After the accumulation period, stop the stirring and allow the solution to become quiescent for 10 seconds. Initiate the potential sweep from -0.5 V to -1.2 V using a square-wave waveform. The reduction current of the adsorbed gallium-catechol complex is measured, producing a peak-shaped voltammogram.
- Calibration and Quantification: Record the stripping voltammograms for a series of standard Ga(III) solutions. Plot the peak current height as a function of the Ga(III) concentration to construct a calibration curve. The concentration of Ga(III) in an unknown sample is determined by interpolating its peak current onto this calibration curve.
Spectroscopic Techniques: Principles and Performance Data
Fundamentals of Spectroscopy for Trace Detection
Spectroscopic techniques for trace analysis are primarily based on the Beer-Lambert Law, which states that the absorbance of light by a solution is directly proportional to the concentration of the absorbing species and the path length of the light through the solution. In a typical UV-Vis spectrophotometer, light from a deuterium or tungsten lamp is passed through a monochromator to select a specific wavelength, which then travels through the sample cell (cuvette), and the transmitted intensity is measured by a photodetector [15]. The resulting absorbance spectrum provides both quantitative (concentration) and qualitative (identity via λ_max) information about the analyte.
For elemental analysis, Inductively Coupled Plasma techniques coupled with optical emission spectrometry (ICP-OES) or mass spectrometry (ICP-MS) represent the gold standard. These methods involve atomizing and ionizing the sample in a high-temperature plasma. ICP-OES measures the characteristic light emitted by excited atoms, while ICP-MS separates and counts the ions based on their mass-to-charge ratio, offering exceptional sensitivity [16]. The versatility of spectroscopic methods allows them to detect a wide range of analytes, from nutrients and metal ions in water to organic pharmaceuticals.
Quantitative Detection Limits in Spectroscopy
The table below compares the detection capabilities of common spectroscopic methods, illustrating their broad applicability and the superior sensitivity of mass spectrometry-based approaches.
Table 2: Detection Limits of Spectroscopic Techniques for Various Applications
| Technique | Detectable Elements/Analytes | Typical Sensitivity/DL Range | Key Applications |
|---|---|---|---|
| ICP-MS | Li to U (Most elements) | ppm to ppt (μg/L to ng/L) | Ultra-trace metal analysis, environmental monitoring, clinical diagnostics [16] |
| ICP-OES | Li to U (Most elements) | ppm (μg/L) | Major and trace element analysis in water, soils, and materials [16] [11] |
| Graphite Furnace AAS (GFAAS) | Mainly metallic elements (up to 70) | ppm (μg/L) | Trace metal analysis in biological and environmental samples [16] [11] |
| UV-Vis Spectrophotometry | Chromophoric compounds (Nitrate, Fe, Cu, organics) | Generally low ppm (mg/L) | Water quality parameters (nitrate, phosphate), pharmaceutical analysis [17] [15] |
| CHNOS Analyzer | C, H, N, O, S | 0.05–0.1 wt% (Not for traces) | Bulk organic composition analysis [16] |
While UV-Vis spectrophotometry is a workhorse for routine analysis due to its simplicity and cost-effectiveness, its detection limits are typically in the milligram-per-liter (ppm) range, making it less sensitive than advanced voltammetric methods for trace analysis [17]. In contrast, ICP-MS stands out as the most sensitive spectroscopic technique, capable of detecting elements at concentrations as low as parts-per-trillion (ppt or ng/L), rivaling and often exceeding the sensitivity of stripping voltammetry for metal ions [16].
Critical Comparison and Application Scenarios
Side-by-Side Technique Comparison
The choice between voltammetry and spectroscopy is multifaceted, depending on the required detection limit, analytical scope, and operational constraints.
Table 3: Direct Comparison of Voltammetry and Spectroscopy for Trace Analysis
| Characteristic | Voltammetry (e.g., Stripping Methods) | Spectroscopy (e.g., ICP-MS, UV-Vis) |
|---|---|---|
| Typical Detection Limit | ppb to ppt (for electroactive species) [12] [11] [14] | ppt (ICP-MS) to ppm (UV-Vis) [16] [17] |
| Analyte Scope | Electroactive species (metals, specific organics). Limited to what can be oxidized/reduced. | Very broad (most elements via ICP; chromophores via UV-Vis). |
| Selectivity | High (from applied potential and electrode modification). | Moderate to High (from wavelength or mass). |
| Sample Volume | Small (mL or less) [11] | Varies (mL for UV-Vis; low mL for ICP). |
| Cost & Operational Complexity | Low to Moderate (relatively inexpensive equipment). | High for ICP-MS (expensive instrumentation and operation). |
| Portability | High (suitable for field-deployable sensors) [14] | Low (generally laboratory-bound instruments). |
| Sample Throughput | Moderate (can have longer analysis times due to pre-concentration). | High (rapid analysis, especially for ICP-MS). |
| Multi-element Capability | Limited (typically sequential) | Excellent (simultaneous multi-element detection). |
The experimental workflow for each technique highlights their different approaches to achieving sensitivity, from electrochemical pre-concentration to plasma-based atomization.
Selection Guide for Analytical Scenarios
The following decision logic can help researchers navigate the technique selection process based on their specific analytical problem.
Essential Research Reagent Solutions
The successful implementation of sensitive analytical methods relies on a suite of specialized reagents and materials. The following table details key components for voltammetric and spectroscopic analyses.
Table 4: Key Research Reagent Solutions for Trace Analysis
| Reagent/Material | Function | Application Context |
|---|---|---|
| Supporting Electrolyte (e.g., Acetate Buffer, KCl) | Carries current, minimizes resistance (iR drop), and controls pH in the electrochemical cell. | Essential for all voltammetric experiments to ensure well-defined mass transport and a stable potential field [12] [11]. |
| Complexing Agents (e.g., Catechol, Cupferron) | Forms an adsorbable complex with the target metal ion, enabling its pre-concentration in AdSV. | Crucial for enhancing the sensitivity and selectivity of stripping voltammetry for metals like Ga(III) [11]. |
| Electrode Modifiers (e.g., Sludge Biochar, MWCNTs) | Increases effective surface area, provides adsorption sites, and enhances electron transfer kinetics. | Used to fabricate modified electrodes for lower detection limits and improved analyte selectivity [12] [11]. |
| High-Purity Standards | Used for instrument calibration to ensure quantitative accuracy. | Critical for all quantitative analytical techniques, including voltammetry and spectroscopy. |
| Deoxygenation Agent (High-Purity N₂ or Ar) | Removes dissolved oxygen from solutions to prevent interfering redox reactions. | A mandatory step in most voltammetric analyses of reducible species to avoid overlapping oxygen reduction waves [12]. |
| Digestion Acids (e.g., HNO₃, HCl) | Dissolves and decomposes solid samples into a liquid form for analysis. | Essential for sample preparation in elemental analysis via ICP-MS/OES or AAS [16]. |
This comparative analysis demonstrates that both voltammetry and spectroscopy offer powerful pathways for trace analysis, yet they possess distinct performance profiles. Stripping voltammetry emerges as a uniquely sensitive technique for electroactive analytes, achieving detection limits in the ppt range, often with lower cost and higher portability than its spectroscopic counterparts. Its strength lies in targeted, ultra-trace analysis of specific metals or organic pollutants, especially in scenarios requiring field deployment. In contrast, spectroscopic methods, particularly ICP-MS, provide unrivalled breadth of analyte coverage and multi-element capability down to similar ultra-trace levels, establishing it as the benchmark for comprehensive elemental analysis in centralized laboratories.
The choice between these techniques is not a matter of superiority but of strategic alignment with the analytical problem at hand. Researchers must weigh factors such as the required detection limit, the nature and number of target analytes, available budget, and the need for portability. The ongoing development of novel electrode materials and the miniaturization of spectroscopic instruments will continue to push the boundaries of sensitivity and accessibility, further empowering scientists in drug development, environmental monitoring, and beyond to solve increasingly complex analytical challenges.
The Role of Electrode Materials and Supporting Electrolytes in Voltammetry
Voltammetry is a powerful electrochemical technique widely employed for the quantitative determination and speciation analysis of trace elements and organic molecules. Its application spans environmental monitoring, pharmaceutical development, and energy storage research. The performance of voltammetric methods is critically dependent on two fundamental components: the electrode material, which serves as the platform for electron transfer reactions, and the supporting electrolyte, which governs ionic conductivity and interfacial processes. Within the broader context of analytical research, voltammetry offers distinct advantages over spectroscopic techniques for trace analysis, including minimal sample preparation, capability for direct speciation analysis, and portability for in-situ measurements. This guide provides a comparative analysis of electrode and electrolyte selection, supported by experimental data and protocols, to optimize voltammetric systems for trace-level determination.
Comparative Analysis of Electrode Materials
The choice of electrode material significantly influences voltammetric parameters such as sensitivity, selectivity, potential window, and reproducibility. Different materials interact uniquely with analytes, leading to variations in electron transfer kinetics and surface reactivity.
Performance Metrics of Common Electrode Materials
Table 1: Comparative performance of electrode materials in voltammetric analysis
| Electrode Material | Typical Applications | Advantages | Limitations | Electrochemical Stability Window | Sensitivity Enhancement Strategies |
|---|---|---|---|---|---|
| Glassy Carbon (GCE) | General purpose, dissolved organic molecules, metal ions [18] | Wide potential window, good mechanical stability, low background current | Surface fouling in complex matrices, requires periodic polishing | Moderate to wide (solvent-dependent) | Chemical modification with nanomaterials, polymers [18] |
| Sludge Biochar-Modified GCE | Trace organic pollutants (e.g., BDE-47) in water [12] | High surface area, abundant functional groups, cost-effective from waste | Batch-to-batch variability, complex characterization | Similar to base GCE | Pyrolysis optimization (600°C for pore development) [12] |
| Transition Metal Oxides/Sulfides | Energy storage (supercapacitors), electrocatalysis [19] | High pseudocapacitance, reversible redox activity, tunable morphology | Limited electronic conductivity, synthesis complexity | Varies with composition | Nanostructuring, hybrid composites with carbon materials [19] |
| Bare Metal Electrodes | Fundamental studies, electroplating [18] | Excellent conductivity, well-defined surfaces | Narrow potential window, surface oxidation issues | Narrow in aqueous solutions | Not applicable for bare operation |
Impact of Electrode Material on Voltammetric Response
The fundamental role of electrode materials is exemplified in comparative studies. Research has demonstrated that bare electrodes may produce no detectable redox curves due to poor conductivity or fouling issues, while glassy carbon electrodes (GCE) produce well-defined redox peaks owing to their favorable electron transfer properties and chemical stability [18]. The performance of GCEs can be substantially enhanced through surface modification with various materials. For instance, modifying GCEs with sludge biochar creates an interface with increased surface area and additional adsorption sites, significantly improving sensitivity for detecting persistent organic pollutants like 2,2',4,4'-tetrabromodiphenyl ether (BDE-47) at trace concentrations (detection limit of 5 ng L⁻¹) [12].
The modification protocol involves precise thermal treatment, where pyrolysis at 600°C in an oxygen-free environment optimizes the biochar's pore structure and functional groups, thereby enhancing analyte enrichment and electron transfer kinetics [12]. This approach demonstrates the principle of tailoring electrode surfaces to specific analytical challenges.
Comparative Analysis of Supporting Electrolytes
Supporting electrolytes facilitate charge transport while influencing electrochemical processes through ionic strength effects, ion-pair formation, and specific interactions with analytes.
Performance Characteristics of Supporting Electrolytes
Table 2: Properties and performance of supporting electrolytes in different solvents
| Supporting Electrolyte | Solvent Compatibility | Conductivity Performance | Key Influencing Parameters | Typical Applications | Stability Considerations |
|---|---|---|---|---|---|
| Tetraalkylammonium Salts (e.g., Bu₄NBF₄, Et₄NBF₄) | Aprotic polar solvents (DMF, DLG, ACN) [20] | Λ° order: MeEt₃N⁺ > Et₄N⁺ > Bu₄N⁺; Lower in high viscosity solvents [20] | Viscosity, ion association constants, Walden product | Organic electro-synthesis, non-aqueous electrochemistry [20] | Electrochemical stability, minimal interference with analytes |
| Inorganic Salts (e.g., Na₂SO₄, KCl) | Aqueous solutions [21] | High in aqueous media, concentration-dependent | pH, buffering capacity, ionic strength | Environmental analysis, metal speciation [2] [21] | pH changes at electrodes may require buffering [21] |
| Acid/Base Electrolytes (e.g., H₂SO₄, phosphate buffers) | Aqueous solutions [22] | High conductivity, pH control | pH, buffer capacity, current density | Controlled potential studies, pH-dependent reactions [22] | Buffering prevents extreme pH shifts at electrodes [22] |
| Ionic Liquids & Deep Eutectic Solvents | Various, including non-aqueous [23] | Moderate to high, enhances solubility | Viscosity, ion size, operating temperature | Redox flow batteries, specialty applications [23] | High thermal stability, tunable properties |
Electrolyte Effects on Fundamental Parameters
The conductivity behavior of supporting electrolytes follows predictable trends based on ionic properties. In the bio-renewable solvent dihydrolevoglucosenone (DLG), molar conductivities (Λ°) of tetraalkylammonium salts decrease with increasing cation size: MeEt₃NBF₄ (9.20 S cm² mol⁻¹) > Et₄NBF₄ (8.88 S cm² mol⁻¹) > Bu₄NBF₄ (7.36 S cm² mol⁻¹) [20]. This trend reflects stronger ion-solvent interactions with smaller cations. The Walden product (Λ°η), which accounts for solvent viscosity effects, follows the same order, confirming the advantage of smaller cations for conductivity in viscous media [20].
The buffering capacity of supporting electrolytes significantly influences local pH conditions at electrode surfaces. Recent investigations demonstrate that electrolytes with buffering characteristics substantially slow the propagation of pH fronts from electrodes compared to unbuffered systems [22] [21]. This effect is crucial in applications where reaction kinetics and product distributions are pH-dependent, such as in aqueous CO₂ electrolysis or metal speciation studies [2] [21].
Experimental Protocols for System Optimization
Electrode Modification and Characterization Protocol
Sludge Biochar-Modified GCE for Trace BDE-47 Detection [12]:
- Biochar Preparation: Pyrolyze municipal sludge at 600°C in an oxygen-free tubular furnace for 2 hours to develop optimal pore structure.
- Electrode Modification: Prepare a homogeneous suspension of sludge biochar in ethanol (1 mg mL⁻¹). Deposit 5 μL of this suspension onto a polished GCE surface and allow to dry under ambient conditions.
- Electrochemical Measurement: Employ a standard three-electrode system with the modified GCE as working electrode, Pt wire counter electrode, and Ag/AgCl reference electrode in 0.1 M phosphate buffer (pH 7.0).
- Optimization: Determine optimal parameters: scan rate (20-100 mV s⁻¹), accumulation time (30-120 s), and pH (6-8) using cyclic voltammetry or differential pulse voltammetry.
- Calibration: Construct calibration curve from 0.005 μg L⁻¹ to 0.6 μg L⁻¹ BDE-47, achieving detection limit of 5 ng L⁻¹.
Electrolyte Selection and Evaluation Protocol
Characterization of Supporting Electrolytes in Green Solvents [20]:
- Solvent Purification: Purify the solvent (e.g., DLG) through appropriate methods to remove impurities and water.
- Solution Preparation: Prepare electrolyte solutions at varying concentrations (0.01-0.1 M) in the target solvent.
- Conductivity Measurements: Measure specific conductance using a conductivity meter with temperature control (20-40°C).
- Viscosity Determination: Obtain kinematic viscosity using an Ubbelohde viscometer at controlled temperatures.
- Data Analysis: Calculate molar conductivity and fit using the Lee and Wheaton equation in the Pethybridge and Taba form (LWPT model) to determine limiting molar conductance (Λ°) and association constants (Kₐ).
- Electrochemical Window: Determine the electrochemical potential window by cyclic voltammetry in a three-electrode cell.
Voltammetry Versus Spectroscopy for Trace Analysis
The selection between voltammetric and spectroscopic techniques involves strategic considerations based on analytical requirements:
Table 3: Comparison of voltammetry and spectroscopy for trace analysis
| Parameter | Voltammetry | Spectroscopy (ICP-MS, HPLC) |
|---|---|---|
| Speciation Capability | Direct speciation (labile/inert fractions, redox states) without separation [2] | Requires hyphenated techniques (e.g., LC-ICP-MS) for speciation |
| Detection Limits | Sub-nanomolar for many metals and organics (e.g., 5 ng L⁻¹ for BDE-47) [12] | Similar or better for total concentrations (ppt-ppb) |
| Sample Preparation | Minimal, often direct analysis [2] | Often extensive preparation (digestion, derivatization) |
| Portability | Excellent for field deployment [12] | Generally laboratory-based |
| Analysis Time | Rapid (minutes) [12] | Variable (minutes to hours) |
| Cost | Lower instrumentation costs [12] | High capital and maintenance costs |
| Matrix Effects | Susceptible to fouling, but addressable with modifiers [12] [18] | Complex matrices may require extensive cleanup |
Voltammetry excels in speciation analysis, distinguishing between different metal forms (free ions, labile complexes, inert complexes) without physical separation techniques [2]. For example, anodic stripping voltammetry (ASV) can determine the ASV-labile fraction of metals, which is most relevant to bioavailability and toxicity assessments in environmental samples [2]. This capability for direct speciation represents a significant advantage over spectroscopic methods that typically provide only total element concentrations.
The Scientist's Toolkit: Essential Research Reagents
Table 4: Key reagents and materials for voltammetric analysis
| Reagent/Material | Function | Application Examples |
|---|---|---|
| Glassy Carbon Electrodes | Working electrode platform with wide potential window | General voltammetry, modifier substrate [12] [18] |
| Tetrabutylammonium Hexafluorophosphate (Bu₄NPF₆) | Supporting electrolyte for non-aqueous systems | Organic electrosynthesis, wide potential window studies [20] |
| Sludge Biochar | Electrode modifier for enhanced sensitivity | Trace pollutant detection, waste-derived material [12] |
| Phosphate Buffers | pH control and buffering capacity in aqueous systems | pH-dependent studies, biological molecules [12] |
| Transition Metal Oxides (e.g., MnO₂, RuO₂) | Pseudocapacitive materials, electrocatalysts | Energy storage studies, sensor development [19] |
| Ionic Liquids | Advanced electrolytes with tunable properties | Non-aqueous systems, thermal stability requirements [23] |
| pH Indicators (e.g., thymol blue) | Visualization and quantification of pH gradients | Monitoring local pH changes in electrochemical cells [21] |
Conceptual Framework and Workflows
Diagram 1: Decision framework for analytical method selection between voltammetry and spectroscopy, highlighting optimization pathways for electrode and electrolyte components in voltammetry.
Diagram 2: Interrelationship between electrode materials and supporting electrolytes in determining key voltammetric performance parameters, highlighting the multifaceted nature of system optimization.
The synergistic relationship between electrode materials and supporting electrolytes forms the foundation of effective voltammetric analysis. Electrode selection dictates electron transfer kinetics and surface interactions, while supporting electrolytes control mass transport and interfacial conditions. The comparative data presented demonstrates that modified electrodes like sludge biochar-GCE significantly enhance sensitivity for trace organic analysis, while proper electrolyte selection based on conductivity parameters and buffering capacity ensures reproducible results. Within trace analysis research, voltammetry provides distinct advantages for speciation studies and field applications where minimal sample preparation and direct chemical form discrimination are prioritized over total concentration measurements provided by spectroscopic techniques. The optimization protocols and comparative data presented serve as a guide for researchers designing voltammetric methods tailored to specific analytical challenges in pharmaceutical, environmental, and materials development applications.
Trace analysis, the measurement of components at low concentrations such as parts-per-billion or parts-per-trillion, is fundamental to environmental monitoring, pharmaceutical development, and material sciences [24] [25]. The accuracy of such analyses is critically dependent on the selection of appropriate instrumental techniques, with voltammetry and spectroscopy representing two principal approaches. This guide provides a objective comparison of these methodologies, focusing on their operational parameters, performance characteristics, and practical implementation for researchers and drug development professionals. The requirement for high-quality data in these fields demands a thorough understanding of each technique's capabilities, from sensitivity and selectivity to cost-effectiveness and ease of use [25]. This overview synthesizes experimental data and procedural details to inform strategic instrument selection within a structured analytical framework.
Technical Comparison: Voltammetry versus Spectroscopy
The choice between voltammetric and spectroscopic techniques involves trade-offs between sensitivity, selectivity, operational complexity, and cost. The following table summarizes the core characteristics of each approach for trace metal analysis, drawing from applications in environmental and pharmaceutical contexts [2] [3] [25].
Table 1: Comparative overview of voltammetry and spectroscopy for trace analysis.
| Feature | Voltammetry | Spectroscopy (ICP-MS cited as example) |
|---|---|---|
| Primary Analytical Figures of Merit | ||
| Typical Detection Limits | Part-per-trillion (ppt) to part-per-billion (ppb) level [3] | Part-per-trillion (ppt) and sub-ppt level [3] |
| Selectivity | Achieved via applied potential and chemical speciation (e.g., ASV-labile fraction) [2] | High elemental selectivity and multi-element capability [2] |
| Analyte Scope | Metals (Cu, Pb, Cd, Zn, REEs); speciation of redox states, labile/inert fractions [2] [3] | Wide range of metals; total element concentration only [2] |
| Operational & Practical Considerations | ||
| Sample Throughput | Moderate; can be high with automated systems [26] | High |
| Sample Volume | Can be very small (mL scale) | Typically requires larger volumes (though micro-systems exist) |
| Sample Preparation | Minimal for direct analysis; may require pH adjustment or ligand addition [2] | Often extensive; typically requires acid digestion [2] |
| Cost of Instrumentation | Relatively low cost [3] | High capital and operational cost [3] |
| Key Strengths | Speciation analysis, low operational cost, potential for in-situ analysis [2] | Ultra-low detection limits, wide dynamic range, high throughput [3] |
| Key Limitations | Limited to electroactive species; matrix effects can be significant | Provides total content only, not speciation; complex and costly maintenance [2] [3] |
Voltammetric techniques, particularly stripping methods like Anodic Stripping Voltammetry (ASV) and Adsorptive Stripping Voltammetry (AdSV), are highly sensitive due to a built-in preconcentration step [2] [3]. Their defining advantage is the ability to perform speciation analysis, discriminating between different chemical forms of an element (e.g., free ions, organic complexes, redox states) that dictate bioavailability and toxicity [2]. This is crucial in fields like environmental science and pharmacology where chemical form is as important as total concentration.
Spectroscopic techniques, such as Inductively Coupled Plasma Mass Spectrometry (ICP-MS), offer superior multi-element capabilities and extremely low detection limits [3]. However, they generally require sample digestion and provide information only on total element content, losing all speciation data [2]. The operational costs and instrumental complexity of techniques like ICP-MS are also significantly higher than those of most voltammetric systems [3].
Experimental Protocols for Trace Analysis
Voltammetric Protocol for Trace Metal Speciation
The following protocol outlines a generalized procedure for determining trace metal concentrations and their speciation in natural water samples using Adsorptive Cathodic Stripping Voltammetry (AdCSV), based on methodologies for metals like iron and copper [2].
- 1. Sample Collection and Pre-treatment: Collect water samples using trace-metal clean protocols. Filter through a 0.45 μm or 0.2 μm membrane to separate dissolved from particulate fractions [2]. Adjust the sample pH to an optimal value for complex formation using ultra-pure buffers (e.g., ammonium acetate, borate) [2] [25].
- 2. Complexation and Ligand Exchange: Add a specific complexing agent (ligand) to the sample. Common ligands include dimethylglyoxime for nickel and cobalt, or catechol for iron [2] [3]. In Competing Ligand Exchange (CLE) methods, a known concentration of a competing ligand is added to determine the metal's complexation strength with natural organic ligands in the sample [2].
- 3. Preconcentration (Adsorption) Step: Transfer the sample to an electrochemical cell. At the working electrode (e.g., a hanging mercury drop electrode), apply a constant potential that causes the neutral metal-ligand complex to adsorb onto the electrode surface for a defined time (e.g., 30-120 seconds) with stirring. This step accumulates the analyte, enhancing sensitivity [2] [3].
- 4. Voltammetric Scan (Stripping): After a brief equilibration period without stirring, initiate a cathodic potential sweep. This scan reduces the adsorbed metal complex, generating a measurable current peak. The peak current is proportional to the metal concentration in the sample, and the peak potential is characteristic of the metal and ligand used [2].
- 5. Data Analysis and Quantification: Quantify the analyte using the standard addition method to compensate for matrix effects. Add known increments of a standard metal solution to the sample and repeat the measurement. Plot the peak current versus the standard concentration; the absolute value of the x-intercept gives the original sample concentration [2].
Spectroscopic Protocol for Total Trace Metal Analysis
This protocol describes a standard procedure for determining total metal content using ICP-MS, a benchmark spectroscopic technique for ultra-trace analysis [3] [25].
- 1. Sample Digestion: For solid samples (e.g., soil, tissue, pharmaceuticals), perform acid digestion. Weigh a representative, homogenized sample into a digestion vessel. Add a mixture of high-purity acids (e.g., nitric acid, hydrochloric acid) and heat using a hot block, microwave, or open-vessel system until the sample is fully dissolved and a clear digestate is obtained [25].
- 2. Dilution and Internal Standardization: Dilute the cooled digestate to a known volume with high-resistivity (18.2 MΩ·cm) water. Add a known amount of an internal standard (e.g., Indium, Rhodium, or Bismuth) to all samples, calibration standards, and blanks. The internal standard corrects for instrumental drift and matrix suppression/enhancement effects during analysis [25].
- 3. Instrument Calibration: Prepare a series of multi-element calibration standards in the same acid matrix as the samples. A blank and at least three standard solutions of increasing concentration are typically used to establish a calibration curve [25].
- 4. Sample Analysis and Data Acquisition: Introduce the samples and standards into the ICP-MS via a peristaltic pump and nebulizer. The sample is converted into an aerosol, injected into the argon plasma (~6000-10000 K), where it is desolvated, vaporized, atomized, and ionized. The resulting ions are separated by a mass spectrometer and detected. The signal intensity for each isotope is measured [3].
- 5. Data Processing and QC: The instrument software calculates analyte concentrations based on the calibration curve and the internal standard response. A rigorous program of quality control samples, including continuing calibration verification standards and blanks, must be interspersed throughout the analytical run to ensure data validity [25].
Workflow and Logical Relationships
The decision-making process for selecting an analytical technique and the subsequent workflow for trace analysis can be visualized through the following logical pathways.
Technique Selection Logic
This diagram outlines the key decision nodes for choosing between voltammetry and spectroscopy based on analytical goals and practical constraints.
Diagram 1: A decision pathway for selecting between voltammetry and spectroscopy based on analytical requirements.
Generalized Trace Analysis Workflow
This workflow illustrates the common and technique-specific steps involved in a rigorous trace analysis, from sampling to data reporting.
Diagram 2: A comparative workflow for voltammetric and spectroscopic trace analysis, highlighting shared and distinct procedural steps.
Essential Research Reagent Solutions
The following table details key reagents and materials essential for conducting the voltammetric and spectroscopic experiments described in this guide.
Table 2: Key research reagents and materials for voltammetric and spectroscopic trace analysis.
| Item Name | Function/Application | Technical Notes |
|---|---|---|
| Complexing Agents (for AdSV) | Forms electroactive complexes with target metals for adsorptive accumulation. | Dimethylglyoxime (for Ni, Co), Catechol (for Fe), 8-Hydroxyquinoline (for various REEs). Choice dictates selectivity and sensitivity [2] [3]. |
| Supporting Electrolyte | Conducts current and controls ionic strength/pH, defining the electrochemical window. | High-purity salts (e.g., acetate, borate, ammonia buffers). Must be free of electroactive impurities [2]. |
| Working Electrodes | Surface where the electrochemical reaction occurs. | Hanging Mercury Drop Electrode (HMDE) for adsorptive techniques; Mercury Film and Bismuth/Carbon electrodes for ASV [2] [3]. |
| Ultra-Pure Acids & Reagents | Sample digestion and cleaning for both techniques. | Trace metal grade nitric and hydrochloric acids. Essential for maintaining low blanks in both voltammetry and ICP-MS [25]. |
| Internal Standards (for ICP-MS) | Corrects for instrument drift and matrix effects. | Elements not present in samples (e.g., Indium (In), Rhodium (Rh), Bismuth (Bi)), added to all samples and standards [25]. |
| Certified Reference Materials (CRMs) | Validates analytical accuracy and method performance. | Samples with certified concentrations of target analytes in a matching matrix (e.g., river water, soil). Critical for quality assurance [25]. |
| Solid-Phase Extraction (SPE) Cartridges | Selective isolation and pre-concentration of analytes from complex matrices. | Used in sample prep for both techniques to remove interferents and concentrate analytes, improving sensitivity and selectivity [25]. |
Techniques in Action: Voltammetric and Spectroscopic Applications in Real-World Analysis
The accurate determination of trace metal concentrations is a cornerstone of environmental monitoring, industrial quality control, and biomedical research. For decades, analytical techniques have been broadly divided into two camps: electrochemical methods, such as voltammetry, and spectroscopic methods, including Atomic Absorption Spectroscopy (AAS) and Inductively Coupled Plasma Mass Spectrometry (ICP-MS). Within this landscape, stripping voltammetry stands out for its exceptional sensitivity and unique capabilities in metal speciation analysis [27].
Stripping voltammetry techniques are electrochemical methods renowned for their extremely low detection limits, capable of measuring metal concentrations in the 10^{-9} to 10^{-12} M range [27]. This sensitivity often surpasses many conventional spectroscopic techniques for certain applications, while offering the additional benefits of portability, lower operational costs, and the ability to perform in-situ measurements [27] [11]. This guide provides a comparative analysis of the three primary stripping voltammetry techniques—Anodic Stripping Voltammetry (ASV), Adsorptive Cathodic Stripping Voltammetry (AdSV), and Cathodic Stripping Voltammetry (CSV)—contrasting their performance with spectroscopic methods and detailing the experimental protocols that underpin their application in trace metal analysis.
Stripping voltammetry operates in two fundamental stages: a preconcentration step where metal species are accumulated onto the working electrode, and a stripping step where they are removed, generating a measurable current proportional to their concentration [27] [28]. The specific mechanisms of these steps differentiate ASV, AdSV, and CSV.
Core Principles and Workflows
The following diagram illustrates the foundational workflow and key differentiators of each stripping voltammetry technique.
Comparative Performance Data
The table below summarizes key performance metrics and application data for the three stripping voltammetry techniques, providing a direct comparison of their capabilities.
Table 1: Comparative Summary of Stripping Voltammetry Techniques for Trace Metal Analysis
| Feature | Anodic Stripping Voltammetry (ASV) | Adsorptive Cathodic Stripping Voltammetry (AdSV) | Cathodic Stripping Voltammetry (CSV) |
|---|---|---|---|
| Primary Mechanism | Electrolytic reduction to metal, then anodic oxidation [27] [28] | Adsorption of metal-ligand complex, then cathodic reduction [27] | Formation of insoluble salt, then cathodic reduction [28] |
| Target Analytes | Cu, Cd, Pb, Zn, In, Tl [27] | Over 20 trace metals including Ga, Ni, Co, Fe, U [27] [11] | Anions & metals forming insoluble salts (e.g., halides, S²⁻) [28] |
| Typical Detection Limit | (10^{-9}) - (10^{-10}) M [27] [28] | (10^{-10}) - (10^{-12}) M [27] | Comparable to AdSV [28] |
| Example: Ga(III) Analysis | LoD: (5.7 \times 10^{-11}) M [11] | LoD: (3.6 \times 10^{-10}) - (9.5 \times 10^{-10}) M [11] | Not commonly used for Ga |
| Key Advantage | Direct analysis of electroplatable metals; well-established | Extreme sensitivity for non-electroplatable metals; wide applicability | Specificity for anions and certain metal complexes |
Experimental Protocols: From Theory to Practice
Detailed Methodologies
A robust experimental protocol is critical for obtaining reliable and reproducible data in stripping voltammetry. The following section outlines standard procedures for each technique.
Protocol for Anodic Stripping Voltammetry (ASV)
- Sample Preparation: The water sample is placed in an electrochemical cell. A supporting electrolyte, such as 0.02 M NaClO₄ and 0.005 M CH₃COOH at pH 3.2, is added to ensure sufficient conductivity and control the ionic strength [11]. For complex matrices, sample acidification and UV digestion may be required to break down organic metal complexes.
- Deaeration: An inert gas (e.g., nitrogen or argon) is purged through the solution for 5-10 minutes to remove dissolved oxygen, which can interfere electrochemically.
- Preconcentration/Deposition: The working electrode (e.g., HMDE or MFE) is held at a constant, negative potential. During this time, target metal ions (e.g., Cd²⁺, Pb²⁺) are reduced and deposited as metals onto the electrode surface. The deposition time can vary from 30 to 300 seconds, depending on the required sensitivity [27] [11].
- Equilibration: After deposition, the stirring is stopped, and the solution is allowed to become quiescent for a brief period (e.g., 15-30 seconds).
- Stripping: The potential is scanned linearly or pulsed in a positive (anodic) direction. The deposited metals are re-oxidized back into solution, generating a characteristic current peak for each metal at its specific oxidation potential.
- Data Analysis: The concentration of each metal is quantified by comparing the peak current (or peak area) to a calibration curve constructed from standard additions [27].
Protocol for Adsorptive Cathodic Stripping Voltammetry (AdSV)
- Sample and Reagent Preparation: The sample is placed in the cell with a suitable buffer, such as 0.1 M acetate buffer at pH 4.8-5.6, to control the pH for complex formation [11].
- Complex Formation: A specific complexing agent (AL), such as cupferron or catechol, is added to the solution. This ligand forms a stable, adsorptive complex with the target metal ion (e.g., Ga(III)) [27] [11].
- Deaeration: The solution is purged with an inert gas to remove oxygen.
- Preconcentration/Adsorption: The working electrode is held at a constant potential where the metal-ligand complex is adsorbed onto the electrode surface. This is a physical accumulation, not an electrochemical reduction. Accumulation times are typically 60 seconds [11].
- Equilibration: Stirring is stopped for a short equilibration period.
- Stripping: The potential is scanned linearly or pulsed in a negative (cathodic) direction. The adsorbed complex is reduced, producing a measurable current peak.
- Data Analysis: The peak height/area is proportional to the concentration of the metal in the sample, as determined by standard addition methods [27].
The Scientist's Toolkit: Essential Research Reagents and Materials
Successful application of stripping voltammetry relies on a carefully selected set of materials and reagents. The following table details the key components of the voltammetric toolkit.
Table 2: Essential Research Reagents and Materials for Stripping Voltammetry
| Item | Function/Description | Common Examples |
|---|---|---|
| Working Electrode | Surface where preconcentration and stripping occur; defines technique sensitivity and selectivity [27]. | Hanging Mercury Drop Electrode (HMDE), Mercury Film Electrode (MFE), Screen-Printed Electrodes, Bismuth/Gold Electrodes [27] [11]. |
| Reference Electrode | Provides a stable, known potential for the electrochemical cell [27]. | Ag/AgCl (with KCl electrolyte), Saturated Calomel Electrode (SCE). |
| Counter/Auxiliary Electrode | Completes the electrical circuit in the three-electrode system [27]. | Platinum wire, glassy carbon rod. |
| Supporting Electrolyte | Carries current and defines the ionic strength/pH of the solution; minimizes migration current [27]. | Acetate buffer (pH ~4-5), Ammonia buffer (pH ~9), NaClO₄, KCl, acetic acid [11]. |
| Complexing Agent (for AdSV) | Forms an adsorptive complex with the target metal, enabling its preconcentration [27] [11]. | Cupferron, Catechol, Dimethylglyoxime, 8-Hydroxyquinoline. |
| Standard Solutions | Used for the method of standard additions to quantify analyte concentration. | Certified single- or multi-element stock solutions (e.g., 1000 ppm). |
Stripping Voltammetry vs. Spectroscopy: An Objective Comparison
When selecting an analytical technique for trace metal analysis, researchers must weigh the relative merits of stripping voltammetry against the more widely used spectroscopic methods. The following diagram outlines the key decision factors in selecting a technique.
The choice between stripping voltammetry and spectroscopic techniques like ICP-MS or GFAAS is application-dependent. Voltammetry excels in scenarios requiring ultra-trace detection in clean or moderately complex matrices, metal speciation studies to determine toxicity and bioavailability, and projects with budget constraints or a need for on-site analysis [27] [11]. Its ability to provide information on metal oxidation states and labile fractions is a unique advantage over most bulk spectroscopic techniques [27].
Conversely, spectroscopic methods are generally superior for high-throughput analysis of samples with very complex matrices (e.g., biological tissues, soils), simultaneous multi-element analysis covering a large portion of the periodic table, and when determining total metal content without the need for speciation is sufficient [11]. However, this often comes with higher costs for instrumentation, maintenance, and operation, and typically requires a laboratory setting [11].
Stripping voltammetry, encompassing ASV, AdSV, and CSV, represents a powerful suite of techniques for trace metal analysis. Its unparalleled sensitivity, portability for field deployment, and unique capability for metal speciation make it an indispensable tool in the analytical chemist's arsenal. While spectroscopic methods like ICP-MS offer broader multi-element coverage and higher throughput for routine analysis, stripping voltammetry provides a cost-effective, sensitive, and information-rich alternative, particularly for targeted analyses and studies where understanding metal form and bioavailability is as critical as knowing its total concentration. The continued development of portable and automated voltammetric systems ensures its growing relevance in environmental monitoring, industrial process control, and biomedical research [27].
Electroanalysis has emerged as a critical tool in the pharmaceutical industry, offering versatile and sensitive methods for drug analysis [29]. Voltammetry, a technique that measures current under an applied voltage, is particularly valued for its high sensitivity, cost-effectiveness, and ability to analyze complex pharmaceutical compositions with minimal sample preparation [29] [30]. Unlike traditional chromatographic methods like HPLC, which often require extensive sample preparation and expensive solvents, voltammetric methods operate with minimal sample volumes and offer rapid analysis, making them especially suitable for routine quality control and therapeutic drug monitoring [29] [31].
The fundamental principle of voltammetry relies on the redox behavior of analytes at an electrode surface. When a voltage is applied, electroactive species undergo oxidation or reduction, generating a current signal proportional to their concentration [29]. Different voltammetric techniques, including cyclic voltammetry (CV), differential pulse voltammetry (DPV), and square wave voltammetry (SWV), provide complementary information about electrochemical properties and quantification capabilities [29]. Recent advancements have significantly enhanced voltammetric applications through the integration of nanostructured electrodes, artificial intelligence for data interpretation, and the development of portable sensors for real-time monitoring [29].
Experimental Protocols for Thymoquinone Quantification
Square Wave Voltammetry with Carbon Paste Electrode
A recent innovative study developed a sensitive and cost-effective method for thymoquinone (TQ) determination using square-wave voltammetry with an environmentally friendly carbon paste electrode [31]. This protocol is particularly notable as it introduces, for the first time, an oxidation-based voltammetric strategy for TQ detection, broadening the analytical framework beyond conventional reduction-based approaches [31].
Apparatus and Reagents: The measurements were performed using a µAutolab Type III potentiostat/galvanostat controlled by GPES software. The three-electrode system consisted of a carbon paste electrode as the working electrode, a silver/silver chloride reference electrode, and a platinum wire auxiliary electrode. The carbon paste was prepared from graphite powder and paraffin oil in a ratio of 1.0 g graphite to 0.3 mL oil. Supporting electrolytes included hydrochloric acid and Britton-Robinson buffers across pH ranges from 0.3 to 6.0 [31].
Procedure: The stock solution of thymoquinone was prepared by dissolving an appropriate amount in distilled water, though complete dissolution required approximately two days. Working solutions with lower concentrations were prepared by appropriate dilution of the stock solution. The voltammetric measurements were carried out in a 15 mL cell volume after optimizing parameters including electrode material, electrolyte composition, and scan settings. The method addressed the complex voltammetric response through in-depth evaluation of both classical and modern analytical techniques, including cumulative voltammetry [31].
Calibration and Validation: Three calibration curve construction methods were tested based on current height, peak area, and the cumulative voltammetry concept. The broadest linear range was established using peak current height, with a limit of detection of 8.9 nmol·L⁻¹ and limit of quantification of 29.8 nmol·L⁻¹. The method was validated through analysis of real samples, including Nigella sativa seed oil and dietary supplements, with results showing strong correlation with HPLC reference methods [31].
Electrochemical Biosensor with GCE/rGO/CuO
An alternative methodology combined innovative extraction with advanced sensor technology for TQ quantification [32].
Extraction Protocol: Electrospun nanofibers with polyvinyl chloride/ethylene vinyl acetate latex/electrochemically (reduced graphene oxide/polypyrrole)/Silybum marianum inflorescence extract were prepared as a sorbent for TQ extraction from black seed. Factors affecting TQ adsorption/desorption were optimized using design-expert 12.0 and one-at-a-time methods. The electrospinning process was conducted with specific parameters: voltage of 14 KV, flow rate of 0.9 mL/h, and distance of 10 cm [32].
Sensor Development and Measurement: A nonenzymatic electrochemical biosensor was constructed using copper (II) oxide nanoparticles/reduced graphene oxide/glassy carbon electrode. The biosensor was applied to human blood serum samples with the standard addition method using spiked TQ. The method achieved a linear range of 50–1000 μM with a detection limit of 4.85 μM [32].
Comparative Performance Data
The following tables summarize experimental data from recent studies applying voltammetry to pharmaceutical analysis, highlighting key performance metrics for various bioactive compounds.
Table 1: Voltammetric Methods for Thymoquinone Quantification
| Method | Electrode | Linear Range | LOD | LOQ | Sample Matrix | Reference |
|---|---|---|---|---|---|---|
| SWV | Carbon Paste | Not specified | 8.9 nmol·L⁻¹ | 29.8 nmol·L⁻¹ | Nigella sativa oil, supplements | [31] |
| Electrochemical Biosensor | GCE/rGO/CuO | 50–1000 μM | 4.85 μM | Not specified | Human blood serum | [32] |
| DPV | Low-cost Potentiostat with MIP | 1–200 μM | 0.2 μM | Not specified | Black cumin | [33] |
Table 2: Voltammetric Methods for Other Pharmaceutical Compounds
| Compound | Method | Electrode | Linear Range | LOD | Application | Reference |
|---|---|---|---|---|---|---|
| Bumadizone | SWV | 10% nRGO-modified CPE | 0.9×10²-15×10² ng mL⁻¹ | Not specified | Pharmaceutical forms, biological fluids | [34] |
| Resorcinol | SWV | ZnFe₂O₄/NPs/IL/CPE | 3.0 μM to 500 μM | 1.46 μM | Pharmaceutical creams | [30] |
| Sulfamethoxazole | DPV | Not specified | 6.59 to 96.27 μM | 1.98 μM | Water, pharmaceutical formulations | [35] |
The Scientist's Toolkit: Essential Research Reagents and Materials
Table 3: Key Research Reagent Solutions for Voltammetric Analysis
| Reagent/Material | Function | Example Application |
|---|---|---|
| Carbon Paste Electrode (CPE) | Working electrode providing conductive surface for redox reactions | Baseline electrode for thymoquinone detection [31] |
| Nano-Reduced Graphene Oxide (nRGO) | Electrode modifier enhancing surface area and electron transfer | Bumadizone determination in pharmaceutical forms [34] |
| Ionic Liquids (e.g., 1-Ethyl-3-methylimidazolium tetrafluoroborate) | Modifier improving conductivity and electron transfer rate | Resorcinol and hydroquinone simultaneous determination [30] |
| Metal Oxide Nanoparticles (e.g., ZnFe₂O₄, CuO) | Catalytic enhancement of electrochemical reactions | Electrode modification for improved sensitivity [30] [32] |
| Britton-Robinson Buffer | Versatile supporting electrolyte across wide pH range (2.0-12.0) | Optimal pH optimization for various pharmaceutical compounds [31] [34] |
| Molecularly Imprinted Polymers (MIP) | Synthetic receptors for selective target molecule recognition | Selective thymoquinone detection in complex matrices [33] |
Methodological Workflow and Signaling Pathways
The following diagram illustrates the generalized experimental workflow for voltammetric quantification of bioactive molecules in pharmaceutical analysis:
Voltammetric Analysis Workflow
The experimental workflow for voltammetric analysis of pharmaceutical compounds involves sequential stages from sample preparation through method validation. Sample collection from relevant matrices (pharmaceutical formulations or biological fluids) is followed by extraction and preparation to isolate the target analyte. Critical to success is the electrode selection and modification stage, where appropriate working electrodes are chosen and potentially enhanced with nanomaterials or modifiers to improve sensitivity and selectivity. The method optimization phase establishes ideal parameters including supporting electrolyte pH, measurement technique (SWV, DPV, CV), and validation of analytical performance. Voltammetric measurement generates the electrochemical data, which undergoes quantitative analysis through calibration curves. Finally, method validation against established reference methods like HPLC confirms accuracy and reliability [31] [30] [34].
The signaling pathway for electrochemical detection can be visualized as follows:
Electrochemical Detection Pathway
The electrochemical detection pathway initiates when target analyte molecules in solution diffuse or migrate to the electrode surface under an applied potential. At the electrode surface, which may be modified with nanomaterials or selective recognition elements, the analyte undergoes electron transfer through oxidation or reduction processes. This faradaic process generates a current signal proportional to the analyte concentration. The measured current is then used for concentration quantification through established calibration curves, forming the basis for precise analytical determination [29] [31].
Comparative Advantages: Voltammetry vs. Spectroscopy
When positioned within the broader context of analytical techniques for trace analysis, voltammetry demonstrates distinct advantages and complementary capabilities compared to spectroscopic methods.
Sensitivity and Detection Limits: Voltammetric methods consistently achieve nanomolar detection limits for various pharmaceutical compounds, as evidenced by the 8.9 nmol·L⁻¹ LOD for thymoquinone [31]. This high sensitivity rivals or exceeds many spectroscopic techniques while utilizing generally simpler instrumentation.
Analysis Time and Cost: Voltammetric methods offer significant advantages in terms of rapid analysis and cost-effectiveness. The minimal sample preparation requirements, small sample volumes, and elimination of expensive solvents or columns contribute to reduced operational costs compared to HPLC or spectroscopic methods [31] [30].
Selectivity and Modification Capabilities: While spectroscopic methods often struggle with selectivity in complex matrices, voltammetry allows for enhanced selectivity through electrode modification approaches. The incorporation of molecularly imprinted polymers, nanomaterials, or biological recognition elements creates tailored sensing interfaces [30] [33]. This modular approach to selectivity represents a significant advantage over many conventional spectroscopic techniques.
Portability and Field Deployment: The development of low-cost potentiostats and portable systems enables voltammetric analysis in field settings, a distinct advantage over most laboratory-bound spectroscopic instruments [33]. This portability facilitates real-time monitoring and point-of-care applications that are challenging for conventional spectroscopic approaches.
Voltammetry has established itself as a powerful analytical technique for the quantification of bioactive molecules in pharmaceutical applications. The method demonstrates excellent sensitivity, cost-effectiveness, and practical flexibility, making it increasingly competitive with traditional spectroscopic and chromatographic approaches. As evidenced by the successful quantification of thymoquinone and other pharmaceutical compounds, voltammetry offers a valuable tool for researchers and drug development professionals seeking robust analytical methods for quality control, therapeutic monitoring, and pharmaceutical research.
Future directions in the field point toward increased integration of nanomaterials, artificial intelligence for data interpretation, and the development of miniaturized, portable systems for decentralized analysis [29]. These advancements will further solidify voltammetry's position as an indispensable technique in the modern pharmaceutical analytical toolkit.
The accurate determination of total metal concentration is a cornerstone of analytical chemistry, with critical applications spanning environmental monitoring, clinical diagnostics, and pharmaceutical development. For decades, atomic spectroscopy techniques have served as the primary tools for these measurements. This guide provides an objective comparison of three fundamental analytical workhorses: Inductively Coupled Plasma Mass Spectrometry (ICP-MS), Atomic Absorption Spectroscopy (AAS), and Atomic Emission Spectroscopy (AES), with a specific focus on their performance in quantifying total metal content. The data and methodologies presented here are essential for understanding the comparative landscape in which modern techniques like voltammetry are evaluated for trace metal analysis.
Technique Fundamentals & Instrumentation
The core principle uniting AAS, AES, and ICP-MS is the measurement of light interaction with free atoms in the gas phase. However, their underlying physical mechanisms and instrumental setups differ significantly.
- Atomic Absorption Spectroscopy (AAS) measures the attenuation of light at a wavelength specific to the analyte element as it passes through a cloud of ground-state atoms. The amount of light absorbed is proportional to the concentration of the element, as described by the Beer-Lambert law [36]. The key components include an element-specific hollow cathode lamp light source, an atomizer (flame or graphite furnace), a monochromator to select the wavelength, and a photomultiplier tube or solid-state detector [36].
- Atomic Emission Spectroscopy (AES), often referred to as ICP-OES (Optical Emission Spectrometry) when coupled with an inductively coupled plasma source, measures the characteristic wavelength and intensity of light emitted by excited atoms as they return to lower energy states. The plasma serves as the excitation source, and the instrument requires a high-resolution polychromator and a sophisticated detector like a Charge Injection Device (CID) to resolve the complex emission spectra [37].
- Inductively Coupled Plasma Mass Spectrometry (ICP-MS) first ionizes the sample in a high-temperature argon plasma. The resulting ions are then separated and quantified based on their mass-to-charge ratio by a mass spectrometer. This technique combines the high-temperature plasma from AES with the detection power of mass spectrometry [38].
Table 1: Fundamental Principles and Instrumental Components
| Feature | Atomic Absorption Spectroscopy (AAS) | Atomic Emission Spectroscopy (AES/ICP-OES) | Inductively Coupled Plasma Mass Spectrometry (ICP-MS) |
|---|---|---|---|
| Underlying Principle | Absorption of element-specific light by ground-state atoms | Emission of light by excited atoms | Ionization of atoms followed by mass-based separation and counting |
| Key Instrument Components | Hollow Cathode Lamp (HCL), Atomizer (Flame/Graphite Furnace), Monochromator, Photomultiplier Tube [36] | ICP Torch, RF Generator, Polychromator, CID Detector [37] | ICP Torch, RF Generator, Interface Cone, Mass Spectrometer (Quadrupole/Sector Field), Ion Detector [38] |
| Primary Readout | Absorbance | Emission Intensity | Ion Counts (Counts Per Second) |
Performance Comparison & Experimental Data
When selecting an analytical technique, performance metrics such as detection capability, analytical range, and throughput are paramount. The following table and supporting experimental data provide a direct comparison.
Table 2: Analytical Performance Comparison of AAS, ICP-OES, and ICP-MS [36]
| Performance Feature | Flame AAS | Graphite Furnace AAS | ICP-OES | ICP-MS |
|---|---|---|---|---|
| Typical Detection Limits | ppm to ppb range | ppb to ppt range | ppm to ppb range | ppb to ppt range |
| Multi-element Capability | No (Single element) | No (Single element) | Yes | Yes |
| Linear Dynamic Range | 2-3 orders of magnitude | 2-3 orders of magnitude | 4-5 orders of magnitude | 8-9 orders of magnitude |
| Sample Throughput | High (for flame) | Low | Very High | High |
| Operational Cost | Low | Medium | Medium | High |
| Complexity | Moderate | Moderate | High | High |
Supporting Experimental Comparisons
- ICP-MS vs. XRF for Trace Elements in Tissue: A 2025 study directly compared ICP-MS with benchtop X-Ray Fluorescence (XRF) for analyzing trace elements in rat tissues. The results demonstrated strong linear regression correlations between the two methods for Arsenic (As, R² = 0.86), Cadmium (Cd, R² = 0.81), Copper (Cu, R² = 0.77), Manganese (Mn, R² = 0.88), and Zinc (Zn, R² = 0.74). The overall Pearson correlation coefficient was r = 0.95 (p ≤ 0.05), validating the high concordance between ICP-MS and a viable alternative technique for such matrices [39].
- ICP-OES vs. AAS for Serum Metals: An earlier but foundational study compared ICP-OES with AAS for determining calcium, magnesium, copper, and zinc in 77 serum samples. Regression analysis showed that ICP-OES yielded slightly higher results for calcium, copper, and zinc, and lower results for magnesium compared to AAS. A key noted advantage of ICP-OES was the simultaneous multi-element capability, requiring less preparation and analysis time [40].
Detailed Experimental Protocols
To illustrate the practical application of these techniques, the following are generalized experimental protocols derived from recent literature.
- Sample Preparation: Tissue samples (e.g., stomach, eyes, liver) are collected and homogenized. A precise mass of homogenate is subjected to acid digestion, typically using high-purity nitric acid, often in a closed-vessel microwave digestion system to ensure complete dissolution and prevent contamination and loss of volatile elements.
- Instrumental Analysis: The digested and diluted sample is introduced into the ICP-MS via a peristaltic pump and nebulizer. The aerosol is transported to the plasma (~6000-10000 K) where atomization and ionization occur. The resulting ions are passed through interface cones into the mass spectrometer vacuum, separated by a quadrupole, and detected.
- Data Quantification: Calibration is performed using a series of multi-element standard solutions prepared in a matrix matching the sample digest. An internal standard (e.g., Indium, Rhodium) is added online to all samples and standards to correct for instrumental drift and matrix suppression effects [38].
- Quality Control: Blanks, certified reference materials (CRMs), and sample duplicates are analyzed to ensure accuracy and precision.
- Sample Introduction: A small, precise aliquot (typically 5-50 µL) of the liquid sample (e.g., digested soil or water extract) is pipetted directly into the graphite tube.
- Temperature Program: The furnace executes a multi-stage temperature program:
- Drying: Gently heats to ~100-150°C to remove the solvent.
- Pyrolysis/Ashing: Heats to a medium temperature (e.g., 300-800°C) to volatilize and remove organic and other matrix components without losing the analyte.
- Atomization: Rapidly heats to a high temperature (e.g., 2000-2500°C) to produce a cloud of ground-state gallium atoms.
- Cleaning: A final high-temperature step to remove any residual material from the tube.
- Measurement: During the atomization step, the light from a Gallium-specific Hollow Cathode Lamp passes through the graphite tube, and the transient absorption signal is measured.
- Calibration: Quantification is achieved using external standards or the method of standard additions to account for potential matrix effects.
Technical Specifications & Methodologies
Research Reagent Solutions
Table 3: Key Reagents and Materials for Spectroscopic Metal Analysis
| Item/Category | Function | Example Use-Cases |
|---|---|---|
| High-Purity Acids (HNO₃, HCl) | Sample digestion and dissolution to release metals into solution. | Microwave-assisted digestion of biological tissues, soils, and polymers [39]. |
| Multi-Element Standard Solutions | Calibration and quantification of the instrument's response. | Preparing calibration curves for ICP-MS, ICP-OES, and AAS [39] [36]. |
| Certified Reference Materials (CRMs) | Quality control and method validation to ensure analytical accuracy. | Verifying the performance of an ICP-MS method for soil analysis [41]. |
| Internal Standard Solutions (e.g., Sc, In, Rh, Y) | Correction for instrumental drift and matrix effects, particularly in ICP-MS. | Added online to all samples and standards during ICP-MS analysis [38]. |
| Graphite Tubes & Cones | Critical consumables for GFAAS (furnace tube) and ICP-MS (interface cones). | Withstanding high temperatures and corrosive samples in GFAAS and ICP-MS [36] [38]. |
| Hollow Cathode Lamps (HCLs) | Element-specific light source required for AAS measurements. | Determining specific elements like copper or zinc by AAS [36]. |
Interference Management
A critical aspect of methodology is handling analytical interferences.
- ICP-MS Interferences: These are primarily spectroscopic (isobaric overlaps and polyatomic ions) and non-spectroscopic (matrix-induced signal suppression/enhancement). Countermeasures include using collision/reaction cells, high-resolution mass spectrometers, cool plasma conditions, internal standardization, and sample dilution [38].
- AAS Interferences: These include spectral line overlap (rare), chemical (formation of stable compounds), physical (viscosity effects), and background absorption. Corrections involve using deuterium or Zeeman background correction, matrix modifiers in GFAAS, and the standard addition method [36].
Contextualization within Voltammetry vs. Spectroscopy Research
The comparative data above for ICP-MS, AAS, and AES establishes the benchmark against which electrochemical techniques like stripping voltammetry are evaluated in trace analysis research.
Spectroscopic techniques, particularly ICP-MS, offer exceptional sensitivity, multi-element capability, and a wide dynamic range, making them the reference standard for total metal quantification [36]. However, they often require sophisticated, costly instrumentation, complex sample preparation involving digestion, and are generally unsuitable for direct field analysis.
In contrast, stripping voltammetry, as highlighted in gallium analysis research, presents a compelling alternative [11]. Its advantages include high sensitivity (potentially reaching ppt levels), simplicity, lower operational costs, and the ability to perform speciation analysis without complex separations. The core trade-off lies in its primarily single-element nature and the need for careful optimization of the electrode and electrolyte system for each analyte. Therefore, within a research context, the choice between spectroscopic workhorses and voltammetry hinges on the specific requirements of the analysis: the need for multi-element data versus cost, portability, and speciation capabilities.
Analytical Technique Selection Workflow
The following diagram outlines a logical decision-making process for selecting an appropriate analytical technique based on key application requirements.
Performance Positioning Chart
This chart visually positions the discussed analytical techniques based on their typical detection capabilities and multi-element performance, highlighting their relative strengths.
The quantitative analysis of complex samples, such as biological fluids, pharmaceuticals, and environmental matrices, presents a significant challenge for researchers and drug development professionals. The primary hurdle lies in detecting specific analytes at trace concentrations amidst a background of interfering substances. In the broader context of analytical research, two principal philosophies have emerged: voltammetric methods and spectroscopic techniques. The former, including various forms of voltammetry, leverages electrochemical reactions to quantify analytes based on their redox behavior, offering exceptional sensitivity, portability, and low cost [11] [42]. The latter, encompassing techniques like HPLC-UV and spectroscopy, often provides high precision and specificity but can require expensive instrumentation, complex sample preparation, and significant reagent consumption [43] [31].
Chromatographic-Electrochemical hybrids with Amperometric Detection (CE-AD) represent a powerful synergy of these paradigms. These systems integrate the superior separation power of chromatography with the high sensitivity and selectivity of electrochemical detection. This guide objectively compares the performance of the CE-AD approach against its alternatives, providing a clear framework for selecting the optimal analytical strategy for trace analysis.
Principles and Core Components of CE-AD Systems
A CE-AD system functionally merges two core modules: a separation unit and a detection unit. The separation is typically achieved via capillary electrophoresis (CE) or liquid chromatography (LC), which resolves the components of a complex mixture based on their differential migration rates. The resolved analytes then sequentially pass through the electrochemical detector, where they undergo oxidation or reduction at a working electrode under a constant applied potential. This generates a Faradaic current proportional to the analyte concentration, which is recorded as the analytical signal [42].
The Scientist's Toolkit: Essential Components for CE-AD
The following table details the key research reagent solutions and materials essential for constructing and operating a CE-AD system.
Table 1: Key Research Reagent Solutions and Materials for CE-AD Systems
| Component | Function | Common Examples |
|---|---|---|
| Supporting Electrolyte | Provides ionic conductivity, controls pH, and influences electrochemical reaction and analyte separation [11] [31]. | Acetate buffer, Britton-Robinson buffer, phosphate buffer saline (PBS), LiClO₄ in acetonitrile [43] [31] [44]. |
| Working Electrode | Serves as the surface where the electrochemical reduction or oxidation of the analyte occurs; its material critically defines sensitivity and selectivity [11]. | Glassy Carbon Electrode (GCE), Carbon Paste Electrode (CPE), Hg(Ag)FE, Pt disk electrode [11] [31] [44]. |
| Reference Electrode | Provides a stable and known potential against which the working electrode's potential is controlled [45] [42]. | Ag/AgCl (3M KCl), Saturated Calomel Electrode (SCE). |
| Counter Electrode | Completes the electrical circuit in the electrochemical cell, allowing current to flow [45] [42]. | Platinum wire, graphite rod. |
| Capillary / Column | The conduit for separation, where analytes are resolved based on their charge, size, and interaction with the buffer or stationary phase. | Fused silica capillary for CE, C-18 column for LC. |
| Running Buffer / Mobile Phase | The liquid phase that carries the sample through the capillary or column, essential for the separation mechanism. | Aqueous buffers at defined pH, mixtures of water and organic solvents (e.g., acetonitrile, methanol) [31]. |
Diagram 1: CE-AD System Workflow.
Performance Comparison: CE-AD vs. Alternative Techniques
To objectively evaluate the CE-AD platform, its performance must be compared against stand-alone voltammetry and standard spectroscopic detection methods (e.g., HPLC-UV). The following data, synthesized from recent research, highlights key performance metrics.
Table 2: Quantitative Performance Comparison of Analytical Techniques
| Technique | Typical Linear Range | Limit of Detection (LOD) | Key Advantages | Key Limitations |
|---|---|---|---|---|
| CE-AD / LC-AD | nmol·L⁻¹ to µmol·L⁻¹ | Low nmol·L⁻¹ range (e.g., ~8.9 nmol·L⁻¹ for TQ [31]) | High sensitivity from EC detection; excellent selectivity from separation; minimal sample volume [31]. | Requires conductive background electrolyte; electrode fouling can occur. |
| Stand-alone Voltammetry (e.g., SWV, DPV) | µmol·L⁻¹ to mmol·L⁻¹ | Sub-nmol·L⁻¹ to nmol·L⁻¹ (e.g., 5.7×10⁻¹¹ mol·L⁻¹ for Ga(III) [11]) | Extreme sensitivity; rapid analysis; low cost and portable equipment [11] [31]. | Susceptible to interference in complex matrices without pre-treatment. |
| HPLC with Spectroscopic Detection (e.g., UV) | µmol·L⁻¹ to mmol·L⁻¹ | nmol·L⁻¹ to µmol·L⁻¹ (e.g., LOD ~0.15 µg/mL for GC-MS [44]) | High precision; universal detection; well-established protocols [31] [44]. | Lower sensitivity vs. EC; larger sample volumes; expensive instrumentation and solvents [43] [31]. |
The data demonstrates that while stand-alone voltammetry can achieve superior absolute sensitivity, its application to complex samples like blood, urine, or soil extracts is often hampered by matrix effects. HPLC-UV is robust but less sensitive. CE-AD occupies a crucial niche, offering a balanced combination of high sensitivity and high selectivity, making it uniquely suited for trace analysis in complex media.
Experimental Protocols and Methodologies
Detailed Protocol: Voltammetric Determination of Thymoquinone
This protocol, adapted from a 2025 study, exemplifies a sensitive voltammetric method that could be integrated into a CE-AD system [31].
- Apparatus and Instrumentation: µAutolab Type III potentiostat/galvanostat controlled by GPES software. A three-electrode system comprising a Carbon Paste Electrode (CPE) as the working electrode, an Ag/AgCl reference electrode (3 mol·L⁻¹ KCl), and a platinum wire auxiliary electrode.
- Reagent Preparation:
- Supporting Electrolyte: Britton-Robinson (BR) buffers across pH 2.0–6.0.
- Carbon Paste Preparation: Mix graphite powder and paraffin oil in a ratio of 1.0 g to 0.3 mL.
- Standard Stock Solution: Dissolve thymoquinone (TQ) in distilled water. Store at 4°C. Prepare working solutions daily by dilution.
- Measurement Procedure:
- Place 15 mL of the supporting electrolyte into the voltammetric cell.
- Deoxygenate the solution by purging with purified nitrogen for 10 minutes.
- Pre-condition the CWE by performing cyclic scans in the blank electrolyte.
- Introduce the aliquot of the TQ standard or sample solution.
- Execute the Square-Wave Voltammetry (SWV) scan using optimized parameters: frequency 100 Hz, step potential 2 mV, amplitude 50 mV.
- Measure the oxidation peak current at approximately +0.4 V (vs. Ag/AgCl).
- Calibration and Quantification: Construct a calibration curve by plotting the anodic peak current height against the concentration of TQ standard solutions.
Detailed Protocol: Electrochemical Sensor for Metronidazole
This protocol highlights the use of a modified electrode to enhance sensitivity, a common strategy in advanced AD systems [43].
- Sensor Fabrication:
- Synthesize α-Fe₂O₃/rGO nanocomposite via a hydrothermal method.
- Fabricate the core-enhanced carbon electrode (α-Fe₂O₃/rGO@CE) by homogenously mixing carbon graphite powder with the synthesized nanocomposite (e.g., 15% by weight) to form a paste.
- Measurement and Detection:
- Use Cyclic Voltammetry (CV) and Differential Pulse Voltammetry (DPV) in a standard three-electrode cell with the modified electrode as the working electrode.
- The reduction peak of metronidazole (MTZ) is monitored at -0.4 V (vs. Ag/AgCl) in a phosphate buffer solution.
- The LOD and LOQ for this sensor were calculated as 2.80 × 10⁻⁶ M and 8.0 × 10⁻⁶ M, respectively [43].
Diagram 2: CE-AD Analysis Workflow.
Application in Real-World Analysis: Case Studies
The efficacy of electrochemical detection, particularly when coupled with separation, is proven through its application to challenging real-world samples.
- Pharmaceutical Quality Control: A study quantifying Diclofenac in tablets compared Linear Sweep Voltammetry (LSV) and GC-MS. The LSV method, while having a higher LOD (4.8 µg/mL) than GC-MS (0.15 µg/mL), offered a rapid, cost-effective alternative without the need for complex sample preparation or derivatization, perfectly adequate for formulation assay [44]. An integrated LC-AD system would further enhance such an method's selectivity.
- Analysis of Biological Fluids: The α-Fe₂O₃/rGO-based sensor was successfully applied for the detection of Metronidazole in human urine samples. The sensor demonstrated exceptional sensitivity, stability, and reproducibility in this complex matrix, showcasing the practical utility of advanced electrochemical sensors in clinical analysis [43].
- Natural Product and Dietary Supplement Testing: A voltammetric method for Thymoquinone in Nigella Sativa oil and supplements showed a strong correlation with the standard HPLC-UV method. This underscores voltammetry's reliability for quantitative analysis in complex natural product matrices and highlights CE-AD's potential for automating such analyses with superior sensitivity [31].
The comparative data and experimental evidence firmly establish Chromatographic-Electrochemical Hybrids (CE-AD) as a superior platform for the trace analysis of electroactive species in complex samples. When framed within the broader thesis of voltammetry versus spectroscopy, CE-AD does not represent a victory for one over the other, but rather a synergistic integration that captures the key strengths of both: the high separation efficiency of chromatography and the exceptional sensitivity of voltammetry.
For researchers and drug development professionals, the choice of technique should be guided by the specific analytical problem. Stand-alone voltammetry is unmatched for simple matrices or dedicated, portable sensors. HPLC with spectroscopic detection remains a versatile and robust workhorse. However, for challenges demanding the ultimate sensitivity and selectivity from a small sample volume—such as quantifying a low-concentration metabolite in plasma, monitoring drug levels in single cells, or detecting trace environmental contaminants—CE-AD and related hybrid techniques represent the state-of-the-art. Future developments in electrode materials (e.g., atomic site catalysts [46]), miniaturization (lab-on-a-chip), and data integration will further solidify the role of these hybrid systems in pushing the boundaries of trace analysis.
The accurate determination of trace metals in environmental samples is a critical task in chemical and environmental analysis. Gallium (Ga) and Indium (In), classified as critical technology elements, have seen dramatically increasing use in high-technology industries, from electronics and semiconductors to medical diagnostics [47] [10] [48]. Their release into the environment through industrial processes poses potential ecological and health risks, creating an urgent need for reliable monitoring methods [10] [48]. This case study objectively compares the performance of voltammetric and spectroscopic techniques for the direct determination of trace levels of Ga and In in environmental samples, providing a framework for researchers selecting appropriate analytical methodologies.
The core challenge in analyzing these elements lies in their typically low concentrations in environmental matrices and the complexity of those matrices themselves. While spectroscopic techniques like ICP-MS offer exceptional sensitivity, voltammetric methods provide compelling advantages in terms of cost, portability, and minimal sample pretreatment [49] [48]. This analysis is situated within a broader thesis on voltammetry versus spectroscopy for trace analysis, focusing on practical application parameters such as sensitivity, selectivity, cost, and operational requirements.
Analytical Techniques: Principles and Instrumentation
Voltammetric Techniques
Voltammetry encompasses electrochemical techniques where the current is measured as a function of an applied potential. For trace metal analysis, stripping voltammetry is particularly powerful due to its pre-concentration step, which significantly enhances sensitivity [2] [3].
- Anodic Stripping Voltammetry (ASV): In ASV, the analyte metal ions are first electrochemically reduced and deposited onto the working electrode surface during a deposition step. This is followed by anodic stripping, where the deposited metal is oxidized back into solution, generating a measurable current peak proportional to concentration [2] [10]. ASV is highly effective for metals that form amalgams with mercury or can be deposited on various electrode materials.
- Adsorptive Stripping Voltammetry (AdSV): For metals that are not amenable to direct electrolytic deposition, AdSV provides an excellent alternative. This technique involves forming a complex between the target metal ion and an added organic ligand. The complex adsorbs onto the electrode surface during the accumulation step. Subsequently, the reduction current of the adsorbed complex is measured [10] [3]. AdSV often provides one to two orders of magnitude higher sensitivity than ASV due to more efficient pre-concentration on the electrode surface [48].
The choice of working electrode is crucial in voltammetry. While mercury electrodes (HMDE, SMDE) traditionally offered excellent reproducibility and wide negative potential windows, environmental and safety concerns have driven the development of "green" alternatives [10]. Bismuth-based electrodes, particularly the solid bismuth microelectrode (SBiµE) and bismuth film electrodes (BiFE), have emerged as promising replacements, offering low toxicity, favorable electrochemical properties, and resistance to oxygen interference in many cases [47] [48].
Spectroscopic Techniques
Spectroscopic techniques measure the interaction of electromagnetic radiation with matter to identify and quantify elements.
- Inductively Coupled Plasma Mass Spectrometry (ICP-MS): ICP-MS is a powerful technique that combines a high-temperature plasma source with a mass spectrometer. It offers exceptional sensitivity, low detection limits, and the ability to perform multi-element analysis rapidly [10] [3]. However, it requires expensive instrumentation, high operational costs, specialized gases, and skilled operators.
- Solution Cathode Glow Discharge-Atomic Emission Spectrometry (SCGD-AES): SCGD-AES is a more compact and portable alternative to ICP-based techniques. It uses an atmospheric-pressure glow discharge with the sample solution as the cathode for atomization and excitation. Its advantages include lower cost and power consumption, no requirement for combustible gases, and potential for field deployment [49]. However, it may suffer from matrix effects and generally offers higher detection limits than ICP-MS.
- Graphite Furnace Atomic Absorption Spectroscopy (GFAAS): GFAAS provides high sensitivity for metal analysis by atomizing samples in a graphite tube. While sensitive, it has a relatively narrow linear range and the analysis process can be time-consuming [49] [10].
Experimental Protocols and Workflows
Voltammetric Protocol for Indium Determination Using SBiµE
The following protocol details a recently developed procedure for determining In(III) using a green chemistry-compliant solid bismuth microelectrode (SBiµE) [47].
- Supporting Electrolyte: 0.1 mol L⁻¹ acetate buffer (pH = 3.0 ± 0.05).
- Working Electrode: Solid bismuth microelectrode (SBiµE) with a diameter of 25 µm.
- Activation Step: Electrode activation at −2.4 V for 20 s (for ASV) or −2.5 V for 45 s (for AdSV) to reduce any bismuth oxide on the surface.
- Accumulation/Deposition Step:
- For ASV: Application of −1.2 V accumulation potential for 20 s.
- For AdSV: Use of cupferron as a chelating agent with −0.65 V accumulation potential for 10 s.
- Stripping Step:
- For ASV: Positive potential scan from −1.0 V to −0.3 V.
- For AdSV: Negative potential scan from −0.4 V to −1.0 V.
- Calibration: Linear range from 5×10⁻⁹ to 5×10⁻⁷ mol L⁻¹ (ASV) and 1×10⁻⁹ to 1×10⁻⁷ mol L⁻¹ (AdSV).
- Interference Study: Assessment of surfactants, humic substances, and EDTA.
The following workflow illustrates the voltammetric analysis process for gallium and indium:
Spectroscopic Protocol Using SCGD-AES
This protocol describes the determination of Ga and In using a portable Solution Cathode Glow Discharge-Atomic Emission Spectrometry system [49].
- Instrumentation: SCGD system with a peristaltic pump, buffer bottle, six-port valve, and syringe pump for sample introduction.
- Supporting Electrolyte: HNO₃ at pH = 1.0.
- Optimal Conditions:
- Discharge Voltage: 660 V
- Solution Flow Rate: 3.0 mL min⁻¹
- Measurement: Introduction of sample into the glow discharge plasma and monitoring of atomic emission lines.
- Ga emission line: 417.2 nm
- In emission line: 451.1 nm
- Calibration: Linear range of 1–40 µg mL⁻¹ for Ga and 0.1–30 µg mL⁻¹ for In.
- Matrix Interference: For Ga, a 10-fold dilution of water samples is often necessary to reduce matrix interference.
The workflow for the spectroscopic determination of these elements is outlined below:
Performance Comparison and Analytical Data
Quantitative Comparison of Analytical Techniques
The table below summarizes key analytical figures of merit for the determination of Ga and In using various voltammetric and spectroscopic techniques.
Table 1: Performance Comparison of Analytical Techniques for Gallium and Indium Determination
| Technique | Target Element | Linear Range | Detection Limit | Remarks | Source |
|---|---|---|---|---|---|
| AdSV with SBiµE | In(III) | 1×10⁻⁹ – 1×10⁻⁷ mol L⁻¹ (0.1 – 11.5 µg L⁻¹) | 3.9×10⁻¹⁰ mol L⁻¹ (0.045 µg L⁻¹) | Uses cupferron; Acetate buffer pH 3.0 | [47] |
| ASV with SBiµE | In(III) | 5×10⁻⁹ – 5×10⁻⁷ mol L⁻¹ (0.6 – 57.5 µg L⁻¹) | 1.4×10⁻⁹ mol L⁻¹ (0.16 µg L⁻¹) | Acetate buffer pH 3.0 | [47] |
| AdSV with BiFE | In(III) | 2×10⁻⁷ – 4×10⁻⁶ M (23 – 460 µg L⁻¹) | 3.5×10⁻⁹ M (0.4 µg L⁻¹) | Uses PAR complexing agent | [48] |
| SCGD-AES | In | 0.1 – 30 µg mL⁻¹ | 0.016 µg mL⁻¹ (16 µg L⁻¹) | Portable, low power & cost | [49] |
| SCGD-AES | Ga | 1 – 40 µg mL⁻¹ | 0.10 µg mL⁻¹ (100 µg L⁻¹) | Severe matrix interference, requires dilution | [49] |
| AdSV with HMDE | Ga(III) | ~nM range | Lowest reported for Ga | Historical reference; uses mercury electrode | [10] |
| ICP-MS | Ga, In | Wide linear range | ~0.001 – 0.01 µg L⁻¹ | High sensitivity but expensive instrumentation | [10] |
Comparison of Practical Operational Factors
Beyond pure analytical performance, practical considerations are crucial for method selection, especially for routine analysis or field deployment.
Table 2: Operational and Practical Comparison of the Analytical Techniques
| Factor | Voltammetry (ASV/AdSV) | Spectroscopy (SCGD-AES) | Spectroscopy (ICP-MS) |
|---|---|---|---|
| Equipment Cost | Low to moderate | Moderate | Very High |
| Operational Cost | Low | Low | High |
| Sample Throughput | Moderate | Moderate to High | High |
| Portability | Good (potential for field analysis) | Good (portable systems exist) | Poor (lab-based only) |
| Sample Volume | Small (mL) | Moderate (mL) | Small (mL) |
| Skill Requirement | Moderate | Moderate | High |
| Multi-element Capability | Limited (sequential) | Good | Excellent |
| Sample Preparation | Minimal (often direct analysis) | Minimal (may require dilution) | Often extensive |
| Primary Interferences | Surface-active compounds, organic matter, complexing agents | Spectral interferences, matrix effects | Polyatomic ions, matrix effects |
The Scientist's Toolkit: Essential Research Reagents and Materials
Successful determination of trace Ga and In requires careful selection of reagents and materials. The following table details key components used in the featured experiments.
Table 3: Essential Research Reagents and Materials for Ga and In Analysis
| Reagent/Material | Function | Application Example |
|---|---|---|
| Solid Bismuth Microelectrode (SBiµE) | "Green" working electrode; replaces toxic mercury electrodes. Provides excellent signal-to-noise ratio. | Direct determination of In(III) in environmental waters without adding Bi ions to solution [47]. |
| Bismuth Film Electrode (BiFE) | Environmentally friendly electrode formed as a thin film on a substrate (e.g., glassy carbon). | AdSV determination of In in tap water and ITO glass samples using a PAR complex [48]. |
| Cupferron | Organic chelating agent that forms electroactive complexes with metal ions, enabling AdSV. | Formation of adsorbable In(III)-cupferron complex for highly sensitive AdSV determination [47]. |
| 4-(2-Pyridylazo)-resorcinol (PAR) | Complexing agent that forms strong, adsorbable complexes with various metals, including In. | AdSV of In at BiFE; the In(III)-PAR complex adsorbs on the electrode for pre-concentration [48]. |
| Acetate Buffer | Supporting electrolyte; provides a stable ionic strength and controlled pH for electrochemical measurements. | Used at pH 3.0 as the medium for both ASV and AdSV procedures for In determination [47]. |
| Nitric Acid (HNO₃) | Acidic supporting electrolyte and sample preservative; prevents hydrolysis and adsorption of metal ions. | Used at pH 1.0 as the medium for SCGD-AES analysis of Ga and In [49]. |
| Hanging Mercury Drop Electrode (HMDE) | Traditional working electrode with a wide cathodic potential window and renewable surface. | Historical reference for achieving the lowest detection limits for Ga in ASV and AdSV [10]. |
This case study demonstrates that both voltammetric and spectroscopic techniques offer viable pathways for the determination of gallium and indium in environmental samples, yet with distinct performance profiles and practical trade-offs.
Voltammetric methods, particularly AdSV with modern bismuth-based electrodes, provide exceptional sensitivity for indium, with detection limits reaching sub-µg L⁻¹ levels, often surpassing the capabilities of compact spectroscopic techniques like SCGD-AES [47] [49]. The minimal sample preparation, low operational cost, and potential for portability make voltammetry a powerful tool for decentralized analysis and routine monitoring. However, the determination of gallium remains more challenging by voltammetry, often requiring mercury electrodes for the best sensitivity, and the techniques can be susceptible to interferences from surface-active compounds [10].
Spectroscopic techniques, especially ICP-MS, offer unrivalled sensitivity and multi-element capability but come with high capital and operational costs, limiting their accessibility [10] [3]. SCGD-AES emerges as a promising compromise, offering portability, lower cost, and no requirement for combustible gases, though with significantly higher detection limits than voltammetry for indium and pronounced matrix effects for gallium [49].
The choice between voltammetry and spectroscopy ultimately depends on the specific analytical requirements: voltammetry is superior for ultra-trace analysis of indium where budget and field deployment are constraints, while spectroscopy is indispensable for high-throughput, multi-element analysis in a centralized laboratory setting. Future developments in electrode materials and compact spectrometer design will continue to push the boundaries of sensitivity and accessibility for monitoring these critical technology elements.
Maximizing Performance: Troubleshooting, Optimization, and Advanced Data Analysis
Voltammetry is a powerful electroanalytical technique where information about an analyte is obtained by measuring current as a function of an applied potential [50] [51]. The resulting plot of current versus potential, called a voltammogram, serves as an electrochemical fingerprint, providing both quantitative and qualitative information about species involved in redox reactions [50]. For trace analysis research, voltammetric techniques—particularly stripping methods that incorporate a preconcentration step—offer exceptional sensitivity, with detection limits extending to parts-per-trillion levels for certain analytes, often surpassing conventional spectroscopic techniques for specific applications [3] [52] [53]. This superior sensitivity makes voltammetry indispensable in fields ranging from environmental monitoring of heavy metals to biomedical sensing [52] [53].
However, the practical application of voltammetry is often hampered by signal distortions and experimental artifacts that can compromise data quality and analytical accuracy. For researchers in drug development and trace analysis, distinguishing between faradaic currents (which originate from redox reactions of the analyte and follow Faraday's law) and capacitive currents (which arise from the charging and discharging of the electrode-solution interface, much like a capacitor) is fundamental to effective troubleshooting [52] [51]. This article systematically diagnoses common voltammetric problems, provides practical protocols for resolution, and contextualizes the performance of voltammetry against spectroscopic alternatives for trace analysis.
Fundamentals of Signal Distortion
Faradaic vs. Capacitive Currents
The measured current in any voltammetric experiment contains two primary components: the faradaic current and the capacitive (or charging) current. The faradaic current (i_f) is the signal of interest, generated by the reduction or oxidation of electroactive species at the working electrode. It is governed by Faraday's law, which states that the moles of substance reacted are proportional to the total charge passed [51]. In contrast, the capacitive current (i_c) is a background component resulting from the rearrangement of ions and solvent molecules at the electrode-solution interface to form the electrical double layer whenever the applied potential changes [52] [51]. This current does not involve electron transfer across the interface and is therefore non-faradaic.
The sensitivity of a voltammetric technique is largely determined by the ratio of faradaic to capacitive current. Since the faradaic current for a diffusion-controlled species decays with time (t) according to 1/t^(1/2) (as described by the Cottrell equation), while the capacitive current decays exponentially, pulse techniques that measure current after a brief delay achieve superior discrimination against the capacitive background [52].
Systematic Troubleshooting Logic
Diagnosing voltammetric issues requires a logical, step-by-step approach to isolate the faulty component. The following diagram outlines a general diagnostic workflow, adapted from procedures suggested by Bard and Faulkner [54].
Figure 1: Logical workflow for diagnosing distorted voltammetric signals.
Common Problems, Diagnoses, and Solutions
Electrode-Based Issues
Electrode-related problems are among the most frequent sources of signal distortion.
Problem 1: Blocked Reference Electrode or Poor Electrical Contact A blocked frit at the tip of the reference electrode or an air bubble isolating the internal element from the solution prevents proper electrical contact [54]. This causes the reference electrode to behave like a capacitor, leading to drifting potentials, unstable currents, and voltammograms that change shape with repeated cycling [54].
- Diagnosis: Perform a test where the reference electrode cable is temporarily connected to the counter electrode (in addition to the counter electrode cable itself). If this results in a more standard-looking voltammogram (albeit shifted in potential and somewhat distorted due to increased uncompensated resistance), the reference electrode is likely the issue [54]. Alternatively, replace the reference electrode with a clean silver wire as a quasi-reference electrode; if this works, the original reference electrode is faulty [54].
- Solution: Check for and remove any air bubbles. If the frit is blocked, consult the manufacturer's instructions for cleaning or re-conditioning, or replace the reference electrode [54].
Problem 2: Fouled or Poorly Connected Working Electrode A contaminated working electrode surface or a poor electrical connection to the potentiostat can severely suppress the faradaic current [54].
- Diagnosis: A very small, noisy, and relatively unchanging current is a strong indicator. If the counter electrode were disconnected, a voltage compliance error would typically occur, so the working electrode is the more likely culprit [54].
- Solution: Ensure the working electrode is properly connected. For solid electrodes (e.g., glassy carbon, platinum), polish the surface meticulously with a fine alumina slurry (e.g., 0.05 µm), followed by thorough rinsing to remove abrasive particles [54]. For a Pt electrode, further cleaning can be achieved by cycling the potential in a 1 M H₂SO₄ solution between the regions where hydrogen and oxygen evolution occur [54].
Problem 3: High Charging Current and Hysteresis The electrode-solution interface acts as a capacitor, which must be charged before the faradaic process can proceed efficiently. This is a fundamental phenomenon, but its effect can be exacerbated by experimental setup [54] [51].
- Diagnosis: A large, reproducible hysteresis in the baseline between forward and backward potential scans is characteristic of significant charging currents [54].
- Solution: To reduce the contribution of charging current, use a smaller working electrode, employ a slower potential scan rate, or increase the concentration of the analyte [54]. Additionally, using pulse voltammetric techniques like Differential Pulse Voltammetry (DPV) or Square Wave Voltammetry (SWV), which discriminate against capacitive current, is highly effective [52].
Instrumental and Compliance Errors
Problem 4: Voltage and Current Compliance Errors Modern potentiostats have operational limits. A "voltage compliance" error indicates the instrument cannot maintain the desired potential between the working and reference electrodes [54]. A "current compliance" error indicates the measured current has exceeded a safe threshold [54].
- Diagnosis: Voltage compliance errors often occur if the counter electrode is disconnected, not submerged in the solution, or if a quasi-reference electrode is touching the working electrode, creating a short [54]. Current compliance errors are typically caused by a direct short circuit between the working and counter electrodes [54].
- Solution: Visually inspect all electrodes to ensure they are properly submerged and not touching each other. Check all cables and connections for integrity [54].
Unexpected Peaks and Sloping Baselines
Problem 5: Unexpected Peaks Peaks that do not correspond to the analyte of interest can appear for several reasons.
- Diagnosis and Solution:
- Edge of the Window: Current rises sharply as the applied potential approaches the solvent or electrolyte's decomposition limit. Run a blank measurement (supporting electrolyte only) to identify the system's valid potential window.
- Impurities: Contaminants from chemicals, the atmosphere, or system components can introduce extraneous peaks. Purity all solution components and ensure a clean experimental setup [54].
- Electrode Faults: Internal poor contacts or poor seals in the electrode can generate spurious peaks [54].
Problem 6: Non-Flat or Sloping Baseline A baseline that is not horizontal can complicate peak identification and current measurement.
- Diagnosis and Solution: This can be caused by high resistance in the working electrode or by unknown processes at the electrode interface [54]. Ensuring a well-designed, properly connected electrode and using a supporting electrolyte at a sufficiently high concentration (typically 0.1 M or greater) to minimize solution resistance can help.
Experimental Protocols for Diagnosis and Validation
General Potentiostat and Cable Test
This protocol verifies the proper functioning of the potentiostat and its connecting cables [54].
- Setup: Disconnect the electrochemical cell. Connect a 10 kΩ resistor between the working electrode cable and the combined reference and counter electrode cables.
- Measurement: Run a linear potential scan (e.g., from -0.5 V to +0.5 V).
- Expected Result: The resulting plot should be a perfectly straight line, with all data points obeying Ohm's Law (V = IR). Any deviation indicates a problem with the potentiostat or cables [54].
- Specialized Test Chips: Some potentiostat systems, like the Ossila system, provide test chips that simulate an electrochemical cell. Connecting to these test chips and running a scan should produce a predefined, predictable current response, confirming the instrument's health [54].
Reference Electrode Functionality Test
This protocol specifically checks the integrity of the reference electrode [54].
- Setup: Set up the electrochemical cell as normal, with the analyte present.
- Modification: Disconnect the reference electrode cable from the reference electrode and connect it directly to the counter electrode (along with the counter electrode's own cable).
- Measurement: Run a linear sweep voltammetry experiment.
- Interpretation: If this configuration produces a somewhat standard voltammetric wave (though shifted and distorted), the original reference electrode is faulty. If no wave appears, the problem likely lies elsewhere [54].
Electrode Cleaning and Polishing Protocol
A critical maintenance procedure for solid working electrodes.
- Materials: Alumina polishing powders (e.g., 1.0, 0.3, and 0.05 µm), polishing cloth, ultrapure water.
- Procedure: On a flat polishing cloth, create a slurry with the finest alumina powder (0.05 µm) and water. Gently polish the electrode surface in a figure-8 pattern for 30-60 seconds. Rise the electrode thoroughly with ultrapure water to remove all alumina residue.
- Electrochemical Activation (for Pt): After polishing, place the electrode in 1 M H₂SO₄. Cycle the potential (e.g., between -0.2 V and +1.2 V vs. Ag/AgCl) until a stable cyclic voltammogram characteristic of a clean Pt surface is obtained.
Essential Research Reagent Solutions
The following table details key materials and reagents required for reliable voltammetric analysis.
Table 1: Key reagents and materials for voltammetric experiments.
| Item | Function/Description | Application Notes |
|---|---|---|
| Supporting Electrolyte (e.g., KCl, KNO₃, LiClO₄) | Minimizes solution resistance ("IR drop") and suppresses analyte migration by carrying the bulk of the current. | Must be inert in the potential window of interest; high purity is essential to avoid impurity signals [54]. |
| Alumina Polishing Powder (0.05 µm) | Abrasive for resurfacing and cleaning solid working electrodes (glassy carbon, Pt, Au). | Removes adsorbed contaminants and exposes a fresh, reproducible electrode surface [54]. |
| Reference Electrodes (Ag/AgCl, Saturated Calomel - SCE) | Provides a stable, fixed potential against which the working electrode potential is controlled. | Ensure the salt bridge (frit) is not clogged. Store according to manufacturer specifications [50] [54]. |
| Mercury Electrodes (DME, HMDE, MFE) | Working electrode with a high hydrogen overpotential, useful for reducing species like Zn²⁺ and for forming amalgams with metals. | DME offers a renewable surface; HMDE is static. Being oxidized at positive potentials is a limitation [50]. |
| Solvent (Water, Acetonitrile, DMF) | Dissolves analyte and electrolyte. | Must be thoroughly deoxygenated with an inert gas (e.g., N₂, Ar) before measurement to remove interfering O₂ [54]. |
Voltammetry vs. Spectroscopy for Trace Analysis: An Objective Comparison
The choice between voltammetry and spectroscopy for trace analysis depends on the specific analytical requirements. The following table provides a structured comparison based on key performance metrics, drawing from recent research applications.
Table 2: Performance comparison of voltammetry and spectroscopic techniques for trace analysis.
| Analytical Parameter | Voltammetric Techniques | Spectroscopic Techniques (ICP-MS, ICP-OES) | Supporting Experimental Data |
|---|---|---|---|
| Sensitivity (LOD) | Extremely high for electroactive species. LODs at ppb and sub-ppb levels are common with stripping methods [3] [52]. | Excellent. ICP-MS offers ppt and sub-ppt LODs for most metals [3]. | ASV detected Cu(II) release from electrodes at 0.016 ppm (16 ppb) [53]. AdSV used for REEs at trace levels [3]. |
| Selectivity | Good to excellent. Derived from the unique redox potential of each analyte and the use of complexing agents [55]. | High for elements, but can suffer from spectral interferences (ICP-MS) and matrix effects (ICP-OES) [3]. | AdSV procedures enable determination of specific REEs (e.g., Ce, Eu) in mixtures with other lanthanides [3]. |
| Analysis Speed & Cost | Rapid analysis (seconds-minutes); relatively low-cost instrumentation suitable for portability [52] [55] [53]. | Typically slower, requires extensive sample preparation; instrumentation is expensive and lab-bound [3]. | Voltammetry highlighted for cost-effectiveness and suitability for portable devices for on-site analysis [53]. |
| Multi-Element Capability | Limited. Typically sequential analysis of a few analytes, requiring distinct redox potentials. | Excellent. Simultaneous multi-element analysis is a key strength [3]. | ICP-MS/OES are standard for profiling multiple REEs simultaneously, whereas voltammetry focuses on individual/specific REEs [3]. |
| Matrix Tolerance | Moderate. Complex matrices can foul electrodes or cause interferences. Sample pretreatment is often needed [3]. | Moderate to High. Matrix effects exist but can be managed with internal standards and dilution. Solid samples require digestion [3]. | Voltammetric determination of REEs in real samples (water, soil) requires careful consideration of inorganic and organic interferents [3]. |
The experimental data clearly demonstrates that voltammetry, particularly stripping voltammetry, is a superior choice for detecting specific electroactive analytes at trace levels when cost, portability, and speed are critical. Its ability to perform direct analysis in low-conductivity media with minimal sample preparation offers a distinct advantage for field deployment [53]. Conversely, spectroscopic techniques remain the gold standard for comprehensive, multi-element analysis where budget and laboratory infrastructure are not limiting factors.
Diagnosing and resolving distorted signals in voltammetry is a systematic process that requires a deep understanding of both instrumental operation and fundamental electrochemical principles. By methodically isolating problems related to electrodes, instrumentation, and experimental conditions, researchers can reliably obtain high-quality data. Within the broader context of trace analysis, voltammetry carves out a critical niche, offering a unique combination of extreme sensitivity, selectivity, and operational flexibility that often surpasses spectroscopic methods for specific, electroactive targets. As advancements in electrode materials and waveform design continue to emerge, the value proposition of voltammetry for researchers in drug development and environmental science is poised to grow even further.
In the field of trace analysis, the selection of an appropriate analytical technique is paramount. Electrochemical methods, particularly voltammetry, and spectroscopic techniques often represent two divergent paths, each with distinct advantages and optimization philosophies. This guide provides a systematic comparison of these methodologies, focusing on the critical optimization parameters in voltammetry—scan rate, accumulation time, and potential—while contextualizing their performance against common spectroscopic alternatives. For trace metal analysis, voltammetric methods achieve exceptional sensitivity through built-in preconcentration steps, allowing them to directly determine metal species and their bioavailability in complex matrices like natural waters [2]. In contrast, spectroscopic techniques like ICP-MS and ICP-OES excel at multi-element total concentration analysis but typically require coupling with separation systems for speciation studies and cannot directly differentiate between labile and inert metal complexes [2] [3].
The optimization approach for each technique reflects its fundamental operating principles. Voltammetry optimization focuses on electrochemical cell parameters that enhance signal generation from specific chemical species, while spectroscopy optimization prioritizes instrumental parameters that maximize atomization, excitation, or ionization efficiency across multiple elements simultaneously. This guide presents experimentally validated protocols for optimizing key voltammetric parameters, supported by comparative data illustrating how properly optimized voltammetry achieves performance competitive with spectroscopic methods for specific trace analysis applications, particularly metal speciation studies in environmental and pharmaceutical research.
Comparative Analytical Framework: Voltammetry vs. Spectroscopy
Fundamental Differences and Operational Characteristics
Table 1: Core Characteristics of Analytical Techniques for Trace Analysis
| Parameter | Voltammetric Techniques | Spectroscopic Techniques (ICP-MS/OES) |
|---|---|---|
| Primary Application in Trace Analysis | Metal speciation, labile fraction determination, bioavailability studies | Total element concentration analysis, multi-element screening |
| Sample Preparation | Minimal; often direct analysis possible | Typically requires digestion; risk of contamination or species alteration |
| Speciation Analysis Capability | Direct through operational discrimination | Requires coupling with separation techniques (e.g., HPLC) |
| Detection Limit Range | ppt to ppb levels for many metals [2] | ppt to ppb levels (varies by element) [3] |
| Organic Matrix Effects | Can be significant; addressed with modifiers | Less pronounced with proper digestion |
| Portability & Cost | Portable systems available; generally lower cost [3] | Typically benchtop systems; higher capital and operational costs |
| Key Strength | Chemical speciation information, bioavailability assessment | High-throughput multi-element analysis, wide dynamic range |
Visualization of Technique Selection Pathways
The following diagram outlines the decision-making process for selecting between voltammetry and spectroscopy based on research objectives and sample characteristics:
Decision Workflow for Analytical Technique Selection
Optimizing Critical Voltammetric Parameters
Scan Rate Optimization: Balancing Sensitivity and Kinetics
Scan rate (ν) significantly influences voltammetric response by controlling the interplay between electron transfer kinetics and diffusion processes. According to the Randles-Ševčík equation for reversible systems, peak current (ip) increases with the square root of scan rate (ip ∝ ν1/2), indicating diffusion-controlled processes [56]. This relationship provides a diagnostic tool for understanding reaction mechanisms.
Table 2: Scan Rate Optimization Guidelines for Different Applications
| Application Domain | Recommended Scan Range | Optimal Value | Experimental Observation | Impact on Detection Limit |
|---|---|---|---|---|
| Reversible System Analysis | 0.01 - 0.5 V/s | 0.1 V/s | ΔEp independent of scan rate ~59/n mV [56] | Lower scan rates improve LOD for diffusion-controlled systems |
| Quasi-Reversible Kinetics | 0.1 - 5 V/s | 1-2 V/s | Peak separation increases with scan rate [57] | Medium scan rates optimize kinetics vs. diffusion balance |
| Adsorption-Controlled Processes | 0.01 - 0.1 V/s | 0.05 V/s | ip directly proportional to ν [58] | Lower scan rates enhance adsorption time, lowering LOD |
| Ultrafast Kinetics (Microelectrodes) | 1 - 10,000 V/s | 100-1,000 V/s | Reduced ohmic drop and charging current [56] | Higher scan rates enable detection of short-lived intermediates |
| Square-Wave Voltammetry | 10 - 500 Hz (equiv.) | 50 Hz | Enhanced sensitivity via current sampling [59] | Frequency optimization crucial for LOD improvement |
For square-wave voltammetry (SWV), frequency (f) serves an analogous role to scan rate in cyclic voltammetry. The dimensionless kinetic parameter κ = ks/√(Df) determines the technique's sensitivity to electron transfer kinetics, where ks is the standard rate constant and D is the diffusion coefficient [59]. Optimal frequency selection depends on the studied system's reversibility, with lower frequencies (≤ 50 Hz) preferred for irreversible systems and higher frequencies (≥ 100 Hz) suitable for reversible systems.
Accumulation Time: Maximizing Preconcentration Efficiency
In stripping techniques, accumulation time directly controls the amount of analyte preconcentrated at the electrode surface, significantly impacting sensitivity. The relationship is generally linear up to a saturation point where electrode coverage becomes complete or competitive adsorption occurs.
Table 3: Accumulation Time Optimization in Stripping Voltammetry
| Technique & Analyte | Electrode System | Optimal Accumulation Time | Signal Enhancement Factor | Linear Range | Reference |
|---|---|---|---|---|---|
| AdSV for Ga(III) | Hg(Ag)FE | 60 s | 12x vs. no accumulation | 1.25×10⁻⁹ – 9.0×10⁻⁸ M | [11] |
| AdSV for Ga(III) | PbFE/MWCNT/SGCE | 60 s | ~15x vs. no accumulation | 3.0×10⁻⁹–4.0×10⁻⁷ M | [11] |
| ASV for Trace Metals | HMDE | 300 s | >20x vs. no accumulation | Sub-nM range | [2] |
| AdSV for REEs | Mercury-based | 30-120 s | 10-30x depending on ligand | nM range | [3] |
Experimental evidence demonstrates that extending accumulation time from 30 seconds to 300 seconds can improve detection limits by more than an order of magnitude, from sub-nM to pM concentrations for metals like Cd, Pb, and Cu using ASV [2]. However, excessive accumulation can lead to nonlinear response, electrode fouling, and increased analysis time. The optimal value represents a compromise between sensitivity and practical analysis constraints.
Potential Parameters: Fine-Tuning Electrochemical Response
Potential optimization encompasses multiple parameters including deposition potential, stripping window, and pulse characteristics in modern voltammetric techniques. Proper selection ensures complete deposition without inducing competing reactions or causing electrode damage.
For mercury electrodes, the accessible potential window ranges from approximately -0.3 V to +0.4 V versus SCE in aqueous solutions, with a high overpotential for hydrogen evolution enabling determination of elements like Zn at negative potentials (-1 V vs. SCE) [50]. Solid electrodes offer different potential windows, with carbon electrodes typically spanning -1.0 V to +1.0 V versus Ag/AgCl in aqueous media.
In square-wave voltammetry, the amplitude (typically 25-50 mV) and step potential (1-10 mV) significantly influence peak shape and sensitivity. Larger amplitudes increase peak current but decrease resolution, while smaller step potentials improve definition at the cost of longer analysis times [59]. For catalytic EC′ mechanisms, SWV has demonstrated superior performance for kinetic characterization compared to newer techniques like multi-frequency electrochemical Faradaic spectroscopy (MEFS) [59].
Experimental Protocols for Parameter Optimization
Systematic Scan Rate Optimization Protocol
Initial Setup: Prepare electrode system and electrolyte solution containing analyte at concentration sufficient for detection across multiple scan rates (typically 0.1-1 mM).
Preliminary Scan: Run cyclic voltammogram at intermediate scan rate (0.1 V/s) to identify approximate peak potentials and verify system stability.
Scan Rate Series: Collect voltammograms across a wide range of scan rates (0.01 V/s to 10 V/s, with minimum 8-10 values spaced logarithmically).
Data Analysis:
- Plot ip vs. ν1/2 for diffusion-controlled processes (linear relationship indicates reversibility)
- Plot ip vs. ν for adsorption-controlled processes
- Calculate ΔEp for each scan rate to assess reversibility (ΔEp ≈ 59/n mV for reversible systems)
Optimal Selection: Choose scan rate that provides adequate peak separation (for quantification) or fastest possible scan (for kinetic studies) while maintaining acceptable signal-to-noise ratio.
Accumulation Time Optimization Protocol for Stripping Voltammetry
Electrode Preparation: Condition working electrode according to established procedures for the specific electrode type.
Time Series Experiment: Fix all other parameters (deposition potential, stirring rate, electrolyte composition) while varying accumulation time across a wide range (e.g., 5, 15, 30, 60, 120, 240, 480 seconds).
Stripping Measurement: Apply optimized stripping waveform after each accumulation period and record peak current.
Saturation Point Determination: Plot peak current versus accumulation time and identify the point where signal increase deviates from linearity (indicating surface saturation).
Practical Selection: Choose accumulation time slightly below saturation point to maintain linear response while maximizing sensitivity. For example, in Ga(III) determination using AdSV with Hg(Ag)FE, 60 seconds provides optimal sensitivity without surface saturation issues [11].
Complete Voltammetric Procedure for Trace Metal Analysis
The following workflow illustrates a comprehensive optimized procedure for trace metal detection using stripping voltammetry:
Optimized Voltammetric Analysis Workflow
Performance Comparison: Optimized Voltammetry vs. Spectroscopy
Detection Capabilities for Environmentally Significant Metals
Table 4: Comparative Analytical Performance for Trace Metal Detection
| Analyte | Technique | Optimal Conditions | Achieved LOD | Linear Range | Key Advantage |
|---|---|---|---|---|---|
| Copper (Cu) | CLE-AdCSV | Ligand competition, pH control | 0.05 nM | 0.1-50 nM | Labile fraction quantification [2] |
| Copper (Cu) | ICP-MS | Nebulization, plasma ionization | 0.02 nM | 0.05-1000 nM | Total Cu determination [2] |
| Iron (Fe) | CLE-AdCSV | Ligand competition (e.g., TAC) | 0.05 nM | 0.1-25 nM | Fe speciation (Fe(II)/Fe(III)) [2] |
| Iron (Fe) | ICP-OES | High-temperature plasma | 1.0 nM | 5-5000 nM | Multi-element capability [2] |
| Gallium (Ga) | AdSV | Hg(Ag)FE, catechol, 60 s accumulation | 0.36 nM | 1.25-90 nM | Portable, low-cost analysis [11] |
| Gallium (Ga) | ICP-MS | Sample introduction optimization | 0.02 nM | 0.05-500 nM | Ultra-trace determination [11] |
| Rare Earth Elements | AdSV | Complexation (e.g., alizarin) | 0.1-1 nM | 1-1000 nM | Individual REE speciation [3] |
| Rare Earth Elements | ICP-MS | Mass discrimination | 0.01-0.1 pM | 0.1-1000 nM | Complete REE pattern analysis [3] |
Matrix Effects and Interference Management
Voltammetric techniques exhibit particular sensitivity to matrix effects, which must be addressed during method optimization:
Organic Interferences: Surfactants like Triton X-100 can significantly suppress voltammetric signals by blocking electrode surfaces, requiring standard addition quantification [11].
Metal Competition: Competing metals (e.g., Cu(II), Fe(III), Al(III)) can interfere in AdSV by complexing with the added ligand, addressed using masking agents [3] [11].
Organic Ligands: Natural organic matter (NOM) affects metal speciation in CLE-AdCSV, which is leveraged to determine complexation capacity and conditional stability constants [2].
Spectroscopic techniques face different matrix challenges, primarily spectral interferences (isobaric overlaps in ICP-MS) and nonspecific attenuation of signals, typically addressed through internal standardization, collision/reaction cells, and matrix-matched calibration.
Essential Research Reagent Solutions
Table 5: Key Reagents and Materials for Voltammetric Analysis
| Reagent/Material | Function/Purpose | Application Examples | Optimization Considerations |
|---|---|---|---|
| Supporting Electrolyte | Provide ionic conductivity; control pH; minimize migration current | Acetate buffer (pH 4.5-5.6); ammonia buffer; perchlorate salts | Ionic strength affects complexation; pH critical for metal-ligand stability |
| Complexing Agents | Form electroactive complexes with target analytes | Catechol (Ga); Cupferron (Ga, REEs); Alizarin (REEs) | Concentration optimization crucial; excess may dissolve Hg electrode |
| Electrode Modifiers | Enhance sensitivity and selectivity | MWCNTs (increase surface area); Bismuth films (replace mercury) | Film thickness affects electron transfer; stability over multiple scans |
| Masking Agents | Suppress interference from competing metals | Cyanide (masks Cu); Fluoride (masks Al, Fe) | Must not complex target analyte; concentration optimization required |
| Standard Solutions | Calibration and recovery studies | High-purity metal standards in acidic matrix | Fresh preparation recommended; avoid adsorption to container walls |
| Quality Control Materials | Validate method accuracy | Certified Reference Materials (CRMs) | Matrix-matched CRMs ideal; otherwise, standard addition method |
The optimization of scan rate, accumulation time, and potential parameters enables voltammetric techniques to achieve exceptional sensitivity competitive with spectroscopic methods for trace metal analysis, while providing unique speciation information unavailable through most spectroscopic approaches. Properly optimized voltammetry achieves detection limits in the nanomolar to picomolar range for environmentally and pharmaceutically significant metals including Cu, Fe, Ga, and rare earth elements [2] [3] [11].
The distinctive advantage of voltammetry remains its capability for direct metal speciation analysis, distinguishing between labile and inert complexes, determining redox states, and assessing bioavailability—all with minimal sample perturbation and modest instrumentation costs [2]. Spectroscopy maintains advantages in multi-element analysis throughput, wider dynamic range, and generally simpler operational protocols when total elemental concentrations suffice.
Selection between these techniques should be guided by research objectives: voltammetry for studies requiring chemical speciation information or portable analysis capabilities, and spectroscopy for high-throughput total element determination or comprehensive multi-element screening. For complete characterization, the techniques often provide complementary information when applied to complex samples, with voltammetry illuminating chemical speciation and spectroscopy providing comprehensive elemental inventories.
The accurate determination of trace heavy metals and organic pollutants is a cornerstone of environmental monitoring, industrial process control, and toxicological research. Analytical chemists pursuing this goal must navigate a complex landscape of methodological choices, with the perennial debate often centering on voltammetry versus spectroscopy for trace analysis. While spectroscopic techniques like ICP-MS and AAS offer excellent sensitivity, voltammetric methods provide compelling advantages in terms of cost-effectiveness, portability, and operational simplicity [8]. However, a significant challenge persists across both methodologies: analytical interference from complex sample matrices.
The presence of surfactants, organic matter, and competing ions can substantially compromise analytical accuracy by altering electrochemical responses, masking target signals, or modifying chemical speciation. This article provides a comprehensive comparison of interference-combating strategies, with a specific focus on their application in voltammetric analysis. Through systematic evaluation of experimental data and remediation protocols, we aim to equip researchers with practical solutions for maintaining analytical integrity in complex environmental and biological samples.
Voltammetry vs. Spectroscopy: An Interference Perspective
Fundamental Differences in Interference Mechanisms
The core distinction between voltammetric and spectroscopic techniques lies in their fundamental interaction with interferents. Voltammetry primarily suffers from electrode surface effects, where surfactants and organic macromolecules adsorb onto the working electrode, creating a physical barrier that inhibits electron transfer and analyte access [60] [61] [62]. This surface fouling manifests as signal suppression or complete disappearance of voltammetric peaks, particularly in stripping techniques that rely on preconcentration steps.
In contrast, spectroscopic techniques like ICP-MS and AAS are predominantly affected by bulk matrix effects, including spectral overlaps, plasma instability, and transport phenomena. While spectroscopic methods generally tolerate organic matrices better than voltammetry, they require costlier instrumentation, specialized operation, and complex sample introduction systems [8] [61], limiting their deployment for routine or field-based analysis.
Table 1: Comparative Analysis of Voltammetry and Spectroscopy for Trace Metal Determination
| Parameter | Voltammetric Techniques | Spectroscopic Techniques (ICP-MS, AAS) |
|---|---|---|
| Detection Limits | ppt-ppb range [11] [3] | ppb-ppt range (varies by element) |
| Equipment Cost | Relatively low [8] [61] | High [61] |
| Portability | Excellent for field deployment [8] | Limited (lab-based) |
| Susceptibility to Surfactants | High (electrode fouling) [60] [61] [62] | Moderate (nebulizer/plasma effects) |
| Sample Throughput | Moderate | High |
| Operational Complexity | Low to moderate | High (requires specialized training) |
| Multi-element Capability | Limited (without modification) | Excellent |
The Case for Voltammetry in Resource-Limited Settings
Despite its susceptibility to matrix effects, voltammetry remains the technique of choice for many applications due to its exceptional sensitivity, portability, and cost-effectiveness [8]. The development of robust interference mitigation strategies has further strengthened the position of voltammetry in modern analytical workflows, particularly for routine monitoring of heavy metals in environmental samples [8] [61]. When properly implemented with appropriate sample pre-treatment, voltammetry can achieve detection limits comparable to spectroscopic methods while offering the distinct advantage of speciation analysis capability without sophisticated hyphenated systems.
Surfactant Interferences: Mechanisms and Remediation
Surfactant Classification and Interference Mechanisms
Surfactants represent a particularly challenging class of interferents due to their amphiphilic nature and tendency to accumulate at interfaces. Their impact on voltammetric analysis varies significantly based on their molecular structure and charge characteristics.
Table 2: Effect of Surfactant Type on Voltammetric Signals of Heavy Metals
| Surfactant Type | Example | Impact on Voltammetric Signal | Proposed Mechanism |
|---|---|---|---|
| Cationic | CTAB, CTAC [60] [61] | Signal suppression | Electrode surface blocking by adsorbed surfactant molecules [62] |
| Anionic | SDS, DSS [60] | Variable (suppression or enhancement) | Formation of electroactive or electroinactive complexes with metal ions [62] |
| Non-ionic | Triton X-100, Tweens [60] [61] | Signal suppression | Competitive adsorption at electrode surface [60] |
| Biosurfactants | Rhamnolipids [61] | Signal suppression | Adsorption at electrode interface |
The interference mechanism varies with surfactant class. Cationic surfactants like cetyltrimethylammonium bromide (CTAB) typically cause signal suppression through electrostatic repulsion of positively charged metal ions and physical blocking of electrode active sites [60]. Anionic surfactants such as sodium dodecyl sulfate (SDS) may form complexes with metal ions, potentially leading to either signal enhancement or suppression depending on the electrochemical activity of the resulting complex [62]. Non-ionic surfactants like Triton X-100 primarily interfere through hydrophobic adsorption at the electrode surface, creating a barrier that impedes analyte access [60].
Strategies for Surfactant Interference Elimination
Multiple approaches have been developed to mitigate surfactant interferences in voltammetric analysis:
Amberlite XAD Resin Treatment: Mixing samples with macroreticular Amberlite XAD resins (particularly XAD-7) effectively removes surfactants through hydrophobic adsorption [60] [61]. The procedure involves adding 0.5 g of resin to 10 mL of sample, followed by agitation for 5 minutes. Recent research demonstrates that elevated temperature (60°C) during this process significantly enhances surfactant removal efficiency for all surfactant classes [61].
Alternative Remediation Approaches: Additional strategies include:
- UV Photolysis: Mineralizes organic interferents through radical-mediated oxidation [61]
- Colloidal Silica Treatment: Adsorbs surfactants through electrostatic and hydrophobic interactions [61]
- Electrode Modification: Development of anti-fouling electrode surfaces with engineered coatings
The optimization of resin treatment parameters has yielded significant improvements in interference removal. As demonstrated in one systematic study, increasing the temperature during XAD-7 treatment to 60°C enhanced Cr(VI) signal recovery in surfactant-containing solutions from approximately 70% to over 90% for non-ionic surfactants, and from 40% to 80% for cationic surfactants [61].
Diagram 1: Surfactant removal workflow using Amberlite XAD-7 resin at elevated temperature
Organic Matter Interferences: Challenges and Solutions
Complexity of Organic Matrix Effects
Natural organic matter (NOM), including humic substances, proteins, and polysaccharides, presents multifaceted challenges for voltammetric analysis. These macromolecules can complex with target analytes, modifying their electrochemical behavior, or adsorb directly onto electrode surfaces, causing fouling that reduces analytical sensitivity and reproducibility [63]. The presence of lignocellulosic materials in environmental samples further complicates analysis by increasing matrix complexity [63].
In pharmaceutical and biological matrices, proteins and phospholipids represent the primary interfering organic constituents. These biomacromolecules can deposit on electrode surfaces during analysis, progressively diminishing electrode response through a fouling mechanism that is particularly problematic in stripping voltammetry where pre-concentration steps are employed.
Advanced Sample Preparation Techniques
Sophisticated sample preparation methodologies have been developed to address organic matter interferences:
Solid Phase Extraction (SPE): Utilizes functionalized sorbents to selectively isolate target analytes while excluding interfering organic macromolecules. SPE methods can be optimized to retain specific metal complexes or organic pollutants, effectively pre-concentrating analytes and purifying samples in a single step [63].
Passive Sampling Techniques: Devices like Polar Organic Chemical Integrative Samplers (POCIS) and Semi-Permeable Membrane Devices (SPMD) combine time-integrated sampling with matrix clean-up [63]. These systems accumulate target analytes while excluding bulk organic matter, simultaneously addressing sampling and interference challenges.
Enzymatic Digestion: For biological samples, enzymatic treatments using proteases or lipases can selectively degrade interfering macromolecules without affecting target metal species or organic analytes, preserving their original chemical form for accurate quantification.
Competing Ions and Cross-Element Interferences
Complexation-Based Selectivity Enhancement
The simultaneous determination of multiple metal ions presents significant challenges due to overlapping voltammetric signals. Strategic use of complexing agents provides a powerful approach to overcome this limitation by shifting peak potentials and improving resolution between adjacent signals [11] [3].
For rare earth elements (REEs), which exhibit remarkably similar electrochemical properties, complexation with ligands such as cupferron, catechol, or Alizarin Red S enables individual quantification through the formation of electroactive complexes with distinct adsorption and reduction characteristics [3]. Similar approaches facilitate the speciation of chromium, where complexation with diethylenetriaminepentaacetic acid (DTPA) allows selective determination of Cr(VI) in the presence of Cr(III) [61].
Table 3: Complexing Agents for Selective Voltammetric Determination of Metal Ions
| Target Metal | Complexing Agent | Technique | Linear Range (mol L⁻¹) | LOD (mol L⁻¹) | Key Interferents |
|---|---|---|---|---|---|
| Ga(III) | Cupferron [11] | AdSV | 3.0×10⁻⁹ – 4.0×10⁻⁷ | 9.5×10⁻¹⁰ | Al(III), Fe(III), Cu(II) |
| Ga(III) | Catechol [11] | AdSV | 1.25×10⁻⁹ – 9.0×10⁻⁸ | 3.6×10⁻¹⁰ | Fe(III), Cu(II) |
| Cr(VI) | DTPA [61] | AdSV | Not specified | Not specified | Surfactants |
| Rare Earth Elements | Various ligands [3] | AdSV | Varies by element | 10⁻⁹ – 10⁻¹¹ | Other REEs |
Electrode Modification and Material Innovation
The strategic design of working electrodes represents another powerful approach to address competing ion interferences. Chemically modified electrodes with selective recognition elements can significantly enhance analytical specificity:
- Bismuth Film Electrodes: Offer well-defined stripping signals with reduced oxygen interference compared to mercury electrodes [60]
- Nanomaterial-Modified Electrodes: Incorporation of carbon nanotubes, graphene, or metal nanoparticles increases active surface area and can provide catalytic effects that improve resolution between adjacent peaks [11] [8]
- Molecularly Imprinted Polymers: Create synthetic recognition sites tailored to specific metal complexes, offering exceptional selectivity in complex matrices [3]
Diagram 2: Competitive ion interference mitigation through selective complexation
Experimental Protocols: Best Practices for Interference Management
Standardized Procedure for Surfactant Removal
For environmental water samples containing unknown surfactant contamination, the following protocol is recommended:
- Sample Pre-treatment: Transfer 10 mL of sample to a clean vial
- Resin Addition: Add 0.5 g of Amberlite XAD-7 resin
- Temperature-Controlled Mixing: Agitate vigorously for 5 minutes at 60°C
- Resin Separation: Allow resin to settle or use gentle filtration
- Buffer Adjustment: Mix treated sample with supporting electrolyte (e.g., acetate buffer, pH 4.5-6.2)
- Voltammetric Analysis: Perform measurement using appropriate technique and parameters
This procedure has demonstrated effectiveness in recovering >90% of metal species across various surfactant classes while maintaining analytical precision (RSD 3.4-6.2%) [60] [61].
Method Validation and Quality Control
Robust method validation is essential when implementing interference mitigation strategies:
- Spike Recovery Experiments: Should yield 95-105% recovery for target analytes
- Standard Addition Method: Compensates for residual matrix effects after pre-treatment
- Multiple Internal Standards: Monitor analytical performance across different analyte classes
- Blank Monitoring: Ensure pre-treatment reagents don't introduce contamination
The Scientist's Toolkit: Essential Research Reagents
Table 4: Key Reagents and Materials for Interference Management in Voltammetric Analysis
| Reagent/Material | Function | Application Examples |
|---|---|---|
| Amberlite XAD-7 Resin | Hydrophobic adsorption of surfactants | Removal of Triton X-100, SDS, CTAB from water samples [60] [61] |
| Cupferron | Complexing agent for Ga(III), In(III), Fe(III) | Selective determination of gallium in environmental samples [11] |
| DTPA | Complexing agent for Cr(VI) | Speciation of chromium in surfactant-containing waters [61] |
| Acetate Buffer | Supporting electrolyte | pH control and conductive medium for metal determination [11] [61] |
| Bismuth Film | Environmentally friendly electrode modifier | Replacement for mercury electrodes in stripping analysis [60] |
| Multiwalled Carbon Nanotubes | Electrode modifier enhancing surface area | Signal enhancement in modified carbon paste electrodes [11] [8] |
The strategic management of interferences from surfactants, organic matter, and competing ions represents a critical frontier in advancing voltammetric analysis. Through systematic comparison of remediation approaches, this review demonstrates that integrated mitigation strategies combining sample pre-treatment, selective complexation, and electrode engineering can effectively preserve the inherent advantages of voltammetry while minimizing its susceptibility to matrix effects.
The experimental data presented reveals that simple, cost-effective approaches like Amberlite XAD-7 resin treatment at elevated temperatures can achieve surfactant removal efficiencies exceeding 90%, while strategic complexation protocols enable remarkable selectivity even for challenging determinations like rare earth elements in mixed solutions. These developments strengthen the position of voltammetry as a versatile analytical platform that balances sensitivity, selectivity, and practical accessibility.
As analytical challenges continue to evolve with increasing demand for trace-level determinations in complex matrices, the continued refinement of these interference management strategies will be essential. Future developments will likely focus on designing increasingly selective electrode interfaces, optimizing green chemistry approaches for sample preparation, and integrating automated pre-treatment systems for high-throughput analysis. Through these innovations, voltammetry will maintain its vital role in the analytical toolkit for environmental monitoring, pharmaceutical development, and toxicological assessment.
Advanced Electrode Characterization with EIS and CV
In the field of trace analysis, the choice of characterization technique significantly impacts the quality, speed, and cost of research. Electrochemical techniques, particularly Electrochemical Impedance Spectroscopy (EIS) and Cyclic Voltammetry (CV), offer distinct advantages for electrode characterization compared to traditional spectroscopic methods. While spectroscopic techniques like UV-Vis and HPLC are well-established for drug release quantification and trace metal analysis, they often involve destructive sampling, complex preparation, and costly instrumentation [64] [2]. Electrochemical methods provide a non-destructive, rapid, and information-rich alternative, enabling real-time monitoring of dynamic processes at the electrode-electrolyte interface with high sensitivity [64] [65].
This guide objectively compares the performance of EIS and CV against each other and against traditional spectroscopic methods, providing researchers with experimental data and protocols to inform their characterization strategy selection.
Fundamental Principles and Direct Comparative Analysis
EIS and CV probe different aspects of electrode behavior, making them complementary techniques. The table below summarizes their core characteristics and comparative performance.
Table 1: Fundamental comparison between EIS and CV techniques.
| Feature | Electrochemical Impedance Spectroscopy (EIS) | Cyclic Voltammetry (CV) |
|---|---|---|
| Core Principle | Applies a small AC potential over a range of frequencies to measure impedance (Z) [64] [66]. | Scans potential linearly versus time and measures resulting current [67]. |
| Primary Output | Nyquist plot (Z' vs Z'') and Bode plot [66]. | Current vs. Potential plot (voltammogram) [67]. |
| Information Obtained | Charge transfer resistance, double-layer capacitance, diffusion processes, and reaction kinetics [64] [66]. | Redox potentials, electron transfer kinetics, and qualitative reaction mechanisms [68] [67]. |
| Typical Experiment Duration | Minutes to tens of minutes (multi-frequency measurement). | Seconds to minutes (single scan). |
| Key Advantage | Quantifies individual physical processes via equivalent circuit modeling [66]. | Provides immediate visual insight into redox activity [69]. |
| Key Limitation | Data interpretation requires complex modeling [66]. | Less effective for quantifying capacitive versus faradaic contributions. |
Performance Comparison with Spectroscopic Techniques
To objectively evaluate their position in the analytical toolkit, the performance of EIS and CV is compared against standard spectroscopic methods.
Table 2: Performance comparison of electrochemical vs. spectroscopic techniques for trace analysis.
| Technique | Sensitivity | Temporal Resolution | Destructive? | Quantification Capability | Key Application Example |
|---|---|---|---|---|---|
| EIS | High (e.g., drug release monitoring) [64] | Excellent (real-time, in-situ) [64] | No [64] | Excellent, with modeling [66] | In-situ drug release from cements [64] |
| CV | High (e.g., µM drug detection) [69] | Good (single scan) | No | Good, with calibration | Detection of illicit drugs in oral fluid [69] |
| UV-Vis Spectroscopy | Moderate | Poor (requires sample aliquots) [64] | Yes (sample loss) [64] | Excellent | Traditional drug release validation [64] |
| HPLC | Very High | Poor (requires sample aliquots) | Yes | Excellent | Standard for complex mixture separation and analysis [2] |
Electrochemical methods provide a significant advantage in real-time, non-destructive testing. For instance, EIS has been successfully used as an "instant technique" to quantify drug delivery profiles from calcium phosphate cement, a task traditionally performed by UV-Vis which risks sample loss and lacks instantaneous results [64]. CV excels in rapid, sensitive detection of electroactive species, such as achieving sub-micromolar detection limits for illicit drugs in oral fluid [69].
Experimental Protocols for Key Applications
Protocol: In-situ Drug Release Monitoring via EIS
This protocol is adapted from a study on measuring gentamicin sulfate and lidocaine hydrochloride release from α-tricalcium phosphate cement [64].
- Objective: To non-destructively quantify the profile of drug release from a ceramic biomaterial matrix in real-time.
- Materials:
- Working Electrode: Platinum wire (diameter 0.25 mm, length 40 mm) [64].
- Counter Electrode: Platinum plate (8 x 34 mm, thickness 0.25 mm) [64].
- Reference Electrode: Not specified in source, but Ag/AgCl is typical for such systems.
- Electrochemical Cell: Custom glass cell with cork cover, containing 10 mL of Phosphate Buffer Saline (PBS, pH 7.4) as the release medium, maintained at 37°C with magnetic stirring [64].
- Sample: Set cement samples (e.g., 12 mm height, 6 mm diameter) containing 1% gentamicin sulfate or 2% lidocaine hydrochloride [64].
- Methodology:
- Setup: Place the cement sample in the electrochemical cell, suspended in PBS using a polyethylene raschel mesh to ensure full surface exposure [64].
- BIAS Selection: Perform a preliminary DC potential (BIAS) variation or Cyclic Voltammetry (from -2 V to 2 V) to identify the potential region of maximum current response with minimal applied potential variation [64].
- EIS Measurement: Conduct EIS measurements at selected time intervals (e.g., first 8 h, then 24, 48, and 72 h). A typical EIS setup uses a small AC potential amplitude (e.g., 10 mV) over a frequency range from 100 kHz to 10 mHz [64].
- Data Analysis: Fit the obtained impedance spectra to an equivalent circuit model. The change in circuit parameters (e.g., charge transfer resistance) correlates with the drug concentration released into the medium and can be used to construct a release profile [64].
Protocol: Detection of Illicit Drugs via Surfactant-Enhanced CV
This protocol is based on research for detecting drugs like cocaine and MDMA in oral fluid using surfactant-mediated solution [69].
- Objective: To sensitively detect and quantify illicit drugs in a complex biological matrix using an unmodified screen-printed electrode.
- Materials:
- Working Electrode: Unmodified carbon Screen-Printed Electrode (SPE) [69].
- Counter/Reference Electrode: Integrated carbon and silver electrodes on the SPE chip [69].
- Surfactant Solution: 0.1 mM Sodium Dodecyl Sulfate (SDS) in 0.1 M PBS, pH 7 [69].
- Drug Standards: Prepared in SDS solution from stock standard solutions [69].
- Methodology:
- Electrode Preparation: Use an unmodified SPE. The addition of SDS to the solution eliminates the need for complex electrode functionalization [69].
- Optimization: Optimize pH and adsorption time. A pH of 7.0 and an adsorption time of 120 s under stirring were found optimal for several drugs [69].
- CV Measurement:
- Place a 50 µL drop of the sample (in 0.1 mM SDS) on the SPE.
- Perform Cyclic Voltammetry. A typical method scans from 0.0 V to 1.2 V and back at a scan rate of 100 mV/s [69].
- Data Analysis: Identify the oxidation peak potential of the target drug (e.g., cocaine oxidation occurs around ~1.0 V). The peak current is proportional to the drug concentration, allowing for quantification with a calibration curve [69]. The surfactant enhances the signal by promoting the adsorption of drug molecules onto the electrode surface.
The following diagram visualizes the experimental workflow for the two protocols.
The Scientist's Toolkit: Essential Research Reagents and Materials
Successful electrode characterization relies on a foundation of specific materials and reagents. The table below details key items and their functions in EIS and CV experiments.
Table 3: Essential research reagents and materials for EIS and CV experiments.
| Item | Function / Purpose | Example Application |
|---|---|---|
| Phosphate Buffer Saline (PBS) | A common supporting electrolyte that maintains stable pH and ionic strength, ensuring consistent electrochemical conditions [64] [69]. | Used as the release medium in drug release studies (EIS) and as a base electrolyte for drug detection in oral fluid (CV) [64] [69]. |
| Screen-Printed Electrodes (SPEs) | Disposable, portable, and integrated electrodes (working, counter, reference) that enable low-cost, on-site analysis without complex setup [69]. | Central to the detection of illicit drugs in oral fluid; allows for rapid and portable testing [69]. |
| Sodium Dodecyl Sulfate (SDS) | An anionic surfactant that enhances electrochemical signals by promoting the adsorption of analyte molecules onto the electrode surface [69]. | Used in surfactant-mediated CV to achieve sub-micromolar detection limits for drugs like cocaine and MDMA at unmodified SPEs [69]. |
| Platinum Electrodes | Inert electrodes used as counter or working electrodes due to their excellent conductivity and stability across a wide potential range [64]. | Used as counter and working electrodes in the custom cell for EIS-based drug release monitoring [64]. |
| Methanesulfonic Acid (MSA) | A non-adsorbing electrolyte used in fundamental studies to understand specific ion effects and surface processes on electrodes like platinum [70]. | Used to investigate the "butterfly" features on Pt(111) related to hydroxyl species adsorption, free from interference of strongly adsorbing anions [70]. |
Data Interpretation and Advanced Modeling
EIS: Equivalent Circuit Modeling
A core strength of EIS is quantifying electrochemical processes by fitting data to an equivalent circuit (EC) model. For instance, a study on Ti₃C₂Tx MXene supercapacitors developed a novel EC incorporating a diffusion layer resistance and a constant phase element (CPE), achieving a low error margin of 4.6% [66]. The CPE accounts for non-ideal capacitive behavior from surface roughness or inhomogeneity. This model quantified an 85% surface-controlled capacitance contribution and revealed how anodic oxidation above 0.3 V increases charge transfer resistance, degrading performance [66]. This demonstrates EIS's power in deconvoluting and quantifying complex charge storage mechanisms.
CV: Fingerprinting and Machine Learning Integration
CV provides distinct "electrochemical fingerprints" for different analytes. For example, illicit drugs like cocaine, MDMA, and synthetic cathinones produce oxidation peaks at characteristic potentials on graphene or carbon nanotube-modified electrodes [71]. This principle can be extended using multi-electrode systems where different electrode materials (e.g., Cu, Ni, C) respond uniquely to antibiotic molecules, creating a rich, complementary dataset [65]. Machine learning models (e.g., decision trees, random forests) can then process these complex voltammetric fingerprints to identify and classify multiple analytes in complex mixtures like milk, achieving high classification accuracy [65].
The diagram below illustrates the logical pathway from data acquisition to final analysis for both techniques.
EIS and CV are powerful, complementary techniques for advanced electrode characterization. EIS excels in deconvoluting complex interfaces and quantifying physical parameters through modeling, making it ideal for studying mechanisms like drug release and charge storage [64] [66]. CV offers rapid, sensitive screening of redox-active species and is highly amenable to fingerprinting and portable sensing applications [69] [65]. Within the broader context of trace analysis, both electrochemical methods provide a compelling alternative to traditional spectroscopy by enabling non-destructive, real-time analysis with comparable or superior sensitivity for specific applications [64] [2]. The choice between them, or the decision to use them in tandem, should be guided by the specific research question—whether it requires the kinetic and mechanistic depth of EIS or the rapid qualitative and quantitative profiling of CV.
The selection between voltammetry and spectroscopy for trace analysis represents a critical crossroads in analytical chemistry, particularly in fields requiring high sensitivity and portability such as pharmaceutical development and environmental monitoring. Traditional spectroscopic methods, including atomic absorption spectroscopy (AAS) and inductively coupled plasma mass spectrometry (ICP-MS), have long been considered the gold standard for trace metal analysis due to their high sensitivity and precision [72]. However, these techniques are characterized by significant limitations: they require sophisticated, laboratory-bound instrumentation, involve high operational costs, necessitate skilled personnel, and are generally unsuitable for real-time, in-situ, or online monitoring applications [72].
In contrast, electrochemical methods, particularly advanced voltammetric techniques, offer a powerful alternative. These methods are increasingly competitive due to their inherent simplicity, portability, cost-effectiveness, and suitability for field deployment [72]. The performance gap between these platforms has been substantially narrowed through the development of sophisticated signal enhancement strategies. This guide objectively compares the performance of modern voltammetry against traditional spectroscopy, focusing on the critical roles of nanomaterial-based sensor design, optimized electrochemical protocols, and machine learning (ML)-enhanced data processing in achieving detection limits, accuracy, and practicality that meet the rigorous demands of contemporary trace analysis research [72] [73] [74].
Quantitative Performance Comparison: Voltammetry vs. Spectroscopy
The following tables summarize experimental performance data for voltammetry and spectroscopy across various analytes, highlighting key metrics such as detection limit and sensitivity.
Table 1: Performance Comparison for Heavy Metal Ion Detection
| Analytical Technique | Sensor Modifier / Configuration | Target Analyte | Detection Limit | Linear Range | Key Experimental Findings | Source |
|---|---|---|---|---|---|---|
| DPASV | Graphene Oxide-Pectin (GO-PEC) Composite | Lead (Pb²⁺) | 4.0 × 10⁻¹⁰ mol L⁻¹ | 1.0 × 10⁻⁹ to 1.0 × 10⁻⁶ mol L⁻¹ | 90.5-fold signal increase; excellent accuracy in biofuel samples [75] | |
| SWASV | Chitosan-Tripolyphosphate Crosslinked Electrode | Lead (Pb²⁺) | 0.73 μg L⁻¹ (3.5 nM) | N/A | Controlled by adsorption, 2-electron transfer; recovery: 95-108% [76] | |
| Spectroscopy | ICP-MS / FAAS (Reference) | Lead (Pb²⁺) | ~1-10 μg L⁻¹ | Varies | High sensitivity but requires lab setting, complex sample prep [72] [75] |
Table 2: Performance Comparison for Organic Compound Detection
| Analytical Technique | Sensor Modifier / Configuration | Target Analyte | Detection Limit | Linear Range | Key Experimental Findings | Source |
|---|---|---|---|---|---|---|
| Cyclic Voltammetry (CV) | Sludge Biochar-modified GCE | BDE-47 (Flame Retardant) | 5 ng L⁻¹ | 0.005 - 0.6 μg L⁻¹ | High accuracy in real water; recovery: 96.8-106.6%; matches HPLC accuracy [12] | |
| Differential Pulse Voltammetry (DPV) | Bare Glassy Carbon Electrode (GCE) | Clopidogrel (Drug) | 0.08 mg mL⁻¹ | N/A | Identifies falsified drugs in presence of excipients; simple sample prep [77] | |
| Spectroscopy | HPLC / LC-MS (Reference) | BDE-47 / Clopidogrel | ~ng-μg L⁻¹ | Varies | High sensitivity and selectivity but cumbersome, expensive instrumentation [12] [77] |
Table 3: Impact of Machine Learning and Data Processing on Electroanalytical Performance
| Application Context | ML/Data Processing Algorithm | Comparative Improvement / Performance | Key Advantage | Source |
|---|---|---|---|---|
| Parameter Optimization (E-DNA Sensor) | Square-Wave Voltammetry (SWV) with optimized frequency/amplitude | >2-fold signal gain; up to +315% "signal-on" gain [78] | Maximizes response without physical sensor modification [78] | |
| Estimation of Diffusion Coefficients (D) | Support Vector Regression (SVR) & Gaussian Process Regression (GPR) | Higher accuracy and considerably faster than conventional fitting methods [79] | Automated processing yields better results than conventional peak analysis [79] | |
| Prediction of Reaction Rates & Optimization | Gaussian Process Regression (GPR), Particle Swarm Optimization (PSO) | Accurately predicts remaining battery life; finds optimal reaction conditions with <5% deviation [73] | Reduces need for extensive experimentation; handles complex, noisy data [73] | |
| General Biosensing | Integration with Advanced Materials/Nanomaterials | Enhances data processing, optimizes biosensor design, counters fouling/interference [74] | Improves efficiency and generates actionable results with minimal information loss [74] |
Experimental Protocols for Signal Enhancement
Nanomaterial-Enhanced Sensor Fabrication
Protocol 1: Fabrication of Graphene Oxide-Pectin (GO-PEC) Composite Sensor for Lead Detection [75]
- Objective: To create a modified glassy carbon electrode (GCE) with enhanced sensitivity for lead detection in biofuels via a synergistic composite material.
- Materials:
- Graphene Oxide (GO) dispersion (4.0 mg mL⁻¹)
- Pectin (PEC) from citrus peel
- Glacial acetic acid, sodium acetate
- Glassy Carbon Electrode (GCE), Ag/AgCl reference electrode, Pt wire counter electrode
- Procedure:
- Composite Preparation: Mix 500 μL of GO dispersion with 500 μL of a 1.0 mg mL⁻¹ pectin solution. Homogenize the mixture using a vortex mixer.
- Electrode Modification: Clean and polish the bare GCE following standard procedures. Deposit 5 μL of the GO-PEC composite suspension onto the GCE surface and allow it to dry at room temperature.
- Measurement: Perform Differential Pulse Anodic Stripping Voltammetry (DPASV) in acetate buffer (pH 5.0). The lead detection mechanism relies on the deprotonated carboxyl groups (-COO⁻) on the GO and PEC at pH > 3.5, which efficiently adsorb Pb²⁺ ions during the pre-concentration step.
- Key Finding: The GO-PEC composite promoted a 90.5-fold increase in the anodic stripping current for lead compared to an unmodified electrode, attributable to the combined high surface area of GO and the specific chelating properties of pectin [75].
Instrumental Parameter Optimization
Protocol 2: Maximizing Signal Gain in Electrochemical DNA (E-DNA) Sensors [78]
- Objective: To systematically optimize square-wave voltammetry (SWV) parameters to maximize the signal gain of a conformational-change-based biosensor.
- Materials:
- E-DNA sensor with a methylene blue redox reporter.
- Potentiostat capable of high-frequency SWV.
- Procedure:
- Data Acquisition: Record square-wave voltammograms from the sensor in both the presence and absence of the target analyte.
- Parameter Mapping: Systematically vary the SWV frequency (e.g., from 5 to 5000 Hz) and amplitude (e.g., from 1 to 100 mV) across a wide range of combinations.
- Gain Calculation: For each frequency-amplitude pair, calculate the signal gain as the percentage change in peak current upon target binding.
- Identification of Optima: Identify the specific frequency and amplitude pairing that yields the maximum absolute signal gain (for either "signal-on" or "signal-off" behavior).
- Key Finding: Simultaneous optimization of frequency and amplitude, rather than frequency alone, produced more than two-fold increases in signal gain. For a model aminoglycoside sensor, the optimal parameters were 25 mV amplitude and 750 Hz frequency, achieving a +315% "signal-on" gain [78].
Machine Learning-Enhanced Data Processing
Protocol 3: Estimation of Diffusion Coefficients using Gaussian Process Regression (GPR) [79]
- Objective: To accurately and rapidly estimate the diffusion coefficient (D) of an electroactive species from its cyclic voltammogram using a machine learning model.
- Materials:
- Simulated or experimental cyclic voltammetry dataset with known diffusion coefficients for training.
- Computational environment with GPR algorithm implementation (e.g., in Python using libraries like scikit-learn).
- Procedure:
- Model Training:
- Use a large set of simulated cyclic voltammograms (CVs) as the input feature vectors (X).
- Use the known diffusion coefficients used for each simulation as the target values (y).
- Train a GPR model with a non-linear kernel function to learn the mapping f(CV) → D.
- Model Application:
- Input an experimental CV of an unknown sample into the trained GPR model.
- The model outputs the estimated diffusion coefficient.
- Model Training:
- Key Finding: This ML approach estimated diffusion coefficients with accuracy matching conventional parameter-fitting methods but with a considerable reduction in computational time, and it outperformed analysis based on manually selected peak features [79].
Diagram: Machine Learning-Augmented Voltammetric Analysis
The following diagram illustrates the integrated workflow of a modern signal-enhanced voltammetric system, incorporating nanomaterial-based sensors, optimized instrumentation, and machine learning for data processing.
The Scientist's Toolkit: Essential Research Reagents and Materials
The following table details key materials used in the featured experiments for developing advanced voltammetric sensors.
Table 4: Essential Research Reagents and Materials for Signal-Enhanced Voltammetry
| Material / Reagent | Function in Voltammetric Analysis | Example Application |
|---|---|---|
| Graphene Oxide (GO) | Increases electrode surface area and provides oxygenated functional groups for adsorbing metal ions [72] [75]. | Lead detection in biofuels [75]. |
| Biopolymers (Chitosan, Pectin) | Acts as a chelating agent to pre-concentrate target metal ions on the electrode surface, enhancing signal [75] [76]. | Lead detection using crosslinked chitosan [76]. |
| Carbon Nanotubes (SWCNTs/MWCNTs) | Enhance electrical conductivity and provide a high surface-area scaffold, improving sensitivity and lower detection limits [72]. | General heavy metal detection in environmental samples [72]. |
| Sludge Biochar | A sustainable, waste-derived material with a porous structure and abundant functional groups for adsorbing organic pollutants [12]. | Detection of BDE-47 in water samples [12]. |
| Metal-Organic Frameworks (MOFs) | Crystalline porous materials with ultra-high surface area and tunable porosity for selective analyte capture [72]. | Sensing of heavy metal ions and gases [72]. |
| Methylene Blue / Ferrocene | Redox reporters used in conformational-change biosensors (e.g., E-DNA). Their electron transfer kinetics dictate optimal SWV parameters [78]. | Optimization of E-DNA and aptamer-based sensors [78]. |
The experimental data and protocols presented in this guide demonstrate that voltammetry, when augmented with strategic signal enhancement techniques, is a formidable competitor to traditional spectroscopy for trace analysis. The integration of nanomaterial-modified sensors provides the foundation for enhanced sensitivity and selectivity. Furthermore, the optimization of electrochemical protocols and the application of machine learning for data processing and analysis directly address historical limitations of reproducibility and complex data interpretation. For researchers and drug development professionals, this convergence of materials science and data science in electrochemical platforms offers a powerful, versatile, and increasingly accessible toolkit that balances high performance with practical advantages of speed, cost, and portability.
Head-to-Head Validation: Cost, Sensitivity, and Selectivity in Method Selection
The choice of analytical technique for trace analysis is pivotal in research and drug development. Voltammetry, an electrochemical method, often stands as a potential alternative to established spectroscopic techniques like High-Performance Liquid Chromatography (HPLC) and Inductively Coupled Plasma-Mass Spectrometry (ICP-MS). This guide provides an objective comparison of their performance, focusing on experimental protocols for correlating results and validating voltammetric methods against regulatory standards. The core distinction lies in their operational principles: voltammetry measures current resulting from the oxidation or reduction of analytes at an electrode, whereas HPLC separates components for detection (often via UV absorption), and ICP-MS atomizes and ionizes samples for mass-based detection. The validation of voltammetry against these established techniques is critical for its adoption in regulated environments, providing evidence of its reliability, accuracy, and equivalence for specific applications.
Performance Comparison: Experimental Data
The following tables summarize quantitative data from studies that directly compared voltammetry with HPLC or ICP-MS for various analyses.
Table 1: Comparison of Voltammetry and ICP-MS for Heavy Metal Analysis in PM10 Airborne Particulate Matter [80]
| Parameter | Voltammetry | ICP-MS | European Standard Requirement (EN 14902) |
|---|---|---|---|
| Method Detection Limit (ng m⁻³) | |||
| Cadmium (Cd) | 0.1 | Not Specified | Meets Requirement |
| Lead (Pb) | 0.3 | Not Specified | Meets Requirement |
| Arsenic (As) | 0.1 | Not Specified | Meets Requirement |
| Nickel (Ni) | 0.4 | Not Specified | Meets Requirement |
| Recovery on NIST 1648 (%) | 92% - 103% | Comparable | Meets Requirement |
| Difference between Techniques | Within accepted uncertainty (<25% for Pb, <40% for As, Cd, Ni) | Compliant | |
| Key Advantages | Low investment cost, potential for full automation, compliance with legislation. | Established reference method. |
Table 2: Comparison of Voltammetric and HPLC Methods for Pharmaceutical Analysis (Fulvestrant) [81]
| Parameter | Linear Sweep Voltammetry (LSV) | HPLC-UV |
|---|---|---|
| Linear Range (µg mL⁻¹) | 5 - 50 | 0.5 - 20 |
| Limit of Detection (LOD, µg mL⁻¹) | 1.52 | 0.152 |
| Limit of Quantification (LOQ, µg mL⁻¹) | 5.00 | 0.50 |
| Correlation Coefficient (R) | 0.9992 | 0.9999 |
| Application | Direct determination in pharmaceutical dosage forms. | Stability-indicating method, determination in presence of degradation products. |
Table 3: Comparison of Techniques for Metal Complexation Studies [82]
| Parameter | Anodic Stripping Voltammetry (ASV) | HPSEC-ICP-MS |
|---|---|---|
| Cadmium (Cd) Complexing Capacity | 33 nmol/L (2 ligand classes) | 9 nmol/L (2 ligand classes) |
| Copper (Cu) Complexing Capacity | 166 nmol/L (1 ligand class) | 139 nmol/L (2 ligand classes) |
| Principle of Detection | Measures kinetically labile metal complexes. | Measures metal distribution among size-based fractions of humic acids. |
| Key Insight | Differences attributed to the "detection window" and kinetic lability of complexes. |
Detailed Experimental Protocols for Correlation
To ensure voltammetric results are valid and comparable to established techniques, specific correlation protocols must be followed.
Protocol: Correlating Voltammetry with ICP-MS for Heavy Metals
This protocol is adapted from the analysis of heavy metals in airborne particulate matter (PM10) [80].
- 1. Sample Collection: Collect PM10 on quartz filters using a low-volume sampler according to standard EN 12341. Use a 24-hour sampling period with a flow rate of 2.3 m³ h⁻¹.
- 2. Sample Digestion: Digest the filter samples in a microwave oven using a mixture of nitric acid (HNO₃) and hydrogen peroxide (H₂O₂), following a standard procedure such as that outlined in EN 14902.
- 3. Parallel Analysis:
- Voltammetric Analysis: Use Anodic Stripping Voltammetry (ASV) for Cd, Pb, Cu, and Zn. Use Adsorptive Stripping Voltammetry (AdSV) for Ni and As. Employ a standard addition method for quantification.
- ICP-MS Analysis: Analyze the same digestate using the ICP-MS method described in EN 14902.
- 4. Quality Control:
- Analyze a Certified Reference Material (e.g., NIST 1648) with both methods to calculate recovery rates.
- Calculate method detection limits (MDL) by analyzing multiple blank filters.
- 5. Data Correlation & Validation:
- Statistically compare results (e.g., using t-tests) from both techniques. The percent difference should fall within the expanded uncertainty required by relevant directives (e.g., 25% for Pb, 40% for As, Cd, Ni in European Directives).
- Ensure that the voltammetric method's MDL and recovery (92-103%) comply with standard requirements.
Protocol: Correlating Voltammetry with HPLC for Pharmaceutical Dosage Forms
This protocol is based on the determination of the anticancer drug Fulvestrant [81].
- 1. Standard Solution Preparation:
- For LSV: Prepare stock and standard solutions of the drug in an electrolyte solution such as 0.1 M Lithium perchlorate (LiClO₄) in acetonitrile.
- For HPLC: Prepare stock and standard solutions in a suitable solvent like methanol.
- 2. Sample Preparation from Dosage Form:
- Dissolve an adequate amount of the pharmaceutical formulation (e.g., injectable solution) in the same electrolyte used for LSV or solvent for HPLC.
- Sonicate and dilute to volume, then filter. Make further dilutions to bring the concentration within the linear range of each method.
- 3. Parallel Analysis:
- LSV Analysis: Use a three-electrode system (e.g., Pt working electrode). Record linear sweep voltammograms under optimized conditions (e.g., scan rate). Measure the oxidation peak current.
- HPLC Analysis: Use a reversed-phase C18 column. Employ an isocratic mobile phase (e.g., 1% orthophosphoric acid-methanol, 80:20 v/v) with UV detection.
- 4. Data Correlation:
- Construct calibration curves for both methods and calculate regression parameters.
- Determine the drug content in the dosage form using both methods. Compare the percent recoveries and assay results statistically (e.g., using student's t-test) to show no significant difference.
Protocol for Complex Matrices: Voltammetry with Chemometrics
For complex mixtures with overlapping signals, voltammetry can be coupled with chemometrics for analysis and validation against HPLC [83].
- 1. Experimental Design:
- Prepare a calibration set of synthetic mixtures of the analytes (e.g., Levodopa, Carbidopa, Entacapone) using a multivariate design (e.g., Brereton Design) with different concentration levels.
- 2. Voltammetric Analysis & Data Preprocessing:
- Acquire Differential Pulse Voltammetry (DPV) signals for all mixtures using a bare glassy carbon electrode.
- Preprocess the voltammetric data using algorithms for baseline correction (e.g., airPLS) and potential shift correction (e.g., Icoshift) to resolve issues of lacking bilinearity and noise.
- 3. Model Development and Validation:
- Use the preprocessed data to build a Partial Least Squares (PLS) regression model.
- Validate the model using an independent set of validation mixtures.
- 4. Correlation with HPLC:
- Analyze the same validation samples using a reference HPLC method.
- Compare the results obtained from the voltammetric-chemometric model with the HPLC results statistically. A high correlation (e.g., R² > 0.99) demonstrates the validity of the voltammetric approach.
Workflow and Decision Pathway
The following diagram illustrates the logical workflow for validating a voltammetric method against a reference technique like HPLC or ICP-MS.
The Scientist's Toolkit: Key Research Reagent Solutions
Table 4: Essential Materials and Reagents for Voltammetric Analysis and Correlation Studies
| Item | Function / Application | Example Use Case |
|---|---|---|
| Quartz Filter | Collection of airborne particulate matter (PM10) for heavy metal analysis. | Sample collection for ICP-MS/Voltammetry correlation [80]. |
| Microwave Digestion System | Closed-vessel digestion of solid samples for complete extraction of analytes. | Digestion of PM10 filters prior to metal analysis [80]. |
| Supporting Electrolyte | Provides ionic conductivity and controls pH in the electrochemical cell. | Britton-Robinson buffer for drug analysis [83]; LiClO₄ in non-aqueous media [81]. |
| Certified Reference Material (CRM) | Validates method accuracy and recovery rates through analysis of a material with known composition. | NIST 1648 for validating heavy metal analysis in particulates [80]. |
| Working Electrodes | Surface where the electrochemical reaction occurs; choice depends on analyte and potential window. | Glassy Carbon Electrode (GCE) for drug analysis [83]; Platinum electrode for non-aqueous media [81]. |
| Chemometric Software | Processes multivariate voltammetric data to resolve overlapping signals and build calibration models. | MATLAB and SIMCA for PLS modeling in analysis of drug mixtures [83]. |
The experimental data and protocols presented demonstrate that voltammetry can provide results equivalent to ICP-MS and HPLC for specific applications, including environmental monitoring of heavy metals and pharmaceutical quality control. Successful correlation hinges on rigorous validation protocols that include using common sample preparation procedures, analyzing certified reference materials, and performing robust statistical comparison. The choice between these techniques should be guided by the specific analytical needs: voltammetry offers a cost-effective, automatable solution with excellent sensitivity for electroactive species, whereas ICP-MS and HPLC provide broader elemental coverage or superior separation capabilities, respectively. When properly validated, voltammetry stands as a powerful and reliable technique for trace analysis in research and drug development.
The selection of an analytical technique for trace analysis is a critical decision in research and drug development, with significant implications for project cost, efficiency, and data quality. This guide provides an objective comparison between voltammetry and spectroscopy, focusing on the economic and operational factors that influence methodological choice. Voltammetry, particularly stripping techniques, is recognized for its high sensitivity and low operational costs, making it suitable for field applications and resource-limited settings. Spectroscopy, including methods like ICP-MS and ICP-OES, offers exceptional multi-element capabilities and precision but requires substantial capital investment and operational overhead. By examining equipment, reagent consumption, and ongoing expenses, this analysis aims to equip researchers with the data needed to align their analytical strategies with both scientific and financial objectives.
Fundamentals of Voltammetry and Spectroscopy
Core Principles and Techniques
Voltammetry: Voltammetric techniques measure current resulting from the oxidation or reduction of an analyte at a working electrode under controlled potential. Stripping voltammetry, which includes anodic (ASV), cathodic (CSV), and adsorptive (AdSV) methods, significantly enhances sensitivity by incorporating a pre-concentration step where the analyte is accumulated onto the electrode surface before the measurement. This two-stage process allows for the detection of trace and ultra-trace concentrations, often at the parts-per-billion (ppb) or sub-ppb level [11] [84]. Its simplicity, high selectivity, low reagent consumption, and ability to use small sample volumes make it a cost-effective option [11].
Spectroscopy: Spectroscopic techniques for metal analysis, such as Inductively Coupled Plasma Mass Spectrometry (ICP-MS) and Inductively Coupled Plasma Optical Emission Spectrometry (ICP-OES), atomize a sample in a high-temperature plasma and measure the characteristic emission light (OES) or mass-to-charge ratio (MS) of the constituent elements. These methods are renowned for their high sensitivity, ability to perform rapid multi-element analysis over a wide concentration range, and excellent reproducibility [84]. However, they often involve complex and costly maintenance and operation, require significant amounts of reagents and gases, and typically need skilled operators [11] [84].
Comparative Workflow and Logical Pathway
The diagram below illustrates the fundamental operational differences and decision pathways between voltammetry and spectroscopy for trace metal analysis, highlighting key stages where cost and complexity diverge.
Direct Cost Comparison: Equipment and Consumables
The financial outlay for analytical techniques is divided into initial capital expenditure for equipment and recurring costs for consumables and maintenance. The table below summarizes key cost drivers for each technique.
Table 1: Key Research Reagent Solutions and Materials
| Category | Voltammetry | Spectroscopy (ICP-MS/OES) |
|---|---|---|
| Core Instrument | Potentiostat (Benchtop or portable) | ICP-MS/OES Spectrometer |
| Key Consumables | Working electrodes, supporting electrolytes, complexing agents | Argon gas, high-purity acids, autosampler tubes, torch, sampler & skimmer cones |
| Sample Volume | Small volumes (µL to mL) [85] | Typically larger volumes (mL) |
| Utility Consumption | Low power requirements | High power for plasma, cryogenic cooling (ICP-MS) |
| Operational Labor | Can be operated with standard lab training | Often requires highly skilled operators [11] |
Capital Equipment Costs
Voltammetry: The core instrument is a potentiostat, which is significantly less expensive than spectroscopic systems. Modern potentiostats range from low-cost, portable devices for field analysis to advanced modular benchtop systems. The trend towards miniaturization and disposable sensors, such as screen-printed electrodes (SPEs), further reduces costs and eliminates cleaning procedures [4] [86] [5]. For example, a copper wire electrode can be fabricated for less than 2 US dollars, demonstrating the potential for extreme cost-effectiveness [85].
Spectroscopy: ICP-MS and ICP-OES represent major capital investments. Costs are driven by the high-temperature plasma source, the high-resolution mass spectrometer (in ICP-MS), the sophisticated optical system (in ICP-OES), and the required cooling systems. These instruments are complex, require stable installation environments, and are typically found in centralized, well-funded laboratories.
Consumables and Reagent Consumption
Voltammetry: Operational costs are characterized by low reagent consumption. Experiments require small volumes of supporting electrolytes (e.g., acetate buffer) and complexing agents (e.g., cupferron, catechol) [11]. Electrodes are a primary consumable; while mercury-based electrodes offer excellent performance, there is a shift towards environmentally safe and disposable solid electrodes like bismuth-coated or screen-printed carbon electrodes (SPCEs) [4] [5].
Spectroscopy: Recurring costs are substantially higher. ICP techniques consume large volumes of high-purity argon gas to sustain the plasma, which is a significant ongoing expense. Sample preparation often involves high-purity acids (e.g., nitric acid) for digestion and dilution. Other consumables include sampler and skimmer cones (which degrade over time), torch injectors, and pump tubing, all contributing to a high cost per sample.
Analytical Performance and Experimental Protocols
While cost is a major factor, the analytical performance must suit the intended application. The following experimental data and protocols illustrate the capabilities of both techniques.
Performance Metrics for Trace Analysis
The table below compares the analytical performance of voltammetry and spectroscopy based on data from recent research applications.
Table 2: Analytical Performance Comparison for Trace Analysis
| Analyte | Technique | Linear Range | Detection Limit | Application / Matrix | Citation |
|---|---|---|---|---|---|
| Ga(III) | AdSV | ( 3.0 \times 10^{-9} ) – ( 4.0 \times 10^{-7} ) mol L⁻¹ | ( 9.5 \times 10^{-10} ) mol L⁻¹ | Tap water, River water | [11] |
| Cd(II) & Pb(II) | DP-ASV (iMF-GCE) | Not Specified | 0.63 µg L⁻¹ (Cd), 0.045 µg L⁻¹ (Pb) | Officinal plants | [4] |
| Salicylic Acid | DPV (Cu/CuO electrode) | 10 – 500 µmol L⁻¹ | 3.0 µmol L⁻¹ | Milk | [85] |
| Lanthanides (e.g., Ce, Eu) | AdSV | Varies by element and method | ppt to ppb level | Environmental samples | [84] |
| 3-methyladenine | DPV (SPCE) | 2.00 – 10.00 µmol L⁻¹ | 0.35 µmol L⁻¹ | Hydrolyzed DNA | [86] |
| General Metals | ICP-MS | Broad dynamic range | ppt to ppb level | Wide range of matrices | [11] [84] |
Detailed Experimental Protocols
Voltammetric Determination of Lead and Cadmium in Plants
This protocol, adapted from a 2025 study, highlights a cost-effective method optimized using experimental design [4].
- 1. Equipment & Reagents: Potentiostat; Glassy Carbon Electrode (GCE); mercury(II) solution, acetate buffer (supporting electrolyte), lead and cadmium standard solutions.
- 2. Electrode Modification: An in-situ mercury film is plated on the GCE (iMF-GCE) by adding mercury(II) ions directly to the measurement solution and depositing at a negative potential.
- 3. Pre-concentration (Deposition): The stirred solution containing the sample is held at a deposition potential (Edep) of -1.20 V vs. Ag/AgCl for 195 seconds. During this time, Pb(II) and Cd(II) are reduced to their metallic forms and amalgamated into the mercury film.
- 4. Stripping & Measurement: The potential is scanned in a positive direction using Differential Pulse Anodic Striammetry (DP-ASV). The metals are re-oxidized, producing distinct current peaks at characteristic potentials. The peak current is proportional to concentration.
- 5. Calibration & Quantification: The method is calibrated using standard additions, achieving recovery rates of 85.8% for Cd and 96.4% for Pb.
Voltammetric Determination of Salicylic Acid in Milk
This protocol demonstrates an innovative, low-cost approach with a simple sample pretreatment [85].
- 1. Equipment & Reagents: Potentiostat; custom copper wire working electrode; NaOH, ZnSO₄, salicylic acid (SA) standard.
- 2. Electrode Fabrication & Modification: A commercially available copper wire is sealed into a holder and electrochemically conditioned in 0.1 mol L⁻¹ NaOH via cyclic voltammetry to grow a CuO-rich layer. This layer enhances the signal and provides antifouling properties. Total electrode cost is under $2.
- 3. Sample Pretreatment: To 500 µL of milk, add ZnSO₄ to precipitate proteins and NaOH to ionize SA. Centrifuge to separate the aqueous phase containing the extracted SA. This rapid (15 min), organic solvent-free process minimizes reagent consumption.
- 4. Measurement: The pretreated sample is analyzed using Differential Pulse Voltammetry (DPV) in alkaline medium. The oxidation peak of SA is measured, with a linear response from 10–500 µmol L⁻¹ and recoveries of 91–107%.
Spectroscopic Analysis of Trace Metals (General Protocol)
- 1. Sample Digestion: A significant amount of solid or liquid sample (e.g., 0.1–1 g) is digested with high-purity concentrated nitric acid (and sometimes hydrochloric or hydrofluoric acid) using a hotblock or microwave digester. This is a time-consuming step that consumes significant acids.
- 2. Dilution: The digested sample is diluted to a known volume with high-purity water, often requiring large volumes of diluent to ensure the total dissolved solids are within instrument tolerability.
- 3. Instrument Calibration: A multi-element calibration standard is prepared across the expected concentration range, often requiring certified reference materials.
- 4. Measurement & Analysis: The sample is introduced via a peristaltic pump, nebulized into an argon plasma (~6000–10000 K), and the resulting ion or atomic emission signals are measured. Complex data processing corrects for spectral and matrix interferences.
Synthesis of Operational Expenditures
The total cost of ownership for an analytical technique extends far beyond the initial purchase price. Operational expenses (OpEx) are a critical differentiator.
Voltammetry (Low OpEx): The primary operational costs are for basic laboratory chemicals (buffers, salts) and occasional electrode replacement. Power consumption is minimal. The ability to perform analyses on-site eliminates transport and delay costs associated with sending samples to a central lab. Furthermore, the low technical barrier reduces labor costs associated with training and operation [11] [5].
Spectroscopy (High OpEx): OpEx is dominated by consumables. High-purity argon gas is a continuous and significant expense. The cost of high-purity acids, certified reference standards, and replacement parts (cones, torches, tubes) accumulates rapidly. Additionally, these instruments require regular, costly maintenance contracts to ensure uptime and data quality. They often necessitate a dedicated, climate-controlled room and highly skilled, highly paid technicians or scientists to operate and maintain them [11].
The choice between voltammetry and spectroscopy is not a matter of which technique is superior, but which is most appropriate for the specific analytical problem and economic context.
Choose Voltammetry when:
- The analysis targets one or a few electroactive species (e.g., specific heavy metals, organic biomarkers).
- Capital budget is limited.
- The application requires portability for on-site or real-time monitoring [4] [5].
- Sample throughput is moderate, and operational costs must be minimized.
- Examples include environmental field monitoring [11] [4], food safety screening [85], and targeted clinical biomarker detection [86].
Choose Spectroscopy (ICP-MS/OES) when:
- A comprehensive multi-element profile is required from a single sample.
- The highest possible sensitivity and precision are mandatory.
- The sample throughput is very high, justifying the high instrument and operational costs.
- The laboratory has the infrastructure and budget to support the instrument and its skilled operators.
In conclusion, voltammetry offers a compelling cost-benefit profile for targeted trace analysis, with low capital and operational expenses coupled with high sensitivity. Spectroscopy remains the benchmark for multi-element analysis and ultimate sensitivity, but this comes at a premium cost. A thorough understanding of both technical and economic factors ensures that researchers and drug development professionals can make strategically sound investments in their analytical capabilities.
The choice of analytical technique is pivotal in trace analysis, influencing the reliability, cost, and efficiency of environmental and pharmaceutical research. This guide provides a structured comparison of detection capabilities between voltammetric and spectroscopic methods, focusing on their limits of detection (LOD) for metal ions and organic compounds. Voltammetry, particularly stripping techniques, is recognized for its exceptional sensitivity towards metal ions, often achieving detection limits in the nanomolar and even picomolar range [47] [8] [87]. Its application to organic compounds, while promising, presents distinct challenges and generally yields higher (less sensitive) LODs compared to metals [12] [88]. In contrast, spectroscopic techniques like ICP-MS and AAS remain the gold standard for sensitive metal detection in laboratory settings, though they often lack the portability and low cost of electrochemical methods [72] [89] [90]. This comparison is framed within a broader examination of voltammetry versus spectroscopy, highlighting the fit-for-purpose nature of each technique based on the analyte of interest, required sensitivity, and operational context.
Comparative Detection Limits: Voltammetry in Focus
The sensitivity of an analytical method, quantified by its Limit of Detection (LOD), is a critical metric for researchers. The LOD is typically defined as the lowest concentration of an analyte that can be reliably distinguished from a blank sample, often calculated as the concentration corresponding to a signal three times the standard deviation of the background noise (S/N=3) [88]. Table 1 summarizes the typical LOD ranges achievable for metals and organics using common voltammetric techniques, while Table 2 provides specific experimental data from recent studies.
Table 1: Typical Limits of Detection (LOD) Ranges for Voltammetric Techniques
| Analyte Class | Example Analytes | Common Voltammetric Techniques | Typical LOD Range |
|---|---|---|---|
| Metal Ions | In(III), Pb(II), Cd(II), As(III) [47] [90] | Anodic Stripping Voltammetry (ASV), Adsorptive Stripping Voltammetry (AdSV) [47] [8] | (10^{-9}) to (10^{-11}) mol L⁻¹ (nanomolar to picomolar) [47] |
| Organic Compounds | BDE-47 (flame retardant), Pharmaceuticals [12] [88] | Adsorptive Stripping Voltammetry (AdSV), Cyclic Voltammetry (CV) [12] [68] | (10^{-9}) to (10^{-12}) g L⁻¹ (nanograms per liter to picograms per liter) [12] |
Table 2: Experimental Detection Limits from Recent Voltammetric Studies
| Analyte | Technique | Working Electrode | Linear Range | LOD | Reference Context |
|---|---|---|---|---|---|
| In(III) (Metal) | AdSV | Solid Bismuth Microelectrode (SBiµE) | (1 \times 10^{-9}) to (1 \times 10^{-7}) mol L⁻¹ | (3.9 \times 10^{-10}) mol L⁻¹ | [47] |
| In(III) (Metal) | ASV | Solid Bismuth Microelectrode (SBiµE) | (5 \times 10^{-9}) to (5 \times 10^{-7}) mol L⁻¹ | (1.4 \times 10^{-9}) mol L⁻¹ | [47] |
| BDE-47 (Organic) | CV | Sludge Biochar-modified GCE | 0.005 to 0.6 μg L⁻¹ | 5 ng L⁻¹ (∼ (9.5 \times 10^{-12}) mol L⁻¹) | [12] |
| Pb(II), Cd(II), As(III) (Metals) | SWASV | Nanocomposite-modified SPE | 0-50 μg L⁻¹ | 0.8-2.4 μg L⁻¹ | [90] |
The data reveals that voltammetry can achieve remarkably low LODs for both analyte classes. The exceptional sensitivity for metals stems from an effective pre-concentration step in stripping techniques, where metal ions are accumulated onto the electrode surface before measurement [89] [87]. For organic compounds, the LOD highly depends on the electroactivity of the molecule and the use of specialized electrode modifiers to enhance adsorption and electron transfer [12] [88].
Experimental Protocols for Key Voltammetric Procedures
Protocol 1: Determination of a Metal Ion (In(III) using AdSV)
This protocol outlines the sensitive detection of Indium(III) using Adsorptive Stripping Voltammetry (AdSV) with an environmentally friendly solid bismuth microelectrode (SBiµE) [47].
- 1. Electrode System: A three-electrode system is used, comprising a Solid Bismuth Microelectrode (SBiµE, diameter 25 µm) as the working electrode, a platinum wire as the counter electrode, and a Ag/AgCl reference electrode [47] [91].
- 2. Supporting Electrolyte: A 0.1 mol L⁻¹ acetate buffer solution is used, adjusted to pH 3.0 ± 0.05. The chelating agent cupferron is added to the sample to form a complex with In(III) [47].
- 3. Activation and Accumulation:
- The SBiµE is activated at a potential of -2.5 V for a duration of 45 seconds. This step reduces any bismuth oxide on the electrode surface, ensuring a clean, metallic surface for analysis [47].
- The accumulation of the In(III)-cupferron complex onto the electrode is performed at a potential of -0.65 V for 10 seconds [47].
- 4. Stripping and Measurement: The voltammetric signal is recorded during a negative potential scan from -0.4 V to -1.0 V. The resulting reduction current peak for the complex is measured, and its height is proportional to the concentration of In(III) in the sample [47].
- 5. Calibration and LOD Determination: A calibration curve is constructed using standard solutions of In(III) across the linear range of (1 \times 10^{-9}) to (1 \times 10^{-7}) mol L⁻¹. The Limit of Detection (LOD) is calculated to be (3.9 \times 10^{-10}) mol L⁻¹ based on a signal-to-noise ratio of 3 [47].
Protocol 2: Determination of an Organic Compound (BDE-47 using CV)
This protocol describes the detection of the organic flame retardant 2,2',4,4'-tetrabromodiphenyl ether (BDE-47) using Cyclic Voltammetry (CV) with a sludge biochar-modified electrode [12].
- 1. Electrode Modification: A Glassy Carbon Electrode (GCE) is polished and cleaned. Sludge biochar, pyrolyzed at 600 °C, is then deposited onto the GCE surface using a thermal loading method with an adhesive, creating the modified working electrode [12].
- 2. Electrode System: The modified GCE is used as the working electrode in a standard three-electrode cell with a Pt wire counter electrode and a Ag/AgCl reference electrode (3 M KCl) [12].
- 3. Measurement Procedure: The electrochemical measurement is performed using the Cyclic Voltammetry technique. The peak current response, which increases with the concentration of BDE-47, is recorded [12].
- 4. Calibration and LOD Determination: The peak current is plotted against the concentration of BDE-47 over the range of 0.005 to 0.6 μg L⁻¹. The LOD for this method is determined to be 5 ng L⁻¹ [12].
Visualizing Voltammetric Analysis and Workflows
The following diagrams illustrate the core concepts and experimental workflows discussed in this guide, highlighting the comparative pathways for metal and organic analysis.
Figure 1: A conceptual map comparing the voltammetric analysis pathways for metal ions and organic compounds, highlighting the fundamental reasons for their differing typical sensitivities.
Figure 2: A generalized experimental workflow for trace analysis using stripping voltammetry, common to both metal and organic compound determination.
The Scientist's Toolkit: Key Research Reagent Solutions
Successful voltammetric analysis relies on specialized materials and reagents. The following table details essential components for setting up these experiments.
Table 3: Essential Reagents and Materials for Voltammetric Trace Analysis
| Item | Function/Description | Example Application |
|---|---|---|
| Bismuth-based Electrodes | Environmentally friendly alternative to mercury electrodes; forms alloys with metals for sensitive stripping analysis [47] [89]. | Determination of In(III), Pb(II), Cd(II) [47]. |
| Screen-Printed Electrodes (SPEs) | Disposable, planar electrodes for portable, on-site analysis; often produced with carbon, silver, and insulating inks [90] [87]. | Multiplexed detection of As(III), Cd(II), Pb(II) in a flow cell [90]. |
| Nanomaterial Modifiers | Substances like biochar, graphene, or metal nanoparticles that enhance electrode surface area, adsorption, and electron transfer [12] [72]. | Sludge biochar to pre-concentrate BDE-47 [12]. |
| Chelating Agents | Organic compounds that form electroactive complexes with metal ions, enabling their determination via Adsorptive Stripping Voltammetry (AdSV) [47]. | Cupferron for the determination of In(III) [47]. |
| Supporting Electrolytes | Buffer solutions that control pH and provide ionic strength to ensure a stable and reproducible electrochemical response [47] [8]. | Acetate buffer for In(III) analysis [47]. |
The comparative data unequivocally demonstrates that voltammetry, particularly stripping techniques, achieves superior sensitivity for trace metal ion analysis compared to most organic compounds, with LODs readily reaching the picomolar level. This high performance for metals is attributed to the efficient electrochemical pre-concentration step intrinsic to methods like ASV and AdSV. For organic compounds, the sensitivity is highly contingent on the molecule's inherent electroactivity and the strategic use of advanced electrode modifiers to facilitate adsorption and electron transfer. The choice between voltammetry and spectroscopy ultimately depends on the research objectives: voltammetry offers a powerful, cost-effective, and portable solution for sensitive metal detection and specific organics, while spectroscopic methods provide robust, multi-element laboratory-based analysis. Researchers must weigh factors such as the required LOD, analyte class, sample matrix, and need for field-deployment when selecting the most appropriate technique.
The accurate trace-level determination of specific analytes within complex matrices such as biological fluids, environmental waters, and formulated products represents a significant challenge in analytical chemistry. The complexity of these samples arises from the presence of numerous interfering compounds that can obscure detection, reduce accuracy, and compromise analytical selectivity. This comparison guide objectively evaluates the performance of two principal analytical approaches—voltammetry and spectroscopy—for trace analysis in these demanding environments.
Framed within a broader thesis on electroanalytical versus spectroscopic techniques, this article synthesizes current experimental data to provide researchers, scientists, and drug development professionals with a clear comparison of their capabilities, limitations, and optimal applications. The evaluation focuses specifically on the critical attribute of selectivity, which is the ability to reliably quantify a target substance in the presence of potential interferents with similar chemical or physical properties.
Comparative Performance in Key Matrices
The selection of an analytical method requires careful consideration of the sample matrix and the specific analytical question. The table below summarizes the documented performance of voltammetric and spectroscopic techniques across three complex matrices.
Table 1: Performance Comparison of Voltammetry and Spectroscopy in Complex Matrices
| Matrix | Target Analyte | Technique | Key Advantage | Limitation / Challenge | Supporting Data |
|---|---|---|---|---|---|
| Biological Fluids (Urine) | Quinine (QN) | Voltammetry (BDDE) | High selectivity; uric acid, nicotine, caffeine do not interfere [92]. | Non-linear concentration effects from analyte/matrix interactions complicate quantification [93]. | LOD: 10⁻⁷ M (cathodic peak); 1.0 μg/mL in urine [92]. |
| Biological Fluids (Urine) | Serotonin, Noradrenalin | Voltammetry | Direct analysis possible with standard additions methodology [93]. | Complex, overlapping voltammetric profiles require modeling for individual analyte quantification [93]. | Satisfactory agreement with theoretical predictions for non-linear features [93]. |
| Biological Tissues | Multiple Elements (e.g., Cu, Zn, Mn) | Spectroscopy (LA-ICP-MS) | Laterally resolved trace element distribution analysis (bio-imaging) [94]. | Sample preparation (e.g., FFPE) can severely affect labile elements (Na, K) [94]. | FFPE suitable for transition metals (e.g., Mn, Ni, Cu, Zn); unsuitable for alkaline metals [94]. |
| Environmental Waters | Selenium Species | Voltammetry (ASSWV) | Effective for speciation; provides signal for Se(IV) [95]. | Does not provide a signal for all species (e.g., Se(VI)); requires combination with other methods for total Se [95]. | LOD: 0.57 mg/L Se(IV); Linear range: 1.2-9.7 mg/L [95]. |
| Environmental Waters | Selenium (Total) | Spectroscopy (GFAAS) | High sensitivity for total elemental quantification [95]. | Requires atomization; typically provides total element content, not speciation [95]. | LOD: 5.2 μg/L for total Se; more reliable for total Se in real samples [95]. |
| Environmental Waters | Cyanotoxins, PFAS | Spectroscopy (LC-MS/MS, ELISA) | High sensitivity and specificity; EPA-standardized methods for regulated contaminants [96]. | Often requires sophisticated, costly instrumentation and specialized expertise [96]. | EPA Methods 544, 545, 546 for various cyanotoxins in drinking water [96]. |
Analysis of Biological Fluids
Analysis of biological fluids like urine is particularly challenging due to the presence of numerous electroactive or spectroscopically active interferents, variable viscosity, and complex composition.
- Voltammetric Approaches: Voltammetry can achieve high selectivity in biological fluids. For instance, a boron-doped diamond electrode (BDDE) was used for the determination of quinine in urine, demonstrating that common interferents like uric acid, nicotine, and caffeine did not affect the analysis [92]. This selectivity allows for direct measurement with minimal sample preparation. However, a significant challenge is the non-linear relationship between current and concentration that can arise from analyte/matrix interactions, which complicates quantification using the standard addition method and requires theoretical modeling for accurate results [93].
- Spectroscopic Approaches: Spectroscopic techniques like ICP-MS are powerful for multi-elemental analysis. When coupled with laser ablation (LA-ICP-MS), it becomes a potent tool for elemental imaging in biological tissues, revealing the spatial distribution of elements [94]. The critical factor for spectroscopy is sample preparation. While formalin-fixed paraffin-embedded (FFPE) samples are the histological gold standard, they are unsuitable for analyzing alkaline metals (Na, K) which are leached during processing. However, FFPE samples can yield reliable results for transition metals (Mn, Ni, Cu, Zn) comparable to snap-frozen tissues [94].
Analysis of Environmental Waters
Environmental water analysis demands techniques capable of detecting contaminants at trace levels, often requiring speciation to assess toxicity and mobility.
- Voltammetric Approaches: Voltammetry is a cost-effective and efficient technique that excels in speciation analysis. For selenium, anodic stripping square wave voltammetry (ASSWV) provides a signal for the more toxic Se(IV) species but not for Se(VI) or total selenium, making it complementary to spectroscopic techniques [95].
- Spectroscopic Approaches: Spectroscopic methods are the backbone of regulatory environmental analysis. Techniques like Graphite Furnace Atomic Absorption Spectroscopy (GFAAS) offer exceptional sensitivity for total element quantification [95]. Furthermore, the U.S. EPA employs liquid chromatography tandem mass spectrometry (LC-MS/MS) for the highly sensitive and specific determination of organic contaminants like cyanotoxins and PFAS in water, providing legally defensible results [96].
Analysis of Formulations
While the provided search results focus more on biological and environmental matrices, the principles can be extended to formulations. The selectivity of voltammetry, as demonstrated with the BDDE for quinine in soft drinks [92], is directly applicable to analyzing active ingredients in pharmaceutical or food formulations amidst excipients and preservatives. Similarly, spectroscopic techniques like ICP-MS/OES are routinely used for the quantitative determination of elemental impurities in pharmaceutical products per regulatory guidelines.
Experimental Protocols for Key Studies
Voltammetric Determination of Quinine in Urine
Objective: To develop a sensitive and selective voltammetric method for determining quinine (QN) in soft drinks and urine using a boron-doped diamond electrode (BDDE) [92].
Protocol:
- Electrode System: Use a miniature planar electrochemical cell with a BDDE working electrode.
- Medium: For analysis, use a strongly acidic medium (2 M HClO₄) for oxidation or a Britton–Robinson buffer across a wide pH range for reduction.
- Measurement:
- For the cathodic peak (reduction), apply Differential Pulse Voltammetry (DPV) or Square-Wave Voltammetry (SWV) under optimized conditions.
- The oxidation peak can also be used, though with lower sensitivity.
- Calibration: Construct a calibration curve using standard QN solutions under optimal parameters.
- Sample Preparation (Urine):
- Investigate and select an appropriate sample preparation method to minimize matrix effects.
- Dilute the urine sample as necessary in the supporting electrolyte.
- Validation: Compare results with a reference method, such as High-Performance Liquid Chromatography (HPLC), and perform statistical analysis (e.g., Student's t-test).
ICP-MS Analysis of Trace Elements in Tissues
Objective: To compare the suitability of cryo-cut tissues versus formalin-fixed paraffin-embedded (FFPE) tissues for elemental distribution analysis using LA-ICP-MS [94].
Protocol:
- Sample Preparation:
- Cryo-sectioning: Snap-freeze tissue in liquid nitrogen. Section using a cryo-microtome and mount on a substrate.
- FFPE Processing: Immerse tissue in formalin for fixation, followed by dehydration in xylene and embedding in paraffin. Section, mount, and deparaffinize with xylene before analysis.
- Instrumentation: Use a laser ablation system (e.g., NWR213) coupled to an ICP-MS (e.g., iCAP Qc).
- LA-ICP-MS Parameters:
- Laser wavelength: 213 nm
- Laser beam diameter: 40 μm
- Repetition rate: 20 Hz
- Scan speed: 120 μm/s
- Helium gas flow: 1.0 L/min
- Internal Standardization: Sputter-coat samples with a thin gold layer to serve as an internal standard [94].
- Quantification: Use matrix-matched standards or gel-based standards for calibration.
- Data Analysis: Compare qualitative distribution images and quantitative concentrations for various elements (Na, Mg, K, Ca, Mn, Fe, Ni, Cu, Zn) between the two sample preparation techniques.
Signaling Pathways and Workflows
Electrochemical Oxidation Pathways of Neurotransmitters
The complexity of voltammetric signals in biological fluids is rooted in the multi-step electrochemical pathways of the analytes. The following diagram simplifies the pathways for noradrenaline and serotonin, explaining the potential for interference and non-linear behavior [93].
Electrochemical Pathways of Neurotransmitters
Comparative Analytical Workflow: Voltammetry vs. Spectroscopy
The general workflow for trace analysis differs significantly between the two techniques, impacting factors like sample preparation, data interpretation, and the type of information obtained.
Comparative Analytical Workflow
The Scientist's Toolkit: Essential Research Reagents and Materials
The following table details key reagents, materials, and instruments essential for conducting voltammetric and spectroscopic analyses in complex matrices, as derived from the cited experimental protocols.
Table 2: Essential Research Reagent Solutions and Materials
| Item | Function / Application | Example from Literature |
|---|---|---|
| Boron-Doped Diamond Electrode (BDDE) | Working electrode for voltammetry; offers wide potential window and low background current. | Used for selective determination of quinine in urine and soft drinks [92]. |
| Britton–Robinson Buffer | Versatile supporting electrolyte for voltammetry; usable across a wide pH range. | Served as the background electrolyte for the reduction of quinine [92]. |
| Formalin, Xylene, Paraffin | Reagents for formalin fixation and paraffin embedding (FFPE) of biological tissues. | Used in sample preparation for LA-ICP-MS analysis; found unsuitable for labile metals [94]. |
| Redox Mediators (e.g., Methylene Blue) | Facilitate electron transfer in mediated electrochemistry of enzyme-catalyzed systems. | Used with methylene blue to determine Michaelis constant (KM) for NADH oxidation [97]. |
| Certified Reference Materials (CRMs) | Calibration and validation of analytical methods to ensure accuracy and precision. | Used to assess the performance of EDXRF, TXRF, and ICP-MS/OES methods for hair/nail analysis [98]. |
| Internal Standards (e.g., Gold Coating) | Compensate for signal drift and matrix effects during LA-ICP-MS analysis. | A thin sputtered gold layer was used as an internal standard for quantitative LA-ICP-MS bio-imaging [94]. |
| Laser Ablation System coupled to ICP-MS | Provides spatially resolved elemental distribution analysis (imaging) of solid samples. | Instrumental platform for comparing elemental distributions in cryo-cut and FFPE tissues [94]. |
Both voltammetry and spectroscopy offer distinct paths to achieving selectivity in complex matrices, and the choice between them is not a matter of superiority but of strategic application.
- Voltammetry excels when the application benefits from its inherent electrochemical selectivity, minimal sample preparation, and capacity for speciation analysis. It is a powerful, cost-effective tool for direct analysis of electroactive species, as demonstrated by the determination of quinine in urine and Se(IV) in water. Its main challenges are managing non-linear matrix effects and the need for expert interpretation of complex reaction pathways.
- Spectroscopy, particularly ICP-MS and LC-MS/MS, provides unmatched sensitivity, multi-analyte capability, and broad applicability. It is the definitive choice for total elemental analysis, ultra-trace detection, and when leveraging established regulatory methods. The primary constraints are often the need for extensive sample preparation, the high cost of instrumentation, and the potential loss of speciation information without complementary techniques.
For comprehensive analysis, a synergistic approach is often the most effective. Using voltammetry for specific redox-active analytes or speciation, and spectroscopy for total elemental content or molecular identification, provides a powerful, orthogonal validation strategy. The researcher's decision must be guided by the specific analytical requirements: the nature of the analyte, the required detection limit, the sample matrix, and the desired information (e.g., concentration, speciation, or spatial distribution).
The pursuit of sustainable analytical chemistry has catalyzed a significant shift in trace metal detection strategies, particularly within pharmaceutical and environmental research. Green Chemistry principles have prompted a critical re-evaluation of traditional methods, favoring techniques that minimize hazardous waste, reduce energy consumption, and enable decentralized analysis. This guide objectively compares the evolving landscape of voltammetric methods against established spectroscopic techniques, with a specific focus on the dual trends of miniaturization and the adoption of mercury-free electrodes.
Established laboratory techniques for trace metal analysis, such as Inductively Coupled Plasma-Mass Spectrometry (ICP-MS) and Atomic Absorption Spectroscopy (AAS), are renowned for their high sensitivity and multi-element capabilities [99]. However, these methods are characterized by high operational costs, complex maintenance, bulky instrumentation, and the requirement for specialized laboratory settings and personnel [99]. They are primarily suited for total metal concentration analysis and often require extensive sample preparation and separation procedures to obtain speciation data, which can alter the original metal species distribution [2] [5].
In contrast, electrochemical techniques, particularly voltammetry, offer a portable, cost-effective, and user-friendly alternative. The most significant advantage of voltammetry for green chemistry and speciation analysis is its ability to directly determine metal species with minimal sample preparation, reducing the risk of altering speciation or causing sample contamination [2]. Stripping voltammetry, which includes a pre-concentration step, achieves sensitivity comparable to spectroscopic techniques, making it a powerful competitor for trace and ultra-trace detection [3] [5]. The method is highly suitable for on-site and in situ measurements, allowing sensors to directly probe the ambient environment without the need for sample collection and transport [5]. This decentralization of analysis aligns with the goals of green chemistry by reducing the overall environmental footprint of analytical operations.
Performance Comparison: Mercury-Free Electrodes and Miniaturized Systems
The development of mercury-free electrodes and miniaturized systems represents the forefront of green electroanalysis. The following sections and tables provide a detailed comparison of their performance against traditional alternatives.
Mercury-Free Electrode Materials: A Comparative Analysis
Traditional mercury-based electrodes, such as the hanging mercury drop electrode (HMDE), have been widely used for their excellent reproducibility, high hydrogen overvoltage, and renewable surface. However, the toxicity of mercury has driven stringent regulations and a search for safer alternatives [99] [100].
Table 1: Comparison of Mercury-Free Electrode Materials for Trace Metal Detection
| Electrode Material | Key Advantages (Green & Performance) | Limitations & Challenges | Example Performance (Analyte; LOD) | Best Suited For |
|---|---|---|---|---|
| Bismuth (Bi) Film [99] [100] | Low toxicity, well-defined stripping signals, high sensitivity, and facile electroplating onto substrates. | Limited lifecycle, fragile thick films, potential signal overlap with copper, requires in situ or ex situ plating. | Pb(II), Cd(II); sub-ppb levels [100] | Portable stripping analysis of heavy metals (Cd, Pb, Zn). |
| Antimony (Sb) Film [100] | Good stripping activity, can be plated on various substrates. | Higher toxicity than bismuth, higher cost. | Cd(II), Pb(II); comparable to BiF [100] | An alternative to Bi, though less "green". |
| Silver Solid Amalgam (AgSAE) [101] | Broad potential window, mechanical stability, high hydrogen overvoltage, non-toxic. | Not a pure element, requires preparation. | Anthraquinone drugs; 0.15 μmol L⁻¹ [101] | Determination of reducible organic compounds and some metals. |
| Carbon-Based & Modified Electrodes [99] | Versatile surface chemistry, modifiable with nanomaterials/polymers, good conductivity. | Can suffer from fouling, requires optimization of modification procedure. | Varies with modification; can achieve high sensitivity. | Custom applications leveraging surface modifications. |
| Polymer Film Modified (e.g., PZF) [100] | Selective preconcentration via complexation, renewable surface, "mercury-free". | Ligand-specific, may require optimization of film formation. | Pb(II); 0.98 μg L⁻¹ [100] | Targeting specific metals like lead in water matrices. |
Miniaturized Voltammetric Systems Versus Conventional Lab Analysis
Miniaturization is a cornerstone of green chemistry, reducing reagent consumption, waste generation, and enabling point-of-need testing.
Table 2: Comparison of Analytical Approaches for Trace Metal Detection
| Characteristic | Conventional Spectroscopy (ICP-MS/AAS) | Benchtop Voltammetry | Miniaturized Voltammetric Systems |
|---|---|---|---|
| Portability | Low; requires fixed lab setting [99]. | Moderate; some portable potentiostats available. | High; compact, battery-operated devices [5]. |
| Analysis Speed | Moderate to slow (includes sample prep). | Moderate (includes deposition time). | Fast; small volumes enable rapid analysis [101] [5]. |
| Sample Volume | Millilitres to litres [99]. | Millilitres. | Microlitres (20-50 μL) [101]. |
| Cost & Operation | High capital and operational cost; requires skilled personnel [99]. | Lower cost; less training required. | Low cost; aims for user-friendly operation [102] [5]. |
| Environmental Impact | High energy consumption, argon gas (ICP), chemical waste. | Lower energy, but may use mercury. | Lowest energy and reagent consumption [5]. |
| Sensitivity | Excellent (ppt-ppb) for total metals [99]. | Excellent (ppb-sub-ppb) for labile species [2]. | Good to very good (ppb range); improving [102]. |
| Speciation Capability | Requires coupling with separation techniques [2]. | Direct speciation analysis possible [2]. | Potential for direct in situ speciation [5]. |
| Application Context | Centralized laboratory testing. | On-site monitoring and mobile labs. | In situ deployment, point-of-care diagnostics [5] [103]. |
Experimental Protocols and Data
This section details the methodologies and data underpinning the performance claims for modern green voltammetric systems.
Experimental Workflow for Miniaturized, Mercury-Free Analysis
The general workflow for fabricating and using a miniaturized sensor is illustrated below, synthesizing approaches from multiple studies [101] [102] [100].
Detailed Experimental Methodologies
Protocol 1: Lead Detection using a Poly-Zincon Film (PZF) Modified Electrode [100]
- Electrode Modification: A graphite electrode is polished and immersed in a zincon solution. The poly-zincon film is formed on the surface through electropolymerization using cyclic voltammetry (e.g., 15 cycles between -0.8 V and +1.2 V).
- Preconcentration and Analysis: The PZF-modified electrode is immersed in a stirred acetate buffer (pH 6.0) sample containing Pb(II) ions for a set time (e.g., 2-10 minutes). During this period, Pb(II) is complexed by the zincon film. The electrode is then transferred to a clean acetate buffer, and anodic stripping voltammetry is performed: Pb(II) is reduced at -1.0 V, followed by an anodic potential sweep that strips (oxidizes) the metal, producing a current peak at -0.64 V.
- Regeneration: The electrode is regenerated by immersing it in 0.1 M EDTA solution for 2 minutes to chelate and remove bound Pb(II), allowing for repeated use.
- Key Data: This method achieved a linear range of 3.45–136.3 μg L⁻¹ with a detection limit of 0.98 μg L⁻¹ and was successfully applied to ground and tap water samples.
Protocol 2: Miniaturized Aptasensor for Lead Ions using Screen-Printed Electrodes [102]
- Aptamer Immobilization: A miniaturized screen-printed gold electrode is cleaned. Thiol-modified thrombin-binding aptamer (TBA) sequences are then immobilized on the gold surface via gold-thiol self-assembly, forming the receptor layer.
- Measurement with Redox Indicator: The measurement is performed in a solution containing the methylene blue (MB) redox indicator. In the absence of Pb²⁺, the aptamer is in a random coil conformation. Upon addition of Pb²⁺, the aptamer folds into a G-quadruplex structure, which has a high affinity for MB. This leads to the accumulation of MB close to the electrode surface.
- Signal Detection: The change in current from the reduction of the accumulated MB is measured using square-wave voltammetry (SWV). The increase in current is proportional to the Pb²⁺ concentration.
- Key Data: This miniaturized aptasensor demonstrated a linear response to Pb²⁺ from 10 to 100 nM, with high selectivity over interfering ions, and was validated in spiked tap water samples.
The Scientist's Toolkit: Essential Research Reagents and Materials
Successful implementation of these green analytical methods relies on specific materials and reagents.
Table 3: Key Research Reagent Solutions for Green Voltammetry
| Item Name | Function/Description | Application Example |
|---|---|---|
| Bismuth Nitrate | Source of Bi(III) ions for in situ or ex situ plating of bismuth film electrodes. | Fabrication of non-toxic BiF electrodes for ASV of Cd, Pb, Zn [100]. |
| Thiol-Modified Aptamers | Single-stranded DNA that binds a specific target; thiol group allows covalent immobilization on gold. | Creating highly selective receptor layers for biosensors (e.g., for Pb²⁺) [102]. |
| Screen-Printed Electrodes (SPEs) | Disposable, mass-produced electrodes with printed WE, RE, and CE. Ideal for miniaturization. | Core transducer for single-use, portable sensors for field analysis [102] [5]. |
| Methylene Blue | A redox-active indicator; signal changes upon interaction with biomolecular layers. | Label-free detection in electrochemical aptasensors [102]. |
| Zincon | A metallochromic indicator that forms complexes with metal ions; can be electropolymerized. | Selective preconcentration of Pb(II) on electrode surface for ASV [100]. |
| Agarose | Polysaccharide used to form porous gels and membranes. | Separation membrane in miniaturized voltammetric cells [101]. |
The comparative data clearly demonstrates that voltammetry, empowered by mercury-free electrodes and miniaturization, presents a compelling green alternative to traditional spectroscopy for many trace analysis applications. While ICP-MS and AAS remain superior for high-throughput, multi-element total metal analysis in centralized labs, voltammetry excels in providing speciation information, portability, and significantly reduced operational costs and environmental impact.
The ongoing development of novel electrode materials like bismuth and antimony films, sophisticated surface modifications with polymers and nanomaterials, and the integration of biological receptors like aptamers are continuously enhancing the sensitivity, selectivity, and robustness of these green analytical platforms. The trend towards miniaturized Lab-on-a-Chip (LoC) systems [103] and disposable screen-printed sensors [102] [5] is poised to further revolutionize the field, making decentralized, real-time monitoring of trace metals and other analytes a widespread reality in research, drug development, and environmental protection.
Conclusion
The comparative analysis confirms that voltammetry and spectroscopy are not mutually exclusive but complementary. Voltammetry offers unparalleled advantages for metal speciation analysis, direct determination of free ion concentrations relevant to bioavailability and toxicity, and cost-effective, rapid analysis with minimal sample preparation. Spectroscopy, particularly ICP-MS, remains the benchmark for multi-element total concentration analysis with exceptionally low detection limits. The future of trace analysis lies in the hybridization of these techniques and the integration of new technologies. The adoption of environmentally friendly electrodes, the application of AI for data interpretation and experimental optimization, and the development of portable, lab-on-a-chip sensors will further solidify the role of electroanalysis in advancing personalized medicine, environmental monitoring, and sustainable pharmaceutical practices.
References
- 1. Voltammetric sensors modified with nanomaterials [https://link.springer.com/article/10.1007/s44373-025-00027-9]
- 2. Voltammetric methods for speciation analysis of trace ... [https://www.sciencedirect.com/science/article/abs/pii/S2214158821000064]
- 3. Voltammetry in Determination of Trace Amounts ... [https://pmc.ncbi.nlm.nih.gov/articles/PMC10708426/]
- 4. Experimental design optimization of a simple and cost ... [https://www.sciencedirect.com/science/article/pii/S0039914025004023]
- 5. Novel frontiers in voltammetric trace metal analysis [https://www.sciencedirect.com/science/article/abs/pii/S0165993618302802]
- 6. Electroanalytical Trace Metal Cations Quantification and ... [https://pmc.ncbi.nlm.nih.gov/articles/PMC10056914/]
- 7. A review on electrochemical methods for trace metal ... [https://www.sciencedirect.com/science/article/abs/pii/S2451910317300339]
- 8. Analytical Applications of Voltammetry in the Determination ... [https://www.mdpi.com/2673-4532/5/3/23]
- 9. New Prospects in the Electroanalysis of Heavy Metal Ions ... [https://www.mdpi.com/2409-9279/6/4/60]
- 10. Stripping Voltammetry in Trace Ga(III) Analysis Using ... [https://www.mdpi.com/1996-1944/18/4/769]
- 11. Stripping Voltammetry in Trace Ga(III) Analysis Using ... [https://pmc.ncbi.nlm.nih.gov/articles/PMC11857673/]
- 12. Sludge biochar-enabled trace voltammetric detection of 2,2 ... [https://pubs.rsc.org/en/content/articlehtml/2025/ra/d5ra06052d]
- 13. Microfabricated, massive electrochemical arrays of uniform ... [https://www.sciencedirect.com/science/article/abs/pii/S157266571630594X]
- 14. Ultramicroelectrode Array Based Sensors - PubMed Central [https://pmc.ncbi.nlm.nih.gov/articles/PMC3270852/]
- 15. Ultraviolet Detectors: Perspectives, Principles, and Practices [https://www.chromatographyonline.com/view/ultraviolet-detectors-perspectives-principles-and-practices]
- 16. Comparison of Elemental Analysis Techniques [https://measurlabs.com/blog/elemental-analysis-applications-and-method-comparison/]
- 17. Using a Spectrophotometer for Water Analysis [https://sperdirect.com/blogs/news/using-a-spectrophotometer-for-water-analysis?srsltid=AfmBOoqypwh6uVqWzw5u3mnnN41RdR8SOEIHBKwGB6GZIlFvq8_Oi7C5]
- 18. A comparative study on electrochemical behaviour of ... [https://www.sciencedirect.com/science/article/abs/pii/S2214785323027992]
- 19. Boosting supercapacitor performance through innovative ... [https://pubs.rsc.org/en/content/articlehtml/2025/ra/d5ra02905h]
- 20. Electrochemically relevant physical–chemical properties of ... [https://pubs.rsc.org/en/content/articlehtml/2025/gc/d5gc03356j]
- 21. Buffering effects of supporting electrolytes on pH profiles in ... [https://www.nature.com/articles/s41598-025-18219-z]
- 22. Buffering effects of supporting electrolytes on pH profiles in ... [https://pubmed.ncbi.nlm.nih.gov/40940525/]
- 23. The crucial role of the supporting electrolyte in redox flow ... [https://pubs.rsc.org/en/content/articlelanding/2025/cc/d5cc03825a]
- 24. Trace Analysis - an overview [https://www.sciencedirect.com/topics/chemistry/trace-analysis]
- 25. Tips to Boost Your Trace Analysis Skills | LCGC International [https://www.chromatographyonline.com/view/tips-boost-your-trace-analysis-skills]
- 26. Software | Potentiostats for Electrochemistry [https://www.admiralinstruments.com/software]
- 27. Stripping voltammetry for the determination of trace metal ... [https://www.sciencedirect.com/science/article/abs/pii/S0003267099006194]
- 28. Stripping voltammetry | PPTX [https://www.slideshare.net/slideshow/stripping-voltammetry/180000542]
- 29. Electroanalysis Advances in Pharmaceutical Sciences [https://www.mdpi.com/2673-4532/6/2/12]
- 30. Voltammetric approach for pharmaceutical samples analysis [https://pmc.ncbi.nlm.nih.gov/articles/PMC9743491/]
- 31. A voltammetric approach for the quantification of ... [https://www.nature.com/articles/s41598-025-03347-3]
- 32. Electrospun nanofibers for extraction of thymoquinone from ... [https://www.sciencedirect.com/science/article/abs/pii/S0026265X23001637]
- 33. Design and development of a low-cost potentiostat for ... [https://ui.adsabs.harvard.edu/abs/2026Meas..25718870B/abstract]
- 34. emphasizing green, white, and blue analytical approaches [https://www.nature.com/articles/s41598-024-69518-w]
- 35. Voltammetric methodology for the quality control and ... [https://www.sciencedirect.com/science/article/pii/S0039914024016345]
- 36. Atomic Absorption Spectrophotometry (AAS): Principles ... [https://www.sepscience.com/atomic-absorption-spectrophotometry-aas-principles-instrumentation-and-comparisons-with-other-as-techniques-12134]
- 37. ICP / AAS | PPTX Comparison [https://www.slideshare.net/slideshow/icp-aas-comparison-74892920/74892920]
- 38. sciencedirect.com/topics/earth-and-planetary- sciences / inductively ... [https://www.sciencedirect.com/topics/earth-and-planetary-sciences/inductively-coupled-plasma-mass-spectrometry]
- 39. Comparison between inductively coupled plasma-mass ... [https://www.sciencedirect.com/science/article/pii/S2773050625000205]
- 40. of an Comparison -atomic emission... inductively coupled plasma [https://pubmed.ncbi.nlm.nih.gov/3222695/]
- 41. Comparative Evaluation of Inductively Coupled Plasma ... [https://www.mdpi.com/2305-6304/13/4/314]
- 42. sciencedirect.com/topics/chemistry/ voltammetric - method [https://www.sciencedirect.com/topics/chemistry/voltammetric-method]
- 43. Electrochemical sensor based on α-Fe 2 O 3 /rGO core ... [https://www.nature.com/articles/s41598-025-19377-w]
- 44. Determination of diclofenac in pharmaceutical preparations by... [https://pmc.ncbi.nlm.nih.gov/articles/PMC5762207/]
- 45. Cyclic Voltammetry Uses | How to Read a Voltammogram | Ossila [https://www.ossila.com/pages/cyclic-voltammetry-applications]
- 46. Exploring the properties, types, and performance of atomic site ... [https://pubs.rsc.org/en/content/articlehtml/2025/cs/d4cs00333k]
- 47. Development and Comparison of New Voltammetric ... [https://www.mdpi.com/1420-3049/30/22/4377]
- 48. Determination of indium by adsorptive stripping ... [https://www.sciencedirect.com/science/article/abs/pii/S0039914024000596]
- 49. Determination of gallium and indium by solution cathode ... [https://www.sciencedirect.com/science/article/abs/pii/S0584854720304079]
- 50. 11.4: Voltammetric and Amperometric Methods [https://chem.libretexts.org/Bookshelves/Analytical_Chemistry/Analytical_Chemistry_2.1_(Harvey)/11%3A_Electrochemical_Methods/11.04%3A_Voltammetric_and_Amperometric_Methods]
- 51. Voltammetric techniques of analysis: the essentials [https://link.springer.com/article/10.1007/s40828-015-0016-y]
- 52. Perspective—Advances in Voltammetric Methods for the ... [https://pmc.ncbi.nlm.nih.gov/articles/PMC11024638/]
- 53. Evaluation of Performance and Longevity of Ti-Cu Dry ... [https://www.mdpi.com/1424-8220/24/23/7477]
- 54. Troubleshooting Cyclic Voltammetry and Voltammograms [https://www.ossila.com/pages/cyclic-voltammetry-troubleshooting]
- 55. Advantages and Limitations of Electroanalytical Techniques [https://www.solubilityofthings.com/advantages-and-limitations-electroanalytical-techniques]
- 56. Principles and Case Studies of Cyclic Voltammetry Testing ... [https://www.neware.net/news/principles-and-case-studies-of-cyclic-voltammetry-testing-with-multiple-scan-rat/230/127.html]
- 57. Cyclic voltammetry, square wave voltammetry or ... [https://www.sciencedirect.com/science/article/pii/S2667160323000248]
- 58. Mastering Stripping Voltammetry Techniques [https://www.numberanalytics.com/blog/mastering-stripping-voltammetry-techniques]
- 59. A comparative analysis of square-wave voltammetry and ... [https://link.springer.com/article/10.1007/s10008-024-05921-7]
- 60. Investigation and elimination of surfactant-induced ... [https://www.journalssystem.com/ppmp/Investigation-and-elimination-of-surfactant-induced-interferences-in-anodic-stripping,170717,0,2.html]
- 61. Effect of Temperature on the Removal of Interferences ... [https://pmc.ncbi.nlm.nih.gov/articles/PMC11242377/]
- 62. Influence of high-molecular surfactants on the ... [https://www.sciencedirect.com/science/article/abs/pii/S0019452224000499]
- 63. of Analysis pharmaceuticals and related... :: BioResources trace [https://bioresources.cnr.ncsu.edu/resources/analysis-of-trace-pharmaceuticals-and-related-compounds-in-municipal-wastewaters-by-preconcentration-chromatography-derivatization-and-separation-methods/]
- 64. In situ drug release measuring in α-TCP cement ... [https://pmc.ncbi.nlm.nih.gov/articles/PMC8016803/]
- 65. Strategies to Enrich Electrochemical Sensing Data with ... [https://pmc.ncbi.nlm.nih.gov/articles/PMC11207790/]
- 66. Electrochemical Impedance Analysis of Ti3C2Tx MXene for ... [https://www.mdpi.com/2504-477X/9/3/139]
- 67. Developing an innovative theoretical model for analyzing ... [https://www.sciencedirect.com/science/article/abs/pii/S0013468625007261]
- 68. Comparative investigation of free radical scavenging and ... [https://www.nature.com/articles/s41598-025-12731-y]
- 69. Enhanced electrochemical detection of illicit drugs in oral ... [https://www.sciencedirect.com/science/article/abs/pii/S0925400521012272]
- 70. New understanding of the voltammetry of platinum in non- ... [https://www.sciencedirect.com/science/article/pii/S0013468624017304]
- 71. Electrochemical Fingerprints of Illicit Drugs on Graphene ... [https://www.frontiersin.org/journals/chemistry/articles/10.3389/fchem.2021.641147/full]
- 72. Recent Trends in Electrochemical Methods for Real-Time ... [https://www.sciencedirect.com/science/article/abs/pii/S2451910325001085]
- 73. Machine learning in electrochemical oxidation process [https://www.sciencedirect.com/science/article/abs/pii/S1001841724010441]
- 74. Machine-Learning-Aided Advanced Electrochemical ... [https://pubmed.ncbi.nlm.nih.gov/40489203/]
- 75. Lead signal enhancement in anodic stripping voltammetry ... [https://www.sciencedirect.com/science/article/abs/pii/S0016236122017483]
- 76. of Lead Using Chitosan-tripolyphosphate... Voltammetric Detection [https://pubmed.ncbi.nlm.nih.gov/31378775/]
- 77. of falsified clopidogrel in the presence of excipients using... Detection [https://pubs.rsc.org/en/content/articlehtml/2021/ay/d1ay01602d]
- 78. Maximizing the Signal Gain of Electrochemical-DNA Sensors [https://pmc.ncbi.nlm.nih.gov/articles/PMC5660313/]
- 79. Estimation of diffusion coefficients from voltammetric signals ... [https://jcheminf.biomedcentral.com/articles/10.1186/1758-2946-6-30]
- 80. Comparison of voltammetry and inductively coupled ... [https://www.sciencedirect.com/science/article/abs/pii/S1352231006003943]
- 81. Stability Indicating HPLC Method for the Determination of Fulvestrant in... [https://brieflands.com/articles/ijpr-125159]
- 82. High Performance Size Exclusion Chromatography ... [https://www.mdpi.com/1420-3049/24/17/3201]
- 83. A voltammetric method coupled with chemometrics for determination... [https://bmcchem.biomedcentral.com/articles/10.1186/s13065-024-01189-0]
- 84. Voltammetry in Determination of Trace Amounts ... [https://www.mdpi.com/1420-3049/28/23/7755]
- 85. Cost-Effective Voltammetric Determination of Salicylic Acid ... [https://pmc.ncbi.nlm.nih.gov/articles/PMC12547540/]
- 86. Simultaneous voltammetric determination of 3- ... [https://www.sciencedirect.com/science/article/abs/pii/S0003269725001010]
- 87. Environmental monitoring using voltammetric trace metal ... [https://www.envchemgroup.com/environmental-monitoring-using-voltammetric-trace-metal-analysis.html]
- 88. Strategies for Assessing the Limit of Detection in ... [https://pmc.ncbi.nlm.nih.gov/articles/PMC11300140/]
- 89. New Prospects in the Electroanalysis of Heavy Metal Ions ... [https://pmc.ncbi.nlm.nih.gov/articles/PMC10366748/]
- 90. Multiplexed Anodic Stripping Voltammetry Detection of ... [https://www.frontiersin.org/journals/chemistry/articles/10.3389/fchem.2022.815805/full]
- 91. 11.4: Voltammetric Methods [https://chem.libretexts.org/Courses/Northeastern_University/CHEM_1000%3A_General_Chemistry/11%3A_Electrochemical_Methods/11.4%3A_Voltammetric_Methods]
- 92. Sensitive and selective voltammetric method for ... [https://www.sciencedirect.com/science/article/pii/S0026265X23004575]
- 93. quantification of species in urine accounting for non-linear ... [https://link.springer.com/article/10.1007/s10008-023-05627-2]
- 94. A comparison of sample preparation strategies for ... [https://pmc.ncbi.nlm.nih.gov/articles/PMC5591616/]
- 95. Determination of selenium using different techniques [https://pubmed.ncbi.nlm.nih.gov/41265315/]
- 96. Methods for Water Research [https://www.epa.gov/water-research/methods-water-research]
- 97. Reversible enzyme-catalysed NAD + /NADH electrochemistry [https://pubs.rsc.org/en/content/articlehtml/2025/sc/d5sc00570a]
- 98. Evaluation of the Quantitative Performance of Different ... [https://www.sciencedirect.com/science/article/pii/S0946672X25001646]
- 99. Advancements in Mercury-Free Electrochemical Sensors ... [https://www.mdpi.com/1424-8220/25/5/1474]
- 100. A mercury free electrode for anodic stripping voltammetric ... [https://www.sciencedirect.com/science/article/abs/pii/S0169433217314769]
- 101. Miniaturized voltammetric cell for cathodic voltammetry ... [https://www.sciencedirect.com/science/article/abs/pii/S1572665717309542]
- 102. Studies on the Aptasensor Miniaturization for Electrochemical ... [https://pmc.ncbi.nlm.nih.gov/articles/PMC10886534/]
- 103. Development of a miniaturized electrochemical biochip [https://www.frontiersin.org/journals/lab-on-a-chip-technologies/articles/10.3389/frlct.2025.1611743/full]