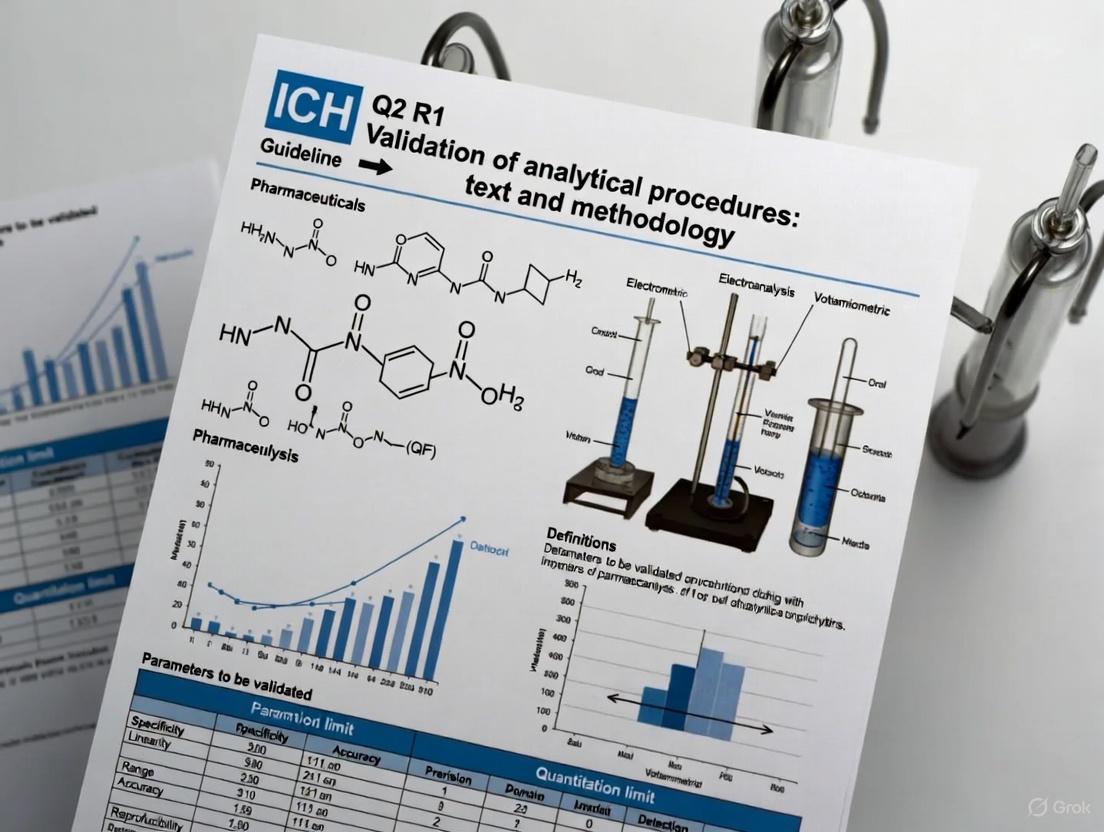
Validating Electrochemical Pharmaceutical Methods: A Practical Guide to ICH Q2(R1) Compliance
This article provides a comprehensive framework for the development and validation of electrochemical analytical methods in pharmaceutical analysis, aligned with the ICH Q2(R1) guideline.
Validating Electrochemical Pharmaceutical Methods: A Practical Guide to ICH Q2(R1) Compliance
Abstract
This article provides a comprehensive framework for the development and validation of electrochemical analytical methods in pharmaceutical analysis, aligned with the ICH Q2(R1) guideline. Tailored for researchers and drug development professionals, it bridges foundational regulatory principles with practical application, covering method optimization, troubleshooting of common electrochemical techniques, and systematic validation against established pharmacopoeial methods. The content synthesizes current regulatory expectations with practical case studies to ensure reliability, reproducibility, and compliance in quantitative analysis of active pharmaceutical ingredients, excipients, and impurities.
Understanding ICH Q2(R1): The Bedrock of Reliable Pharmaceutical Electroanalysis
The ICH Q2(R1) guideline, titled "Validation of Analytical Procedures: Text and Methodology," provides the foundational framework for validating analytical methods within the pharmaceutical industry. This harmonized guideline originated from the consolidation of two earlier documents—Q2A (Text on Validation of Analytical Procedures, March 1995) and Q2B (Validation of Analytical Procedures: Methodology, May 1997)—into a single comprehensive document in November 2005 [1] [2]. The International Council for Harmonisation (ICH) developed this standard to establish uniform principles for demonstrating that analytical procedures are suitable for their intended purposes, thereby ensuring the quality, safety, and efficacy of pharmaceutical products across global markets [3] [4].
The primary regulatory scope of ICH Q2(R1) encompasses analytical procedures used in the testing of chemical and biological drug substances and products for registration applications [4] [5]. This includes methods for identity testing, assay, impurity quantification, and other critical quality attributes. The guideline applies to various analytical techniques, from traditional chromatographic methods to modern spectroscopic approaches, forming the basis for regulatory submissions to health authorities worldwide, including the FDA and European Medicines Agency [1] [4]. As the pharmaceutical industry continues to evolve with advanced modalities and technologies, ICH Q2(R1) remains a cornerstone for analytical quality, even as it is complemented by newer guidelines such as ICH Q2(R2) and ICH Q14 that address more complex analytical challenges [3] [6].
Core Principles and Key Definitions
Definition and Objective of Analytical Procedure Validation
According to ICH Q2(R1), validation of an analytical procedure is "the process of demonstrating that an analytical procedure is suitable for its intended purpose" [5]. This process establishes documentary evidence that the procedure, when correctly applied, consistently produces reliable results that accurately reflect the quality characteristics of the drug substance or product under assessment [5]. The fundamental objective is to demonstrate that the method is scientifically sound and robust enough to deliver precise, accurate, and reproducible data throughout its lifecycle, thereby supporting regulatory compliance and ensuring product quality [7] [5].
The concept of analytical procedure within this context refers to the detailed description of the steps necessary to perform the analysis [5]. This includes, but is not limited to, sample and reference standard preparation, use of apparatus, generation of calibration curves, use of formulas for calculation, and system suitability testing [5]. A properly validated analytical procedure provides assurance that it will consistently yield results that can be confidently used to make decisions regarding product quality.
Types of Analytical Procedures Covered
ICH Q2(R1) specifically addresses the validation requirements for four primary types of analytical procedures, each with distinct purposes and validation considerations [5]:
Identification Tests: These procedures are intended to confirm the identity of an analyte in a sample, typically through comparison of specific properties (e.g., spectrum, chromatographic behavior, chemical reactivity) against those of a reference standard [5].
Quantitative Tests for Impurities: These methods measure the content of impurities in a sample, requiring accurate quantification of specific impurities or total impurities present in the drug substance or product [5].
Limit Tests for Impurities: These procedures are designed to control the level of impurities by ensuring they do not exceed a specified threshold, without necessarily quantifying the exact amount present [5].
Assay Procedures: These represent quantitative measurements of the major component(s) in the drug substance or the active component(s) in the drug product, and are used to determine potency, content uniformity, and other critical quality attributes [5].
The guideline acknowledges that while other analytical procedures exist (such as dissolution testing or particle size determination), the core validation principles established for these four types provide a foundation that can be adapted to other methodologies [5].
Validation Parameters and Methodologies
ICH Q2(R1) defines specific validation characteristics that must be evaluated based on the type of analytical procedure and its intended use. The following parameters form the core of analytical method validation, each with established methodologies for demonstration.
Specificity
Specificity is "the ability to assess unequivocally the analyte in the presence of components which may be expected to be present" [5]. This parameter ensures that the method can accurately distinguish and quantify the analyte of interest from interfering substances such as impurities, degradation products, excipients, or matrix components [7]. For identification tests, specificity must confirm the identity of the analyte. For assay and impurity tests, it must demonstrate that all procedures allow accurate statement of content or purity [5].
Methodology: Specificity is typically demonstrated by analyzing blank samples (without analyte) and samples spiked with potential interferents, then comparing the results to confirm that the target analyte signal is clearly distinguishable [7]. For stability-indicating methods, forced degradation studies under various stress conditions (acid, base, oxidation, thermal, photolytic) are performed to demonstrate that the method can separate and quantify degradation products from the main analyte [5].
Accuracy
Accuracy "expresses the closeness of agreement between the value which is accepted either as a conventional true value or an accepted reference value and the value found" [5]. Also referred to as trueness, this parameter confirms that the method yields results that are close to the true value [7].
Methodology: Accuracy is typically assessed using at least nine determinations across a minimum of three concentration levels covering the specified range [7] [5]. The results are expressed as percent recovery of the known amount of analyte spiked into the sample matrix, or as the difference between the mean and the accepted true value [5]. For drug substance assays, accuracy may be demonstrated by comparison to a reference method or by spiking known amounts into a placebo mixture [5].
Precision
Precision "expresses the closeness of agreement (degree of scatter) between a series of measurements obtained from multiple sampling of the same homogeneous sample under the prescribed conditions" [5]. ICH Q2(R1) defines precision at three distinct levels [5]:
- Repeatability (intra-assay precision): Precision under the same operating conditions over a short interval of time, assessed with a minimum of nine determinations covering the specified range or a minimum of six determinations at 100% of the test concentration [5].
- Intermediate Precision: Within-laboratory variations incorporating different days, different analysts, different equipment, or other deliberate variations [5].
- Reproducibility: Precision between laboratories, typically assessed during collaborative studies for method standardization or technology transfer [5].
Methodology: Precision is evaluated by performing multiple measurements under the specified conditions and statistically analyzing the results, typically expressed as relative standard deviation (RSD) or coefficient of variation (CV) [7]. ICH guidelines typically recommend RSD values below 2% for assay methods of drug substances and products [7].
Detection Limit (LOD) and Quantitation Limit (LOQ)
The Detection Limit (LOD) is "the lowest amount of analyte in a sample which can be detected but not necessarily quantitated as an exact value" [5]. In contrast, the Quantitation Limit (LOQ) is "the lowest amount of analyte in a sample which can be quantitatively determined with suitable precision and accuracy" [5].
Methodology: ICH Q2(R1) describes several approaches for determining LOD and LOQ [5]:
- Visual Evaluation: For non-instrumental methods, LOD and LOQ may be determined by analyzing samples with known concentrations of analyte and establishing the minimum level at which detection or quantification can be reliably performed [5].
- Signal-to-Noise Ratio: Typically applied to chromatographic methods, using a ratio of 3:1 for LOD and 10:1 for LOQ [7] [5].
- Standard Deviation of Response and Slope: Based on the standard deviation of the response (σ) and the slope of the calibration curve (S), using the formulas LOD = 3.3σ/S and LOQ = 10σ/S [5].
Linearity and Range
Linearity is "the ability (within a given range) to obtain test results which are directly proportional to the concentration (amount) of analyte in the sample" [5]. The Range is the interval between the upper and lower concentrations of analyte for which it has been demonstrated that the analytical procedure has a suitable level of precision, accuracy, and linearity [5].
Methodology: Linearity is typically demonstrated by analyzing at least five concentrations across the specified range [7]. The resulting data is evaluated by appropriate statistical methods, with a correlation coefficient (r) of at least 0.995 generally considered acceptable for assay methods [7]. The range is established based on the intended purpose of the method—for assay procedures, typically 80-120% of the test concentration; for impurity determinations, from the reporting level of the impurities to 120% of the specification [5].
Robustness
Robustness is "a measure of the analytical procedure's capacity to remain unaffected by small, deliberate variations in method parameters," indicating its reliability during normal usage [5]. While not explicitly defined as a validation parameter in ICH Q2(R1), System Suitability Testing establishes that the analytical system is operating correctly at the time of analysis and is often discussed in conjunction with robustness [7].
Methodology: Robustness is evaluated by deliberately introducing small, deliberate variations to method parameters (such as mobile phase composition, pH, temperature, flow rate, or different columns) and examining the effect on analytical results [7]. System suitability tests verify parameters such as resolution, tailing factor, theoretical plates, and repeatability (%RSD) to ensure the system is performing adequately before and during sample analysis [7].
Table 1: Summary of Key Validation Parameters and Their Applications in ICH Q2(R1)
| Validation Parameter | Definition | Typical Methodology | Primary Applications |
|---|---|---|---|
| Specificity | Ability to assess analyte unequivocally in presence of potential interferents | Comparison of blank vs. spiked samples; forced degradation studies | All procedures (Identification, Assay, Impurity testing) |
| Accuracy | Closeness of agreement to accepted reference value | Recovery studies with known amounts; minimum 9 determinations across range | Assay, Impurity quantification |
| Precision | Closeness of agreement between series of measurements | Repeatability: ≥9 determinations; Intermediate precision: different days/analysts | Assay, Impurity quantification |
| Linearity | Ability to obtain results proportional to analyte concentration | Minimum 5 concentrations across specified range; statistical evaluation | Assay, Impurity quantification |
| Range | Interval between upper and lower analyte concentrations with suitable precision, accuracy, linearity | Established based on intended application (e.g., 80-120% for assay) | Assay, Impurity quantification |
| Detection Limit (LOD) | Lowest amount detectable but not necessarily quantifiable | Visual evaluation; signal-to-noise (3:1); statistical (3.3σ/S) | Impurity testing |
| Quantitation Limit (LOQ) | Lowest amount quantifiable with suitable precision and accuracy | Visual evaluation; signal-to-noise (10:1); statistical (10σ/S) | Impurity quantification |
| Robustness | Capacity to remain unaffected by small, deliberate variations | Deliberate variation of method parameters | All quantitative procedures |
Experimental Protocols and Methodologies
Protocol for Specificity and Selectivity Assessment
Purpose: To demonstrate that the method can unequivocally distinguish the analyte from other components.
Procedure:
- Prepare and analyze a blank sample (without analyte) to identify potential interference from the matrix.
- Prepare and analyze a sample containing the analyte at the target concentration.
- Prepare and analyze samples spiked with potential interferents (degradation products, impurities, excipients) at expected levels.
- For stability-indicating methods, perform forced degradation studies:
- Prepare stress samples under acid, base, oxidative, thermal, and photolytic conditions
- Analyze all stress samples to demonstrate separation of degradation products from the main analyte
- Compare chromatograms or spectra to confirm that the analyte response is unaffected by the presence of other components and that all potential interferents are separated.
Acceptance Criteria: The blank should show no interference at the retention time or response position of the analyte. The analyte peak should be pure (as demonstrated by peak purity tests where applicable), and all potential interferents should be baseline separated from the analyte peak [5].
Protocol for Accuracy Evaluation
Purpose: To demonstrate the closeness of agreement between the measured value and the true value.
Procedure:
- Prepare a minimum of nine determinations over at least three concentration levels (e.g., 80%, 100%, 120% of target concentration).
- For drug substance analysis:
- Compare results against a certified reference standard of known purity
- Or, prepare samples by spiking known amounts into placebo mixtures
- For drug product analysis:
- Prepare synthetic mixtures of the drug product components with known amounts of active ingredient
- Or, use standard addition method where known quantities of analyte are added to the sample
- Calculate recovery for each determination: % Recovery = (Measured Concentration / Theoretical Concentration) × 100
- Calculate mean recovery and statistical confidence intervals.
Acceptance Criteria: Mean recovery should typically be 98-102% for drug substance assays, with appropriate justification for wider ranges based on method purpose and complexity [7] [5].
Protocol for Precision Determination
Purpose: To demonstrate the degree of scatter in a series of measurements under prescribed conditions.
Procedure: Repeatability:
- Analyze a minimum of six samples at 100% of test concentration, or a minimum of nine determinations covering the specified range (e.g., three concentrations with three replicates each).
- Calculate the mean, standard deviation, and relative standard deviation (%RSD).
Intermediate Precision:
- Perform the analysis on different days, with different analysts, using different instruments (as applicable).
- Prepare fresh samples and solutions for each experimental variation.
- Analyze a minimum of six samples at 100% test concentration for each variation.
- Compare results from different conditions using statistical tests (e.g., F-test, t-test).
Acceptance Criteria: %RSD should typically be ≤2% for assay of drug substances, with appropriate justification for wider ranges based on analytical technique and sample matrix [7] [5].
Protocol for Linearity and Range Assessment
Purpose: To demonstrate a proportional relationship between analyte concentration and instrument response.
Procedure:
- Prepare a minimum of five concentrations covering the specified range (e.g., 50%, 75%, 100%, 125%, 150% of target concentration).
- Analyze each concentration in triplicate.
- Plot mean response against concentration.
- Perform linear regression analysis to calculate:
- Slope and y-intercept
- Correlation coefficient (r)
- Coefficient of determination (r²)
- Residual sum of squares
- Evaluate residual plots to detect potential bias in the regression model.
Acceptance Criteria: Correlation coefficient (r) should typically be ≥0.995 for assay methods. The y-intercept should not be significantly different from zero, and residuals should be randomly distributed [7] [5].
Application to Electrochemical Analytical Methods
Adaptation of ICH Q2(R1) Principles to Electrochemical Platforms
The core principles of ICH Q2(R1) can be effectively applied to electrochemical paper-based analytical devices (ePADs) and other electrochemical methods used in pharmaceutical analysis [8]. These sustainable and smart analytical tools are gaining attention for drug measurements in quality control, environmental monitoring (drug residues in wastewater), food safety, and precision medicine applications [8]. When validating such methods, the fundamental validation parameters remain consistent, though their demonstration may require technique-specific approaches.
For specificity in electrochemical methods, this would involve demonstrating that the electrochemical signal (current, potential, impedance) is specific to the target analyte and unaffected by potentially interfering species that may be present in the sample matrix [8]. Accuracy can be established by comparing results against reference methods or through standard addition techniques. Precision studies should account for the unique variables in electrochemical systems, including electrode surface reproducibility, fouling effects, and temperature sensitivity.
The linearity of electrochemical methods is typically demonstrated across the applicable concentration range, with careful consideration of the electrochemical behavior (e.g., diffusion-controlled vs. adsorption-controlled processes) that may affect the response-concentration relationship. Range should be established based on the intended application, from the LOQ to the upper limit of linearity. Robustness studies for electrochemical methods should evaluate the impact of variations in parameters such as electrode pretreatment, electrolyte composition, pH, temperature, and scan rate (for voltammetric techniques) [8].
The Scientist's Toolkit: Essential Materials for Electrochemical Method Validation
Table 2: Key Research Reagent Solutions and Materials for Electrochemical Pharmaceutical Analysis
| Material/Reagent | Function in Validation | Application Notes |
|---|---|---|
| Standard Reference Materials | Certified reference materials of drug substances for accuracy determination and calibration | Essential for establishing method accuracy and preparing calibration standards |
| Electrochemical Cell/Electrode System | Platform for electrochemical measurements; includes working, reference, and counter electrodes | Choice of electrode material (e.g., carbon, gold, modified electrodes) depends on analyte and technique |
| Supporting Electrolyte | Provides ionic conductivity and controls electrochemical environment | Composition and pH can significantly impact electrochemical behavior and must be controlled in robustness studies |
| Redox Mediators | Enhance electron transfer and signal amplification in some electrochemical detection schemes | Used to improve sensitivity and detection limits; stability must be verified |
| Nanomaterial Modifiers | Enhance electrode surface area, electron transfer kinetics, and selectivity | Nanomaterial-modified electrodes can improve LOD and LOQ; reproducibility of modification is critical |
| Membrane Materials | Provide selectivity through molecular recognition or size exclusion | Used in selective electrodes or modified surfaces; stability and reproducibility must be validated |
Regulatory Framework and Recent Evolution
ICH Q2(R1) in the Context of Regulatory Submissions
ICH Q2(R1) continues to serve as the foundational guideline for analytical method validation in regulatory submissions for pharmaceutical products globally [1]. The FDA incorporated Q2A and Q2B into the combined Q2(R1) document in September 2021, maintaining the same substantive content as the original ICH guideline from 2005 [1]. Regulatory authorities expect that analytical procedures used to support drug applications—including methods for release testing, stability studies, and characterization—are properly validated according to these principles [4].
The guideline's applicability spans both chemical and biological drug substances and products, though more complex modalities (such as biologics) often require additional validation considerations beyond the core parameters [3] [4]. For compendial methods (e.g., USP, BP), ICH Q2(R1) recommends verification under actual conditions of use rather than full validation, demonstrating that the method performs satisfactorily when implemented in a specific laboratory with its unique instrumentation, analysts, and environment [5].
Transition to ICH Q2(R2) and ICH Q14
The pharmaceutical industry is currently navigating a transition from ICH Q2(R1) to the updated ICH Q2(R2) guideline, coupled with the introduction of ICH Q14 on "Analytical Procedure Development" [3] [4]. This evolution represents a significant shift toward a more comprehensive lifecycle approach to analytical procedures, emphasizing continuous validation and assessment throughout the method's operational use rather than treating validation as a one-time event [3].
Key enhancements in Q2(R2) include:
- More detailed requirements for validation parameters, with expanded scope for modern analytical technologies [3]
- Mandatory robustness testing tied to lifecycle management [3]
- Explicit linkage between method range and the Analytical Target Profile (ATP) [4]
- Introduction of concepts such as Method-Operable Design Region (MODR) [6]
- Enhanced requirements for statistical evaluation of validation data [3]
ICH Q14 complements Q2(R2) by introducing a structured approach to analytical procedure development, incorporating Quality by Design (QbD) principles and emphasizing science- and risk-based approaches [3] [4]. Together, these guidelines facilitate a more proactive approach to method development and validation, with greater emphasis on understanding method capabilities and limitations throughout the analytical procedure lifecycle.
ICH Q2(R1) establishes the fundamental framework for demonstrating that analytical procedures are suitable for their intended purposes in pharmaceutical analysis. Its core principles—specificity, accuracy, precision, linearity, range, LOD, LOQ, and robustness—provide a comprehensive approach to ensuring that analytical methods generate reliable, reproducible, and scientifically sound data to support drug quality assessment.
As the pharmaceutical analytical landscape evolves with advanced technologies including electrochemical devices, the core principles of ICH Q2(R1) remain relevant, while being enhanced by the more contemporary approaches in ICH Q2(R2) and ICH Q14. Understanding these foundational validation requirements is essential for researchers, scientists, and drug development professionals to ensure regulatory compliance, maintain product quality, and ultimately protect patient safety through reliable analytical data.
Validation Workflow
The International Council for Harmonisation of Technical Requirements for Pharmaceuticals for Human Use (ICH) serves as a cornerstone for global regulatory alignment, creating a unified framework that transcends regional boundaries for pharmaceutical development and quality control. Established to streamline the complex landscape of international regulations, the ICH develops guidelines that harmonize technical requirements, thereby reducing redundant testing and accelerating patient access to new therapies across member regions. The organization brings together regulatory authorities and pharmaceutical industry representatives from key regions including the United States (FDA), the European Union (EMA), and Japan (PMDA), fostering a collaborative environment for developing consensus-driven standards.
The ICH Q2(R1) guideline, titled "Validation of Analytical Procedures: Text and Methodology," represents one of the most significant harmonization achievements in pharmaceutical analysis. This guideline provides a comprehensive framework for validating analytical methods, ensuring they produce reliable, reproducible, and scientifically sound data regardless of geographic location. For researchers utilizing electrochemical pharmaceutical methods, understanding this foundational guideline is crucial for regulatory compliance across major markets. The guideline outlines the core validation parameters that demonstrate an analytical procedure is fit for its intended purpose, creating a common language and expectation among regulatory bodies that facilitates global drug development and approval processes.
Core Principles of ICH Q2(R1) for Analytical Method Validation
The ICH Q2(R1) guideline establishes a harmonized set of validation parameters that analytical procedures must meet to be considered suitable for their intended use in pharmaceutical analysis. These parameters provide a systematic framework for demonstrating method reliability, with the specific requirements varying based on the type of analytical procedure being validated (identification, testing for impurities, or assay). For electrochemical methods in pharmaceutical research, understanding and properly addressing each parameter is essential for generating regulatory-compliant data.
The guideline defines eight core validation characteristics that collectively ensure analytical methods produce trustworthy results. Specificity refers to the ability to assess unequivocally the analyte in the presence of components that may be expected to be present, such as impurities, matrix components, or degradation products. For electrochemical methods, this typically requires demonstrating that the method can distinguish the analyte from interfering substances through techniques such as comparing voltammograms of pure standards versus samples. Accuracy expresses the closeness of agreement between the value found and the value accepted as either a conventional true value or an accepted reference value, and is typically established by spiking known amounts of analyte into the matrix or by comparison with a reference method.
Precision encompasses both repeatability (intra-assay precision under the same operating conditions) and intermediate precision (variations within the same laboratory using different analysts or equipment). The guideline recommends expressing precision as relative standard deviation or coefficient of variation. Linearity demonstrates the ability of the method to obtain test results directly proportional to analyte concentration within a given range, typically established using a minimum of five concentration levels. The range is defined as the interval between the upper and lower concentrations for which suitable levels of linearity, accuracy, and precision have been demonstrated.
Additional parameters include the Limit of Detection (LOD) and Limit of Quantitation (LOQ), which are particularly critical for impurity testing methods. The LOD represents the lowest amount of analyte that can be detected but not necessarily quantified, while the LOQ is the lowest amount that can be quantitatively determined with suitable precision and accuracy. Finally, robustness measures the capacity of the method to remain unaffected by small, deliberate variations in method parameters, providing information about method reliability during normal usage conditions.
Table 1: Core Validation Parameters in ICH Q2(R1) and Their Application to Electrochemical Methods
| Validation Parameter | Definition | Application in Electrochemical Methods | Typical Acceptance Criteria |
|---|---|---|---|
| Specificity | Ability to measure analyte unequivocally in presence of potential interferents | Demonstrate separation from excipients, impurities; use standard addition methods | No interference from matrix components; peak separation in voltammetry |
| Accuracy | Closeness of measured value to true value | Recovery studies using spiked samples; comparison with reference standards | Recovery 98-102% for API; 95-105% for impurities |
| Precision | Degree of agreement among individual measurements | Repeatability: multiple injections of homogeneous sample; Intermediate precision: different days, analysts, equipment | RSD ≤ 2% for assay; ≤ 5% for impurities |
| Linearity | Direct proportionality of response to analyte concentration | Calibration curves with minimum 5 concentrations across specified range | Correlation coefficient r ≥ 0.998 |
| Range | Interval between upper and lower concentration with suitable precision, accuracy, and linearity | Established based on intended method application (assay, impurity testing) | Typically 80-120% of test concentration for assay |
| LOD/LOQ | Lowest detectable/quantifiable analyte concentration | Signal-to-noise ratio (3:1 for LOD; 10:1 for LOQ) or statistical methods | Based on intended method application |
| Robustness | Resistance to deliberate, small parameter variations | Intentional changes in pH, temperature, electrolyte concentration, scan rate | Method remains unaffected by variations |
Comparative Analysis of Regulatory Implementation
Regional Adoption and Interpretation
While ICH Q2(R1) provides a harmonized foundation for analytical method validation, regional implementation exhibits nuanced differences in emphasis and supplementary requirements. The United States Food and Drug Administration (FDA) has fully adopted ICH Q2(R1) and references it in various guidance documents, with a strong emphasis on science-based and risk-based approaches to validation. The FDA places particular importance on method robustness and system suitability testing as ongoing verification of method performance, expecting comprehensive documentation that justifies the chosen validation strategy and acceptance criteria. Recent FDA initiatives, including the creation of the Center for Real-World Evidence Innovation, demonstrate a continued commitment to regulatory modernization while maintaining rigorous standards for analytical validation [9].
The European Medicines Agency (EMA) incorporates ICH Q2(R1) into the European regulatory framework through the European Pharmacopoeia, with additional guidance provided in specific chapters. The EMA places strong emphasis on robustness testing, particularly for methods used in stability studies, and requires detailed documentation in marketing authorization applications. Recent EMA publications have updated principles for identifying and disclosing commercially confidential information and personal data in regulatory submissions, reinforcing transparency while protecting sensitive information [9]. The EMA also emphasizes the importance of analytical method validation within the broader context of quality by design and lifecycle management.
Japan's Pharmaceuticals and Medical Devices Agency (PMDA) closely follows ICH Q2(R1) but maintains more prescriptive requirements in certain areas, reflecting Japan's regulatory environment. The JP guidelines place stronger emphasis on robustness and system suitability testing, and may require additional documentation to meet Japanese regulatory standards. Despite these nuanced differences, the core principles of ICH Q2(R1) remain consistently implemented across all three regions, demonstrating the significant success of harmonization efforts.
Table 2: Regional Implementation of ICH Q2(R1) Across Major Regulatory Agencies
| Regulatory Aspect | FDA (United States) | EMA (European Union) | PMDA (Japan) |
|---|---|---|---|
| Primary Guidance | ICH Q2(R1) adopted into FDA guidance | ICH Q2(R1) incorporated into European Pharmacopoeia | ICH Q2(R1) with JP-specific additions |
| Documentation Emphasis | Science- and risk-based rationale; comprehensive validation reports | Detailed documentation in marketing authorization applications | Prescriptive requirements; additional documentation often required |
| Robustness Focus | Strong emphasis with system suitability testing | Particularly for stability-indicating methods | Very strong emphasis on robustness |
| Recent Developments | Creation of CDER Center for Real-World Evidence Innovation [9] | Updated transparency guidelines for CCI and personal data protection [9] | Ongoing alignment with ICH while maintaining regional specificity |
| Regional Specificities | Focus on data integrity and electronic submissions | Alignment with CTR and clinical trial transparency initiatives | Closer adherence to compendial methods in some cases |
Recent Developments and Evolving Standards
The regulatory landscape for analytical method validation continues to evolve, with significant developments building upon the foundation of ICH Q2(R1). The recently adopted ICH Q2(R2) guideline and the complementary ICH Q14 on analytical procedure development represent the modernized approach to analytical methods, emphasizing lifecycle management and enhanced methodology [10] [11]. These updated guidelines incorporate advances in analytical technology, risk management principles, and data integrity requirements, while maintaining continuity with the core principles established in Q2(R1).
For electrochemical methods, these developments reinforce the importance of Analytical Target Profile (ATP) concept introduced in ICH Q14, which prospectively defines the required performance characteristics of an analytical procedure [11]. The enhanced approach to method development encourages greater understanding of method operation principles and establishes a risk-based control strategy, allowing for more flexible post-approval changes based on scientific rationale. This evolution toward a lifecycle approach treats method validation as an ongoing process rather than a one-time event, with continuous verification and monitoring of method performance [10].
The harmonization of electronic submission standards across regulatory agencies represents another significant development, with FDA issuing guidance on standardized formats for electronic submission of NDA and BLA content [9]. This alignment facilitates the preparation of single sets of documentation acceptable across multiple regions, reducing redundant testing and streamlining global regulatory strategy for pharmaceutical companies.
Experimental Protocols for Electrochemical Method Validation
Specificity and Selectivity Assessment
Establishing specificity for electrochemical methods requires demonstrating that the method can accurately measure the analyte response in the presence of potential interferents typically present in the pharmaceutical sample. The following protocol provides a systematic approach for specificity validation:
Materials and Equipment: Pharmaceutical active ingredient (API) reference standard, placebo/excipient blend, known impurities and degradation products, supporting electrolyte appropriate for the analyte, electrochemical workstation with three-electrode configuration (working, reference, and counter electrodes), pH meter, analytical balance, and appropriate software for data acquisition and analysis.
Procedure:
- Prepare individual solutions of the API reference standard, placebo/excipient blend, and known impurities/degradation products at expected concentration levels in the supporting electrolyte.
- Record voltammograms (or other relevant electrochemical signals) for each solution using identical instrument parameters.
- Prepare a synthetic mixture containing the API with all potential interferents (excipients, impurities) at their maximum expected levels.
- Record voltammogram for the synthetic mixture using identical instrument parameters.
- Compare the voltammetric profiles to demonstrate resolution of the analyte peak from potential interferents.
- For quantitative applications, use standard addition methods to confirm recovery of the analyte in the presence of the sample matrix.
Acceptance Criteria: The analyte peak should be baseline resolved from nearest interfering peak (resolution ≥ 1.5); recovery of analyte in presence of matrix should be 98-102%; no significant interference at the analyte peak position from placebo or impurities.
Linearity and Range Determination
This protocol establishes the relationship between analyte concentration and electrochemical response across the specified range of the method, confirming proportional response and defining the operational range.
Materials and Equipment: API reference standard with known purity, appropriate solvent system, supporting electrolyte, volumetric glassware, electrochemical workstation, and data analysis software with regression capabilities.
Procedure:
- Prepare a stock solution of the API reference standard at a concentration near the upper end of the expected range.
- Prepare a minimum of five standard solutions spanning the expected range (typically 50-150% of target concentration for assay methods, or wider for impurity methods).
- Record voltammograms for each standard solution using identical instrument parameters.
- Measure the peak current (or other relevant response parameter) for each concentration.
- Plot response versus concentration and perform regression analysis to determine correlation coefficient, y-intercept, and slope.
- Calculate the relative standard deviation of response factors if nonlinear fitting is required.
Acceptance Criteria: Correlation coefficient (r) ≥ 0.998 for assay methods; y-intercept not significantly different from zero; response factors show minimal variability (RSD ≤ 2%); residual plot shows random distribution.
Robustness Evaluation
Robustness testing examines the method's capacity to remain unaffected by small, deliberate variations in method parameters, identifying critical factors that require control in the procedure.
Materials and Equipment: API reference standard at target concentration, supporting electrolyte components, pH adjustment solutions, electrochemical workstation, controlled temperature bath, and data analysis software.
Procedure:
- Identify method parameters that may influence results: pH of supporting electrolyte, temperature, electrolyte concentration, scan rate, conditioning time, etc.
- Define a central point (nominal conditions) and variations for each parameter (e.g., pH ±0.2 units, temperature ±2°C).
- Prepare solutions and record voltammograms using varied parameters while keeping other conditions constant.
- Evaluate the impact on critical method attributes: peak current, peak potential, resolution from nearest peak, baseline noise.
- Use experimental design (e.g., Plackett-Burman) for efficient evaluation of multiple parameters if appropriate.
Acceptance Criteria: Variations in method parameters should not cause significant change in results compared to nominal conditions; system suitability criteria should be met under all conditions; no significant trend in results with parameter variation.
Validation Workflow
The Scientist's Toolkit: Essential Research Reagents and Materials
Successful validation of electrochemical pharmaceutical methods requires carefully selected reagents, materials, and equipment that meet regulatory standards for quality and traceability. The following table details essential components of the electrochemical researcher's toolkit, with specific attention to their functions in method validation according to ICH Q2(R1) principles.
Table 3: Essential Research Reagent Solutions for Electrochemical Method Validation
| Reagent/Material | Function in Validation | Quality Standards | Application Notes |
|---|---|---|---|
| Pharmaceutical Reference Standards | Quantitation; accuracy determination; calibration | Certified purity with documentation; traceable to primary standards | Use same lot throughout validation; characterize properly before use |
| Supporting Electrolyte | Provide ionic conductivity; control pH and ionic strength | High-purity salts; appropriate buffer components | Assess purity for electrochemical interference; standardize composition |
| Working Electrodes | Signal generation; analyte interaction | reproducible surface characteristics; appropriate material (Hg, Au, Pt, C) | Establish cleaning/regeneration protocol; document surface history |
| Solvent Systems | Dissolve analyte and electrolyte; medium for analysis | Low water content for non-aqueous; degassed if oxygen-sensitive | Document purity, grade, supplier; control evaporation |
| Standard Buffer Solutions | pH calibration and control; robustness testing | Certified buffer values with uncertainty statements | Use fresh solutions; protect from contamination |
| Quality Control Samples | Precision assessment; system suitability | Representative of actual samples; known stability | Prepare independently from calibration standards |
The harmonization of global regulatory standards through ICH guidelines, particularly ICH Q2(R1), has fundamentally transformed the landscape of pharmaceutical analysis, creating a unified framework that facilitates efficient drug development and approval across international markets. The alignment of FDA, EMA, and PMDA requirements around these harmonized principles has significantly reduced redundant testing requirements while maintaining rigorous standards for data quality and patient safety. For researchers developing electrochemical methods, understanding both the core principles of ICH Q2(R1) and the nuanced interpretations of different regulatory agencies is essential for designing robust, compliant validation protocols.
The ongoing evolution of ICH guidelines, including the recent adoption of Q2(R2) and Q14, builds upon this strong foundation while introducing modern concepts of lifecycle management, enhanced approach to development, and the Analytical Target Profile. These developments represent a shift from prescriptive, "check-the-box" validation toward a more scientific, risk-based framework that encourages deeper understanding of analytical procedures. As regulatory harmonization continues to advance through initiatives led by ICH and other international bodies, the pharmaceutical industry can anticipate further streamlining of global submissions, enhanced regulatory collaboration, and continued alignment of technical requirements – ultimately benefiting patients worldwide through accelerated access to quality medicines.
Within the pharmaceutical industry, the development and validation of robust analytical methods are paramount for ensuring drug safety, quality, and efficacy. The ICH Q2(R1) guideline provides the foundational framework for validating these analytical procedures, detailing key validation criteria such as specificity, accuracy, precision, and linearity. While the guideline is methodology-agnostic, electrochemical methods present a powerful, yet underutilized, suite of techniques for pharmaceutical analysis. These methods leverage the electrochemical properties of analytes to provide highly sensitive, selective, and cost-effective quantitative data.
This technical guide delineates the application of electrochemical techniques across the three core analytical procedure categories—Identification, Impurity Testing, and Assay—within the context of ICH Q2(R1). It provides a detailed examination of the fundamental principles, validation protocols, and practical experimental setups, serving as a comprehensive resource for researchers and drug development professionals aiming to implement these techniques in regulated environments.
Fundamental Electrochemical Techniques and Principles
Electrochemical methods are broadly categorized as interfacial techniques, where the analytical signal (potential, current, or charge) depends on the species present at the interface between an electrode and the solution. The three primary signals give rise to the main electrochemical techniques used in quantitative analysis [12].
Core Techniques
Potentiometry: This method involves measuring the potential of an electrochemical cell under static (zero-current) conditions. The measured potential is related to the activity (and thus concentration) of an ion via the Nernst equation. Ion-selective electrodes (ISEs), including the common pH electrode, are prime examples. Potentiometry is ideal for direct, non-destructive concentration measurements [12].
Coulometry: This technique is based on exhaustive electrolysis of the analyte, where the total charge (in Coulombs) required for its complete oxidation or reduction is measured. According to Faraday's law, this charge is directly proportional to the amount of analyte. Coulometry can be performed at a controlled potential or with a controlled current, offering high accuracy and absolute quantification without requiring calibration [12].
Voltammetry/Amperometry: In voltammetry, a time-dependent potential is applied to the working electrode, and the resulting current is measured as a function of that potential. The resulting plot, a voltammogram, provides both quantitative and qualitative information about the redox species. Cyclic Voltammetry (CV), a common variant, involves scanning the potential linearly and then reversing the scan direction to study redox behavior. Amperometry is a simpler technique where the current is measured at a constant potential [12] [13]. These methods are highly sensitive and can be used to study reaction kinetics and mechanisms.
The division between these techniques and their relationship to the analytical signal is summarized in the diagram below.
Application of Electrochemical Methods in Pharmaceutical Analysis
Electrochemical methods can be strategically deployed to meet the requirements for each analytical procedure category as defined by ICH Q2(R1). Their applicability is driven by the unique electrochemical signatures of pharmaceutical compounds and their impurities.
Assay and Impurity Testing
The quantitative determination of the active pharmaceutical ingredient (API) (Assay) and the control of impurities (Impurity Testing) are two areas where voltammetric and coulometric methods excel due to their high sensitivity and capacity for precise quantification.
Voltammetric Assay and Impurity Analysis: The voltammetric peak current is typically proportional to the concentration of the electroactive species, enabling quantitative analysis. Differential Pulse Voltammetry (DPV), for instance, offers enhanced sensitivity for trace-level analysis. A validated example is the determination of colchicine using a glassy carbon electrode, which achieved a linear range (R² = 0.9998) of 2.4 - 50 μg mL⁻¹ and a detection limit of 0.80 μg mL⁻¹ [14]. The method's selectivity was confirmed by the lack of interference from tablet excipients, fulfilling ICH requirements for specificity [14].
Coulometric Assay: Coulometry provides a direct, absolute quantitative method based on Faraday's law, making it exceptionally accurate for assay determination without the need for a reference standard calibration curve.
Table 1: ICH Q2(R1) Validation Parameters for a Voltammetric Assay (e.g., Colchicine Determination)
| Validation Parameter | Method Performance & Target | Experimental Protocol |
|---|---|---|
| Specificity | No interference from excipients or degradation products [14]. | Compare voltammograms of the API, placebo, and forced degradation samples. The peak of interest should be resolved from interfering signals. |
| Linearity | R² = 0.9998 over a specified range (e.g., 2.4 - 50 μg mL⁻¹) [14]. | Analyze at least 5 concentrations in triplicate. Plot mean peak current (or charge) vs. concentration and perform linear regression. |
| Accuracy | Recovery close to 100% [14]. | Spike a placebo or known API sample at multiple levels (e.g., 80%, 100%, 120%) within the linear range. Calculate % recovery of the added analyte. |
| Precision | Low %RSD for repeatability (intra-day) and intermediate precision (inter-day, inter-analyst) [14]. | Analyze multiple independent preparations of a homogeneous sample (e.g., n=6). For intermediate precision, repeat on a different day or with a different analyst. |
| Detection Limit (LOD) | 0.80 μg mL⁻¹ (S/N ≈ 3) [14]. | Based on signal-to-noise: LOD = 3.3σ/S, where σ is the standard deviation of the response and S is the slope of the calibration curve. |
| Quantification Limit (LOQ) | Sufficient for impurity control (S/N ≈ 10) [14]. | Based on signal-to-noise: LOQ = 10σ/S. Must be demonstrated with acceptable precision and accuracy at the LOQ level. |
Identification
While less common than spectroscopic techniques, electrochemical methods can be used for identification purposes based on a compound's characteristic redox potential. The peak potential (Eₚ) in voltammetry is a compound-specific parameter that can serve as an identity test, analogous to an Rf value in TLC or a retention time in chromatography.
- Protocol for Identification via Cyclic Voltammetry:
- Standard Preparation: Prepare a standard solution of the reference compound in a suitable supporting electrolyte.
- Sample Preparation: Prepare the test sample solution in the same matrix.
- Measurement: Record cyclic voltammograms for both standard and sample solutions under identical conditions (scan rate, electrode, temperature).
- Acceptance Criterion: The peak potential (Eₚ) of the main redox couple for the test sample should match that of the reference standard within a pre-defined window (e.g., ± 10 mV). The shape of the voltammogram should also be visually similar, indicating a similar redox mechanism.
The workflow for developing and validating an electrochemical method for assay and impurity testing, incorporating ICH requirements, is illustrated below.
Detailed Experimental Protocols
Voltammetric Determination of an API: Colchicine Case Study
This protocol is adapted from a validated method for the determination of colchicine, demonstrating adherence to ICH Q2(R1) principles [14].
1. Scope: Quantitative determination of colchicine in bulk substance and tablet dosage forms.
2. Principle: The method is based on the cathodic reduction of colchicine at a glassy carbon electrode, monitored using Differential Pulse Voltammetry (DPV).
3. Materials and Equipment:
- Potentiostat/Galvanostat: e.g., AMEL or equivalent system capable of DPV [13].
- Electrochemical Cell: Three-electrode system.
- Working Electrode: Bare glassy carbon electrode (GCE).
- Counter Electrode: Platinum wire.
- Reference Electrode: Ag/AgCl (3M KCl).
- Supporting Electrolyte: 0.01 M HClO₄/H₃PO₄.
4. Procedure: 1. Electrode Preparation: Polish the GCE with 0.05 μm alumina slurry on a microcloth, then rinse thoroughly with deionized water. 2. Background Solution: Place the supporting electrolyte into the electrochemical cell. De-aerate with nitrogen or argon for at least 10 minutes. 3. Background Scan: Record a DPV background voltammogram from -0.6 V to -1.0 V vs. Ag/AgCl. 4. Standard and Sample Solutions: Add known concentrations of colchicine standard or prepared sample solutions to the cell. De-aerate for 1-2 minutes. 5. Sample Scan: Record the DPV voltammogram using the same parameters. The peak for colchicine will appear at approximately -862 mV vs. Ag/AgCl. 6. Quantification: Measure the peak current. Plot a calibration curve of peak current vs. concentration for standard solutions and use it to determine the concentration in the sample.
Experimental Setup and the Scientist's Toolkit
A reliable electrochemical setup is critical for generating high-quality, reproducible data. The standard configuration is a three-electrode system, which offers superior control over the working electrode potential compared to a two-electrode cell [12] [15].
Table 2: The Scientist's Toolkit: Essential Components for an Electrochemical Experiment
| Item | Function & Description | Common Types & Examples |
|---|---|---|
| Potentiostat/Galvanostat | The core instrument that controls the potential/current between the working and reference electrodes and measures the resulting current/potential [13]. | AMEL 2700, Biologic SP-150; modern devices are often modular and support multiple techniques (CV, EIS, DPV) [13]. |
| Working Electrode (WE) | The electrode where the reaction of interest (analyte oxidation/reduction) occurs. The material is chosen based on the electrochemical window and reactivity [14]. | Glassy Carbon (GC) [14], Hanging Mercury Drop Electrode (HMDE), Boron-Doped Diamond (BDD), Screen-Printed Electrodes (SPE). |
| Reference Electrode (RE) | Provides a stable, known reference potential for the WE. It is a non-polarizable electrode [15]. | Ag/AgCl (3M KCl), Saturated Calomel Electrode (SCE). For non-aqueous systems, pseudo-reference electrodes like Ag wire are sometimes used [15]. |
| Counter Electrode (Auxiliary Electrode) | Completes the electrical circuit by passing all current needed to balance the current at the WE. It is made from an inert material [15]. | Platinum wire or coil, Graphite rod. |
| Electrochemical Cell | The container that holds the electrolyte and the three electrodes, providing an environment for the electrochemical reaction. | Glass or PTFE cells; beaker cells, Swagelok-type cells, or sealed coin cells for air-sensitive electrolytes [15]. |
| Supporting Electrolyte | An inert salt added in high concentration to the solution. Its primary function is to carry current and minimize resistive loss (Ohmic drop), ensuring the potential applied at the WE is accurate [12]. | Phosphate buffer, KCl, NaClO₄, TBAPF₆ (for non-aqueous solutions). |
The arrangement of these components in a three-electrode system is crucial and is shown in the following diagram.
Advanced Applications and Future Directions
The field of electrochemical pharmaceutical analysis is continuously evolving. Advanced techniques and novel device formats are pushing the boundaries of what is possible.
Electrochemical Impedance Spectroscopy (EIS): This technique measures the impedance of an electrochemical system over a range of frequencies. It is exceptionally powerful for characterizing interfacial properties, such as studying the integrity of coatings or the kinetics of surface-bound reactions, which can be relevant for complex dosage forms or biosensors [13].
Electrochemical Paper-Based Analytical Devices (ePADs): These represent a cutting-edge convergence of electrochemistry and microfluidics. ePADs are sustainable, low-cost, and portable, making them ideal for point-of-care testing (POCT), environmental monitoring (e.g., drug residues in wastewater), and decentralized quality control in pharmaceutical settings [8].
Electrochemical Synthesis and Analysis: Electrochemical methods are not limited to analysis. They are also used for the green synthesis of pharmaceutical compounds and intermediates, often under milder conditions and with reduced need for hazardous reagents [13] [16]. The same setup used for analysis can be adapted for synthesis, providing a unified platform for drug development.
Electrochemical methods offer a versatile, sensitive, and robust toolbox for addressing the core analytical needs of the pharmaceutical industry as mandated by the ICH Q2(R1) guideline. From the absolute quantification offered by coulometry to the sensitive and selective voltammetric assays for APIs and impurities, these techniques provide viable and often superior alternatives to traditional chromatographic or spectroscopic methods.
The successful implementation of an electrochemical procedure hinges on a deep understanding of the fundamental principles, meticulous method development, and thorough validation against all relevant ICH parameters. As demonstrated through the colchicine case study, when properly validated for parameters such as specificity, linearity, accuracy, and precision, electrochemical methods can reliably be deployed for drug identification, impurity testing, and assay in both research and quality control environments. The ongoing advancement in instrumentation and the emergence of novel platforms like ePADs promise to further expand the role of electrochemistry in modern pharmaceutical analysis.
The International Council for Harmonisation (ICH) Q2(R1) guideline, titled "Validation of Analytical Procedures: Text and Methodology," provides a foundational framework for establishing the suitability of analytical methods within the pharmaceutical industry [17] [18]. For researchers employing electrochemical pharmaceutical methods, rigorous validation is not merely a regulatory formality but a scientific necessity to ensure that the data generated for drug development, quality control, and regulatory submissions are reliable, accurate, and reproducible [19] [8]. This technical guide provides an in-depth examination of the core validation parameters—Specificity, Accuracy, Precision, LOD, LOQ, Linearity, and Range—within the context of modern electrochemical analysis, offering detailed experimental protocols and data presentation frameworks aligned with ICH Q2(R1) principles.
The evolution of analytical techniques, including the advent of advanced electrochemical paper-based analytical devices (ePADs), underscores the need for robust validation practices. These modern methods, praised for their sustainability and application in drug measurements and precision medicine, must demonstrate the same rigor as traditional assays to gain acceptance from both industrial and regulatory sectors [8]. The validation process provides documented evidence that a method is fit for its intended purpose, which is a cornerstone of Good Manufacturing Practices (GMP) and Good Laboratory Practices (GLP) [18].
Core Principles of ICH Q2(R1)
The ICH Q2(R1) guideline harmonizes the requirements for analytical procedure validation across the European Union, Japan, and the United States, ensuring that pharmaceutical products meet consistent standards for quality, safety, and efficacy [17]. The guideline categorizes analytical procedures based on their purpose—identification, testing for impurities, and assay (content or potency)—and defines the key validation characteristics required for each [7] [18]. It is crucial to understand that the extent of validation required depends on the nature of the method and its application.
A fundamental concept in method validation is that the entire analytical procedure is validated, not just the instrumental technique. This means that the validation evidence must cover all steps from sample preparation to final reporting [17]. More recently, the pharmaceutical landscape is evolving with the introduction of ICH Q2(R2) and ICH Q14, which emphasize a lifecycle approach to method validation, incorporating Quality by Design (QbD) principles and Analytical Target Profiles (ATP) [3]. However, the core parameters defined in Q2(R1) remain the essential foundation upon which these modern approaches are built.
The Scientist's Toolkit: Essential Reagent Solutions
The following table details key reagents and materials commonly employed in the development and validation of electrochemical analytical methods.
Table 1: Essential Research Reagent Solutions for Electrochemical Method Validation
| Reagent/Material | Function in Validation | Application Example |
|---|---|---|
| Pharmaceutical Standard | Serves as the reference analyte of known purity and concentration for establishing method response and calculating accuracy [20]. | Used in preparing calibration standards and accuracy/spike recovery studies. |
| Supporting Electrolyte | Controls the ionic strength and pH of the solution, governing mass transport and electrochemical reaction kinetics at the electrode surface. | A phosphate buffer to maintain a consistent pH for the analysis of an ionizable drug compound. |
| Standard Solutions for Linearity | A series of solutions with concentrations spanning the intended range, used to demonstrate a proportional relationship between response and analyte amount [20] [21]. | Solutions prepared at 50%, 75%, 100%, 125%, and 150% of the target test concentration. |
| Placebo/Matrix Mixture | Contains all excipient components of the formulation except the active ingredient, used to challenge method Specificity [7]. | Spiked with the analyte to prove the measurement is free from interference from non-active components. |
| Forced Degradation Samples | Samples of the drug substance or product subjected to stress conditions (e.g., acid, base, oxidative stress) to generate potential impurities [7]. | Used to prove the Specificity of the assay by demonstrating separation of the analyte peak from degradation products. |
Detailed Examination of Validation Parameters
Specificity
Definition and Regulatory Importance: Specificity is the ability of an analytical method to assess unequivocally the analyte in the presence of components that may be expected to be present, such as impurities, degradation products, and matrix components [7] [18]. It is the cornerstone of a reliable method, ensuring that the measured signal is solely attributable to the target analyte. For electrochemical methods, this translates to verifying that the voltammetric peak or amperometric signal is not obscured or influenced by signals from the drug's excipients, degradation products, or the electrolyte solution itself.
Experimental Protocol for Specificity:
- Analyze Individual Components: Inject or analyze the following separately: the drug substance (active pharmaceutical ingredient, API), the placebo formulation (containing all excipients), and the blank solvent/electrolyte.
- Analyze Spiked Placebo: Analyze a synthetic mixture of the placebo spiked with a known quantity of the API at the target test concentration.
- Forced Degradation Studies: Subject the drug product to stress conditions including acid and base hydrolysis, oxidative stress, thermal degradation, and photolysis. Analyze these stressed samples to demonstrate that the analyte response is unaffected and that the method can detect the degradation products [7].
- Data Interpretation: The method is considered specific if there is no observed interference from the blank or placebo at the retention time (in chromatography) or potential (in voltammetry) of the analyte, and if it can successfully resolve the analyte from its degradation products.
Accuracy
Definition and Regulatory Importance: Accuracy expresses the closeness of agreement between the value that is accepted as a conventional true value or an accepted reference value and the value found [7] [17]. It is a measure of trueness, often reported as percent recovery of the known amount of analyte in the sample.
Experimental Protocol for Accuracy (Recovery Study):
- Preparation of Samples: Prepare a minimum of nine determinations over a minimum of three concentration levels, covering the specified range (e.g., 80%, 100%, and 120% of the target concentration) [7] [20]. This is typically done by spiking the API into the placebo matrix.
- Analysis and Calculation: Analyze each sample and calculate the recovery for each level using the formula: % Recovery = (Measured Concentration / Known Concentration) × 100
- Data Interpretation: Report the recovery at each level and the overall mean recovery. The ICH guideline typically requires mean recovery values to be close to 100%, with acceptance criteria depending on the nature of the test (e.g., 98-102% for an API assay) [20].
Table 2: Experimental Design for Accuracy Determination in a Drug Product Assay
| Spike Level | Known Concentration (μg/mL) | Measured Concentration (Mean ± SD, n=3) (μg/mL) | % Recovery | Acceptance Criteria |
|---|---|---|---|---|
| 80% | 80.0 | 79.2 ± 0.8 | 99.0% | 98.0 - 102.0% |
| 100% | 100.0 | 99.5 ± 0.5 | 99.5% | 98.0 - 102.0% |
| 120% | 120.0 | 119.0 ± 1.2 | 99.2% | 98.0 - 102.0% |
Precision
Definition and Regulatory Importance: Precision measures the closeness of agreement between a series of measurements obtained from multiple sampling of the same homogeneous sample under the prescribed conditions [7] [17]. It is subdivided into three levels: repeatability, intermediate precision, and reproducibility.
Experimental Protocol for Precision:
- Repeatability (Intra-assay Precision):
- Analyze a minimum of six independent preparations of a homogeneous sample at 100% of the test concentration by the same analyst, using the same equipment, on the same day.
- Calculate the Relative Standard Deviation (RSD or CV%) of the results. For assay methods, an RSD of less than 2% is generally acceptable [7].
- Intermediate Precision:
- Demonstrate the reliability of the method under normal laboratory variations, such as different days, different analysts, or different equipment.
- Perform the repeatability experiment on a different day with a different analyst and/or a different instrument.
- The combined RSD from the repeatability and intermediate precision studies should meet pre-defined acceptance criteria.
- Reproducibility:
- Represents precision between different laboratories, typically assessed during method transfer studies [7].
Table 3: Experimental Design and Data for Precision Validation
| Precision Level | Experimental Conditions | Result (Mean ± SD, n=6) | % RSD | Acceptance Criteria |
|---|---|---|---|---|
| Repeatability | Same day, analyst, and instrument | 99.8% ± 0.6% | 0.60% | NMT 2.0% |
| Intermediate Precision | Different day and analyst | 99.5% ± 0.7% | 0.70% | NMT 2.0% |
| Combined Data | --- | 99.7% ± 0.65% | 0.65% | NMT 2.0% |
Limit of Detection (LOD) and Limit of Quantification (LOQ)
Definition and Regulatory Importance:
- LOD: The lowest concentration of an analyte that can be detected, but not necessarily quantified, under the stated experimental conditions. It is a limit test parameter [22] [23].
- LOQ: The lowest concentration of an analyte that can be quantified with acceptable precision and accuracy [22].
Experimental Protocols for LOD and LOQ Determination:
- Signal-to-Noise Ratio (S/N): This approach is common for instrumental methods like HPLC or voltammetry where a baseline noise is present.
- Standard Deviation of the Response and Slope:
- Prepare a series of low-concentration samples and analyze them to generate a calibration curve.
- The LOD and LOQ can be calculated as:
- LOD = 3.3 × σ / S
- LOQ = 10 × σ / S
- Where σ is the standard deviation of the response (y-intercept) and S is the slope of the calibration curve [22].
Linearity and Range
Definition and Regulatory Importance:
- Linearity: The ability of the method to obtain test results that are directly proportional to the concentration of the analyte within a given range [20] [21].
- Range: The interval between the upper and lower concentrations of analyte for which it has been demonstrated that the method has a suitable level of precision, accuracy, and linearity [20].
Experimental Protocol for Linearity and Range:
- Preparation of Standards: Prepare a minimum of five concentrations of the analyte over the specified range. For an assay, this is typically from 80% to 120% of the test concentration [20].
- Analysis and Data Plotting: Analyze each standard in triplicate. Plot the average measured response (e.g., peak current) against the known concentration.
- Statistical Evaluation:
- Perform linear regression analysis on the data to obtain the correlation coefficient (r), slope, and y-intercept.
- The residual sum of squares (RSS) is a critical parameter that quantifies the total deviation of the data points from the fitted regression line. A smaller RSS indicates a better model fit [21].
- The correlation coefficient should be at least 0.995 for assays, and the %y-intercept (bias at 100%) should be within ±2% [20].
Table 4: Acceptance Criteria for Linearity in Different Test Types
| Test Type | Concentration Range | Minimum Number of Levels | Correlation Coefficient (r) | %y-intercept |
|---|---|---|---|---|
| Assay | 80% - 120% of test conc. | 5 | NLT 0.995 | NMT 2.0% |
| Content Uniformity | 70% - 130% of test conc. | 5 | NLT 0.995 | NMT 2.0% |
| Impurities | Reporting Level to 120% of spec. | 5 | NLT 0.997 | NMT 5.0% [20] |
Visual Workflows for Method Validation
Validation Parameter Relationships and Workflow
The following diagram illustrates the logical sequence and interrelationships between the core validation parameters, providing a roadmap for planning a comprehensive validation study.
Figure 1: A sequential workflow for analytical method validation, highlighting the typical order of evaluation for core parameters.
Linearity Evaluation and Residuals
This diagram visualizes the key concepts in linearity evaluation, including the calibration curve, the regression line, and the calculation of residuals which form the basis for the Residual Sum of Squares (RSS).
Figure 2: A workflow detailing the statistical evaluation of linearity, from data plotting to the calculation of the Residual Sum of Squares (RSS).
The rigorous application of ICH Q2(R1) validation parameters is paramount for establishing that any analytical method, including modern electrochemical techniques, is fit for its intended purpose in the pharmaceutical industry. As demonstrated, each parameter—from Specificity to Range—plays a distinct and critical role in building a comprehensive body of evidence that assures the reliability of analytical data. The experimental protocols and acceptance criteria outlined in this guide provide a actionable framework for scientists to generate defensible validation data that meets global regulatory expectations.
The landscape of analytical science is continuously evolving, with guidelines like ICH Q2(R2) and ICH Q14 now promoting a more holistic lifecycle approach that integrates Quality by Design and risk management principles [3]. Nevertheless, the core parameters described in ICH Q2(R1) remain the indispensable foundation. By mastering these fundamental concepts and their practical implementation, researchers and drug development professionals can ensure the quality, safety, and efficacy of pharmaceutical products, thereby upholding the highest standards of public health.
In the highly regulated landscape of pharmaceutical development, method validation serves as the critical bridge between scientific innovation and regulatory compliance. For researchers working with electrochemical pharmaceutical methods, understanding the intrinsic connection between validation protocols and Good Manufacturing Practice (GMP) and Good Laboratory Practice (GLP) requirements is fundamental to ensuring product quality, safety, and efficacy. The International Council for Harmonisation (ICH) Q2(R1) guideline, "Validation of Analytical Procedures: Text and Methodology," provides the foundational framework for demonstrating that analytical procedures are suitable for their intended purpose [24]. This technical guide explores the integration of method validation within the GMP and GLP paradigms, with specific consideration for electrochemical techniques used in pharmaceutical research and quality control.
Method validation transforms a developmental analytical procedure into a validated tool capable of generating reliable and reproducible data that regulatory agencies can trust. For electrochemical methods, this process presents unique challenges and opportunities, requiring researchers to address technique-specific parameters while maintaining alignment with broader quality systems. The lifecycle of an analytical method—from development and validation to routine use—must be managed within a quality framework that ensures continuous compliance with evolving regulatory expectations [3].
The Foundation: Understanding GMP and GLP Frameworks
Good Laboratory Practice (GLP) Requirements
GLP constitutes a quality system covering the organizational process and conditions under which non-clinical laboratory studies are planned, performed, monitored, recorded, reported, and archived. This framework ensures the integrity and reliability of test data submitted to regulatory authorities. A crucial aspect of GLP compliance involves equipment validation to confirm that all instruments used to generate, measure, or assess data are of appropriate design and capacity and consistently function as intended [25].
Under GLP regulations, validation activities extend across multiple domains:
- Facilities, equipment, and analytical methods qualification: Executed through Design Qualification (DQ), Installation Qualification (IQ), Operational Qualification (OQ), and Performance Qualification (PQ)
- Computerized Systems Validation: Particularly relevant for modern electrochemical instruments with digital control and data acquisition systems
- Processes Validation: Ensuring consistent application of analytical procedures
- Cleaning Validation: Critical for preventing cross-contamination in analytical laboratories [25]
For electrochemical methods, this comprehensive validation approach provides assurance that measurements of critical quality attributes reflect the true characteristics of the drug substance or product rather than artifacts of the measurement system.
Good Manufacturing Practice (GMP) Considerations
GMP regulations focus on ensuring that products are consistently produced and controlled according to quality standards appropriate to their intended use. The relationship between validation and GMP is synergistic—validation provides documented evidence that processes, systems, and equipment perform reliably and as intended, thereby supporting GMP compliance [26].
The equipment validation process under GMP consists of three primary phases:
- Pre-validation: Includes Design Qualification (DQ) and Installation Qualification (IQ) to confirm equipment can operate within predetermined specifications
- Process Validation: Comprises Operational Qualification (OQ) and Performance Qualification (PQ) through repeated trials mimicking required processes
- Validation Maintenance: Also known as post-validation or revalidation, involving ongoing monitoring and control [26]
This lifecycle approach enhances the robustness and reliability of manufacturing processes and aligns with regulatory expectations, facilitating smoother inspections and audits. For electrochemical methods deployed in quality control laboratories, this means establishing and maintaining validated states throughout the method's operational life.
ICH Q2(R1): The Method Validation Framework
Core Validation Parameters
ICH Q2(R1) establishes the fundamental validation parameters required to demonstrate the suitability of analytical procedures. While this guidance provides a general framework applicable to various analytical techniques, electrochemical method validation requires careful consideration of technique-specific manifestations for each parameter [24].
Table 1: Core Validation Parameters According to ICH Q2(R1)
| Validation Parameter | Definition | Electrochemical Considerations |
|---|---|---|
| Specificity | Ability to assess unequivocally the analyte in the presence of components | Assessment of interfering signals from electroactive impurities; electrode fouling potential |
| Linearity | Ability to obtain test results proportional to analyte concentration | Linear dynamic range of voltammetric or amperometric response; electrode surface area effects |
| Range | Interval between upper and lower concentration with suitable precision, accuracy, and linearity | Determined by detection technique (e.g., differential pulse vs. square wave voltammetry) |
| Accuracy | Closeness of test results to true value | Use of standard addition methods to address matrix effects; reference material qualification |
| Precision | Degree of agreement among individual test results | Includes repeatability (multiple electrodes) and intermediate precision (different days, analysts) |
| Detection Limit (LOD) | Lowest amount detectable but not necessarily quantifiable | Signal-to-noise approach (typically 3:1); particularly relevant for trace analysis |
| Quantitation Limit (LOQ) | Lowest amount quantifiable with acceptable precision and accuracy | Signal-to-noise approach (typically 10:1); application in impurity profiling |
| Robustness | Capacity to remain unaffected by small, deliberate variations in method parameters | Evaluation of pH, electrolyte composition, temperature, electrode conditioning parameters |
Advanced Applications: Single-Entity Electrochemistry
The emergence of sophisticated electrochemical techniques, including single-entity electrochemistry (SEE), presents both opportunities and validation challenges. SEE encompasses studies where electrochemical signals originate from a single nanoparticle, protein, or cell, requiring specialized validation approaches beyond traditional parameters [27].
Key methodological considerations for advanced electrochemical techniques include:
- Nanoelectrode Fabrication and Characterization: Electrochemical probes with at least one dimension in the nanometer range require validation of fabrication consistency and electrochemical performance [27]
- Single-Nanoparticle Electrocatalysis Validation: Correlation of electrocatalytic activity with structural features of single-entity electromaterials demands rigorous statistical validation approaches [27]
- Single-Cell Electroanalysis: Validation of methods for monitoring real-time cellular dynamics, such as cellular metabolism and communication, requires demonstration of minimal cellular damage while maintaining detection sensitivity [27]
For these advanced applications, validation must extend beyond the ICH Q2(R1) checklist to include technique-specific parameters that ensure data reliability in these cutting-edge research domains.
The Lifecycle Approach: Integrating ICH Q14 and Q2(R2)
Enhanced Method Development and Analytical Quality by Design
The recent introduction of ICH Q14 "Analytical Procedure Development" and the revision of ICH Q2(R2) represent a significant shift toward a more comprehensive lifecycle approach to analytical procedures. These guidelines encourage the adoption of Quality by Design (QbD) principles from the outset, focusing on defining the Analytical Target Profile (ATP) and identifying critical method attributes early in development [3].
For electrochemical methods, this enhanced approach involves:
- Structured Method Development: Implementing systematic approaches including risk assessment and mechanistic understanding of electrochemical processes
- Analytical Target Profile (ATP) Definition: Establishing a predefined objective for the analytical procedure that defines the required quality of the reported results
- Design of Experiments (DoE): Applying statistical experimental design to understand method parameters and their interactions, thereby establishing a method operable design region [3] [28]
This enhanced framework is particularly valuable for complex biopharmaceuticals and advanced therapy medicinal products (ATMPs), where electrochemical methods may be applied to characterize heterogeneous products with limited sample availability [28].
Method Validation in the Q2(R2) Context
The evolution from ICH Q2(R1) to Q2(R2) introduces important updates to validation parameters, enhancing their scope to meet the demands of modern pharmaceutical analysis. These changes have specific implications for electrochemical methods [3]:
- Statistical Rigor: Enhanced requirements for statistical evaluation of validation data, particularly for precision and accuracy studies
- Lifecycle Management: Robustness testing is now compulsory but tied to the lifecycle management approach, requiring continuous evaluation to demonstrate a method's stability against operational variation
- ATP Linkage: Direct connection of the method's range to its ATP, ensuring the validated method meets its intended purpose throughout its lifecycle
This revised framework encourages a more holistic view of method validation as an ongoing process rather than a one-time event, aligning with the continuous verification principles of modern quality systems.
Implementation Strategies: From Theory to Practice
Experimental Protocols for Core Validation Parameters
Implementing a comprehensive validation protocol for electrochemical methods requires careful planning and execution. The following experimental approaches provide practical guidance for addressing key validation parameters:
Specificity Assessment Protocol
- Prepare individual solutions of analyte and potential interferents (excipients, degradation products, metabolites) at expected concentration ratios
- Record voltammetric responses for blank solution, analyte alone, interferents alone, and mixture using optimized parameters (e.g., pulse amplitude, step potential, scan rate)
- Compare peak potentials, peak shapes, and background currents to establish method specificity
- For challenging separations, evaluate modified electrode surfaces or different electrochemical techniques (e.g., switching from cyclic to square wave voltammetry)
Linearity and Range Evaluation Protocol
- Prepare standard solutions at a minimum of five concentration levels across the claimed range
- Analyze solutions in triplicate using the fully optimized electrochemical method
- Plot mean response (peak current, charge, etc.) versus concentration
- Calculate regression parameters (slope, intercept, correlation coefficient) using appropriate statistical methods
- Perform residual analysis to verify homoscedasticity across the range
Robustness Testing Protocol
- Identify critical method parameters through risk assessment (e.g., pH, buffer concentration, temperature, deposition time, electrode surface conditioning)
- Utilize experimental design (e.g., Plackett-Burman or fractional factorial) to efficiently examine parameter effects
- Vary parameters within a realistic operating range and measure impact on key responses (peak current, peak potential, resolution)
- Establish system suitability criteria based on robustness study outcomes
Method Transfer and Revalidation Procedures
The lifecycle of an analytical method often involves transfer between laboratories or modifications to address changing needs. A structured approach to method transfer and revalidation ensures continued compliance with GMP and GLP requirements [24].
Method Transfer Protocol
- Develop a transfer protocol detailing acceptance criteria, responsibilities, and experimental design
- Conduct parallel testing of predefined samples at sending and receiving laboratories
- Apply statistical equivalence testing (e.g., F-test for precision, t-test for accuracy) to compare results
- Document any training requirements or minor method adjustments needed during transfer
Revalidation Triggers and Approaches
- Partial Revalidation: For minor changes (e.g., instrument replacement, column batch variation)
- Assess impact on method performance
- Revalidate specific parameters likely affected by the change
- Full Revalidation: For major changes (e.g., new electrode material, different detection technique)
- Execute complete validation protocol as for a new method
- Include comparability study against original method
Visualization of Method Validation Lifecycle
The following diagram illustrates the integrated lifecycle of an analytical method within the GMP/GLP framework, highlighting the continuous nature of validation activities from development through retirement.
Method Validation Lifecycle
The Scientist's Toolkit: Essential Research Reagent Solutions
Successful implementation of validated electrochemical methods requires careful selection and qualification of reagents and materials. The following table outlines essential components and their functions in ensuring method reliability and compliance.
Table 2: Essential Research Reagent Solutions for Validated Electrochemical Methods
| Reagent/Material | Function | Validation Considerations |
|---|---|---|
| Electrode Materials (glassy carbon, gold, platinum, carbon paste) | Signal transduction platform; defines electrochemical window and sensitivity | Surface reproducibility, pretreatment protocols, lifetime studies, cleaning validation |
| Electrolyte/Supporting Electrolyte | Provides conducting medium; controls double-layer structure | Purity certification, pH/buffer capacity verification, degassing procedures |
| Redox Mediators | Facilitate electron transfer in complex systems; amplify signals | Stability assessment, potential window compatibility, purity documentation |
| Reference Electrodes (Ag/AgCl, calomel, pseudo-reference) | Provide stable potential reference | Potential stability verification, filling solution maintenance, contamination prevention |
| Standard Reference Materials | Quantification and method calibration | Traceability to certified standards, stability studies, handling procedures |
| Surface Modification Agents (polymers, nanomaterials, biological recognition elements) | Enhance selectivity and sensitivity | Modification reproducibility, stability assessment, non-specific binding evaluation |
| Cell Cleaning Solutions | Prevent carryover and contamination | Cleaning efficacy verification, residue testing, compatibility with cell materials |
The connection between method validation and GMP/GLP compliance represents a fundamental requirement for generating reliable data in pharmaceutical development and quality control. For electrochemical methods, this connection ensures that the unique advantages of these techniques—sensitivity, selectivity, and capability for real-time monitoring—are leveraged without compromising data integrity or regulatory standing.
The evolving regulatory landscape, with its emphasis on lifecycle management and enhanced method development, provides opportunities for more robust and reliable analytical procedures. By embracing these principles and implementing comprehensive validation strategies, researchers can strengthen the critical link between method validation and quality systems, ultimately supporting the development of safer and more effective pharmaceutical products.
As the field advances with techniques like single-entity electrochemistry and nanoelectrode applications, the validation framework must adapt while maintaining its fundamental purpose: providing documented evidence that analytical methods are fit for their intended use within regulated environments. Through continued attention to this critical link, the pharmaceutical industry can harness the full potential of electrochemical methods while maintaining the highest standards of quality and compliance.
Implementing ICH Q2(R1) in Electrochemical Method Development and Practice
Electroanalysis has emerged as a critical tool in the pharmaceutical industry, offering versatile and sensitive methods for drug analysis that align with the stringent requirements of modern drug development and quality control [29]. These techniques rely on the measurement of electrical properties—such as current, voltage, and charge—to detect and quantify chemical species in various pharmaceutical matrices [29] [30]. The fundamental principle underpinning electrochemical methods is the measurement of analyte and electrode interaction under an applied voltage, where the redox processes occurring at the electrode surface are critical for the detection and quantification of analytes [29]. Electrochemical techniques offer distinct advantages over traditional analytical methods like spectrophotometry and chromatography, including high sensitivity, minimal sample preparation, cost-effectiveness, and the ability to analyze complex matrices with minimal sample volumes [29].
The pharmaceutical industry employs electrochemical techniques across numerous applications, from drug development and quality assurance to pharmacokinetic studies and therapeutic drug monitoring [29]. These methods are particularly valuable for detecting active pharmaceutical ingredients (APIs), monitoring drug metabolites, ensuring product stability, and identifying impurities or degradation products [29]. Furthermore, with growing concerns about environmental pharmaceutical contamination, electroanalysis plays a vital role in detecting drug residues in water and biological samples [29]. The fundamental setup for most quantitative electrochemical analysis involves a three-electrode system: a working electrode where the redox reaction occurs, a reference electrode that provides a stable potential baseline, and a counter electrode that completes the electrical circuit [30]. Understanding the principles, applications, and validation requirements of these techniques is essential for researchers and drug development professionals working under regulatory frameworks such as the ICH Q2(R1) guideline.
Fundamental Principles and Comparative Analysis of Electrochemical Techniques
Potentiometry: Principle and Applications
Potentiometry is a zero-current technique that measures the potential difference between two electrodes when no net current is flowing through the cell [30]. This potential is a direct function of the concentration or activity of a specific ion in the solution, as described by the Nernst equation [30]. The most familiar application of potentiometry is the measurement of pH using a glass electrode, but its utility in pharmaceutical analysis extends far beyond this common use [30].
In pharmaceutical applications, potentiometry primarily utilizes ion-selective electrodes (ISEs) that are designed to respond selectively to a single type of ion [29] [30]. These electrodes operate on the principle where an applied voltage triggers a redox process at the electrode surface, facilitating ion transfer between the membrane and sample interfaces [29]. Potentiometric multisensor systems, often referred to as "electronic tongues" (ETs), have shown significant promise for pharmaceutical applications, particularly in the rapid quality assessment of drugs [31]. These systems can distinguish between pharmaceutical formulations from different producers due to differences in the ionic composition of their aqueous solutions [31]. For instance, research has demonstrated that electronic tongues can effectively distinguish between 72 paracetamol samples from different countries and manufacturers, providing a fast and simple analytical tool for identification of drug origin and quality assessment [31].
Voltammetry: Principle and Applications
Voltammetry encompasses a group of techniques that measure the current passing through an electrochemical cell as a function of the applied potential [30] [32]. Unlike potentiometry, voltammetry is a dynamic technique that involves systematically sweeping or pulsing the potential of the working electrode while measuring the resulting current [30]. The resulting plot of current versus applied potential is called a voltammogram, which provides both quantitative and qualitative information about the analyte [32]. Voltammetry is renowned for its high sensitivity and capacity to provide extensive information on the electrochemical behavior of analytes [29].
Several voltammetric techniques are employed in pharmaceutical analysis, each with distinct advantages:
- Cyclic Voltammetry (CV): In CV, the potential is scanned in a forward and reverse direction, creating a characteristic current-potential curve. It is particularly valuable for studying the kinetics and mechanisms of redox reactions, providing information about reaction reversibility, electron transfer rates, and the presence of intermediate species [30].
- Differential Pulse Voltammetry (DPV) and Square Wave Voltammetry (SWV): These pulsed techniques apply small, successive potential pulses to the working electrode. They offer significantly enhanced sensitivity compared to classical voltammetry and are widely used for trace analysis of pharmaceuticals [29] [30]. The pulsed nature of these methods helps minimize background current, resulting in a superior signal-to-noise ratio [30].
Voltammetric measurements are straightforward and affordable, allowing for rapid data collection [29]. The technique's ability to provide both qualitative and quantitative data makes it a preferred method for various pharmaceutical applications, from quantifying APIs to analyzing drug compounds in biological matrices [30].
Amperometry: Principle and Applications
Amperometry is an electrochemical technique that measures current at a constant applied potential [30]. Unlike voltammetry, which involves scanning through a range of potentials, amperometry maintains a fixed potential and measures the resulting current, which is directly proportional to the concentration of the electroactive species [30]. This technique is often used in a detection mode, such as in chromatography to detect electroactive compounds as they elute from a column [30].
The most prominent application of amperometry in the healthcare sector is in glucose biosensors, where it measures the current produced by the oxidation of glucose to determine blood sugar levels [30]. In pharmaceutical analysis, amperometry finds applications in various detection systems, including environmental monitoring for compounds like chlorine in water [30]. The technique offers advantages in terms of simplicity and continuous monitoring capabilities, making it suitable for real-time analysis in various pharmaceutical processes.
Comparative Analysis of Techniques
Table 1: Comparative Analysis of Electrochemical Techniques for Pharmaceutical Analysis
| Parameter | Potentiometry | Voltammetry | Amperometry |
|---|---|---|---|
| Measured Quantity | Potential at zero current [30] | Current as function of applied potential [30] [32] | Current at constant potential [30] |
| Primary Pharmaceutical Applications | Ion concentration measurement, formulation distinction, electronic tongues [31] [30] | Trace analysis, drug quantification, reaction mechanism studies [29] [30] | Biosensors, continuous monitoring, detection in flow systems [30] |
| Sensitivity | Moderate | High (especially pulse techniques) [29] | High |
| Selectivity | High with ion-selective electrodes [29] | Moderate to high | Dependent on applied potential |
| Sample Volume | Small to moderate | Small (microliter range) [29] | Small to moderate |
| Key Advantages | Simple, non-destructive, direct concentration measurement [30] | Excellent sensitivity, detailed reaction information, wide dynamic range [29] | Simple implementation, suitable for continuous monitoring |
Experimental Design and Methodologies
Electrochemical Cell Configuration and Electrode Selection
The foundation of any electrochemical experiment is the proper configuration of the electrochemical cell and appropriate selection of electrodes. Most modern electrochemical analyses utilize a three-electrode system consisting of a working electrode, reference electrode, and counter electrode [30]. This configuration provides precise control over the working electrode's potential by ensuring that the current flowing at the working electrode does not affect the stable potential of the reference electrode, leading to more accurate and reliable measurements [30].
Working electrode selection is critical and depends on the specific application and analyte:
- Mercury Electrodes: Historically used in early voltammetry, mercury electrodes (hanging mercury drop electrode - HMDE, dropping mercury electrode - DME) offer a high overpotential for hydrogen evolution, allowing access to negative potentials difficult to achieve with solid electrodes [32]. Their renewable surface minimizes fouling, but toxicity concerns have limited their contemporary use [32].
- Solid Electrodes: Platinum, gold, and various carbon-based electrodes (glassy carbon, carbon paste) are widely used in modern pharmaceutical analysis [29] [32]. These materials offer wide potential windows, low background currents, and can be modified with nanomaterials or biological recognition elements to enhance sensitivity and selectivity [29].
- Chemically Modified Electrodes: Recent advancements focus on modifying electrode surfaces with nanomaterials, polymers, or biological molecules to create tailored sensing platforms with enhanced performance characteristics [29].
The reference electrode (commonly Ag/AgCl or saturated calomel electrode - SCE) maintains a stable, known potential, while the counter electrode (typically a platinum wire) completes the electrical circuit [30] [32].
Step-by-Step Experimental Protocols
Protocol for Voltammetric Analysis of Pharmaceutical Compounds
Sample Preparation: Dissolve the pharmaceutical sample in an appropriate electrolyte solution. The supporting electrolyte (e.g., phosphate buffer, acetate buffer) should be selected to provide sufficient ionic conductivity and appropriate pH for the analysis [29]. Sample volumes can be as small as microliters [29].
Instrument Calibration: Calibrate the potentiostat using standard solutions of the analyte. Establish a calibration curve by measuring current responses at known concentrations [4].
Electrode Preparation: Polish the working electrode (e.g., glassy carbon) with alumina slurry on a polishing cloth to obtain a mirror-like finish. Rinse thoroughly with deionized water between polishing steps and before measurements [29].
Deaeration: Purge the solution with inert gas (nitrogen or argon) for 10-15 minutes to remove dissolved oxygen, which can interfere with the measurement through redox reactions [32].
Parameter Setting: Based on preliminary scans (often cyclic voltammetry), establish optimal parameters for quantitative analysis:
Measurement: Record voltammograms of standard solutions and samples under identical conditions.
Data Analysis: Quantify the analyte concentration using the standard addition method or from the calibration curve, ensuring the measurements fall within the linear range [4].
Protocol for Potentiometric Electronic Tongue Analysis of Formulations
Sample Preparation: Prepare solutions of pharmaceutical formulations by dissolving tablets or capsules in deionized water. For consistency, use fixed dilution factors across all samples [31].
Sensor Array Calibration: Calibrate the multisensor system with standard solutions representing expected ions and excipients. The potentiometric sensor array typically includes sensors with cross-selectivity to various ions [31].
Measurement Sequence: Measure each sample solution with the entire sensor array. Record the stable potential readings for each sensor-sample combination. Perform measurements in triplicate to ensure reproducibility [31].
Data Collection: Collect the potentiometric response data, typically ranging from -300 to +150 mV depending on the specific sensor [31]. Ensure standard deviation over replicates does not exceed 5 mV for acceptable reproducibility [31].
Chemometric Analysis: Process the multidimensional data using pattern recognition techniques such as Principal Component Analysis (PCA) or Partial Least Squares Discriminant Analysis (PLS-DA) to classify samples based on their origin, manufacturer, or quality attributes [31].
Research Reagent Solutions and Essential Materials
Table 2: Essential Research Reagents and Materials for Electrochemical Pharmaceutical Analysis
| Reagent/Material | Function/Application | Technical Specifications |
|---|---|---|
| Supporting Electrolyte | Provides ionic conductivity, controls pH, minimizes migration current | Phosphate buffer (0.1 M, pH 7.4), acetate buffer (0.1 M, pH 4.5), lithium perchlorate (0.1 M) |
| Standard Reference Materials | Method calibration, accuracy determination | High-purity pharmaceutical standards (USP, EP grade) with certified concentrations [4] |
| Electrode Polishing Materials | Maintain reproducible electrode surface | Alumina or diamond polishing suspensions (0.05-1.0 μm particle size) |
| Ion-Selective Membrane Components | Fabrication of potentiometric sensors | Poly(vinyl chloride) matrix, plasticizers (e.g., o-NPOE), ionophores specific to target ions [29] |
| Nanomaterial Modifiers | Enhance electrode sensitivity and selectivity | Carbon nanotubes, graphene oxide, metal nanoparticles for electrode modification [29] [8] |
| Deaeration Agents | Remove interfering oxygen from solutions | High-purity nitrogen or argon gas |
Method Validation According to ICH Q2(R1) Guidelines
The ICH Q2(R1) guideline provides a comprehensive framework for validating analytical procedures to ensure they are suitable for their intended purpose [4] [2]. For electrochemical methods in pharmaceutical analysis, several key validation parameters must be addressed:
Specificity
Specificity is the ability to assess unequivocally the analyte in the presence of components that may be expected to be present, such as impurities, degradation products, or matrix components [4]. For electrochemical methods, specificity must be demonstrated by:
- Showing that excipients and known impurities do not produce significant signals at the potential where the analyte is measured [4].
- For voltammetric methods, sufficient separation of peak potentials for analyte and potential interferents.
- For potentiometric methods, demonstrating appropriate selectivity coefficients against interfering ions [29].
Linearity and Range
Linearity is the ability of the method to obtain test results directly proportional to the concentration of the analyte [4]. The range is the interval between the upper and lower concentrations for which linearity, accuracy, and precision have been demonstrated [4]. For electrochemical methods:
- A minimum of five concentration levels should be used to establish linearity [4].
- Voltammetric methods typically exhibit a wide linear dynamic range, often over several orders of magnitude [29] [30].
- The correlation coefficient, y-intercept, and slope of the regression line should be reported with appropriate statistical measures [4].
Accuracy
Accuracy expresses the closeness of agreement between the accepted reference value and the value found [4]. For electrochemical pharmaceutical methods, accuracy is typically established using:
- Spiked samples with known amounts of analyte across the specified range [4].
- Comparison with results from a validated reference method [4].
- Recovery studies at multiple concentration levels (e.g., 80%, 100%, 120% of target concentration) with acceptable recovery generally in the 98-102% range for APIs [4].
Precision
Precision encompasses repeatability (intra-day precision) and intermediate precision (inter-day, inter-analyst, inter-instrument variability) [4]:
- Repeatability: Expressed as %RSD from a minimum of six determinations at 100% of the test concentration [4]. For pharmaceutical assays, %RSD should typically not exceed 2% [4].
- Intermediate Precision: Established by having different analysts perform the analysis on different days using different instruments [4].
Detection and Quantitation Limits
The Detection Limit (LOD) is the lowest amount of analyte that can be detected but not necessarily quantified, while the Quantitation Limit (LOQ) is the lowest amount that can be quantified with acceptable accuracy and precision [4]. For electrochemical methods:
- LOD and LOQ can be determined based on the signal-to-noise ratio (typically 3:1 for LOD and 10:1 for LOQ) [4].
- Voltammetric techniques, particularly pulse methods like DPV and SWV, offer exceptionally low detection limits, sometimes enabling analysis at subpicogram levels [29].
Robustness
Robustness is a measure of the method's capacity to remain unaffected by small, deliberate variations in method parameters [4]. For electrochemical methods, this includes evaluating the impact of:
- Variations in pH of the supporting electrolyte
- Changes in scanning rate or pulse parameters (for voltammetry)
- Temperature fluctuations
- Different batches of working electrodes or sensor arrays
Table 3: Key Validation Parameters and Typical Acceptance Criteria for Electrochemical Pharmaceutical Methods
| Validation Parameter | Typical Acceptance Criteria | Technique-Specific Considerations |
|---|---|---|
| Specificity | No interference from excipients, impurities, or degradation products | For voltammetry: baseline separation of peaks; For potentiometry: selectivity coefficients documented |
| Linearity | Correlation coefficient (r) > 0.998 | Wide linear dynamic range especially for voltammetric techniques [29] |
| Accuracy | Recovery 98-102% | Standard addition method often employed for complex matrices |
| Precision (Repeatability) | %RSD ≤ 2% | Multiple measurements (n≥6) at target concentration |
| LOD | Signal-to-noise ratio ≥ 3:1 | Exceptionally low LOD achievable with pulse voltammetry [29] |
| LOQ | Signal-to-noise ratio ≥ 10:1, with accuracy and precision | Subpicogram levels possible with advanced voltammetry [29] |
| Robustness | Method performance unaffected by small parameter variations | Evaluation of pH, temperature, electrode variations |
Advanced Applications and Future Perspectives
Electrochemical techniques continue to evolve with technological advancements, opening new possibilities for pharmaceutical analysis. Recent innovations include:
Nanomaterial-Enhanced Sensors: The integration of nanotechnology has significantly advanced electroanalysis in pharmaceuticals [29] [8]. Nanostructured electrodes using materials such as carbon nanotubes, graphene, and metal nanoparticles enhance sensitivity and specificity by increasing the electroactive surface area and facilitating electron transfer processes [29]. These advancements have paved the way for improved drug screening and therapeutic monitoring capabilities [29].
Paper-Based Analytical Devices: Recent developments in electrochemical paper-based analytical devices (ePADs) represent a promising direction for sustainable pharmaceutical analysis [8]. These devices offer affordable, portable, and disposable platforms for drug quality control, environmental monitoring of drug residues, and point-of-care testing applications [8]. Their simplicity and cost-effectiveness make them particularly valuable for resource-limited settings and rapid screening applications [8].
Miniaturized and Portable Systems: The trend toward miniaturization has enabled the creation of portable and handheld electrochemical devices for on-site testing [30]. These systems are particularly valuable for quality control in manufacturing settings, environmental monitoring, and point-of-care therapeutic drug monitoring [29] [30]. The development of wearable electrochemical sensors further extends these capabilities to real-time patient monitoring, enabling personalized medicine and more precise dosing strategies [29] [8].
Artificial Intelligence and Data Analysis: The integration of artificial intelligence (AI) and machine learning with electrochemical analysis is transforming data interpretation and method optimization [29]. AI-driven approaches can streamline drug screening, quality control processes, and the management of complex electrochemical data sets [29] [33]. Furthermore, machine learning models are being applied to predict drug solubility and optimize analytical parameters, enhancing the efficiency of method development [33].
Organ-on-a-Chip and Advanced Models: Emerging technologies such as organ-on-a-chip systems integrated with electrochemical sensors represent the cutting edge of pharmaceutical analysis [8]. These innovative platforms enable more physiologically relevant drug testing and screening, potentially improving the predictive power of preclinical studies [8].
The following diagram illustrates the typical workflow for developing and validating electrochemical methods in pharmaceutical analysis according to regulatory standards:
The selection of appropriate electrochemical techniques—voltammetry, amperometry, and potentiometry—for pharmaceutical analysis requires careful consideration of the specific analytical problem, required sensitivity, sample matrix, and regulatory requirements. Voltammetry offers exceptional sensitivity and detailed electrochemical information, making it ideal for trace analysis and mechanistic studies. Potentiometry provides simplicity and direct measurement of ion activities, with electronic tongues showing particular promise for rapid formulation discrimination. Amperometry excels in continuous monitoring applications and biosensing platforms.
When properly developed and validated according to ICH Q2(R1) guidelines, electrochemical methods provide robust, reliable, and cost-effective solutions for pharmaceutical analysis across the product lifecycle. The continuing advancement of these techniques through nanotechnology, miniaturization, and artificial intelligence integration ensures their growing importance in addressing the evolving challenges of modern pharmaceutical research and quality control. As the field progresses, electrochemical methods are poised to become even more indispensable tools for ensuring drug safety, efficacy, and quality in an increasingly complex pharmaceutical landscape.
Electrochemical methods have garnered significant attention in pharmaceutical analysis due to their sensitivity, selectivity, and potential for miniaturization and portability. The development of robust electrochemical methods requires a systematic approach to ensure reliability, reproducibility, and compliance with regulatory standards such as the International Council for Harmonisation (ICH) Q2(R1) guideline, which provides a framework for analytical procedure validation [18]. This technical guide outlines a structured pathway for electrochemical method development, from initial electrode selection to supporting electrolyte optimization, all within the context of ICH Q2(R1) requirements for pharmaceutical analysis.
The validation of analytical methods is a "fundamental requirement for ensuring compliance with Good Laboratory Practices and Current Good Manufacturing Practices" in pharmaceutical development [18]. As electrochemical techniques continue to evolve, with recent advances in paper-based analytical devices and other innovative platforms, the need for systematic development and validation approaches becomes increasingly important [8].
Foundational Principles of Electrochemical Systems
Electrochemical systems function through controlled charge transfer at the interface between an electrode and an electrolyte. In these systems, "reactants are consumed, producing electrical current or using it to drive chemical transformations" [34]. Understanding the fundamental components and processes is essential for effective method development.
The core components of any electrochemical system include:
- Working electrode: Where the reaction of interest occurs
- Counter electrode: Completes the electrical circuit
- Reference electrode: Provides a stable potential reference
- Electrolyte solution: Facilitates ion conduction between electrodes
Optimizing these systems involves balancing multiple performance parameters including energy conversion efficiency, operational lifespan, mass transport characteristics, and kinetic limitations [34]. The interaction between the electrode surface and the electrolyte, known as the interface, is particularly critical as it is where charge transfer reactions occur.
Systematic Method Development Framework
Electrode Selection and Characterization
The working electrode serves as the transduction element in electrochemical detection and its selection significantly influences method performance. Common electrode materials include glassy carbon, gold, platinum, and various modified electrodes tailored for specific applications.
Glassy Carbon Electrodes (GCE) are widely employed in pharmaceutical analysis due to their wide potential window, low cost, and suitability for various applications. For instance, in the determination of colchicine, a bare GCE was selected for its satisfactory performance across a concentration range of 2.4-50 μg/mL with a detection limit of 0.80 μg/mL [14]. Similarly, GCE was utilized for paclitaxel determination with a linear range of 5×10⁻⁵ to 5×10⁻⁴ mol/L and a detection limit of 9.15×10⁻⁸ mol/L [35].
Electrode surface area determination is a critical characterization step. The Randles-Sevcik equation for reversible processes enables calculation of electrode surface area:
[ I{pa} = 0.4463 \left(\frac{F^3}{RT}\right)^{1/2} A n^{3/2} DR^{1/2} C_0 v^{1/2} ]
Where Ipa is the anodic peak current, F is Faraday's constant, R is the gas constant, T is temperature, A is electrode surface area, n is the number of electrons transferred, DR is the diffusion coefficient, C0 is concentration, and v is scan rate [35]. Using this approach with 1 mM K₃Fe(CN)₆ as a probe, researchers calculated a GCE surface area of 0.0548 cm² [35].
Table 1: Electrode Selection Criteria for Pharmaceutical Applications
| Electrode Type | Advantages | Limitations | Representative Application |
|---|---|---|---|
| Glassy Carbon | Wide potential window, low cost, good mechanical stability | Surface fouling in complex matrices | Colchicine determination [14] |
| Film-Coated Electrodes | Enhanced sensitivity for specific analytes | Poorer intra-day reproducibility, longer analysis time | Colchicine analysis (Bi film, Hg film) [14] |
| Paper-Based | Portable, sustainable, low-cost | Potential performance decline during scale-up | Drug measurements for quality control [8] |
Supporting Electrolyte Optimization
The supporting electrolyte plays a crucial role in electrochemical systems by providing ionic conductivity, maintaining a constant ionic strength, and influencing the electrochemical reaction mechanism through pH effects.
The optimization process for supporting electrolytes involves:
- Initial screening of different electrolyte systems
- pH optimization within stable operational ranges
- Concentration effects evaluation on signal response
- Interference assessment from matrix components
In the determination of paclitaxel, researchers screened multiple electrolyte systems including acetate buffer, B-R buffer, NaOH, citric acid-sodium citrate, KCl, HCl, phosphate buffer, and H₂SO₄ [35]. They found that "the voltammetry peak obtained with pH 4.0 5 M acetate buffer was the best," noting that "acetic acid has a relatively low dielectric constant (ε = 6.15 at 25°C), which causes a slight dissociation of the electrolyte and further reduces the ohmic potential significantly" [35].
pH optimization requires special consideration as it can affect both the electrochemical reaction and the stability of the analyte. For paclitaxel microemulsion, researchers noted that "while the pH value of the supporting electrolyte is greater than 4.0, the mixed solution of paclitaxel microemulsion and supporting electrolyte is turbid, possibly because the increasing pH destroys the formation of the microemulsion and demulsification occurs" [35]. This highlights the importance of considering formulation stability during pH optimization.
Table 2: Supporting Electrolyte Optimization for Pharmaceutical Compounds
| Analyte | Optimal Electrolyte | pH Effects | Key Findings |
|---|---|---|---|
| Paclitaxel | 5.0 M acetate buffer (pH 4.0) | Peak potential shifts negative with increasing pH; instability above pH 4.0 | Linear range: 5×10⁻⁵ to 5×10⁻⁴ mol/L; LOD: 9.15×10⁻⁸ mol/L [35] |
| Colchicine | HClO₄/H₃PO₄ 0.01 M | Cathodic peak strongly influenced by alkaline environment with shift towards more negative potentials | Linear range: 2.4-50 μg/mL; LOD: 0.80 μg/mL [14] |
Experimental Parameter Optimization
Multiple experimental parameters require systematic optimization to ensure robust electrochemical method performance:
Scan Rate Studies help elucidate the reaction mechanism. The relationship between peak current (ip) and scan rate (v) provides information on whether the process is diffusion-controlled (ip ∝ v¹/²) or adsorption-controlled (ip ∝ v) [35]. For paclitaxel, the oxidation process was found to be "irreversible and controlled by diffusion" [35].
Potential Windows must be established to ensure sufficient signal response while minimizing background interference. For colchicine determination, researchers identified an irreversible, diffusion-controlled peak at -862 mV vs. Ag/AgCl reference electrode [14].
Instrument Parameters including pulse amplitude, step potential, and quiet time require optimization for pulse techniques such as differential pulse voltammetry.
The following workflow outlines the systematic method development process:
Systematic Method Development Workflow
Method Validation According to ICH Q2(R1)
The ICH Q2(R1) guideline provides a harmonized framework for analytical procedure validation across different regulatory regions [18]. Validation is "documented evidence that provides high degree of assurance to a desired result with predetermined compliance" [18]. For electrochemical methods in pharmaceutical analysis, the following validation parameters are essential:
Specificity
Specificity is the "ability to assess unequivocally the analyte in the presence of components which may be expected to be present" [18]. This includes:
- Identification: Recognition of target analytes
- Purity tests: Assessment of potential impurities
- Assay (content or potency): Quantitative determination of API
For colchicine determination, the method demonstrated specificity through successful application to tablet formulations "without the interference of the excipients" [14].
Accuracy, Precision, and Linearity
Accuracy expresses the closeness of agreement between the accepted reference value and the value found [18]. In the paclitaxel method, recovery values of 99.22%-101.69% were obtained, demonstrating excellent accuracy [35].
Precision includes repeatability (intra-day), intermediate precision (inter-day), and reproducibility. The paclitaxel method showed excellent repeatability with RSD of 0.90% [35], while the colchicine method demonstrated poorer intra-day reproducibility for film-coated electrodes compared to bare GCE [14].
Linearity demonstrates the ability to obtain test results proportional to analyte concentration. The relationship between peak current and paclitaxel concentration was linear in the range of 5×10⁻⁵ mol/L to 5×10⁻⁴ mol/L [35], while colchicine showed linearity from 2.4 to 50 μg/mL [14].
Range, LOD, and LOQ
The range is the interval between upper and lower concentration levels with suitable precision, accuracy, and linearity [18].
Limit of Detection (LOD) and Limit of Quantification (LOQ) represent the lowest detectable and quantifiable amounts, respectively. The following table summarizes these parameters for the referenced methods:
Table 3: Method Validation Parameters for Electrochemical Pharmaceutical Analysis
| Validation Parameter | Paclitaxel Method | Colchicine Method |
|---|---|---|
| Linearity Range | 5×10⁻⁵ to 5×10⁻⁴ mol/L | 2.4-50 μg/mL |
| LOD | 9.15×10⁻⁸ mol/L | 0.80 μg/mL |
| LOQ | Not specified | Not specified |
| Accuracy (Recovery) | 99.22%-101.69% | Not specified |
| Precision (RSD) | 0.90% | Not specified |
| Specificity | Demonstrated in real samples | No excipient interference |
The Scientist's Toolkit: Essential Research Reagents and Materials
Successful development and validation of electrochemical methods requires specific reagents and materials. The following table details essential components:
Table 4: Essential Research Reagents and Materials for Electrochemical Method Development
| Item | Function | Application Examples |
|---|---|---|
| Glassy Carbon Electrode | Working electrode for electron transfer | Colchicine determination [14], Paclitaxel analysis [35] |
| Acetate Buffer | Supporting electrolyte with low dielectric constant | Optimal for paclitaxel determination [35] |
| Mixed Acid Electrolytes | Supporting electrolyte for specific potential windows | Colchicine determination in HClO₄/H₃PO₄ [14] |
| Film-Coating Materials | Electrode modification for enhanced sensitivity | Bismuth or mercury films for colchicine analysis [14] |
| Porous Solid Electrolytes | Ion conductors in specialized reactors | H₂O₂ electrosynthesis [36] |
| Standard Reference Materials | Method calibration and validation | Pharmacopeial standards for ICH compliance [18] |
Advanced Considerations and Future Directions
Scaling Challenges and Solutions
Scaling electrochemical systems presents unique challenges. In the development of porous solid electrolyte (PSE) reactors for H₂O₂ electrosynthesis, researchers observed that "performance decline during reactor scale-up is primarily caused by the uneven flow field in the PSE layer" [36]. Similar considerations apply when transferring analytical methods from research to routine use.
Addressing scale-up challenges requires:
- Systematic investigation of factors including "material selection, assembly parameters, flow field patterns, and operating conditions" [36]
- Optimization based on "ion conduction, reaction thermodynamics, and flow field distribution" [36]
- Development of "modular electrode stack" designs to maintain efficiency without significant performance decline [36]
Emerging Technologies
Paper-based electrochemical analytical devices represent a promising advancement, serving as "sustainable and smart analytical tools" with "versatile applications in diverse fields" including pharmaceutical quality control, environmental monitoring, and precision medicine [8].
These devices offer advantages including:
- Sustainability and low cost
- Portability for point-of-care testing
- Compatibility with wearable formats
- Multifaceted properties for versatile applications
Systematic method development for electrochemical pharmaceutical analysis requires a structured approach from initial electrode selection through comprehensive validation according to ICH Q2(R1) guidelines. By carefully optimizing electrode materials, supporting electrolytes, and experimental parameters, researchers can develop robust methods capable of meeting regulatory requirements for specificity, accuracy, precision, and linearity.
The integration of emerging technologies such as paper-based devices and porous solid electrolyte systems promises to expand the applications of electrochemical analysis in pharmaceutical quality control, environmental monitoring, and precision medicine. Throughout this evolution, adherence to systematic development and validation principles remains essential for generating reliable, regulatory-compliant analytical data.
Defining the Analytical Target Profile (ATP) for Electrochemical Methods
An Analytical Target Profile (ATP) is a foundational concept in modern analytical procedure development, defined as a prospective summary of the performance requirements for an analytical procedure. It precisely defines the quality and characteristics a method must deliver to be fit for its intended use. Within the framework of ICH Q2(R1) guidelines, the ATP establishes the criteria against which an analytical method is validated, ensuring it consistently produces results that meet predefined standards of quality, safety, and efficacy for pharmaceutical products. The ATP shifts the method development paradigm from a one-time validation exercise to a lifecycle approach, emphasizing continuous method performance and robustness throughout its operational use [3].
The transition from ICH Q2(R1) to ICH Q2(R2), complemented by ICH Q14 on analytical procedure development, formalizes this ATP-centric approach. These updated guidelines encourage a more structured, science- and risk-based methodology for developing and validating analytical procedures. For electrochemical methods used in pharmaceutical analysis—ranging from therapeutic drug monitoring to quality control of biologics—defining a clear ATP is critical. It ensures these methods deliver the necessary precision, accuracy, and reliability to support decisions in drug development, manufacturing, and control [4] [3].
Core ATP Components and Validation Parameters for Electrochemical Methods
For electrochemical methods, the ATP must translate the intended purpose of the analysis into specific, measurable performance characteristics. These characteristics align directly with the validation parameters outlined in ICH Q2(R1) and its successor, ICH Q2(R2). The following table summarizes the core validation parameters and how they manifest in the context of electrochemical sensing.
Table 1: Core ATP Components and Validation Parameters for Electrochemical Methods
| ATP Component | ICH Q2(R1) Validation Parameter | Description & Application in Electrochemical Methods |
|---|---|---|
| Intended Analytic & Matrix | Specificity/Selectivity | Ability to measure the analyte accurately in the presence of potential interferents (e.g., excipients, metabolites, other electroactive species). For example, an ATP for an aptasensor must confirm no cross-reactivity with structurally similar molecules [37]. |
| Required Level of Quantification | Limit of Detection (LOD) / Limit of Quantitation (LOQ) | The lowest amount of analyte that can be detected or quantified with acceptable accuracy and precision. Electrochemical methods often achieve very low LODs, e.g., 3.3×10⁻¹⁶ M for ATP in an aptasensor [37]. |
| Working Range | Range and Linearity | The interval between the upper and lower concentration of analyte for which the method has suitable accuracy, precision, and linearity. A direct correlation between analyte concentration and signal response (e.g., current, potential) must be demonstrated [4]. |
| Accuracy & Precision Thresholds | Accuracy and Precision | Accuracy (closeness to true value) and Precision (repeatability and intermediate precision) are critical. Expressed as % Recovery and % Relative Standard Deviation (%RSD), with %RSD ≤ 2% often targeted for assay methods [4]. |
| Performance Robustness | Robustness | The method's reliability under small, deliberate variations in operational conditions (e.g., pH, temperature, electrolyte composition, electrode surface ageing). This is now compulsory under ICH Q2(R2) and tied to lifecycle management [3]. |
The ATP provides the target for method development, and the subsequent validation study demonstrates that the developed electrochemical method meets all the pre-defined criteria. A key output of the validation is the establishment of a control strategy, which includes ongoing system suitability tests to confirm the analytical system performs as expected before each use [4].
Methodologies and Experimental Protocols for Electrochemical ATP Validation
Translating the theoretical ATP into a validated electrochemical method requires rigorous experimental protocols. The following examples illustrate detailed methodologies for different electrochemical techniques, showcasing how validation parameters are empirically determined.
Protocol: Validating an Aptamer-Based Sensor for ATP Detection
This protocol is based on a label-free electrochemical aptasensor using a composite-modified electrode for the detection of Adenosine Triphosphate (ATP) [37].
- Objective: To develop and validate a specific and sensitive electrochemical method for ATP quantification with a defined LOD, LOQ, and linear range.
- Electrode Modification and Sensor Fabrication:
- Synthesis of AP-Gr/AuNPs Composite: Azophloxine-Functionalized Graphene (AP-Gr) is produced by reducing graphene oxide with hydrazine in the presence of azophloxine. Gold nanoparticles (AuNPs) are then formed on the AP-Gr surface by adding PDDA, HAuCl₄, and reducing with NaBH₄ in a water bath.
- Electrode Preparation: A Glassy Carbon Electrode (GCE) is polished to a mirror finish with alumina slurry, followed by sequential washing. The AP-Gr/AuNPs composite is drop-cast onto the clean GCE surface and dried.
- Aptamer Immobilization: A thiolated ATP-binding aptamer (HS-ABA) is incubated with Tris(2-carboxyethyl)phosphine hydrochloride (TCEP) to reduce disulfide bonds. The aptamer solution is then dropped onto the AP-Gr/AuNPs/GCE surface, forming a self-assembled monolayer via Au-S bonds.
- Experimental Procedure and Data Acquisition:
- The fabricated sensor (HS-ABA/AP-Gr/AuNPs/GCE) is immersed in ATP solutions of varying concentrations.
- After a 20-minute incubation, Differential Pulse Voltammetry (DPV) is performed in Tris-HCl buffer.
- The decrease in the DPV peak current of the azophloxine probe, resulting from the formation of the ABA-ATP complex on the electrode surface, is measured.
- Validation Data Extraction:
- Linearity & Range: A linear calibration curve is constructed by plotting the peak current response against ATP concentration from 1.0×10⁻¹⁵ M to 1.0×10⁻¹² M.
- LOD/LOQ: The LOD of 3.3×10⁻¹⁶ M is calculated based on the standard deviation of the blank and the slope of the calibration curve.
- Specificity: The sensor's response to ATP is compared to its response to interferents like CTP, GTP, and UTP to confirm specificity.
- Accuracy/Precision: Repeatability (intra-assay precision) is assessed by measuring replicate samples at different concentration levels within the linear range [37].
Protocol: Validating a Competitive Displacement Assay for Real-Time ATP Monitoring
This protocol outlines a double-surface competitive assay for real-time ATP monitoring, demonstrating an alternative electrochemical approach [38].
- Objective: To validate a wash-free electrochemical method for real-time, quantitative monitoring of ATP over a wide concentration range.
- Assay Configuration:
- Recognition Surface: ATP aptamer (ATPA) capture probes are immobilized on avidin-coated beads. These probes are pre-bound with an electroactive reporter molecule, Flavin Adenine Dinucleotide (FAD).
- Signaling Surface: A carbon paste electrode is modified with graphene (Gr) and gold nanoparticles (AuNPs) to enhance electron transfer kinetics and signal sensitivity (Gr-AuNP-CPE).
- Experimental Procedure and Data Acquisition:
- The recognition beads are mixed with the sample containing ATP. ATP binding displaces the pre-bound FAD into solution.
- The released FAD is quantitatively monitored in real-time at the Gr-AuNP-CPE signaling surface using Adsorptive Stripping Square Wave Voltammetry (AdS-SWV).
- An accumulation potential of -0.7 V is applied with stirring for 30-240 seconds, followed by SWV scanning.
- Validation Data Extraction:
- Linearity & Range: The assay demonstrates a wide linear working range from 1.14×10⁻¹⁰ M to 3.0×10⁻⁵ M.
- LOD: A low detection limit of 2.01×10⁻¹¹ M is achieved.
- Robustness & Applicability: The method's reliability is tested in complex biological matrices like blood serum and fruit samples, with results validated against a standard HPLC-UV method [38].
Visualization of the ATP Lifecycle and Experimental Workflows
The following diagrams illustrate the ATP lifecycle within the ICH framework and a specific experimental workflow for an electrochemical aptasensor.
ATP Lifecycle in Method Development & Validation
This diagram outlines the integrated lifecycle of an Analytical Target Profile, from definition through ongoing monitoring, as guided by ICH Q14 and ICH Q2(R2).
Electrochemical Aptasensor Fabrication & Measurement
This workflow details the step-by-step fabrication of an electrochemical aptasensor and its use in analyte detection, as described in the experimental protocol.
The Scientist's Toolkit: Key Research Reagent Solutions
The development and validation of robust electrochemical methods rely on a suite of critical reagents and materials. The table below catalogs essential components, detailing their function and application context.
Table 2: Essential Research Reagents for Electrochemical Method Development
| Reagent / Material | Function & Role in Experimentation | Exemplary Use Case |
|---|---|---|
| Gold Nanoparticles (AuNPs) | Enhance electrode conductivity and surface area; provide platform for thiol-based bioreceptor immobilization. | Used in composite materials (e.g., Gr/AuNPs) for signal amplification [38] [37]. |
| Graphene (Gr) & Derivatives | Provide high electrical conductivity and large specific surface area to improve electron transfer and sensor sensitivity. | Functionalized graphene (AP-Gr) serves as a nano-platform and in-situ electrochemical probe [37]. |
| Specific Bioreceptors (Aptamers) | Serve as molecular recognition elements with high affinity and specificity for the target analyte. | Thiolated ATP-binding aptamer (HS-ABA) is immobilized on AuNPs for specific ATP capture [38] [37]. |
| Electrochemical Probes (e.g., FAD, Azophloxine) | Act as electroactive labels or reporters that generate a measurable signal (current) proportional to the analyte. | FAD is displaced in a competitive ATP assay; Azophloxine acts as a built-in redox probe in a composite [38] [37]. |
| Surface Linkers (e.g., PDDA, MCH) | Facilitate the assembly of nanocomposites or form well-ordered monolayers on electrode surfaces. | PDDA is used as a stabilizing agent for AuNPs formation on graphene [37]. |
| Validation Analytes & Interferents | Used to establish method specificity, accuracy, and linearity during validation studies. | ATP, CTP, GTP, UTP are used to test aptasensor specificity against structurally similar molecules [37]. |
The definition of a precise Analytical Target Profile is the critical first step in developing and validating electrochemical methods that are fit-for-purpose and compliant with ICH Q2(R1) principles and its evolution into ICH Q2(R2). By prospectively defining the required performance characteristics—from specificity and sensitivity to robustness—the ATP ensures that the resulting analytical procedure is scientifically sound and capable of generating reliable data to support pharmaceutical quality decisions. The integration of the ATP concept with a lifecycle approach, as reinforced by ICH Q14, promotes continuous improvement and adaptation of electrochemical methods, ultimately enhancing the quality, safety, and efficacy of pharmaceutical products available to patients.
The determination of active pharmaceutical ingredients (APIs) in both dosage forms and biological matrices is a critical component of pharmaceutical analysis, ensuring product quality, safety, and efficacy. Colchicine, an alkaloid used historically for treating gout and more recently investigated for other therapeutic applications, requires robust analytical methods for its quantification. This case study details the development and validation of a differential pulse voltammetric (DPV) method for colchicine determination using a glassy carbon electrode (GCE), conducted within the rigorous framework of the ICH Q2(R1) guideline [14].
The selection of a bare glassy carbon electrode for this methodology was the result of a comparative optimization study, which balanced analytical sensitivity with practical considerations of reproducibility and analysis time [14]. This study exemplifies the practical application of ICH Q2(R1) principles to an electrochemical method, demonstrating that well-validated electroanalytical techniques can serve as reliable, cost-effective alternatives to more complex chromatographic methods for quality control and pharmaceutical analysis.
Experimental Methodology
Reagents and Solutions
All chemicals utilized were of analytical grade. A 0.01 M mixed-acid supporting electrolyte of HClO₄/H₃PO₄ was employed [14]. A stock standard solution of colchicine was prepared, and subsequent dilutions were made to prepare working standard solutions across the validation concentration range.
Instrumentation and Electrode System
The voltammetric measurements were performed using an appropriate electrochemical workstation equipped with a three-electrode cell [14]:
- Working Electrode: Bare glassy carbon electrode (GCE)
- Counter Electrode: Platinum wire or similar
- Reference Electrode: Ag/AgCl (sat. KCl)
The initial method optimization involved a comparative assessment of three electrode types: the bare GCE, a mercury film-coated GCE, and a bismuth film-coated GCE. While the film-coated electrodes yielded a higher cathodic peak current, they exhibited poorer intra-day reproducibility and required a longer analysis time due to the necessity of film renewal. Consequently, the bare GCE was selected for its superior practical fidelity [14].
Voltammetric Procedure
The validated procedure consists of the following key steps [14]:
- Electrode Preparation: The GCE surface is cleaned and polished according to standard protocols prior to analysis.
- Solution Deaeration: The supporting electrolyte and sample solutions are purged with an inert gas (e.g., nitrogen) for a specified time to remove dissolved oxygen.
- Measurement: The differential pulse voltammogram is recorded under the optimized parameters, scanning towards negative potentials to monitor the irreversible, diffusion-controlled cathodic peak of colchicine at approximately -862 mV vs. Ag/AgCl [14].
- Regeneration: The electrode surface is regenerated between measurements to ensure reproducibility.
Analysis of Pharmaceutical Dosage Forms
To assay colchicine tablets, a sample of powdered tablet mass is accurately weighed and dissolved in a suitable solvent (e.g., methanol). After sonication and filtration, the solution is diluted with the supporting electrolyte to fall within the validated linear range. The standard addition method can be applied to circumvent matrix effects and ensure accuracy [14].
The following diagram illustrates the core experimental workflow:
Method Validation as per ICH Q2(R1)
The analytical method was rigorously characterized according to the ICH Q2(R1) guideline [14] [4]. The following table summarizes the key validation parameters and their corresponding results.
Table 1: Summary of method validation parameters and results for colchicine determination by DPV at a GCE.
| Validation Parameter | Experimental Results | ICH Q2(R1) Compliance |
|---|---|---|
| Selectivity/Specificity | No interference from common tablet excipients [14] | Demonstrates ability to unequivocally assess the analyte [4] |
| Linearity | Concentration range: 2.4 - 50 µg mL⁻¹Regression equation: Not fully specifiedDetermination coefficient: R² = 0.9998 (n=5) [14] | Directly demonstrates proportional relationship between concentration and response [4] |
| Accuracy | Reported as satisfactory recovery from pharmaceutical formulations [14] | Confirms closeness of agreement between accepted reference value and value found [4] |
| Precision (Fidelity) | Good intra-day reproducibility reported [14] | Expresses the degree of scatter among a series of measurements from multiple sampling [4] |
| Detection Limit (LOD) | 0.80 µg mL⁻¹ [14] | The lowest amount of analyte that can be detected, but not necessarily quantified [4] |
| Quantification Limit (LOQ) | Not explicitly stated, but the lower limit of the linear range (2.4 µg mL⁻¹) can be considered the validated LOQ [14] | The lowest amount of analyte that can be quantitatively determined with suitable precision and accuracy [4] |
Detailed Validation Protocols
- Linearity: A series of at least five standard solutions spanning the range of 2.4 to 50 µg mL⁻¹ was analyzed. The peak current was plotted against colchicine concentration, and the linearity was verified by a high coefficient of determination (R² = 0.9998) [14].
- Selectivity: The method's selectivity was proven by the successful determination of colchicine in commercial tablets without interference from the excipients, as confirmed by the absence of extraneous peaks in the voltammogram [14].
- Robustness: Although not explicitly detailed in the source, the optimization of the supporting electrolyte and the choice of a bare GCE over film-coated electrodes, which showed poor reproducibility, inherently contribute to a robust method [14].
Comparative Method Analysis
The performance of the validated GCE method was evaluated against other established analytical techniques for colchicine determination. The following table provides a comparative overview.
Table 2: Comparison of different analytical methods for colchicine determination.
| Analytical Method | Electrode / Stationary Phase | Linear Range | Limit of Detection (LOD) | Key Advantages / Applications |
|---|---|---|---|---|
| DPV (This Work) [14] | Bare Glassy Carbon | 2.4 - 50 µg mL⁻¹ | 0.80 µg mL⁻¹ | Validated per ICH Q2(R1), simple, cost-effective, suitable for tablets. |
| DPV [39] | AB-DHP Modified GCE | ~0.04 - 16 µg mL⁻¹* | ~0.016 µg mL⁻¹* | Higher sensitivity, applied in human urine. |
| HPTLC [40] | Silica Gel (Normal-Phase) | 100 - 600 ng/band | 34.3 ng/band | High throughput, multiple samples per run. |
| 3D-Printed Voltammetry [41] | CB/PLA Electrode | ~0.24 - 0.88 µg mL⁻¹* | 0.044 µg mL⁻¹* | Miniaturized, portable, low-cost device. |
| Spectrophotometry (Ref.) [14] | N/A | Not specified | Not specified | Official method in Romanian Pharmacopoeia Xth Ed. (used for comparison). |
Note: Values converted from molar concentrations for comparison, assuming colchicine molecular weight of 399.4 g/mol.
The Scientist's Toolkit: Essential Research Reagents and Materials
The following table details key materials and reagents essential for implementing this validated electrochemical method.
Table 3: Key research reagent solutions and materials for colchicine determination.
| Item | Function / Role in the Experiment |
|---|---|
| Glassy Carbon Electrode (GCE) | The working electrode; provides an inert, renewable surface for the electrochemical reduction of colchicine [14]. |
| Perchloric Acid (HClO₄) & Phosphoric Acid (H₃PO₄) | Components of the 0.01 M mixed-acid supporting electrolyte; provides the conductive medium and optimal pH for the analysis [14]. |
| Colchicine Standard | High-purity reference material used for preparation of calibration standards, essential for method validation and quantitative analysis [14]. |
| Ag/AgCl Reference Electrode | Provides a stable and reproducible reference potential against which the working electrode's potential is controlled [14]. |
| Polishing Supplies | Alumina slurry/suspension and polishing pads are used to refresh and maintain a clean, reproducible GCE surface between measurements [14]. |
This case study successfully demonstrates the development and full validation of a differential pulse voltammetric method for determining colchicine using a glassy carbon electrode, in strict adherence to the ICH Q2(R1) guideline. The method was proven to be selective, linear, accurate, and precise over the concentration range of 2.4 to 50 µg mL⁻¹. The choice of a bare GCE resulted in a robust and practical procedure with a analysis time, successfully applied to the determination of colchicine in pharmaceutical tablet formulations without excipient interference.
The methodology stands as a valid, cost-effective alternative to the official spectrophotometric method and other more complex techniques, underscoring the value of well-validated electrochemical methods in the pharmaceutical analyst's toolkit. The structured validation approach detailed herein provides a clear template for applying ICH Q2(R1) principles to other electroanalytical procedures for drug substances.
Establishing System Suitability Tests for Routine Electrochemical Analysis
System Suitability Testing (SST) serves as a critical final verification that an entire analytical system—comprising the instrument, electrodes, reagents, and analytical procedure—is performing as expected immediately before routine sample analysis [42]. Within the framework of the ICH Q2(R1) guideline, which provides the foundational principles for analytical procedure validation, system suitability is the practical bridge that connects the validated performance characteristics of a method to its daily operational use [4] [11]. While ICH Q2(R1) outlines the core validation parameters such as accuracy, precision, and specificity to prove a method is reliable in theory, SST demonstrates that the specific system, on a specific day, is capable of generating high-quality data that meets the method's pre-defined requirements [43].
For electrochemical analysis of pharmaceuticals, this is paramount. The journey from sample to result is a meticulous process, and even a well-validated method can be compromised by subtle shifts in performance due to factors like electrode fouling, temperature fluctuations, or degradation of electrolyte solutions [42]. System suitability acts as a proactive quality assurance measure, verifying the fitness-for-purpose of the electrochemical system and providing documented evidence that all subsequent analytical results were generated under controlled, suitable conditions [42] [43]. This practice is indispensable for ensuring the reliability of data used in drug release, stability testing, and regulatory submissions.
Core Principles and Regulatory Foundation
Distinction Between Method Validation and System Suitability
A fundamental understanding of the distinction between method validation and system suitability is crucial for effective quality management [43].
- Method Validation (per ICH Q2(R1)): This is a comprehensive, one-time process conducted to prove that an analytical procedure is suitable for its intended purpose. It establishes the performance characteristics and limits of the method itself through studies of accuracy, precision, specificity, linearity, range, and robustness [4] [11].
- System Suitability Testing: This is an ongoing, routine verification performed before each analytical run. It confirms that the operational analytical system—as set up on a particular day with a specific instrument, reagents, and analyst—is functioning within the limits defined during the method validation [43]. Think of method validation as proving the method works, and system suitability as proving the system is working correctly for that specific analysis [42].
Regulatory Expectations
Regulatory bodies like the FDA require system suitability testing to ensure data integrity [43]. Although ICH Q2(R1) mentions system suitability, more detailed practical guidance can often be found in pharmacopeial standards like the United States Pharmacopeia (USP) [43]. The core regulatory expectation is that SST provides documented, real-time assurance that the system's performance meets pre-defined acceptance criteria derived from the validation data, thus ensuring the system is fit-for-purpose before any unknown samples are analyzed [42] [43].
Key System Suitability Parameters for Electrochemical Analysis
The parameters measured during SST are chosen to reflect the most critical aspects of the electrochemical analysis. The table below summarizes the core parameters, their definitions, and typical acceptance criteria for quantitative assays.
Table 1: Key System Suitability Parameters for Electrochemical Methods
| Parameter | Definition | Measurement in Electrochemistry | Typical Acceptance Criteria |
|---|---|---|---|
| Precision (Repeatability) | The closeness of agreement between a series of measurements from multiple injections of the same standard [11]. | Relative Standard Deviation (%RSD) of peak current, potential, or charge from replicate measurements (n≥5) of a standard solution [43]. | %RSD ≤ 2.0% for replicate injections is common [43]. |
| Accuracy (Verification) | The closeness between the measured value and a accepted reference value [11]. | Percent recovery of a known standard analyzed under SST conditions. | Recovery of 98–102% for a standard at the target concentration. |
| Signal-to-Noise Ratio (S/N) | The ratio of the magnitude of the analyte signal to the background noise [42]. | Ratio of the faradaic peak height (or step height) to the standard deviation of the baseline current in a quiet region. | S/N ≥ 10 for quantitation; S/N ≥ 3 for detection limits [43]. |
| Sensitivity/Response Factor | The ability of the method to detect and quantify small changes in analyte concentration. | Slope of the calibration curve or the response (e.g., current) per unit concentration (e.g., nA/µM). | Response factor RSD ≤ 2.0% across replicate standards. |
| Electrode Stability | The consistency of the electrochemical response over time. | Change in response (e.g., peak current) for a standard between the initial and final SST of an analytical run. | Drift ≤ 5% over the course of a run. |
For electrochemical methods, additional checks on the working electrode surface integrity are often critical. This can be assessed through the peak separation in cyclic voltammetry of a standard redox couple (e.g., ferrocyanide/ferricyanide), where an increase beyond the theoretical or historically observed value can indicate surface fouling or degradation.
Developing System Suitability Protocols for Electrochemical Methods
The System Suitability Workflow
A standardized workflow ensures SST is applied consistently and effectively. The following diagram outlines the key decision points in the SST process.
Experimental Protocol for a Typical Amperometric SST
This detailed protocol provides a methodology for establishing a system suitability test for a routine amperometric method, such as the quantification of an active pharmaceutical ingredient (API).
1. Objective: To verify that the electrochemical system (potentiostat, cell, software, and electrodes) meets pre-defined performance criteria for precision, signal-to-noise, and accuracy before the analysis of unknown samples.
2. Materials and Reagents:
- Potentiostat/Galvanostat: A calibrated instrument with controlling software.
- Electrochemical Cell: A three-electrode system consisting of:
- Working Electrode: (e.g., Glassy Carbon, Gold, or Screen-Printed Electrode). The surface must be pre-conditioned/polished according to the method SOP.
- Reference Electrode: (e.g., Ag/AgCl saturated KCl).
- Counter Electrode: (e.g., Platinum wire).
- SST Standard Solution: A freshly prepared or certified reference material of the target analyte at a concentration representative of the sample (typically 100% of the test concentration). The matrix should match the sample matrix as closely as possible (e.g., in supporting electrolyte).
- Supporting Electrolyte/Blank Solution: The electrolyte solution without the analyte.
3. Procedure: 1. System Setup and Stabilization: Place the electrodes in the electrochemical cell containing the supporting electrolyte. Initiate the method and allow the system to stabilize until a steady baseline current is achieved (e.g., for 5-10 minutes). 2. Blank Analysis: Run the analytical method using the blank solution to record the baseline signal and noise. 3. SST Standard Analysis: Replace the blank with the SST standard solution. 4. Replicate Measurements: Perform a minimum of five (5) replicate measurements of the SST standard under the exact conditions specified in the analytical method [43]. For an amperometric method, this would involve applying the fixed potential and measuring the resulting steady-state current. 5. Data Acquisition: Record the key analytical signal (e.g., current) for each replicate.
4. Data Analysis and Acceptance Criteria: 1. Precision: Calculate the %RSD for the current from the five replicates. - Acceptance Criterion: %RSD ≤ 2.0%. 2. Signal-to-Noise (S/N): Calculate the ratio of the average current response for the standard to the standard deviation of the baseline current from the blank analysis. - Acceptance Criterion: S/N ≥ 10. 3. Accuracy/Recovery: If the SST standard is a certified reference material, calculate the percent recovery by comparing the measured concentration (from a pre-established calibration) to the theoretical concentration. - Acceptance Criterion: Recovery between 98% and 102%.
The analytical run may only proceed if all SST acceptance criteria are met. If not, the run must be halted, and the root cause of the failure investigated and corrected [42].
Essential Research Reagent Solutions
The reliability of SST is contingent on the quality of the materials used. The following table lists key reagents and their functions in establishing robust electrochemical SSTs.
Table 2: Key Reagent Solutions for Electrochemical System Suitability Testing
| Reagent/Solution | Function in System Suitability | Critical Quality Attributes |
|---|---|---|
| Certified Reference Material (CRM) | Serves as the primary standard for verifying accuracy, precision, and sensitivity. Provides a traceable, known response. | High purity (>98%), certified concentration and uncertainty, stability over time. |
| Redox Probe Solution | Used to assess electrode surface cleanliness and activity. A well-defined redox couple (e.g., 1-5 mM Potassium Ferricyanide in KCl) confirms expected electron transfer kinetics. | Well-known formal potential, reversible electrochemistry, high purity to prevent electrode contamination. |
| Supporting Electrolyte | Provides ionic conductivity and controls the potential profile at the electrode-solution interface. The blank solution for noise and baseline measurements. | High purity (e.g., ACS grade), low background current, free of electroactive impurities. |
| Electrode Cleaning/Polishing Suspension | Maintains and restores the working electrode surface, which is critical for reproducible results. | Defined particle size (e.g., 0.05 µm alumina or diamond slurry), non-reactive, residue-free. |
Troubleshooting Common System Suitability Failures
When an SST fails, a systematic troubleshooting process is essential. The table below outlines common failures in electrochemical systems and their potential root causes and corrective actions.
Table 3: Troubleshooting Guide for Electrochemical SST Failures
| SST Failure Observation | Potential Root Cause(s) | Corrective Action(s) |
|---|---|---|
| High %RSD (Poor Precision) | - Unstable electrode surface (fouling).- Air bubbles trapped in the cell or at the electrode surface.- Fluctuations in temperature or stirring rate.- Instrument instability. | - Clean and re-polish the working electrode.- Degas solutions and ensure proper cell assembly.- Check temperature control and stirrer consistency.- Perform instrument diagnostics/maintenance. |
| Low Signal-to-Noise Ratio | - Contaminated electrolyte or reagents.- Degraded or poorly conditioned electrode.- Electrical interference (e.g., ground loops).- Instrument detector failure. | - Prepare fresh electrolyte and solutions from high-purity sources.- Re-polish, clean, and re-condition the electrode.- Use a Faraday cage, check grounding, and ensure stable power supply.- Service or calibrate the instrument. |
| Inaccurate Recovery | - Improperly prepared standard solution.- Standard degradation.- Incorrect method parameters (e.g., applied potential).- Calibration drift. | - Freshly prepare standard from certified stock, verify pipetting.- Verify standard stability and storage conditions.- Audit method settings against the validated procedure.- Re-calibrate the instrument. |
| Signal Drift Over Time | - Progressive electrode fouling by the analyte or matrix.- Depletion of the electrolyte or standard.- Reference electrode potential drift. | - Implement a more aggressive cleaning protocol between runs.- Ensure sufficient solution volume and replenish if needed.- Check reference electrode fill solution and integrity; replace if necessary. |
Documentation and Integration into the Analytical Lifecycle
Thorough documentation is a non-negotiable aspect of system suitability testing for regulatory compliance and data integrity [43]. Each SST event must be recorded, including:
- Identification of the instrument, software version, and electrodes used.
- Timestamp of the analysis.
- Identity and signature of the analyst.
- The SST standard used, including lot number and preparation date.
- Raw data for all replicate measurements.
- Calculated parameters (%RSD, S/N, Recovery, etc.).
- A clear statement of pass/fail against the acceptance criteria.
Any deviation must be investigated and documented [43].
Furthermore, SST should not be viewed as an isolated task but integrated into the broader analytical procedure lifecycle, a concept strengthened by the modernized ICH Q2(R2) and ICH Q14 guidelines [11]. Data from routine SST should be trended over time. This historical data is invaluable for predicting electrode lifespan, identifying gradual instrument performance decay, and making science-based decisions about when a method requires re-optimization or re-validation, ensuring the method remains fit-for-purpose throughout its entire operational life [43] [11].
Solving Common Electroanalytical Challenges: From Signal Drift to Matrix Effects
Within the framework of ICH Q2(R1) validation for electrochemical pharmaceutical methods, the reliability of analytical procedures is paramount. Electrode fouling and passivation represent critical challenges that directly compromise key validation parameters such as precision, accuracy, and robustness. Fouling refers to the unwanted accumulation of material on an electrode surface, leading to diminished analytical performance through mechanisms that include physical blockage of active sites and alteration of electron transfer kinetics [44] [45]. In regulated environments, such phenomena can cause analytical method drift, necessitating frequent recalibration and potentially resulting in out-of-specification findings.
This technical guide examines the mechanisms of electrode fouling and passivation, outlines advanced prevention strategies, and details effective regeneration protocols. A thorough understanding and control of these phenomena are essential for developing electroanalytical methods that remain stable over time and comply with the stringent data integrity and reliability requirements of ICH Q2(R1). By implementing the strategies discussed herein, researchers and drug development professionals can enhance the ruggedness of their electrochemical methods throughout the product lifecycle.
Fundamental Mechanisms of Electrode Fouling
Electrode fouling is a complex process involving the passivation of an electrode surface by agents that form an increasingly impermeable layer, thereby inhibiting the analyte's direct contact with the electrode surface for electron transfer [45]. The resulting fouling layer can severely degrade analytical performance by reducing sensitivity, increasing detection limits, diminishing reproducibility, and compromising overall method reliability [45].
Classification of Fouling Mechanisms
Fouling mechanisms can be broadly categorized based on the nature of the fouling agent and its interaction with the electrode surface. The table below summarizes the primary fouling mechanisms encountered in pharmaceutical and biological analysis.
Table 1: Primary Mechanisms of Electrode Fouling
| Mechanism Type | Fouling Agents | Interaction Forces | Impact on Electrode |
|---|---|---|---|
| Biofouling [44] | Proteins, cells, DNA/RNA, biomolecules [45] | Hydrophobic, hydrophilic, electrostatic [45] | Alters electrochemical properties, reduces sensitivity/selectivity [44] |
| Chemical Fouling [44] | Sulfide ions, unwanted chemical deposits [44] | Chemical adsorption, compound formation | Peak voltage shifts, decreased sensitivity [44] |
| Polymer Film Formation [45] | Phenols, neurotransmitters (e.g., dopamine) [45] | Radical polymerization, covalent/noncovalent bonding | Forms impermeable layer blocking analyte access [45] |
Fouling Agent Interactions
The adhesion of fouling agents is governed by specific interactions with the electrode surface:
- Hydrophobic Interactions: Electrodes with hydrophobic surfaces (e.g., diamond, carbon nanotubes) promote the adhesion of species with hydrophobic components, including aromatic compounds and proteins. These interactions are entropically favorable in aqueous electrolytes and are typically irreversible under mild conditions [45].
- Hydrophilic and Electrostatic Interactions: Fouling mediated by these forces tends to be more reversible. Hydrophilic interactions involve dipole-dipole interactions or hydrogen bonding, while electrostatic interactions occur between charged species on the electrode surface and the fouling agent [45].
- Polymeric Fouling: This occurs when electrochemically generated reactive products form dimers or larger insoluble polymeric structures that precipitate onto the electrode surface. A classic example is the detection of dopamine, where reaction products lead to the formation of melanin-like polymeric molecules that foul the electrode [45].
Experimental Analysis of Fouling Mechanisms
A comprehensive understanding of fouling requires experimental characterization. Recent studies have systematically analyzed fouling effects on different electrode components.
Differential Fouling of Working and Reference Electrodes
Research on Fast-Scan Cyclic Voltammetry (FSCV) for neurotransmitter detection has provided critical insights into how fouling differentially affects working and reference electrodes. In one study, researchers examined the effects of biofouling and chemical fouling on carbon fiber micro-electrodes (CFMEs) as working electrodes and Ag/AgCl reference electrodes [44].
- Findings: Both biofouling and chemical fouling significantly decreased sensitivity and caused peak voltage shifts with the CFME. Interestingly, the Ag/AgCl reference electrode was not similarly affected by these general mechanisms. However, chronic implantation revealed a specific chemical fouling agent: sulfide ions. Energy-dispersive spectroscopy (EDS) spectra showed increased sulfide ion concentration on implanted Ag/AgCl electrodes [44].
- Experimental Validation: To test the hypothesis that sulfide ions cause reference electrode fouling, researchers added sulfide ions to the buffer solution. This decreased the open circuit potential of the Ag/AgCl electrode and successfully replicated the peak voltage shift observed in FSCV voltammograms, confirming sulfide ions as a specific fouling agent for reference electrodes [44].
Protocol: Investigating Reference Electrode Fouling by Sulfide Ions
Objective: To experimentally determine the effect of sulfide ions on the performance of Ag/AgCl reference electrodes.
Materials:
- Ag/AgCl reference electrode
- Phosphate buffer solution (0.1 M, pH 7.4)
- Sodium sulfide (Na₂S) stock solution
- Potentiostat
- Open circuit potential measurement setup
Methodology:
- Measure the initial open circuit potential of the Ag/AgCl reference electrode in the phosphate buffer solution.
- Sparingly add aliquots of Na₂S stock solution to the buffer to achieve incremental increases in sulfide ion concentration (e.g., 10 µM, 50 µM, 100 µM).
- After each addition, allow the system to stabilize and record the new open circuit potential.
- Simultaneously, perform FSCV scans using a CFME to monitor any peak voltage shifts in the voltammograms corresponding to a standard analyte like dopamine.
- After the experiment, characterize the electrode surface using EDS to confirm sulfide deposition.
Expected Outcomes: A concentration-dependent decrease in open circuit potential and corresponding positive shifts in FSCV oxidation peaks, corroborating the link between sulfide exposure and reference electrode performance degradation [44].
Strategies for Fouling Prevention and Mitigation
Implementing effective antifouling strategies is essential for maintaining the analytical validity of electrochemical methods in compliance with ICH Q2(R1). These strategies can be broadly divided into electrode surface modification and operational approaches.
Electrode Surface Modification
Modifying the electrode surface creates a barrier that prevents fouling agents from reaching the electroactive surface.
Table 2: Electrode Modification Strategies for Fouling Prevention
| Modification Strategy | Key Materials | Mechanism of Action | Typical Applications |
|---|---|---|---|
| Nanomaterial Coatings | Carbon nanotubes (CNTs), Graphene, Metallic nanoparticles [45] | Large surface area, electrocatalytic properties, fouling resistance [45] | Broad-spectrum antifouling [45] |
| Protective Polymer Films | Nafion, Poly(ethylene glycol) - PEG, Poly(vinyl chloride), PEDOT, Polypyrrole [45] | Hydrophilic barrier, size exclusion, charge exclusion [45] | Selective analyte permeation; PEG increases hydrophilicity [45] |
| Nanocomposite Coatings | α-Fe₂O₃-CNT nanocomposite [46] | Prevents fouling, enhances electron transfer, increases surface area | 17-β-Estradiol detection in complex matrices [46] |
Protocol: Electrode Modification with α-Fe₂O₃-CNT Nanocomposite
Objective: To create a fouling-resistant glassy carbon electrode (GCE) using a hydrothermally synthesized α-Fe₂O₃-CNT nanocomposite for the detection of 17-β-estradiol (E2) [46].
Materials:
- Glassy carbon electrode (GCE)
- Multi-walled carbon nanotubes (CNTs)
- Iron precursor (e.g., FeCl₃·6H₂O)
- Urea
- Ammonium fluoride
- Ethanol, Deionized water
Methodology:
- Nanocomposite Synthesis:
- Prepare a homogeneous dispersion of CNTs in deionized water.
- Add iron precursor, urea, and ammonium fluoride to the CNT dispersion.
- Transfer the mixture to a Teflon-lined autoclave and conduct hydrothermal synthesis at 120°C for 6 hours.
- Cool, collect the precipitate, wash, and dry to obtain the α-Fe₂O₃-CNT nanocomposite [46].
- Electrode Modification:
- Polish the GCE to a mirror finish with alumina slurry and rinse thoroughly.
- Prepare a suspension of the α-Fe₂O₃-CNT nanocomposite (1.0 mg mL⁻¹) in a suitable solvent.
- Deposit a measured volume (e.g., 5 µL) of the suspension onto the GCE surface and allow to dry under ambient conditions [46].
Performance Characteristics: The modified electrode (α-Fe₂O₃-CNT/GCE) demonstrated enhanced electrochemical response to E2 and effectively prevented electrode surface fouling, mitigating the decrease in peak current intensity during E2 oxidation. The method achieved a linear range of 5.0–100.0 nmol L⁻¹ and a detection limit of 4.4 nmol L⁻¹ [46].
Electrode Regeneration and Surface Renewal Techniques
When prevention is insufficient, regeneration of fouled electrodes is necessary to restore analytical performance. Regeneration techniques can be mechanical, chemical, or electrochemical.
Electrochemical Regeneration in Deionized Water
A novel and effective method for regenerating carbon fiber microelectrodes (CFMEs) involves electrochemical treatment in pure deionized water.
- Principle: This method renews the carbon fiber surface and introduces oxygen-containing functional groups through electrochemical treatment, regenerating the electrochemically active surface without additional electrolytes or harsh chemicals [47].
- Protocol:
- Immerse the fouled CFME in deionized water.
- Apply a potential of 1.75 V for 26.13 minutes.
- The regenerated CFME shows significantly increased electrochemical response to dopamine, with good linearity (R² = 0.9961) in the concentration range from 1.0 × 10⁻⁷ to 1.0 × 10⁻⁴ mol/L and a detection limit of 3.1 × 10⁻⁸ mol/L [47].
- Advantages: The activation and regeneration effect is comparable to methods using activation solutions, but the process is simpler, more environmentally friendly, and avoids potential contaminant introduction [47].
Other Regeneration Methods
- Mechanical Polishing: Effective for planar electrodes (e.g., GCE) to physically remove fouling layers. However, it can be labor-intensive and may alter the electrode geometry.
- Chemical Rinsing: Using solvents or cleaning solutions to dissolve or desorb fouling agents. The choice of solvent depends on the chemical nature of the foulant.
- Electrochemical Cleaning: Applying potential waveforms or pulses in a clean supporting electrolyte to oxidize or reduce fouling materials, thereby cleaning the surface. This is often integrated into the method as a between-run cleaning step.
The following workflow diagram illustrates the decision process for managing electrode fouling, from identification to resolution.
The Scientist's Toolkit: Key Reagents and Materials
The following table catalogues essential materials and reagents used in the featured experiments for fouling prevention and electrode regeneration.
Table 3: Research Reagent Solutions for Fouling Management
| Reagent/Material | Function/Application | Specific Example |
|---|---|---|
| Carbon Nanotubes (CNTs) | Electrode coating providing large surface area, electrocatalytic properties, and fouling resistance [45] [46] | α-Fe₂O₃-CNT nanocomposite for E2 sensor [46] |
| α-Fe₂O₃ Nanoparticles | Non-toxic, biocompatible, chemically stable semiconductor component of nanocomposites [46] | α-Fe₂O₃-CNT nanocomposite for E2 sensor [46] |
| Nafion | Protective polymer film; cation exchanger providing charge-based selectivity [45] | Broad-spectrum antifouling strategy [45] |
| Poly(Ethylene Glycol) - PEG | Hydrophilic polymer coating to reduce protein adsorption [45] | Increasing surface hydrophilicity to resist biofouling [45] |
| Deionized Water | Solvent for electrochemical regeneration of CFMEs [47] | Regeneration medium for fouled carbon fiber microelectrodes [47] |
| Sodium Sulfide (Na₂S) | Chemical source of sulfide ions for studying reference electrode fouling [44] | Experimental investigation of Ag/AgCl reference electrode degradation [44] |
Managing electrode fouling and passivation is not merely a technical exercise but a fundamental requirement for developing robust electrochemical methods compliant with ICH Q2(R1). Fouling directly impacts the validation parameters of specificity, accuracy, precision, and robustness mandated by the guideline. A systematic approach—involving understanding fouling mechanisms, implementing preventive modifications, and establishing validated regeneration protocols—ensures that analytical procedures remain reliable throughout their lifecycle. This proactive management of fouling supports the core principles of ICH Q2(R1) by delivering data that is accurate, reliable, and reproducible, thereby underpinning quality decisions in pharmaceutical development.
Managing Matrix Interferences in Complex Pharmaceutical Formulations
Matrix interference presents a significant challenge in the electrochemical analysis of complex pharmaceutical formulations, where excipients, degradation products, and formulation components can adversely affect the accuracy, precision, and reliability of analytical methods. Within the framework of ICH Q2(R1) guideline for analytical method validation, managing these interferences is paramount for developing robust analytical procedures that generate scientifically sound and regulatory-compliant data [4]. The growing complexity of pharmaceutical dosage forms, including orally disintegrating forms containing therapeutic proteins and peptides, hygroscopic solid dosage forms, and formulations with mesoporous silica carriers, further amplifies these challenges [48] [49] [50].
Electrochemical methods have emerged as powerful analytical tools for pharmaceutical analysis due to their high sensitivity, selectivity, and compatibility with miniaturized devices [8]. The emergence of electrochemical paper-based analytical devices (ePADs) has further expanded applications in drug quality control, environmental monitoring, precision medicine [8]. However, the successful implementation of these methods requires systematic approaches to identify, characterize, and mitigate matrix effects that can compromise analytical results.
This technical guide provides a comprehensive framework for managing matrix interferences in electrochemical pharmaceutical analysis, with specific emphasis on compliance with ICH Q2(R1) validation requirements. It integrates fundamental principles with practical strategies, experimental protocols, and analytical workflows to support researchers in developing interference-resistant analytical methods.
Matrix interferences in pharmaceutical analysis originate from various components coexisting with the active pharmaceutical ingredient (API). These include:
Excipients and functional additives: Fillers, binders, disintegrants, lubricants, glidants, and surfactants can adsorb onto electrode surfaces or compete in electrochemical reactions [49] [51]. For instance, hydroxypropyl methylcellulose (HPMC) used in controlled-release formulations may form viscous layers that impede analyte diffusion to electrode surfaces [51].
Degradation products: Impurities arising from API decomposition under stress conditions (hydrolysis, oxidation, photolysis) may exhibit electrochemical activity overlapping with the target analyte [4].
Formulation architecture components: Mesoporous silica carriers, while beneficial for dissolution enhancement, can entrap analytes or introduce adsorption-desorption kinetics that complicate quantification [50].
Counterions and salts: Buffer components, preservatives, and ionic strength modifiers can alter electrochemical double-layer structure and charge transfer kinetics.
Electrochemical Interference Mechanisms
Interfering species affect electrochemical measurements through several distinct mechanisms:
Electrode fouling: Adsorption of non-specific components onto the electrode surface, reducing active sites available for analyte electron transfer.
Competitive electron transfer: Electroactive interferents with redox potentials overlapping with the target analyte, leading to overlapping signals.
Complexation effects: Binding interactions between analytes and matrix components that alter redox thermodynamics and kinetics.
Diffusional barriers: Viscosity modifiers or pore structures that physically impede analyte transport to the electrode surface.
ICH Q2(R1) Framework and Matrix Interference Management
The ICH Q2(R1) guideline establishes validation parameters that collectively ensure analytical method reliability, with several parameters directly addressing matrix interference challenges [4] [11].
Key Validation Parameters for Interference Assessment
Specificity is the foremost parameter for evaluating matrix interference, demonstrating that the analytical method can unequivocally assess the analyte in the presence of expected components [4] [11]. According to ICH Q2(R1), specificity must be established using placebo formulations containing all excipients without the API, and through stress testing studies that introduce likely degradation products [4].
Accuracy and precision evaluations must incorporate matrix effects through analysis of spiked placebo samples at multiple concentration levels across the validated range. The ICH Q2(R1) guideline recommends reporting percent recovery, which should fall within established acceptance criteria (typically 98-102% for APIs) despite matrix presence [4].
The range of an analytical method must demonstrate acceptable accuracy, precision, and linearity across the entire concentration interval where the method will be applied, accounting for potential concentration-dependent matrix effects [11].
Advanced Validation Approaches
Contemporary interpretation of ICH guidelines emphasizes science- and risk-based approaches to method validation [4] [11]. For matrix interference management, this includes:
Analytical Target Profile (ATP) definition: Prospectively defining the method's purpose and required performance characteristics, including maximum tolerable interference levels [11].
Quality by Design (QbD) principles: Systematically evaluating and controlling method variables that influence susceptibility to matrix effects.
Lifecycle management: Implementing continuous monitoring and control strategies to address matrix variability throughout the method's application period [11].
Strategic Approaches for Mitigating Matrix Interferences
Sample Preparation Techniques
Effective sample preparation remains the first line of defense against matrix interferences:
Protein precipitation: Critical for analyzing biological matrices or formulations containing protein/peptide APIs [48].
Solid-phase extraction (SPE): Selective retention of analytes or interferents using functionalized sorbents.
Membrane filtration: Removal of particulate matter that could foul electrode surfaces.
Dilution strategies: Minimizing interference impact while maintaining analyte detectability, particularly effective for simple matrix compositions.
Electrochemical Method Optimization
Strategic optimization of electrochemical parameters can significantly enhance interference resistance:
Potential waveform modification: Using pulsed waveforms rather than continuous scans to minimize adsorption phenomena.
Electrode material selection: Nanomaterial-modified electrodes (carbon nanotubes, graphene, metal nanoparticles) that provide higher surface areas and catalytic properties.
Potential pulse sequences: Incorporating cleaning steps to refresh electrode surface between measurements.
Hydrodynamic techniques: Implementing stirring or flow systems to reduce diffusion layer thickness and minimize surface fouling.
Chemometric and Data Processing Approaches
Advanced data analysis techniques complement experimental strategies:
Multivariate calibration: Partial least squares (PLS) and principal component regression (PCR) models that mathematically separate analyte signals from interferents.
Signal deconvolution: Algorithmic resolution of overlapping voltammetric peaks.
Standard addition methods: Compensating for matrix effects by analyzing incremental standard additions to the sample matrix.
Table 1: Strategic Approaches for Managing Specific Matrix Interference Types
| Interference Type | Primary Strategy | Secondary Strategy | Validation Parameter Most Affected |
|---|---|---|---|
| Electrode Fouling | Electrode modification | Pulsed waveforms | Precision, Detection limit |
| Overlapping Signals | Signal deconvolution | Potential window optimization | Specificity, Linearity |
| Diffusional Barriers | Hydrodynamic methods | Sample dilution | Accuracy, Range |
| Competitive Adsorption | Standard addition | Medium exchange | Accuracy, Specificity |
Experimental Protocols for Interference Assessment
Protocol for Specificity Testing According to ICH Q2(R1)
This protocol provides a systematic approach to demonstrate method specificity in the presence of matrix components [52] [4].
Materials and Equipment
- Electrochemical workstation with three-electrode system
- Placebo formulation (containing all excipients except API)
- Reference standard of API (high purity)
- Forced degradation samples (acid/base/hydrolytic/oxidative/ photolytic stress)
- Supporting electrolyte solution
Procedure
- Prepare individual solutions of placebo formulation at target concentration in supporting electrolyte.
- Prepare API standard solution at target concentration.
- Prepare API-spiked placebo solution at target concentration.
- Subject all solutions to identical electrochemical analysis conditions.
- Record voltammograms/chromatograms for all solutions.
- Compare results to identify interference from placebo components.
- Repeat using forced degradation samples.
Acceptance Criteria
- No significant peaks from placebo components at retention time/migration potential of API.
- Baseline resolution between API and nearest interfering peak (resolution factor ≥ 1.5).
- API recovery in spiked placebo: 98-102%.
Troubleshooting
- If interference is observed, optimize sample preparation or electrochemical parameters.
- If degradation products co-elute, consider alternative electrode materials or separation conditions.
Protocol for Standard Addition Method
The standard addition method compensates for matrix effects by analyzing the sample with incremental additions of standard [4].
Materials and Equipment
- Electrochemical workstation
- Stock standard solution of API
- Test sample solution
- Micropipettes of appropriate volumes
Procedure
- Divide the sample solution into five equal aliquots.
- Add increasing volumes of standard solution to four aliquots (e.g., 0, 25, 50, 75, 100% of expected concentration).
- Add equivalent volumes of solvent to maintain constant volume.
- Analyze all solutions using the optimized electrochemical method.
- Plot signal response versus standard concentration added.
- Extrapolate the linear plot to the x-axis to determine original sample concentration.
Data Analysis
- Calculate correlation coefficient of standard addition plot (should be ≥0.995).
- Determine sample concentration from x-intercept.
- Report percent relative standard deviation for replicate measurements.
Analytical Workflow for Managing Matrix Interferences
The following workflow provides a systematic approach to identify, characterize, and mitigate matrix interferences in electrochemical pharmaceutical analysis.
Research Reagent Solutions for Interference Management
Table 2: Essential Research Reagents and Materials for Matrix Interference Studies
| Reagent/Material | Function in Interference Management | Application Examples |
|---|---|---|
| Nanomaterial-modified Electrodes (CNT, graphene, metal nanoparticles) | Enhanced selectivity through catalytic activity or size exclusion | Signal resolution for overlapping analytes; reduced fouling |
| Molecularly Imprinted Polymers (MIPs) | Selective recognition sites for target analyte | Exclusion of structurally similar interferents |
| Solid-Phase Extraction Cartridges | Selective extraction and cleanup | Removal of interfering matrix components prior to analysis |
| Chemometric Software Packages | Mathematical resolution of overlapping signals | Deconvolution of complex voltammetric data |
| Placebo Formulations | Specificity assessment | Identification of excipient-derived interferences |
| Forced Degradation Samples | Specificity validation | Demonstration of stability-indicating capability |
Case Studies and Applications
Interference Management in Orally Disintegrating Dosage Forms
Analysis of therapeutic proteins and peptides (TPPs) in orally disintegrating dosage forms presents unique challenges due to the complex matrix containing disintegrants, absorption enhancers, and stabilizers [48]. Electrochemical biosensors for TPP quantification must address interference from permeation enhancers like SNAC and various stabilizing agents that may adsorb onto electrode surfaces. Successful approaches include incorporating permselective membranes that exclude interferents based on size and charge, while allowing analyte access to the transducer surface [48].
Analysis of Hygroscopic Formulations
Highly hygroscopic pharmaceutical solids pose dual challenges for electrochemical analysis: water absorption alters the electrochemical medium composition, and common anti-hygroscopic excipients can interfere with measurements [49]. For film-coated hygroscopic formulations, strategies include sample extraction procedures that selectively dissolve the API while leaving coating polymers undissolved, followed by electrochemical analysis of the filtrate [49]. This approach has been successfully applied to formulations containing HPMC and starch-based coatings that would otherwise foul electrode surfaces [51].
Mesoporous Silica-Based Formulations
The analysis of drugs loaded into mesoporous silica carriers like SYLOID XDP 3150 requires addressing interference from silica particles and associated excipients [50]. Research demonstrates that sample preparation optimization is critical, with solvent extraction conditions carefully controlled to ensure complete drug release from silica pores without co-extraction of interfacial components. Additionally, the high porosity and surface area of silica carriers may adsorb electrochemical mediators or indicators, necessitating the use of alternative detection schemes or background correction algorithms [50].
Effective management of matrix interferences is fundamental to developing electroanalytical methods that meet ICH Q2(R1) validation requirements for complex pharmaceutical formulations. A systematic approach incorporating thorough specificity assessment during method development, strategic implementation of interference mitigation techniques, and rigorous validation using placebo and stress samples provides the foundation for reliable analytical procedures. The continuing advancement of electrochemical paper-based devices, nanomaterial-modified electrodes, and multivariate data analysis tools offers promising avenues for enhanced interference resistance in pharmaceutical analysis. By adopting the principles and protocols outlined in this guide, researchers can develop robust electrochemical methods that generate accurate, precise, and regulatory-compliant data despite the challenges posed by complex formulation matrices.
Optimizing Signal-to-Noise Ratio for Enhanced Detection and Quantification Limits
Within the framework of International Council for Harmonisation (ICH) Q2(R1) guidelines, the validation of analytical procedures is paramount for ensuring the quality, safety, and efficacy of pharmaceuticals. Two critical figures of merit in this validation are the Limit of Detection (LOD) and the Limit of Quantification (LOQ). The LOD defines the lowest amount of analyte that can be detected but not necessarily quantified, while the LOQ is the lowest amount that can be quantitatively determined with suitable precision and accuracy. The signal-to-noise ratio (SNR) is a fundamental concept that directly influences these limits; a higher SNR typically enables lower, more robust detection and quantification capabilities. For electrochemical and other analytical methods, optimizing the SNR is therefore not merely a technical exercise but a regulatory necessity to ensure methods are fit for their intended purpose, whether for release testing, stability studies, or impurity profiling [18] [53].
This guide provides an in-depth technical overview of strategies for optimizing SNR to enhance LOD and LOQ, specifically contextualized within the requirements of ICH Q2(R1) for pharmaceutical development.
Theoretical Foundations: SNR, LOD, and LOQ in ICH Q2(R1)
The ICH Q2(R1) guideline defines linearity as the ability of an analytical procedure to obtain test results that are directly proportional to the concentration (amount) of analyte in the sample. Importantly, this definition refers to the linearity of results (the relationship between the known concentration and the back-calculated result) and not merely the linearity of the instrumental response function. This distinction is crucial for proper method validation [54].
A robust analytical method must demonstrate that it can reliably distinguish the signal of the target analyte from the background noise. The SNR is a direct measure of this distinction. The ICH guideline acknowledges several approaches for determining LOD and LOQ, including visual assessment, signal-to-noise evaluation, and based on the standard deviation of the response and the slope of the calibration curve. The signal-to-noise approach is widely applied, particularly in chromatographic and electrochemical techniques, where a signal-to-noise ratio of 3:1 is generally accepted for estimating the LOD, and 10:1 for the LOQ [18] [53].
Under ICH Q2(R1), validation must prove that an analytical procedure is suitable for its intended purpose. For trace analysis of impurities, such as the determination of p-chloroaniline in paracetamol, this necessitates a method with a sufficiently low LOD and LOQ to control the impurity at toxicologically justified levels [53].
Advanced Methodologies for SNR Optimization and Linearity Assessment
Double Logarithm Function for Linear Validation
A novel data analysis method for validating the linearity of results involves applying a double logarithm function linear fitting. This approach directly assesses the proportionality between the theoretical concentration of the analyte and the test results obtained, which is the core of the ICH definition of linearity.
- Principle: The method involves taking the same base logarithm of both the theoretical concentration (or dilution factor) and the measured test result. A linear fit is then performed on the log-transformed data.
- Slope Interpretation: A slope of the fitted line that is equal to 1 indicates a perfectly proportional relationship. Deviations from 1 indicate a lack of proportionality, revealing potential issues with the analytical procedure's linearity within the given range.
- Advantages: This method is more consistent with the ICH Q2 linearity definition than the commonly used coefficient of determination (R²) for the response function. It effectively overcomes issues of heteroscedasticity (non-constant variance across the concentration range) and provides a mechanistic link between the slope, the working range ratio, and the maximum error ratio, facilitating the setting of scientifically sound acceptance criteria [54].
The following diagram illustrates the workflow for applying this validation method.
Bayesian Optimization for Automated SNR Enhancement
In automated experimental setups, such as those used in high-throughput screening or method development, Bayesian Optimization (BO) can be employed to co-optimize both the target property (e.g., signal strength) and the associated measurement noise.
- Workflow Integration: This framework integrates intra-step noise optimization directly into the automated experimental cycle. It treats measurement time (which directly influences SNR, as longer integration times often reduce noise) as an additional parameter to be optimized.
- Dual Optimization: The BO workflow can be designed with a reward-driven approach or a double-optimization acquisition function that simultaneously seeks to maximize a target signal (or property) while minimizing the associated measurement noise.
- Benefit: This strategy intelligently balances data quality with experimental duration, leading to more efficient resource utilization and improved data quality without unnecessary time expenditure. This has been successfully demonstrated in applications like Piezoresponse Force Microscopy and can be adapted for electrochemical method development [55].
Multivariate Approaches for Complex Systems
For analytical instruments that generate multidimensional data, such as electronic noses (eNoses) with sensor arrays, estimating a single LOD for a target substance is challenging. Multivariate data analysis techniques can be leveraged for this purpose.
- Techniques: Principal Component Regression (PCR) and Partial Least Squares Regression (PLSR) are powerful methods that can model the relationship between the complex, multi-sensor response and the concentration of a target analyte.
- Application: These regression models can be used to predict analyte concentration from the sensor array data. The LOD and LOQ can then be estimated from the error metrics of the regression model, or by applying traditional LOD/LOQ definitions to the predicted values. This approach has been used to determine LODs for key compounds in beer maturation, such as diacetyl, demonstrating its practicality for complex matrices [56].
Table 1: Comparison of SNR Optimization and LOD/LOQ Determination Methods
| Method | Primary Principle | Key Advantage | Typical Application Context |
|---|---|---|---|
| Signal-to-Noise Measurement [18] [53] | Direct comparison of analyte signal amplitude to background noise. | Simple, intuitive, and directly referenced in ICH guidelines. | Chromatography (HPLC, LC-MS), spectroscopy. |
| Standard Deviation of Response [18] | Based on the standard deviation of the blank and the slope of the calibration curve. | Statistical robustness, does not require visual inspection. | General analytical techniques, including electrochemical methods. |
| Double Logarithm Linearity [54] | Validates proportionality between theoretical and measured values via log-log fitting. | Directly validates ICH linearity definition; handles heteroscedasticity. | Linear range validation for any quantitative procedure. |
| Bayesian Optimization [55] | Machine learning to co-optimize signal and noise by tuning experimental parameters. | Automates and accelerates method optimization; balances data quality and cost. | Automated experimental platforms, high-throughput screening. |
| Multivariate Regression (PLSR, PCR) [56] | Uses multiple sensor responses to model and predict analyte concentration. | Enables LOD estimation for complex, multidimensional data. | Electronic noses, sensor arrays, spectroscopy with multiple wavelengths. |
Experimental Protocols for Enhanced SNR and LOD/LOQ
Protocol: LC-MS Limit Test for Impurities with High SNR
This detailed protocol, based on the determination of p-chloroaniline in paracetamol, outlines steps to achieve a low LOD for impurity analysis [53].
Instrumentation and Conditions:
- Instrument: Liquid Chromatograph coupled with a Mass Spectrometer (LC-MS) using an Electrospray Ionization (ESI) source in positive mode.
- Chromatography:
- Column: C18 (e.g., 50 mm x 4.6 mm, 3 µm).
- Temperature: 35 °C.
- Mobile Phase: 0.1% Methanol : 0.1% Formic Acid (50:50, v/v).
- Flow Rate: Isocratic or gradient optimized for separation.
- Mass Spectrometry:
- Ion Spray Voltage: +5.0 kV.
- Source Temperature: 550 °C.
- Nebulizer and Desolvation Gas: Optimized for stable spray (e.g., 40 psi and 45 psi respectively).
- Monitoring Ions: Use Multiple Reaction Monitoring (MRM) for specificity. For PCA: Quantifier ion 127.9/111.0, Qualifier ion 127.9/93.0.
Sample Preparation:
- Prepare a stock solution of the impurity (e.g., PCA) at a high concentration (e.g., 1000 ppm).
- Serially dilute with the mobile phase to prepare working standards covering a range down to the anticipated LOD/LOQ.
- Prepare pharmaceutical test samples in a solvent that matches the mobile phase as closely as possible to minimize injection-related noise.
Data Acquisition and Analysis:
- Inject the standards and samples.
- Measure the signal height of the analyte peak and the noise amplitude from a blank injection in a region close to the analyte's retention time.
- Calculate the SNR for each standard. The concentration that yields an average SNR of 3:1 is the estimated LOD; the concentration yielding an SNR of 10:1 is the estimated LOQ.
- Validate the method for specificity, accuracy, and precision at the LOQ level as per ICH Q2(R1).
Protocol: Practical SNR Mapping from Single Clinical MRI Images
While from a different field, this protocol showcases an innovative approach to SNR estimation that can be conceptually adapted. It allows for practical SNR assessment from a single measurement, eliminating the need for repeated acquisitions which is often not feasible in regulated pharmaceutical analysis [57].
Image Acquisition: Acquire a single image of the sample (e.g., a standard solution or a homogeneous part of a dosage form) using the standard analytical procedure (e.g., a specific electrochemical sequence or spectroscopic scan).
Noise-Only Image Generation:
- Compute a noise-only image (or dataset) from the single acquired image using a pixel-shifting algorithm. This process separates the high-frequency noise components from the underlying signal.
Edge Component Removal:
- Apply a threshold to remove edge components and structural features from the noise map. This step is crucial to ensure that the noise estimate is not contaminated by actual analyte signal, which would lead to an overestimation of SNR.
SNR Calculation:
- Calculate the SNR map by dividing the original image by the processed noise-only image on a pixel-by-pixel basis. This provides a spatial representation of SNR, which can be valuable for identifying heterogeneity in analysis.
Table 2: The Scientist's Toolkit: Essential Reagents and Materials for SNR-Optimized Experiments
| Item / Solution | Function / Purpose | Example from Search Results |
|---|---|---|
| High-Purity Analytical Standards | To create calibration curves with minimal interference, ensuring accurate LOD/LOQ determination. | p-chloroaniline standard for impurity method development [53]. |
| LC-MS Grade Solvents | To reduce chemical noise in the baseline, improving SNR in chromatographic methods. | Methanol and formic acid used in mobile phase for PCA analysis [53]. |
| Electrochemical Sensors/Sensor Arrays | To generate multidimensional data for multivariate SNR optimization and LOD estimation. | Metal oxide semiconductor (MOS) sensor array in electronic nose [56]. |
| Characterized Reference Materials | To validate method accuracy and precision at the limits of quantification. | Pharmaceutical formulations spiked with known impurity levels [53]. |
| Bayesian Optimization Software | To automate the co-optimization of experimental parameters for maximal SNR and minimal cost. | Custom workflow for Piezoresponse Force Microscopy [55]. |
Optimizing the signal-to-noise ratio is a technically demanding yet indispensable activity for developing robust analytical methods compliant with ICH Q2(R1). The strategies discussed—from foundational SNR measurements and advanced linearity validation using double logarithm functions to automated Bayesian optimization and multivariate modeling—provide a comprehensive toolkit for scientists.
The relationship between a robustly optimized SNR and the resulting, well-characterized LOD and LOQ is a logical pathway that strengthens a method's regulatory submission. As demonstrated in the case of the PCA limit test, a method with a sufficiently low, validated LOD is critical for controlling genotoxic impurities and ensuring patient safety [53]. Furthermore, moving beyond traditional R²-based linearity checks to a proportionality-focused validation, as enabled by the double logarithm method, ensures a deeper and more compliant understanding of the analytical procedure's performance [54].
In conclusion, a systematic and scientifically rigorous approach to SNR optimization is fundamental to achieving enhanced detection and quantification limits. This not only fulfills regulatory requirements but also builds confidence in the data generated throughout the drug development lifecycle, from raw material testing to final product release.
For researchers and drug development professionals, the validation of analytical methods is a regulatory and scientific imperative. The International Council for Harmonisation (ICH) Q2(R1) guideline establishes the framework for this validation, defining precision as the "closeness of agreement between a series of measurements obtained from multiple sampling of the same homogeneous sample under the prescribed conditions" [18]. Within the scope of electrochemical systems, which are gaining prominence in pharmaceutical analysis for their sensitivity, speed, and potential for miniaturization, demonstrating robust precision is critical for proving method reliability [8] [58]. Precision is further subdivided into three levels: repeatability (intra-day precision), intermediate precision (which includes inter-day precision), and reproducibility (between laboratories) [18] [4]. For electrochemical techniques, ensuring reproducibility is particularly challenging due to factors like electrode fouling, variability in electrode surface regeneration, and electrolyte composition [58]. This guide provides a detailed technical exploration of how to address these challenges and rigorously assess intra-day and inter-day precision for electrochemical methods within the ICH Q2(R1) framework.
Regulatory Framework and Definitions
The ICH Q2(R1) guideline, a cornerstone of pharmaceutical analytical validation, mandates the evaluation of precision to ensure that an analytical procedure yields consistent results. The guideline delineates the following key concepts [18] [4]:
- Repeatability: Expresses the precision under the same operating conditions over a short interval of time. This is equivalent to intra-day precision, assessed using a minimum of 6 determinations or 9 determinations at 100% of the test concentration.
- Intermediate Precision: Refers to the within-laboratories variations, such as different days, different analysts, different equipment, etc. The study of precision on different days is the core of inter-day precision evaluation.
- Reproducibility: Expresses the precision between laboratories, typically required for method standardization, such as in collaborative studies for pharmacopoeial methods.
The updated ICH Q2(R2) guideline expands on these concepts, introducing more detailed definitions, including for intermediate precision, which it describes as capturing the impact of variations within a given lab, such as the effects of varying environmental conditions [6]. For the purposes of this whitepaper, which is framed within ICH Q2(R1), the focus remains on the foundational principles of repeatability and intermediate precision.
Experimental Protocols for Assessing Precision
A structured experimental design is paramount for generating meaningful and defensible precision data. The following protocols are tailored for electrochemical systems, such as those used in voltammetric analysis of active pharmaceutical ingredients (APIs) [58].
Protocol for Intra-Day Precision (Repeatability)
Objective: To demonstrate the variability of the electrochemical method when performed in a single laboratory by one analyst using the same instrument and electrodes within one day.
Materials and Reagents:
- Homogeneous stock solution of the API at a known concentration.
- Appropriate supporting electrolyte (e.g., Britton-Robinson buffer, phosphate buffer).
- High-purity reagents and solvents.
Procedure:
- Prepare a single homogenous stock solution of the analyte at the target concentration (e.g., 100% of the test concentration).
- From this stock solution, prepare six (n=6) independent sample preparations in the supported electrolyte matrix.
- Using a single instrument and the same working electrode (e.g., a 10% nano-reduced graphene oxide-modified carbon paste electrode) [58], analyze all six preparations in random order.
- For each run, record the peak current (or other relevant electrochemical signal) and calculate the concentration of the analyte based on a pre-established calibration curve.
- Perform all analyses within a single analytical session (e.g., 8-hour period).
Data Analysis:
- Calculate the mean (average) concentration, standard deviation (SD), and percent relative standard deviation (%RSD) of the six determinations.
- A %RSD of less than 2% is generally considered acceptable for assay methods, though the specific acceptance criteria should be predefined and justified based on the method's intended use [4].
Protocol for Inter-Day Precision (Intermediate Precision)
Objective: To demonstrate the method's robustness against normal laboratory variations that occur over different days.
Procedure:
- Repeat the intra-day precision protocol on three separate days (e.g., Day 1, Day 2, Day 3).
- The same analyst may perform the analysis, or a second analyst may be introduced to incorporate an additional variable, as per the enhanced understanding of intermediate precision in Q2(R2) [6].
- Use the same instrument if possible, though the use of different but equivalent instruments can also be part of this study.
- Prepare fresh stock solutions, supporting electrolyte, and sample preparations on each day to account for daily preparation variability.
- Perform a minimum of six determinations per day (total n=18).
Data Analysis:
- Calculate the mean, SD, and %RSD for the results from each individual day.
- Pool all results from all three days (n=18) and calculate the overall mean, SD, and %RSD.
- The overall %RSD should meet predefined acceptance criteria, which may be slightly wider than those for intra-day precision but should still demonstrate the method's reliability.
The workflow for these interconnected assessments is outlined in the diagram below.
Data Presentation and Analysis
The data generated from precision studies should be presented clearly to facilitate evaluation and regulatory review. The following table summarizes hypothetical results from a precision study for an electrochemical method quantifying an anti-inflammatory drug, consistent with the types of data reported in the literature [58].
Table 1: Example Data from Precision Study for an Electrochemical Assay
| Precision Level | Day | Analyst | n | Mean Concentration (µg/mL) | Standard Deviation (SD) | %RSD | Acceptance Criteria (%RSD) |
|---|---|---|---|---|---|---|---|
| Intra-Day | 1 | A | 6 | 100.2 | 0.85 | 0.85 | ≤ 2.0 |
| Intra-Day | 2 | A | 6 | 99.8 | 1.02 | 1.02 | ≤ 2.0 |
| Intra-Day | 3 | A | 6 | 100.5 | 0.91 | 0.91 | ≤ 2.0 |
| Inter-Day | 1-3 | A | 18 | 100.2 | 1.12 | 1.12 | ≤ 2.5 |
Interpretation: The example data demonstrates excellent precision. All intra-day %RSD values are well below the typical acceptance criterion of 2.0%, indicating high repeatability. The pooled inter-day %RSD of 1.12% is also low, showing that the method is robust against variations encountered over different days. In a real-world validation report, the %RSD for precision is often expected to be below 1.5% for assay methods, though this must be justified [4]. The results from a published RP-HPLC method for antiviral drugs show a precision RSD of less than 1.1%, underscoring the high level of reproducibility required in pharmaceutical analysis [59].
The Scientist's Toolkit: Essential Research Reagents and Materials
The reliability of electrochemical analysis is highly dependent on the consistency and quality of materials used. Below is a list of key reagents and solutions critical for ensuring reproducibility in electrochemical pharmaceutical methods.
Table 2: Key Research Reagent Solutions for Electrochemical Precision
| Item | Function in Electrochemical Analysis | Example & Justification |
|---|---|---|
| Supporting Electrolyte | Carries current and controls ionic strength/pH; critical for defining electrochemical window and peak potential. | Britton-Robinson (BR) buffer (0.04 M) [58]. Provides a wide buffering range (pH 2-12) to study pH-dependent analyte behavior. |
| Electrode Materials | The working electrode is the transduction surface where the electrochemical reaction occurs. | Nano-reduced graphene oxide (nRGO)-modified carbon paste electrode (CPE) [58]. Offers high selectivity, low detection limits, and a renewable surface. |
| Redox Probes | Used to characterize electrode performance and active surface area. | [Fe(CN)₆]³⁻/⁴⁻ is a common standard for verifying electron transfer kinetics and surface cleanliness. |
| Surfactants | Can be used to modify electrode surfaces or prevent fouling by adsorbing to the electrode. | Sodium dodecyl sulfate (SDS) [58]. Used in some methods to improve signal response and stability. |
| Standard Stock Solutions | Provide the primary reference for quantification; their accuracy underpins all results. | API in methanol/water [58]. Must be prepared with high-purity reference standards and stored appropriately to ensure stability. |
Troubleshooting Common Reproducibility Issues
Even with a robust protocol, electrochemical systems can face reproducibility challenges. Key issues and mitigation strategies include:
- Electrode Fouling: The adsorption of sample components can passivate the electrode surface, leading to signal drift. Mitigation: Implement a reliable electrode cleaning and regeneration protocol between measurements (e.g., polishing on a microcloth, electrochemical cycling in a clean electrolyte). Using surface-modified electrodes can also improve fouling resistance [58].
- Variability in Electrode History: The performance of solid electrodes can change with use. Mitigation: Use a system suitability test before each analytical run to verify electrode performance [6] [4]. This may involve measuring a standard solution and ensuring the signal response and peak potential are within a specified range.
- Environmental Fluctuations: Temperature variations can affect reaction kinetics and diffusion rates, impacting current. Mitigation: Perform analyses in a temperature-controlled laboratory environment and specify the temperature in the method documentation as part of robustness testing.
Rigorous assessment of intra-day and inter-day precision is non-negotiable for the validation of electrochemical methods in pharmaceutical research. By adhering to the structured experimental protocols and data analysis techniques outlined in this guide—rooted in the ICH Q2(R1) framework—scientists can generate high-quality, reliable data that demonstrates methodological robustness. A thorough understanding of potential pitfalls and the implementation of a controlled "Scientist's Toolkit" are paramount for troubleshooting reproducibility issues. As the field moves towards more advanced guidelines like ICH Q2(R2) and embraces sustainable analytical chemistry principles [60] [58], the foundational practice of precision testing remains the bedrock of generating trustworthy analytical results that support drug development and quality control.
Robustness is defined as a measure of the capacity of an analytical procedure to remain unaffected by small, deliberate variations in method parameters and provides an indication of its reliability during normal usage [61]. Within the framework of ICH Q2(R1) guideline validation, robustness testing represents a critical validation characteristic that demonstrates the method's consistency when exposed to inevitable, minor operational fluctuations in a laboratory environment [62]. For electrochemical methods used in pharmaceutical analysis, establishing robustness ensures that method performance remains uncompromised by subtle changes in key parameters such as pH, temperature, and scan rate, thereby preventing costly method failures during routine quality control operations.
The importance of robustness testing has evolved significantly in pharmaceutical analysis. Traditionally, robustness was evaluated during the final validation stages, often leading to unexpected issues that required method reoptimization [63]. Modern Quality by Design (QbD) principles encourage early robustness assessment during method development to "build in quality from the outset" [63]. This proactive approach aligns with the lifecycle management concept introduced in recent regulatory updates, including ICH Q2(R2) and ICH Q14, which emphasize continuous method evaluation rather than treating validation as a one-time event [3]. For electrochemical techniques, this systematic approach to robustness is particularly valuable given the sensitivity of electrochemical responses to experimental conditions.
Theoretical Framework and Regulatory Context
ICH Q2 Guidelines and Robustness Testing
The ICH Q2(R1) guideline establishes robustness as a key validation characteristic, though it does not prescribe specific experimental protocols, instead allowing flexibility based on the particular analytical procedure [62]. The guideline defines robustness as a measure of method reliability under normal usage conditions through deliberate parameter variations [61]. While ICH Q2(R1) provides the foundational framework, recent updates in ICH Q2(R2) have further strengthened robustness requirements, making it compulsory and integrating it within a lifecycle approach that demands continuous evaluation of a method's stability against operational variation [3].
The transition from ICH Q2(R1) to Q2(R2) represents a significant shift in regulatory expectations. The updated guideline emphasizes more comprehensive validation requirements and directly links the method's range to its Analytical Target Profile (ATP) [3]. This evolution addresses the increasing complexity of analytical techniques, including electrochemical methods, and reinforces the need for thorough robustness testing during method validation and throughout the method's operational life.
Defining Critical Parameters for Electrochemical Methods
In electrochemical pharmaceutical analysis, parameter selection for robustness testing should be science-based and risk-informed. Critical parameters typically include those known to influence method performance based on electrochemical theory:
- pH variations: Affect ionization states of analytes and electrochemical kinetics
- Temperature fluctuations: Influence reaction rates, diffusion coefficients, and thermodynamic parameters
- Scan rate variations: Impact peak current, resolution, and detection capabilities in voltammetric techniques
- Electrode surface conditions: Affect reproducibility and sensitivity
- Supporting electrolyte composition: Influences conductivity and electrochemical behavior
These parameters represent internal robustness factors as they are specified within the method procedure, distinguishing them from ruggedness (intermediate precision) factors which address external variations between analysts, instruments, or laboratories [61].
Experimental Design for Robustness Testing
Screening Designs for Initial Parameter Evaluation
Screening designs represent efficient statistical approaches for identifying significantly influential factors with minimal experimental runs. For robustness testing with multiple potential factors, three primary screening designs are commonly employed:
Table 1: Comparison of Experimental Designs for Robustness Testing
| Design Type | Number of Runs for 5 Factors | Key Applications | Advantages | Limitations |
|---|---|---|---|---|
| Full Factorial | 32 (2^5) | Small factor numbers (<5) | Estimates all main effects and interactions | Runs increase exponentially with factors |
| Fractional Factorial | 16 (2^(5-1)) | Moderate factor numbers (5-10) | Reduces runs while estimating main effects | Some confounding of interactions |
| Plackett-Burman | 12 | Large factor numbers (>10) | Highly efficient for main effects screening | Cannot estimate interactions |
Plackett-Burman designs are particularly valuable for initial robustness screening of electrochemical methods as they efficiently identify critical parameters from a larger set of potential factors using an economical number of experiments in multiples of four rather than powers of two [61] [64]. These designs are based on the "scarcity of effects principle" which assumes that while many factors can be investigated, relatively few will significantly impact method performance [61].
Implementing Plackett-Burman Designs
The practical implementation of Plackett-Burman designs for electrochemical method robustness testing involves several key steps. First, analysts must select appropriate high (+1) and low (-1) levels for each parameter based on scientifically justified, expected variations. For example, pH might be tested at ±0.2 units from the optimum, temperature at ±2°C, and scan rate at ±10% of the specified value. These intervals should represent realistic variations that might occur during routine method application.
In a study investigating raloxifene hydrochloride and its impurities using liquid chromatography, researchers employed a Plackett-Burman design to examine five real factors (acetonitrile content, sodium dodecyl sulfate content, column temperature, pH of the mobile phase, and flow rate) through twelve experiments [64]. Similarly, for electrochemical methods, a Plackett-Burman design can efficiently evaluate the effects of pH, temperature, scan rate, supporting electrolyte concentration, and deposition time in a single, structured study.
The experimental workflow for implementing such robustness testing is systematically outlined below:
Methodologies for Key Parameter Evaluation
pH Variation Studies
pH represents one of the most critical parameters in electrochemical methods as it directly influences ionization states, reaction kinetics, and diffusion characteristics of pharmaceutical compounds. The theoretical foundation for pH effects stems from the Nernst equation and its impact on formal potentials of electrochemical reactions. For robustness testing, pH should be varied around the optimum value using scientifically justified intervals, typically ±0.2-0.5 pH units depending on the buffer capacity and method sensitivity.
Temperature compensation is essential when measuring pH, as pH is inherently temperature-dependent [65]. Automatic Temperature Compensation (ATC) features in modern pH meters adjust calibration readings based on current buffer temperature, though many instruments apply ATC only during calibration, not sample measurement [65]. For rigorous robustness testing, analysts should ensure that all pH measurements are conducted at consistent temperatures or apply appropriate correction factors to account for temperature-induced pH shifts.
A practical protocol for evaluating pH robustness in electrochemical methods involves:
- Prepare buffer solutions at three different pH levels (nominal, nominal-ΔpH, nominal+ΔpH)
- Adjust pH using the same buffer system with minimal volume changes
- Verify pH values at the measurement temperature using properly calibrated instruments
- Analyze standard solutions across the pH range using the electrochemical method
- Monitor critical responses including peak potential shifts, peak current changes, and resolution
- Statistically evaluate the significance of pH effects on method performance
Temperature Variation Studies
Temperature significantly impacts electrochemical measurements through its effects on reaction kinetics, diffusion coefficients, and solution viscosity. The temperature dependence of electrochemical processes is described by the Arrhenius equation, with typical reaction rate changes of 2-5% per °C. For robustness testing, temperature should be varied by ±2-5°C from the optimum, depending on the method sensitivity and expected laboratory temperature fluctuations.
A standardized approach to temperature robustness testing includes:
- Utilize temperature-controlled electrochemical cells with accuracy of ±0.1°C
- Allow sufficient equilibration time at each test temperature (typically 10-15 minutes)
- Analyze standard solutions at minimum three temperature levels (low, nominal, high)
- Monitor temperature-induced changes in peak currents, peak potentials, and background current
- Evaluate temperature effects on method precision and accuracy
- Establish temperature operating ranges based on statistical analysis of responses
For methods exhibiting significant temperature dependence, implementation of internal temperature standards or potentiostats with active temperature compensation may be necessary to ensure routine method robustness.
Scan Rate Variation Studies
In voltammetric techniques, scan rate directly influences peak current, resolution, and analysis time. According to electrochemical theory, peak current in cyclic voltammetry scales with the square root of scan rate for diffusion-controlled processes, while adsorption-controlled processes show direct proportionality to scan rate. Robustness testing should evaluate scan rate variations of ±10-20% from the specified value, representing potential instrument-to-instrument variations or minor method execution differences.
An effective scan rate robustness assessment protocol includes:
- Perform measurements at multiple scan rates (minimum five points spanning the test range)
- Analyze the relationship between peak current and scan rate (or square root of scan rate)
- Evaluate changes in peak potential separation (ΔEp) for reversible systems
- Monitor effects on signal-to-noise ratio and detection capabilities
- Assess impact on resolution between closely-spaced peaks
- Establish acceptable scan rate ranges based on predefined acceptance criteria
Table 2: Acceptance Criteria for Robustness Testing of Electrochemical Methods
| Performance Characteristic | Typical Acceptance Criteria | Measurement Approach |
|---|---|---|
| Peak Current (Signal) | RSD ≤ 5% across variations | Percentage relative standard deviation |
| Peak Potential (Selectivity) | Shift ≤ ±25 mV | Absolute difference from nominal |
| Resolution | Rs ≥ 1.5 between critical pairs | USP resolution calculation |
| Accuracy | Recovery 98-102% | Percentage recovery of known standard |
| Precision | RSD ≤ 3% for peak current | Percentage relative standard deviation |
Data Analysis and Interpretation
Statistical Analysis of Robustness Data
Robustness testing generates multivariate data requiring appropriate statistical analysis to distinguish significant effects from normal methodological variation. For screening designs, analysis of variance (ANOVA) identifies parameters significantly affecting critical responses at a predetermined confidence level (typically 95%). Effect magnitudes indicate the practical significance of each parameter variation, helping establish scientifically justified operating ranges.
The calculation of insignificance intervals represents a sophisticated approach to robustness data analysis. These intervals define the range within which a factor can be varied without significantly affecting method performance [64]. For electrochemical methods, insignificance intervals can be determined for pH, temperature, and scan rate, providing clear operational boundaries for method parameters.
System Suitability Test Establishment
Data from robustness studies directly inform the development of system suitability tests that ensure method validity during routine use [61]. These tests establish that the analytical system, including both instrument and method, is functioning correctly on each day of use. Based on robustness findings, specific system suitability criteria might include:
- Resolution between critical peak pairs
- Peak asymmetry factors within specified ranges
- Signal-to-noise ratios for detection capability verification
- Retention time or peak potential reproducibility
- Standard recovery within acceptance limits
Implementation in Pharmaceutical Quality Control
Control Strategy Development
Robustness testing results facilitate development of comprehensive control strategies for electrochemical methods. These strategies define the measures necessary to ensure method performance throughout its lifecycle, including:
- Parameter operating ranges (established from robustness studies)
- System suitability requirements
- Calibration frequency and procedures
- Preventive maintenance schedules for electrochemical equipment
- Training requirements for analysts
The QbD approach to robustness testing emphasizes establishing a method operable design region (MODR) within which method parameters can be varied without impacting performance [63]. This provides operational flexibility while maintaining method validity, particularly beneficial for transfer between laboratories or equipment.
Documentation and Regulatory Submissions
Comprehensive documentation of robustness studies is essential for regulatory compliance and method knowledge management. The documentation should include:
- Experimental design justification
- Detailed experimental conditions
- Complete raw data and statistical analysis
- Interpretation of results and conclusions
- Established parameter ranges and control strategies
Recent regulatory updates emphasize enhanced documentation practices, requiring transparency and traceability throughout method development and validation [3]. Properly documented robustness studies demonstrate method understanding and facilitate regulatory approvals.
Essential Research Reagents and Materials
Table 3: Key Research Reagent Solutions for Electrochemical Robustness Testing
| Reagent/Material | Function in Robustness Testing | Key Considerations |
|---|---|---|
| Buffer Systems | Control pH in electrochemical cell | Temperature compensation required [65] |
| Supporting Electrolytes | Maintain conductivity and ionic strength | Purity level affects background current |
| Standard Reference Materials | Method performance assessment | Certified reference materials preferred |
| Working Electrodes | Signal generation | Surface reproducibility critical |
| Reference Electrodes | Potential control and measurement | Stability and maintenance requirements |
| Temperature Control Systems | Maintain solution temperature | Accuracy of ±0.1°C recommended |
Robustness testing of pH, temperature, and scan rate variations represents a critical component of electrochemical method validation within the ICH Q2 framework. Through systematic experimental designs including Plackett-Burman and fractional factorial approaches, analysts can efficiently identify significant factors affecting method performance. The resulting data enables establishment of scientifically justified operating ranges and comprehensive control strategies that ensure method reliability throughout its lifecycle. As regulatory expectations evolve toward enhanced method understanding and lifecycle management, thorough robustness testing becomes increasingly essential for successful pharmaceutical method implementation and regulatory acceptance.
Demonstrating Analytical Fitness: Validation Protocols and Comparative Assessment
Designing a Comprehensive Validation Protocol for Electrochemical Methods
Within the pharmaceutical industry, the validation of analytical procedures is a fundamental requirement of Good Manufacturing Practice (GMP) and Good Laboratory Practice (GLP) to ensure the reliability and consistency of data used for product release and stability testing [18]. The International Council for Harmonisation (ICH) guideline Q2(R1), officially adopted by regulatory bodies including the U.S. Food and Drug Administration (FDA) and the European Medicines Agency (EMA), provides a harmonized framework for this validation [11] [1]. This document serves as the global gold standard, defining the core validation characteristics and methodologies that guarantee an analytical procedure is fit for its intended purpose [62] [11].
Electrochemical methods, encompassing techniques such as voltammetry, amperometry, and potentiometry, offer significant advantages for pharmaceutical analysis, including high sensitivity, selectivity, and cost-effectiveness. However, their application in a regulated environment necessitates a rigorous and well-documented validation protocol compliant with ICH Q2(R1). This guide provides a comprehensive, step-by-step framework for designing such a protocol specifically for electrochemical methods, ensuring scientific integrity and regulatory compliance for researchers and drug development professionals.
Core Principles of ICH Q2(R1)
The ICH Q2(R1) guideline, titled "Validation of Analytical Procedures: Text and Methodology," consolidates the fundamental principles for validating analytical methods [1]. It emphasizes that validation is not a mere formality but a process of providing documented evidence that a method consistently produces results that are reliable, accurate, and reproducible for its intended application [18]. The guideline categorizes analytical procedures into three primary types, each with distinct validation objectives [66]:
- Identification Tests: Used to confirm the identity of an analyte in a sample, often by comparing its properties to a reference standard [66].
- Testing for Impurities: Procedures to detect and quantify impurities in a drug substance or product. These can be limit tests (which determine if an impurity is above or below a specified limit) or quantitative tests (which precisely measure the amount of impurity) [66].
- Assays: Procedures used for the quantitative determination of the main analyte in a sample, which can measure either the content (amount) of the active ingredient or its potency (biological activity) [66].
The specific validation parameters required depend on the type of analytical procedure being validated. The following workflow outlines the strategic process for planning and executing a method validation project.
Diagram 1: The method validation lifecycle, from initial planning to final approval.
Validation Parameters and Experimental Protocols for Electrochemical Methods
This section details the core validation characteristics defined in ICH Q2(R1), providing specific experimental methodologies and acceptance criteria tailored for electrochemical techniques.
Specificity/Selectivity
- Definition: The ability of the method to assess unequivocally the analyte in the presence of other components that may be expected to be present, such as impurities, degradation products, excipients, or matrix components [62].
- Experimental Protocol: For an electrochemical method, specificity is demonstrated by comparing the electrochemical response (e.g., peak potential in voltammetry, steady-state current in amperometry) of the analyte in a pure standard solution to the response obtained from a sample solution spiked with all potential interferents.
- Prepare Solutions:
- Standard Solution: A solution of the pure analyte at the target concentration in the supporting electrolyte.
- Sample/Placebo Solution: A solution containing the expected matrix (e.g., placebo formulation, biological fluid) without the analyte.
- Spiked Sample Solution: The sample/placebo solution spiked with the analyte at the target concentration.
- Analyze Solutions: Perform the electrochemical analysis (e.g., run a differential pulse voltammogram) for all three solutions under identical conditions.
- Evaluation: The method is specific if the signal (e.g., peak current) for the analyte in the spiked sample is equivalent to that in the standard solution, and no significant interfering signals are observed from the sample/placebo solution at the same potential as the analyte.
- Prepare Solutions:
Linearity and Range
- Definition:
- Linearity is the ability of the method to obtain test results that are directly proportional to the concentration of the analyte [54] [62].
- Range is the interval between the upper and lower concentrations of analyte for which suitable levels of linearity, accuracy, and precision have been demonstrated [62].
- Experimental Protocol:
- Prepare a minimum of five standard solutions of the analyte at different concentrations spanning the expected range (e.g., 50%, 75%, 100%, 125%, 150% of the target concentration) [18].
- Analyze each solution in triplicate using the electrochemical method.
- Plot the mean response (e.g., peak current, charge) against the analyte concentration.
- Perform a linear regression analysis to calculate the correlation coefficient (r), slope, and y-intercept.
- Acceptance Criteria: A correlation coefficient (r) of ≥ 0.995 is typically expected for chromatographic and similar physicochemical methods, which serves as a good benchmark for electrochemical techniques [62]. The residual plot should show random scatter around zero, indicating no systematic deviation from linearity [62].
Table 1: Summary of Core Validation Parameters and Typical Acceptance Criteria
| Parameter | Definition | Typical Experimental Approach | Common Acceptance Criteria |
|---|---|---|---|
| Specificity | Ability to measure analyte amidst interferents | Compare analyte response in pure form vs. in matrix | No interference at the analyte's signal location. |
| Linearity | Proportionality of response to concentration | Analyze 5+ concentration levels | Correlation coefficient (r) ≥ 0.995 [62]. |
| Range | Interval where linearity, accuracy, and precision hold | Established from linearity study | Confirmed from LOQ to 120% of test concentration for assays. |
| Accuracy | Closeness of result to true value | Spike/recovery with known amounts or vs. reference standard | Recovery of 98–102% for drug substance [62]. |
| Precision | Closeness of results under prescribed conditions | Multiple measurements of homogeneous sample | RSD < 2% for assay of drug product [62]. |
| LOD | Lowest detectable concentration | Signal-to-Noise Ratio | S/N ≥ 3:1 [62]. |
| LOQ | Lowest quantifiable concentration with accuracy and precision | Signal-to-Noise Ratio or based on precision/accuracy | S/N ≥ 10:1 [62]. |
| Robustness | Reliability under small, deliberate parameter changes | Vary key parameters (e.g., pH, temperature) | Method remains unaffected (meets system suitability). |
Accuracy
- Definition: The closeness of agreement between the value found by the method and the value accepted as either a conventional true value or an accepted reference value [62]. It is typically expressed as percent recovery.
- Experimental Protocol (Recovery Study):
- Prepare a placebo mixture containing all non-active ingredients (excipients) of the formulation.
- Spike the placebo with known amounts of the analyte at three concentration levels (e.g., 80%, 100%, 120% of the target concentration), with a minimum of three replicates per level.
- Analyze the spiked samples using the validated electrochemical method.
- Calculate the recovery for each sample:
% Recovery = (Measured Concentration / Theoretical Concentration) × 100.
- Acceptance Criteria: Mean recovery should be close to 100%. For a drug substance, recovery is typically 98–102%; for a drug product, it may be slightly wider, e.g., 97–103% [62].
Precision
Precision is evaluated at three levels: repeatability, intermediate precision, and reproducibility [62]. It is usually expressed as the relative standard deviation (RSD) of a series of measurements.
- Repeatability (Intra-assay Precision):
- Protocol: Analyze a minimum of six independent preparations of a homogeneous sample at 100% of the test concentration using the same analytical procedure, equipment, and analyst in a short interval.
- Acceptance Criteria: RSD < 2% for assay methods is common [62].
- Intermediate Precision:
- Protocol: Demonstrate the reliability of the method within the same laboratory under different conditions (e.g., different days, different analysts, different equipment). A design similar to the repeatability study is performed, but the factors are varied.
- Acceptance Criteria: The overall RSD from the intermediate precision study should be comparable to or slightly higher than the repeatability RSD.
Detection Limit (LOD) and Quantitation Limit (LOQ)
- Definitions:
- Experimental Protocol (Based on Signal-to-Noise): This approach is applicable to electrochemical techniques that display a baseline, such as voltammetry.
- Record the electrochemical signal for a blank solution (containing only the supporting electrolyte/matrix).
- Measure the amplitude of the baseline noise (N) over a range where the analyte signal is expected.
- Analyze a sample with the analyte at a concentration that produces a signal (S).
- The LOD is the concentration that yields S/N = 3:1. The LOQ is the concentration that yields S/N = 10:1 [62].
Robustness
- Definition: A measure of the method's capacity to remain unaffected by small, deliberate variations in method parameters, indicating its reliability during normal usage [62].
- Experimental Protocol: Identify critical operational parameters in the electrochemical method that could potentially vary. Systematically vary these parameters one at a time and evaluate their impact on the method's performance (e.g., peak current, peak potential, resolution).
- Examples of Parameters to Vary:
- pH of the supporting electrolyte (± 0.2 units)
- Temperature of the electrochemical cell (± 2 °C)
- Scan rate in voltammetry (± 10%)
- Concentration of the supporting electrolyte (± 10%)
- Equilibration time before measurement (± 10%)
- Examples of Parameters to Vary:
- Evaluation: The method is robust if the system suitability criteria are met and the analytical results remain unaffected by the small variations in these parameters.
The Scientist's Toolkit: Essential Reagents and Materials
The following table details key materials and reagents required for developing and validating electrochemical methods in pharmaceutical analysis.
Table 2: Key Research Reagent Solutions and Materials for Electrochemical Analysis
| Item | Function / Purpose |
|---|---|
| Active Pharmaceutical Ingredient (API) Reference Standard | Serves as the certified reference material for method development and validation to ensure accuracy and specificity [18]. |
| Pharmaceutical Placebo Formulation | A mixture of all non-active ingredients (excipients) used in accuracy (recovery) studies to assess matrix effects [62]. |
| High-Purity Supporting Electrolyte | Provides ionic conductivity, controls pH, and minimizes the effects of migration current in the electrochemical cell. |
| Ultra-Pure Solvents & Water | Used for preparing all standard and sample solutions to minimize background current and interference from contaminants. |
| Standard Buffer Solutions | Used for calibrating the pH meter to ensure accurate and reproducible control of the solution pH, a critical robustness factor. |
| Working, Reference & Counter Electrodes | The core components of the electrochemical cell where the analytical signal is generated and measured. |
Designing the Validation Protocol and Report
A successful validation begins with a detailed protocol, which serves as the blueprint for the entire study.
Validation Protocol Content
The protocol should be approved before experimentation begins and must include [11]:
- Objective and Scope: Clearly state the purpose of the validation and the method to be validated.
- Analytical Procedure: A detailed, step-by-step description of the method.
- Validation Parameters: A list of the characteristics to be validated (e.g., specificity, accuracy, precision).
- Experimental Design: A precise description of the experiments, including the number of replicates, concentration levels, and the sequence of analysis.
- Acceptance Criteria: Predefined, justified limits for each validation parameter.
Validation Report
Upon completion of the experiments, a final validation report is generated. This report should present all collected data, a statistical analysis, and a conclusion on the suitability of the method. It must include:
- A summary of the results and their comparison to the acceptance criteria.
- A discussion of any deviations from the protocol.
- A final statement confirming that the method has been validated and is fit for its intended purpose.
Adherence to the ICH Q2(R1) guideline is not merely a regulatory hurdle but a fundamental scientific practice that ensures the quality, safety, and efficacy of pharmaceutical products. For electrochemical methods, which offer powerful analytical capabilities, a meticulously designed and executed validation protocol is paramount. By systematically addressing each core validation characteristic—specificity, linearity, accuracy, precision, LOD, LOQ, and robustness—with scientifically sound experiments and predefined acceptance criteria, researchers can generate defensible data that meets global regulatory standards. This comprehensive guide provides the framework for developing such a protocol, empowering scientists to leverage electrochemical techniques with confidence in the rigorous environment of pharmaceutical development.
The validation of analytical procedures is a cornerstone of pharmaceutical development and quality control, ensuring the reliability, accuracy, and reproducibility of data supporting drug product safety and efficacy. The International Council for Harmonisation (ICH) Q2(R1) guideline, titled "Validation of Analytical Procedures: Text and Methodology," provides a foundational framework for this process, defining key validation parameters such as specificity, accuracy, precision, linearity, range, detection limit (LOD), and quantitation limit (LOQ) [1] [2]. Traditionally, chromatographic techniques, particularly high-performance liquid chromatography (HPLC), have been the mainstay for pharmaceutical analysis, often serving as the reference compendial method. However, electrochemical methods are emerging as powerful alternatives, offering distinct advantages in speed, cost, and sensitivity for certain applications.
This technical guide provides a comparative analysis of electrochemical and chromatographic techniques within the context of ICH Q2(R1). It examines the principles, performance, and practical implementation of these methods, supported by experimental data and case studies. The evolution towards modernized guidelines like ICH Q2(R2) and the principles of Analytical Procedure Development (ICH Q14) is also considered, highlighting the growing acceptance of a more holistic, science-based approach to method lifecycle management, which can accommodate novel analytical technologies [3].
Fundamental Principles and ICH Q2(R1) Validation Parameters
The ICH Q2(R1) guideline standardizes the validation of analytical procedures for pharmaceuticals. The following parameters are critical for comparing any analytical technique [1] [67]:
- Specificity: The ability to assess the analyte unequivocally in the presence of components that may be expected to be present, such as impurities, degradants, or matrix components.
- Accuracy: The closeness of agreement between the value accepted as a reference and the value found.
- Precision: The closeness of agreement between a series of measurements. This includes repeatability (intra-assay precision) and intermediate precision (variation between days, analysts, equipment, etc.).
- Linearity: The ability of the method to obtain test results proportional to the concentration of the analyte.
- Range: The interval between the upper and lower concentrations of analyte for which suitable levels of precision, accuracy, and linearity have been demonstrated.
- Detection Limit (LOD): The lowest concentration of an analyte that can be detected, but not necessarily quantified.
- Quantitation Limit (LOQ): The lowest concentration of an analyte that can be quantified with acceptable precision and accuracy.
- Robustness: A measure of the method's capacity to remain unaffected by small, deliberate variations in procedural parameters.
Calculation of LOD and LOQ
According to ICH Q2(R1), the LOD and LOQ can be determined based on the standard deviation of the response and the slope of the calibration curve. The formulas are as follows [68]:
- LOD = 3.3σ / S
- LOQ = 10σ / S
Where σ is the standard deviation of the response (which can be the standard error of the regression) and S is the slope of the calibration curve. These calculations are universally applicable to both chromatographic and electrochemical methods, allowing for direct comparison of their sensitivity [68].
Comparative Analysis of Techniques
Chromatographic Methods
Chromatographic techniques, such as HPLC, separate components in a mixture based on their differential partitioning between a mobile and a stationary phase.
- Principles and Workflow: In HPLC, a liquid mobile phase forces the sample through a column packed with a stationary phase. Analytes interact differently with the stationary phase, leading to separation over time. The separated analytes are then detected, typically by ultraviolet (UV) or mass spectrometric (MS) detectors [69] [68].
- Strengths: HPLC is renowned for its high separation efficiency, excellent specificity when coupled with MS detectors, and well-established protocols for a wide range of pharmaceuticals. It is often the reference method against which others are compared [69] [70].
- Weaknesses: These methods can be time-consuming, require complex sample pre-treatment, involve costly instrumentation and maintenance, and require significant solvent consumption [69] [70] [71].
Electrochemical Methods
Electrochemical techniques measure electronic signals (current, potential) resulting from chemical reactions involving electron transfer at an electrode-solution interface.
- Principles and Workflow: An electrochemical cell, typically with a three-electrode setup (working, reference, and counter electrode), is used. Techniques like differential pulse voltammetry (DPV) or amperometry apply controlled potentials and measure the resulting current, which is proportional to the analyte concentration [69] [70]. The process involves electrode preparation, analyte enrichment at the electrode surface, and signal measurement.
- Strengths: Electroanalysis is characterized by high sensitivity (often in nanomolar to picomolar ranges), rapid response, cost-effectiveness, portability for potential field use, and simplicity of operation [69] [70] [71].
- Weaknesses: Challenges can include susceptibility to interference from complex matrices, fouling of the electrode surface, and a potential need for regular sensor calibration [70].
The diagram below illustrates the core logical and workflow differences between the two analytical approaches.
Quantitative Performance Comparison
The following tables summarize experimental data from recent studies, directly comparing the performance of electrochemical and chromatographic methods for specific analytes.
Table 1: Performance Comparison for Octocrylene Detection in Water Matrices [69] [72]
| Parameter | Electrochemical Method (GCS) | Chromatographic Method (HPLC) |
|---|---|---|
| Analyte | Octocrylene | Octocrylene |
| Limit of Detection (LOD) | 0.11 ± 0.01 mg L⁻¹ | 0.35 ± 0.02 mg L⁻¹ |
| Limit of Quantification (LOQ) | 0.86 ± 0.04 mg L⁻¹ | 2.86 ± 0.12 mg L⁻¹ |
| Key Advantage | Higher sensitivity, lower LOD/LOQ | High separation efficiency |
| Application Context | Monitoring in swimming pool water and sunscreen formulations |
Table 2: Performance Comparison for Hydrogen Sulfide (H₂S) Quantification [71]
| Parameter | Colorimetric | Chromatographic (HPLC) | Voltametric | Amperometric |
|---|---|---|---|---|
| Sensitivity Range | Millimolar (mM) | Micromolar (μM) | Nanomolar (nM) | Picomolar (pM) |
| Sample Volume | ~1 mL | ~25 μL | Not Specified | Not Specified |
| Key Characteristic | Simple, inexpensive | Built on colorimetric method | Less time-consuming | Highest sensitivity |
| Best Suited For | Lower sensitivity needs | Moderate sensitivity & sample conservation | High sensitivity, fast response | Ultra-high sensitivity needs |
Case Study: Quantification of Octocrylene According to ICH Q2(R1)
A recent study provides a direct, real-world comparison of electrochemical and HPLC methods for quantifying octocrylene (OC), a common sunscreen agent, aligning the validation with ICH Q2(R1) principles [69].
Detailed Experimental Protocols
Electroanalytical Method using a Glassy Carbon Sensor (GCS)
- Instrumentation: An Autolab PGSTAT302N potentiostat/galvanostat controlled by GPES software was used. A standard three-electrode electrochemical cell consisted of a glassy carbon working electrode (GCE), an Ag/AgCl (3M KCl) reference electrode, and a platinum counter electrode [69].
- Electrode Preparation: The GCE was polished with polishing paper before and after each measurement to ensure a clean, reproducible surface—a critical step for maintaining precision and accuracy [69].
- Measurement Parameters:
- Technique: Differential Pulse Voltammetry (DPV)
- Electrolyte: 10 mL of Britton–Robinson (BR) buffer (pH 6)
- Potential Range: -0.8 V to -1.5 V (or vice-versa for anodic response)
- Step Potential: +0.005 V
- Modulation Amplitude: +0.1 V
- Equilibrium Time: 10 s [69]
- Procedure: The analytical curve was constructed by measuring the voltammetric current response of OC standard solutions of known concentration under the defined DPV parameters [69].
Chromatographic Method (HPLC)
- Instrumentation: An Ultimate 3000 HPLC system equipped with a C18 column and a UV detector was used [69].
- Chromatographic Conditions:
- Elution Mode: Isocratic
- Mobile Phase: Acetonitrile/Water (80/20)
- Data Processing: Thermo Scientific Chromeleon Chromatography Data System software [69].
- Procedure: Samples were injected, and OC was separated on the C18 column. The retention time and peak area were used for identification and quantification, respectively [69].
Validation Data and Comparative Findings
The study demonstrated that both methods were suitable for quantifying OC in real sunscreen samples and water matrices, with no significant differences in calculated concentrations [69] [72]. However, as shown in Table 1, the electroanalytical method using GCS showed superior sensitivity, with lower LOD and LOQ values compared to HPLC. This highlights electroanalysis as a reliable and efficient alternative for environmental monitoring of this compound [69].
The Scientist's Toolkit: Essential Research Reagents and Materials
Successful implementation of these analytical methods requires specific materials and reagents. The following table details key items used in the featured experiments.
Table 3: Essential Research Reagents and Materials for Analytical Method Development
| Item | Function | Example from Research |
|---|---|---|
| Glassy Carbon Electrode (GCE) | Working electrode; surface for electron transfer in electroanalysis. | Polished before each use for detecting octocrylene [69]. |
| Britton-Robinson (BR) Buffer | Electrolyte solution; maintains constant pH for electrochemical reactions. | Used at pH 6 for OC quantification by DPV [69]. |
| Potentiostat/Galvanostat | Instrument for applying potential/current and measuring electrochemical signals. | Autolab PGSTAT302N used for DPV measurements [69]. |
| HPLC C18 Column | Stationary phase for reverse-phase chromatographic separation. | Used with acetonitrile/water mobile phase to separate OC [69]. |
| Boron-Doped Diamond (BDD) Anode | Electrode for advanced electrochemical oxidation processes. | Used to monitor OC degradation at high current densities [69]. |
| Reference Electrode (Ag/AgCl) | Provides a stable, known reference potential in a 3-electrode cell. | Used as the reference electrode in the GCS setup [69]. |
The Evolving Regulatory Context: ICH Q2(R1) and Beyond
While ICH Q2(R1) provides the current foundation for method validation, the landscape is evolving. The recent adoption of ICH Q2(R2) and the introduction of ICH Q14 on "Analytical Procedure Development" signal a significant shift [3].
These updated guidelines encourage a more holistic, lifecycle approach to analytical procedures. Key enhancements include [3]:
- Enhanced Method Development: Incorporation of Quality by Design (QbD) principles and the definition of an Analytical Target Profile (ATP) to ensure methods are fit-for-purpose from the outset.
- Risk Management: Systematic risk assessment is recommended to identify and control critical method parameters.
- Ongoing Validation: Validation is no longer a one-time event but a continuous process throughout the method's lifecycle.
This modernized framework facilitates the adoption of alternative techniques like electrochemistry by providing a more flexible and science-based pathway for demonstrating their validity and robustness comparable to traditional compendial methods [3].
Both chromatographic and electrochemical methods offer distinct advantages and can be validated in compliance with ICH Q2(R1). Chromatography remains the gold standard for applications requiring high separation power. In contrast, electrochemical techniques present a compelling alternative with superior sensitivity, speed, and cost-effectiveness for specific analytes like octocrylene and hydrogen sulfide.
The choice between techniques should be guided by the ATP, considering the specific analytical problem, required sensitivity, matrix complexity, and available resources. The evolving regulatory framework of ICH Q2(R2) and ICH Q14 supports this reasoned, data-driven selection, promising a future where robust, fit-for-purpose methods, whether compendial or alternative, can be more readily developed and implemented to ensure product quality and patient safety.
Evaluating Accuracy through Spiked Recovery Studies in Pharmaceutical Matrices
In the realm of pharmaceutical analysis, demonstrating that an analytical method produces truthful results is paramount. Accuracy, one of the fundamental validation characteristics defined by the International Council for Harmonisation (ICH) Q2(R1) guideline, provides this assurance by expressing the closeness of agreement between a measured value and a value accepted as a true or reference value [18] [4]. For quantitative procedures, accuracy is typically established through spiked recovery studies, which are critical for proving a method's suitability for its intended purpose, from drug substance purity testing to impurity quantification [4].
This technical guide details the principles, design, and interpretation of spiked recovery studies, framed within the requirements of ICH Q2(R1) and with specific consideration for electrochemical methods. A well-executed recovery study not only satisfies regulatory requirements but also builds confidence in the data generated throughout the drug development and manufacturing lifecycle.
Theoretical Foundations of Recovery
Definition and Regulatory Significance
In a spiked recovery experiment, a known amount of a reference standard of the analyte (the "spike") is introduced into a sample matrix that contains or is expected to contain the analyte. The sample is then analyzed using the method under validation. The recovery is calculated as the percentage of the measured amount of the analyte recovered from the matrix compared to the known amount added [73] [74].
Regulatory agencies such as the FDA and EMA, guided by ICH principles, consider recovery values within 75% to 125% of the spiked concentration to be generally acceptable, though the specific acceptance criteria should be predefined and justified based on the method's intended use [74]. Persistent recovery values outside this range, such as 40%, indicate a fundamental issue with the method that must be investigated and resolved; applying a simple "recovery factor" to correct the data is not a recommended practice as it masks underlying methodological problems [75].
Mechanisms of Inaccuracy: Over-Recovery and Under-Recovery
Deviations from 100% recovery manifest as either under-recovery or over-recovery, each pointing to different potential sources of error:
- Under-Recovery (<100%): This is more commonly observed and can result from:
- Inefficient Extraction: Incomplete release of the analyte from the matrix during sample preparation [75].
- Adsorption Losses: Binding of the analyte to container surfaces (e.g., glassware) or filtration units [75].
- Ion Suppression: In LC-MS methods, co-eluting matrix components can reduce the ionization efficiency of the analyte in the mass spectrometer source [76] [75].
- Chemical Degradation: Partial decomposition of the analyte during sample preparation or analysis [75].
- Over-Recovery (>100%): This can occur due to:
- Interference: Matrix components that co-elute with the analyte and contribute to the detection signal [74].
- Ion Enhancement: In LC-MS, matrix components can sometimes enhance the ionization of the analyte [76].
- Inaccurate Standardization: Errors in the preparation of the standard solutions used for spiking.
Experimental Design and Protocols
A robust recovery study must be carefully designed to generate meaningful and statistically sound data.
Preliminary Studies: Dilution Linearity and MRD
Before conducting a recovery assay, it is recommended to first perform a dilution linearity study. This experiment determines the Minimum Required Dilution (MRD), which is the lowest dilution at which antibody excess conditions are met and matrix interference is minimized, ensuring the analyte concentration is within the assay's acceptable working range [74]. Establishing the MRD is crucial for ensuring that the recovery study is conducted under conditions where the method is expected to perform reliably.
Core Recovery Study Protocol
The following protocol outlines the standard procedure for a spiked recovery assay, adaptable for various analytical techniques.
Sample Preparation:
- Select a minimum of three different lots of the blank matrix to account for lot-to-lot variability [76].
- For each matrix lot, prepare three sets of samples in triplicate:
- Set A (Unspiked Sample): The native matrix sample diluted to the MRD. This determines the endogenous level of the analyte.
- Set B (Spiked Sample): The native matrix sample spiked with the analyte before any sample preparation steps (e.g., extraction), then diluted to the MRD. This measures the total analyte found.
- Set C (Reference Spike): A solution of the analyte in a pure solvent or a post-extraction blank matrix spiked with the analyte. This represents the 100% recovery control [76] [73] [74].
Spiking Concentration:
- Spike known amounts of the analyte into the matrix across a range of concentrations covering the intended working range of the method (e.g., low, medium, and high). The lowest spiked concentration should be at least two times the Limit of Quantitation (LOQ) of the assay [74].
Analysis:
- Analyze all sample sets (A, B, and C) using the analytical method under validation.
Data Calculation
The percentage recovery for each spiked level and each matrix lot is calculated as follows:
Recovery (%) = [(Found Concentration - Endogenous Concentration) / Spiked Concentration] × 100
Where:
- Found Concentration is the result from Set B.
- Endogenous Concentration is the result from Set A.
- Spiked Concentration is the known amount added to the matrix [74].
Table 1: Example of Recovery Data Calculation from an HCP ELISA
| Sample Type | Spike Concentration (ng/mL) | Total HCP Measured (ng/mL) | % Recovery |
|---|---|---|---|
| Final Product + Zero Standard | 0 | 6 | Not Applicable |
| Final Product + 100 ng/mL Standard | 20 | 25 | 95% [(25-6)/20] |
The overall accuracy of the method is then expressed as the mean recovery and the variability (e.g., %RSD) across all tested concentrations and matrix lots.
Validation Within the ICH Q2(R1) Framework
Spiked recovery studies are the primary tool for demonstrating the accuracy of an analytical procedure, a core validation parameter mandated by ICH Q2(R1) [4]. The guideline itself suggests assessing accuracy by spiking the analyte into a placebo or matrix, and it is considered "the remaining method" for checking accuracy when Certified Reference Materials (CRMs) or reference methods are unavailable [73].
Table 2: Key ICH Q2(R1) Validation Parameters and the Role of Recovery Studies
| Validation Parameter | Definition | Role of Recovery Studies |
|---|---|---|
| Accuracy | The closeness of agreement between the accepted reference value and the value found. | The primary experimental approach for establishing accuracy. |
| Precision | The closeness of agreement between a series of measurements. | Recovery studies conducted with multiple replicates provide data on the repeatability of the method. |
| Specificity | The ability to assess the analyte unequivocally in the presence of other components. | Low or variable recovery can indicate a lack of specificity due to matrix interference. |
| Linearity | The ability of the method to obtain results directly proportional to analyte concentration. | Recovery should be consistent across the validated range, supporting the demonstration of linearity of results. |
The workflow below illustrates how spiked recovery studies are integrated within a method validation framework and the decision-making process based on the results.
The Scientist's Toolkit: Research Reagent Solutions
Successful execution of a recovery study relies on critical materials and reagents. The following table details these essential components.
Table 3: Essential Research Reagents and Materials for Spiked Recovery Studies
| Item | Function & Importance |
|---|---|
| Analyte Reference Standard | A highly purified and well-characterized material of known identity and purity, used to prepare the spiking solutions. It serves as the benchmark for the "true value." |
| Blank Matrix | The analyte-free sample material (e.g., placebo formulation, processed sample). It should be representative of the actual test samples to accurately assess matrix effects. |
| Internal Standard (IS) | A structurally similar analog (e.g., deuterated) added to all samples. It compensates for variability in sample preparation and analysis, improving accuracy and precision [76] [75]. |
| Appropriate Solvents & Diluents | High-purity solvents used for preparing standard solutions and diluting samples. The diluent used for kit standards is often ideal for sample dilution to minimize interference [74]. |
| Matrix-Matched Calibrators | Standard solutions prepared in the blank matrix. They are used to construct the calibration curve and are essential for compensating for matrix effects in techniques like LC-MS/MS [75]. |
Troubleshooting Low Recovery in Pharmaceutical Matrices
Encountering low recovery is a common challenge during method development. Systematic investigation is required to identify and rectify the root cause.
- Confirm Chromatographic Separation: A large interfering peak adjacent to the analyte peak suggests inadequate separation or potential degradation. Modifying the chromatographic gradient, changing the column, or adjusting the mobile phase (e.g., adding formic acid or a weak base like ammonia) can improve separation and stability [75].
- Investigate Ion Suppression (for LC-MS): Ion suppression is a frequent cause of low recovery in mass spectrometry. Techniques to confirm and mitigate it include:
- Post-column Infusion: Infusing the analyte while injecting a blank matrix extract can visually reveal regions of ion suppression in the chromatogram [75].
- Standard Addition: Preparing calibration standards in the blank matrix can help identify and correct for suppression [75].
- Source Change: In some cases, switching from an Electrospray Ionization (ESI) to an Atmospheric Pressure Chemical Ionization (APCI) source can reduce matrix effects [75].
- Optimize Sample Preparation: Inefficient extraction or analyte adsorption can lead to significant losses. Potential solutions include:
- Alter Solvent Composition: Changing the extraction solvent or its pH can improve recovery [75].
- Reduce Sample Concentration: Counterintuitively, lowering the sample concentration can sometimes reduce matrix interference and improve both recovery and sensitivity [75].
- Use Silanized Glassware: Using low-adsorption, silanized vials and containers can prevent the analyte from sticking to surfaces [75].
Spiked recovery studies are a cornerstone of analytical method validation, providing the critical evidence required by ICH Q2(R1) to demonstrate accuracy. A well-designed study, which includes multiple matrix lots and concentration levels, not only fulfills regulatory expectations but also reveals the true robustness of a method in the face of real-world sample variability. For electrochemical and all analytical techniques, a thorough understanding and rigorous application of recovery principles ensure the generation of reliable data, which is fundamental to assuring the identity, safety, and quality of pharmaceutical products.
Determining Linearity Range, LOD, and LOQ for Quantitative Applications
Within the framework of ICH Q2(R1) guidelines, establishing the linearity range, Limit of Detection (LOD), and Limit of Quantitation (LOQ) is fundamental to demonstrating that an analytical procedure is suitable for its intended purpose, particularly for the quantitative analysis of pharmaceuticals [67] [4]. These parameters collectively define the working bounds of an analytical method, ensuring that results are both reliable and meaningful.
The linearity of an analytical procedure is its ability to obtain test results that are directly proportional to the concentration of the analyte in a given range [7] [18]. The LOD is the lowest amount of analyte in a sample that can be detected—but not necessarily quantified as an exact value—while the LOQ is the lowest concentration that can be quantitatively determined with suitable precision and accuracy [77] [7]. For electrochemical methods in pharmaceutical research, which are valued for their portability, low cost, and rapid analysis capabilities, rigorously determining these parameters according to a harmonized standard is critical for regulatory acceptance and ensuring data integrity [8].
This guide provides an in-depth technical overview of the concepts, experimental protocols, and calculations required to establish these key performance characteristics in compliance with ICH Q2(R1) principles.
Core Parameter Definitions and Regulatory Framework
The ICH Q2(R1) Guideline Context
The ICH Q2(R1) guideline, titled "Validation of Analytical Procedures: Text and Methodology," provides a harmonized framework for validating analytical procedures across regulatory regions [67] [4]. Its purpose is to demonstrate that a method is fit-for-purpose, ensuring the identity, potency, purity, and quality of drug substances and products [18]. For quantitative tests of active pharmaceutical ingredients (APIs), the guideline mandates the validation of key characteristics, including linearity, range, and the limits of detection and quantification [67] [7].
Defining the Key Parameters
- Linearity and Range: Linearity is the ability of a method to elicit test results that are directly, or through a well-defined mathematical transformation, proportional to analyte concentration. The range is the interval between the upper and lower concentrations of analyte for which it has been demonstrated that the analytical procedure has a suitable level of precision, accuracy, and linearity [7] [18]. For assay of APIs, a typical range is 80-120% of the target concentration [7].
- Limit of Detection (LOD): The LOD is the lowest concentration of an analyte that can be detected, but not necessarily quantified, under the stated experimental conditions. It represents a threshold for detection feasibility [77].
- Limit of Quantitation (LOQ): The LOQ is the lowest concentration of an analyte that can be quantified with acceptable precision (repeatability) and accuracy. It represents a reliable measurement threshold where predefined goals for bias and imprecision are met [77] [7].
The relationship between these parameters is hierarchical: the LOD is typically lower than the LOQ, and the LOQ serves as the lower endpoint of the validated range [77].
Experimental Protocols and Calculation Methods
Determining Linearity and Range
Experimental Protocol:
- Preparation of Standard Solutions: Prepare a minimum of five concentrations spanning the expected range of the analytical procedure [18]. For an API assay, this typically means concentrations from 80% to 120% of the test concentration [7].
- Analysis: Analyze each concentration level using the proposed analytical procedure (e.g., by measuring the electrochemical response in triplicate).
- Data Analysis: Plot the measured analytical response (e.g., peak current, voltage) against the nominal concentration of the analyte. Perform a linear regression analysis to obtain the slope, y-intercept, and coefficient of determination (r²).
Acceptance Criteria: A linear relationship is generally accepted with a correlation coefficient (r) of at least 0.995 [7]. The residuals (the differences between the observed and predicted values) should be randomly scattered, indicating no systematic bias in the model.
Determining LOD and LOQ
ICH Q2(R1) describes several approaches for determining LOD and LOQ. The following methods are most applicable to instrumental techniques like electrochemistry.
Calibration Curve Approach (Based on Standard Deviation of the Response and Slope)
This is a common and scientifically rigorous method that utilizes data from the linearity study or a dedicated low-concentration calibration curve [68] [78].
Experimental Protocol:
- Generate a Calibration Curve: As described in section 3.1, but with a focus on the lower end of the concentration range, near the suspected LOD/LOQ.
- Perform Regression Analysis: From the linear regression output, obtain the slope (S) of the calibration curve and an estimate of the standard deviation of the response (σ) [68].
- Calculation of σ: The standard deviation can be estimated in two key ways:
- Standard Error of the Regression (Residual Standard Deviation): This is the most straightforward method, often labeled as "Standard Error" or "Residual Standard Deviation" in statistical software output [68] [78].
- Standard Deviation of the Y-Intercept: This value can also be used as an estimate of σ [78].
Formulas:
The factor 3.3 for LOD is derived from the confidence level for detection and represents a 95% confidence that the signal is not from a blank sample [79].
Signal-to-Noise Ratio Approach
This approach is applicable to analytical procedures that exhibit baseline noise, such as chromatography or certain electrochemical techniques.
Experimental Protocol:
- Analyze Blank Sample: Inject or analyze a blank solution (containing all matrix components except the analyte) to establish the baseline noise level.
- Analyze Low-Concentration Sample: Compare the measured signal from a sample containing a low concentration of the analyte to the baseline noise.
- Calculate Ratio: The signal-to-noise (S/N) ratio is calculated by measuring the height of the analyte signal (H) and the amplitude of the baseline noise (h), typically S/N = 2H/h [68].
Acceptance Criteria:
- LOD: A typical S/N ratio of 2:1 or 3:1 is acceptable [68] [7].
- LOQ: A typical S/N ratio of 10:1 is required [7].
Experimental Workflow for Validation
The following diagram illustrates the logical workflow for establishing the linearity range, LOD, and LOQ.
Data Presentation and Analysis
Table 1: Comparison of LOD and LOQ Calculation Methods per ICH Q2(R1)
| Method | Basis | Key Formula | Experimental Requirement | Advantages / Limitations |
|---|---|---|---|---|
| Calibration Curve [68] [78] | Standard deviation of response (σ) and slope (S) | LOD = 3.3 σ / SLOQ = 10 σ / S | Calibration curve in low concentration range | Advantage: Scientifically rigorous, uses common regression data.Limitation: Requires linearity at low levels. |
| Signal-to-Noise [7] | Ratio of analyte signal to baseline noise | LOD: S/N ≥ 3LOQ: S/N ≥ 10 | Analysis of blank and low-concentration samples | Advantage: Simple, intuitive, ideal for chromatographic/electrochemical baselines.Limitation: Less suitable for methods with noiseless baselines. |
Key Reagent Solutions and Materials
Table 2: Essential Research Reagent Solutions for Validation Experiments
| Reagent / Material | Function in Validation | Key Considerations |
|---|---|---|
| Certified Reference Standard | Serves as the primary standard for preparing calibration solutions; critical for establishing accuracy and traceability. | Purity and certification must be well-documented. Must be stored under appropriate conditions to prevent degradation. |
| Supporting Electrolyte | In electrochemical methods, this provides ionic conductivity and controls the pH and ionic strength of the solution, directly impacting the analyte's response. | Must be of high purity to minimize background current (noise). Composition can affect method selectivity and robustness. |
| Blank Matrix | A sample containing all components except the analyte. Used to assess specificity, determine baseline noise, and estimate LOD/LOD. | For complex samples, obtaining a commutable, analyte-free matrix can be challenging [79]. |
| High-Purity Solvents & Reagents | Used for preparing all standard and sample solutions. | Impurities can contribute to high background signal, adversely affecting the S/N ratio and thus the LOD and LOD. |
Critical Considerations for Electrochemical Pharmaceutical Methods
Electrochemical methods present unique considerations for validation. The sample matrix can significantly influence the background signal (noise), making the selection of a proper blank critical for accurate LOD/LOQ determination [79]. For endogenous analytes (compounds naturally present in the sample matrix), obtaining a genuine blank is difficult, and alternative strategies, such as using a standard addition method or a surrogate matrix, may be required [79].
Furthermore, validation is not a one-time exercise. Revalidation is necessary if the analytical procedure is transferred to another laboratory, or if there are changes in the synthesis of the drug substance, composition of the finished product, or the analytical procedure itself [18].
Finally, it is crucial to note that calculated LOD and LOQ values are estimates that require experimental verification. This is typically done by preparing and analyzing multiple samples (e.g., n=6) at the calculated LOD and LOQ concentrations. The LOD should produce a detectable signal in most cases, while the LOQ should demonstrate acceptable precision (e.g., %RSD ≤ 15%) and accuracy (e.g., recovery within ±15%) [68] [7]. This empirical confirmation provides the definitive evidence that the method performs as intended at its operational limits.
Leveraging Validation Data for Regulatory Submissions and Method Transfer
In the pharmaceutical industry, analytical method validation is not merely a regulatory formality but a fundamental scientific requirement that provides documented evidence and a high degree of assurance that an analytical procedure consistently delivers accurate and reliable results [18]. The concept of an analytical method lifecycle has gained significant traction, encompassing stages from initial design and development through qualification, transfer, and ongoing performance verification [80]. Within this framework, properly generated and leveraged validation data serve as the cornerstone for both successful regulatory submissions and seamless method transfers between laboratories.
The International Council for Harmonisation (ICH) Q2(R1) guideline, "Validation of Analytical Procedures: Text and Methodology," provides the foundational framework for validating analytical methods, including electrochemical techniques used in pharmaceutical analysis [14]. This harmonized approach establishes standardized requirements for validation parameters, acceptance criteria, and documentation practices, ensuring that data generated in one laboratory can be reliably reproduced in another and trusted by regulatory agencies worldwide [18] [4]. As the industry evolves, the recent updates to ICH Q2(R2) and the introduction of ICH Q14 on analytical procedure development further emphasize a lifecycle approach and more flexible, science-based validation strategies, particularly important for addressing the complexities of modern biologic products [3].
This technical guide examines how researchers can strategically generate, interpret, and leverage validation data to streamline regulatory approvals and facilitate efficient method transfers, with specific emphasis on electrochemical pharmaceutical methods operating within the ICH Q2(R1) framework.
Core Validation Parameters and Acceptance Criteria Under ICH Q2(R1)
For an analytical method to be considered validated under ICH Q2(R1), it must demonstrate acceptable performance across several key parameters, each with predefined acceptance criteria justified based on the method's intended purpose [18] [4]. The validation characteristics required depend on the type of analytical procedure (identification, testing for impurities, or assay).
Table 1: Core Validation Parameters and Typical Acceptance Criteria Under ICH Q2(R1)
| Validation Parameter | Definition | Typical Acceptance Criteria | Application in Electrochemical Methods |
|---|---|---|---|
| Specificity | Ability to measure analyte accurately in the presence of other components | No interference from excipients, impurities, or matrix components | Demonstrated via voltammetric peaks separation in sample matrix [14] |
| Accuracy | Closeness of results to the true value | Recovery of 98-102% for API; 90-107% for impurities | Spiked recovery studies in pharmaceutical formulations [14] |
| Precision | Degree of scatter in repeated measurements | RSD ≤ 2% for assay; ≤ 5% for impurities | Repeated measurements of same sample solution [14] [4] |
| Repeatability | Precision under same operating conditions | RSD ≤ 1% for assay; ≤ 5-10% for impurities | Multiple injections/measurements of homogeneous sample [18] |
| Linearity | Ability to obtain results proportional to analyte concentration | R² ≥ 0.998 for API | Calibration curve across specified range [14] [54] |
| Range | Interval between upper and lower analyte concentrations | Dependent on method purpose and linearity | Typically 80-120% of test concentration for assay [18] |
| LOD/LOQ | Lowest detectable/quantifiable analyte | Signal-to-noise ratio 3:1 for LOD; 10:1 for LOQ | Established based on standard deviation of response and slope [14] |
| Robustness | Capacity to remain unaffected by small parameter variations | Consistent results with deliberate parameter changes | Small changes in pH, temperature, or electrolyte composition [14] |
The application of these parameters is illustrated in an electrochemical study for colchicine determination using a glassy carbon electrode, where validation demonstrated excellent linearity (R² = 0.9998) across the concentration range of 2.4-50 μg mL⁻¹, with a detection limit of 0.80 μg mL⁻¹ and successful application to tablet formulations without excipient interference [14].
Strategic Experimental Design for Comprehensive Method Validation
Establishing the Analytical Target Profile (ATP)
A strategic approach to method validation begins with defining an Analytical Target Profile (ATP) - a prospective summary of the required quality characteristics of an analytical procedure [80]. The ATP defines the method's intended purpose, performance requirements, and the criteria that must be met for successful validation. For electrochemical methods, this includes specifying the target concentration range, required precision, accuracy thresholds, and any matrix-specific challenges that must be addressed.
The ATP should be fit-for-purpose, meaning validation requirements may change as product development advances from early stages to commercialization [80]. In early development, validation may be simpler with broader acceptance criteria, while at the commercialization stage, full validation according to ICH Q2(R1) is required for inclusion in regulatory submissions [80].
Detailed Experimental Protocols for Key Validation Parameters
Specificity/Selectivity Assessment
Objective: To demonstrate that the method can unequivocally quantify the target analyte in the presence of other potentially interfering components such as excipients, degradation products, or matrix constituents.
Experimental Protocol:
- Prepare individual solutions of the active pharmaceutical ingredient (API), all excipients, and potential degradation products
- Analyze each solution separately using the electrochemical method
- Prepare a synthetic mixture containing the API and all excipients at expected concentration ratios
- Compare voltammetric peaks, retention times, or detection signals to confirm absence of interference
- For stability-indicating methods, perform forced degradation studies (acid/base hydrolysis, oxidation, thermal stress, photolysis) and demonstrate separation of degradation products from the main peak [14]
In the colchicine electrochemical analysis, specificity was confirmed by demonstrating no interference from tablet excipients at the detection potential of -862 mV vs. Ag/AgCl [14].
Linearity and Range Determination
Objective: To establish that the analytical procedure produces results that are directly proportional to analyte concentration within a specified range.
Experimental Protocol:
- Prepare a minimum of five concentration levels across the specified range [18]
- For electrochemical methods, analyze solutions from lowest to highest concentration
- Plot measured response (peak current, peak area) versus analyte concentration
- Calculate regression statistics using least-squares method: slope, intercept, and coefficient of determination (R²)
- Evaluate residual plots to confirm homoscedasticity
- The range should be established to provide suitable precision, accuracy, and linearity based on intended application [54]
Recent research proposes using double logarithm function linear fitting to better assess the proportionality between concentration and response, addressing limitations of traditional R² evaluation [54].
Accuracy and Precision Evaluation
Objective: To demonstrate that the method produces results close to the true value (accuracy) with acceptable variability (precision).
Experimental Protocol for Accuracy:
- Prepare a placebo mixture containing all excipients but no API
- Spike with known quantities of API at three concentration levels (80%, 100%, 120% of target)
- Analyze each sample in triplicate using the validated method
- Calculate percent recovery for each concentration: (Measured Concentration/Theoretical Concentration) × 100
- Meet acceptance criteria of 98-102% recovery for API assays [4]
Experimental Protocol for Precision:
- Repeatability: Analyze six independent preparations at 100% of test concentration by same analyst, same equipment, same day [18]
- Intermediate Precision: Different analysts, different days, different equipment using same samples to evaluate inter-laboratory variability
- Calculate relative standard deviation (RSD%) for each precision study
Table 2: Research Reagent Solutions for Electrochemical Method Validation
| Reagent/Material | Function in Validation | Quality/Standard Requirements |
|---|---|---|
| Primary Reference Standard | Quantification and calibration | Certified purity with documentation of source and characterization |
| Working Electrode | Signal generation | Defined material and surface preparation (e.g., glassy carbon, polished to specific micron size) |
| Supporting Electrolyte | Provide conductive medium | High-purity salts and acids (e.g., HClO₄/H₃PO₄ for colchicine determination) [14] |
| Pharmaceutical Placebo | Specificity and accuracy assessment | Contains all excipients except API, representative of final formulation |
| Forced Degradation Samples | Specificity demonstration | Samples subjected to controlled stress conditions (acid, base, oxidation, heat, light) |
| System Suitability Standard | Verify system performance | Reference solution with known response characteristics |
Method Transfer Strategies and Documentation
Selecting the Appropriate Transfer Approach
Analytical method transfer is a documented process that qualifies a receiving laboratory to use an analytical procedure developed at a transferring laboratory [81]. The selection of transfer approach should be based on method complexity, regulatory status, and risk assessment [80].
Table 3: Analytical Method Transfer Approaches and Applications
| Transfer Approach | Description | Best Suited For | Key Considerations |
|---|---|---|---|
| Comparative Testing | Both labs analyze same samples; results statistically compared | Established, validated methods; similar lab capabilities | Requires careful sample preparation, robust statistical analysis [81] [80] |
| Co-validation | Method validated simultaneously by both laboratories | New methods; methods developed for multi-site use | High collaboration, harmonized protocols, shared responsibilities [81] [80] |
| Revalidation | Receiving lab performs full/partial revalidation | Significant differences in lab conditions/equipment; method changes | Most rigorous, resource-intensive; full validation protocol needed [81] |
| Transfer Waiver | Transfer process formally waived based on justification | Highly experienced receiving lab; identical conditions; simple methods | Rare, high regulatory scrutiny; requires strong scientific justification [81] |
Critical Success Factors for Method Transfer
Successful method transfer requires meticulous planning and execution of several key elements:
- Comprehensive Transfer Protocol: A detailed document outlining scope, responsibilities, materials, equipment, experimental design, acceptance criteria, and statistical evaluation plan [81]
- Robust Communication: Dedicated teams, regular meetings, and effective knowledge transfer between sites [81]
- Equipment Qualification: Verification that equipment at receiving lab is comparable and properly qualified [81]
- Personnel Training: Receiving laboratory analysts must demonstrate proficiency with the method [81]
- Sample Management: Use of homogeneous, representative, and well-characterized samples for comparative testing [80]
Leveraging Validation Data for Regulatory Submissions
Building the Regulatory Evidence Package
Validation data serves as the scientific foundation for regulatory submissions, demonstrating that the analytical method is fit-for-purpose and capable of reliably measuring the critical quality attributes it claims to measure. The regulatory evidence package should include:
- Complete Validation Report: Comprehensive documentation of all validation studies conducted, including protocol, raw data, statistical analysis, and conclusions [3]
- Justification of Acceptance Criteria: Scientific rationale for the specific acceptance criteria applied to each validation parameter [4]
- System Suitability Data: Evidence that the analytical system is performing appropriately at the time of analysis [4]
- Method Robustness Data: Demonstration that the method remains unaffected by small, deliberate variations in method parameters [3]
- Comparative Data (if applicable): For method transfers, statistical comparison of results between transferring and receiving laboratories [81] [80]
Addressing Common Regulatory Scrutiny Areas
Regulatory agencies increasingly focus on several key areas during review of analytical methods:
- Data Integrity: Complete and accurate documentation with appropriate audit trails [3] [4]
- Risk-Based Approach: Justification of validation strategy based on method criticality and product stage [80]
- Lifecycle Management: Evidence of ongoing method performance monitoring and control [3] [80]
- Statistical Rigor: Appropriate statistical methods for data evaluation with predefined acceptance criteria [3] [54]
For electrochemical methods, particular emphasis should be placed on specificity documentation in complex matrices and robustness data addressing potential variations in electrode performance, electrolyte composition, and instrumental parameters [14].
The successful leverage of validation data for regulatory submissions and method transfer requires a strategic, integrated approach that begins during method development and continues throughout the analytical method lifecycle. By understanding regulatory requirements, designing comprehensive validation studies, selecting appropriate transfer strategies, and maintaining meticulous documentation, pharmaceutical scientists can ensure that their electrochemical methods will withstand regulatory scrutiny and perform reliably across multiple laboratories.
The evolving regulatory landscape, with the transition from ICH Q2(R1) to Q2(R2) and the introduction of ICH Q14, emphasizes lifecycle management, enhanced method development, and risk-based approaches [3]. Embracing these principles while maintaining the rigorous validation standards of ICH Q2(R1) positions pharmaceutical companies for successful regulatory submissions and efficient technology transfers, ultimately accelerating patient access to safe and effective medicines.
Conclusion
The successful application of the ICH Q2(R1) guideline to electrochemical methods establishes a robust foundation for reliable pharmaceutical analysis, ensuring data integrity and regulatory compliance. By systematically addressing foundational principles, practical implementation, troubleshooting, and validation, electrochemical techniques emerge as viable, cost-effective alternatives to traditional methods for drug quantification. Future directions point toward integration with emerging technologies such as paper-based electrochemical devices and wearable sensors, potentially revolutionizing point-of-care therapeutic drug monitoring and enabling sustainable quality control practices in the pharmaceutical industry.
References
- 1. Q2(R1) Validation of Analytical Procedures: Text and ... [https://www.fda.gov/regulatory-information/search-fda-guidance-documents/q2r1-validation-analytical-procedures-text-and-methodology-guidance-industry]
- 2. ICH Q2(R1) Validation of Analytical Procedures [https://www.gmp-compliance.org/guidelines/gmp-guideline/ich-q2r1-validation-of-analytical-procedures-text-and-methodology]
- 3. Navigating the Biopharmaceutical Method Validation [https://synergbiopharma.com/navigating-the-evolution-from-ich-q2r1-to-ich-q2r2-and-implementation-of-ich-q14-in-biopharmaceutical-method-validation/]
- 4. ICH Guidelines for Analytical Method Validation Explained [https://amsbiopharma.com/ich-guidelines-analytical-method/]
- 5. ICH Q2 Analytical Method Validation | PPTX [https://www.slideshare.net/slideshow/ich-q2-analytical-method-validation/68242229]
- 6. ICH Expands on Analytical Methods Validation in Draft - Q2 ... [https://www.enzyme.com/blog/ich-expands-on-analytical-methods-validation-in-draft/]
- 7. Key ICH Method Validation Parameters to Know [https://altabrisagroup.com/ich-method-validation-parameters/]
- 8. Recent advances in electrochemical paper-based ... [https://www.sciencedirect.com/science/article/pii/S0013468625014446]
- 9. December 2024 [https://www.core-reference.org/news-summaries/december-2024/]
- 10. ICH Q2 (R2) Validation of Analytical Procedures [https://www.mastercontrol.com/glossary-page/ich-q2-validation-analytical-procedures/]
- 11. ICH and FDA Guidelines for Analytical Method Validation [https://www.labmanager.com/ich-and-fda-guidelines-for-analytical-method-validation-34252]
- 12. 11: Electrochemical Methods [https://chem.libretexts.org/Bookshelves/Analytical_Chemistry/Analytical_Chemistry_2.1_(Harvey)/11%3A_Electrochemical_Methods]
- 13. Key Electrochemical Techniques Every Researcher Should ... [https://www.msesupplies.com/blogs/news/key-electrochemical-techniques-every-researcher-should-know?srsltid=AfmBOopnjJBxRIHm2cATBLbjOr0xsXAu8jyE0Jqia4BhC-SU1jdn7PDQ]
- 14. Method validation in quantitative electrochemical analysis ... [https://link.springer.com/article/10.2478/s11532-007-0034-8]
- 15. Methods and Protocols for Reliable Electrochemical ... [https://pmc.ncbi.nlm.nih.gov/articles/PMC6854841/]
- 16. Electrochemical Method - an overview [https://www.sciencedirect.com/topics/engineering/electrochemical-method]
- 17. (PDF) ich harmonised tripartite guideline validation of analytical... [https://www.academia.edu/34386868/ICH_HARMONISED_TRIPARTITE_GUIDELINE_VALIDATION_OF_ANALYTICAL_PROCEDURES_TEXT_AND_METHODOLOGY_Q2_R1]
- 18. A holistic perspective on analytical method validation ... [https://ajbps.org/a-holistic-perspective-on-analytical-method-validation-under-international-council-for-harmonisation-q2r1]
- 19. of a method evaluating T cell metabolic potential in... Validation [https://pmc.ncbi.nlm.nih.gov/articles/PMC7789274/]
- 20. How to perform linearity during method validation ? [https://www.linkedin.com/pulse/how-perform-linearity-during-method-validation-bhaskar-napte]
- 21. About small values with huge influence - Sum Of Squares - part 1 [https://mpl.loesungsfabrik.de/en/english-blog/method-validation/sum-of-quares-part1]
- 22. What is meant by the limit of detection and quantification (LOD ... [https://mpl.loesungsfabrik.de/en/english-blog/method-validation/limit-of-detection-quantifcation]
- 23. The Limit of Detection | LCGC International [https://www.chromatographyonline.com/view/limit-detection]
- 24. Challenges in Analytical Method Development and ... [https://www.biopharminternational.com/view/challenges-analytical-method-development-and-validation]
- 25. Good Laboratory Practice (GLP): A Validation Approach [https://mmsholdings.com/perspectives/glp-validation-process/]
- 26. How Equipment Validation Supports GMP Compliance [https://www.ellab.com/blog/ensuring-quality-how-equipment-validation-supports-gmp-compliance/]
- 27. Recent Developments in Single-Entity Electrochemistry - PMC [https://pmc.ncbi.nlm.nih.gov/articles/PMC11112546/]
- 28. Challenges of Analytical Validation for ATMPs [https://www.americanpharmaceuticalreview.com/Featured-Articles/607964-Challenges-of-Analytical-Validation-for-ATMPs/]
- 29. Electroanalysis Advances in Pharmaceutical Sciences [https://www.mdpi.com/2673-4532/6/2/12]
- 30. Electrochemical Analysis Methods: Potentiometry, ... [https://www.labmanager.com/electrochemical-analysis-methods-potentiometry-voltammetry-and-more-34242]
- 31. Comparison of potentiometric “Electronic Tongue” with ... [https://www.sciencedirect.com/science/article/abs/pii/S0731708520313431]
- 32. 11.4: Voltammetric and Amperometric Methods [https://chem.libretexts.org/Bookshelves/Analytical_Chemistry/Analytical_Chemistry_2.1_(Harvey)/11%3A_Electrochemical_Methods/11.04%3A_Voltammetric_and_Amperometric_Methods]
- 33. Editorial: Recent advances in pharmaceutical analysis [https://pmc.ncbi.nlm.nih.gov/articles/PMC12491238/]
- 34. Electrochemical Systems Optimization → Term [https://energy.sustainability-directory.com/term/electrochemical-systems-optimization/]
- 35. Electrochemical Behavior and Direct Quantitative ... [https://pmc.ncbi.nlm.nih.gov/articles/PMC9090486/]
- 36. Optimization and scaling-up of porous solid electrolyte ... [https://www.nature.com/articles/s41467-025-58385-2]
- 37. An Electrochemical Aptasensor Based on Azophloxine ... [https://www.gavinpublishers.com/article/view/an-electrochemical-aptasensor-based-on-azophloxine-graphene-gold-nanoparticles-composite-for-sensitive-detection-of-atp]
- 38. Real-time electrochemical monitoring of ATP in the ... [https://pmc.ncbi.nlm.nih.gov/articles/PMC3839532/]
- 39. Electrochemistry and voltammetric determination of ... [https://www.sciencedirect.com/science/article/abs/pii/S1567539405000940]
- 40. Determination of Colchicine in Pharmaceutical Formulations ... [https://pmc.ncbi.nlm.nih.gov/articles/PMC9268838/]
- 41. Electrochemical Determination of the Drug Colchicine in ... [https://pmc.ncbi.nlm.nih.gov/articles/PMC10385993/]
- 42. System Suitability Testing: Ensuring Reliable Results [https://www.labmanager.com/system-suitability-testing-ensuring-reliable-results-34248]
- 43. What Is System Suitability in Method Validation? [https://altabrisagroup.com/system-suitability-in-method-validation/]
- 44. Understanding the different effects of fouling mechanisms ... [https://pubs.rsc.org/en/content/articlelanding/2024/an/d3an02205f]
- 45. Recent strategies to minimise fouling in electrochemical .. ... [https://www.degruyterbrill.com/document/doi/10.1515/revac-2015-0008/html?lang=en&srsltid=AfmBOoq95CyValKG4ptdomArpx2ZU_3XPRKK8XFaLh3y0Sr8pTJqyFUf]
- 46. Electrochemical Determination of 17-β-Estradiol Using a ... [https://pmc.ncbi.nlm.nih.gov/articles/PMC10489867/]
- 47. Electrochemical surface modification and regeneration of ... [https://www.sciencedirect.com/science/article/pii/S1872204025000416]
- 48. Advances in formulation and manufacturing strategies for ... [https://www.sciencedirect.com/science/article/pii/S0928098723000052]
- 49. Formulation Strategies to Improve the Stability and ... [https://pmc.ncbi.nlm.nih.gov/articles/PMC9611293/]
- 50. Mesoporous Silica Microparticle Tablets for Optimised ... [https://www.frontierspartnerships.org/journals/british-journal-of-biomedical-science/articles/10.3389/bjbs.2025.14985/full]
- 51. The Strategic Role of Excipients in Drug Delivery [https://www.colorcon.com/education-insights/enhancing-bioavailability-the-strategic-role-of-excipients-in-drug-delivery]
- 52. A guideline for reporting experimental protocols in life sciences [https://pmc.ncbi.nlm.nih.gov/articles/PMC5978404/]
- 53. A proposed limit test for p-chloroaniline impurity in ... [https://www.nature.com/articles/s41598-025-24786-y]
- 54. A linear validation method of analytical procedures based ... [https://www.sciencedirect.com/science/article/abs/pii/S0003267024004963]
- 55. Measurements with noise: Bayesian optimization for co- ... [https://pubs.rsc.org/en/content/articlelanding/2025/dd/d4dd00391h]
- 56. Methods for Estimating the Detection and Quantification ... [https://www.mdpi.com/1424-8220/24/11/3520]
- 57. Practical signal-to-noise ratio mapping using single clinical ... [https://pubmed.ncbi.nlm.nih.gov/40736937/]
- 58. emphasizing green, white, and blue analytical approaches [https://www.nature.com/articles/s41598-024-69518-w]
- 59. Development and validation of a RP-HPLC method for ... [https://www.nature.com/articles/s41598-025-09904-0]
- 60. Guidelines on the proper selection of greenness and ... [https://www.sciencedirect.com/science/article/abs/pii/S0003267025004465]
- 61. Method Validation and Robustness | LCGC International [https://www.chromatographyonline.com/view/method-validation-and-robustness]
- 62. Key Validation Characteristics in ICH Q2 [https://altabrisagroup.com/validation-characteristics-ich-q2/]
- 63. Journal of Chromatography A [https://www.sciencedirect.com/science/article/abs/pii/S0021967311018255]
- 64. Systematical approach in evaluation of LC method for ... [https://pmc.ncbi.nlm.nih.gov/articles/PMC5760941/]
- 65. Temperature can affect pH measurements. Here's how to ... [https://insights.globalspec.com/article/23488/temperature-can-affect-ph-measurements-here-s-how-to-compensate]
- 66. Method categories according to the ICH Q2(R1) - Lösungsfabrik [https://mpl.loesungsfabrik.de/en/english-blog/method-validation/method-categories]
- 67. ICH Guidance; Validation of Analytical Procedures: Text ... [https://jordilabs.com/lab-testing/regulatory/ich-q2-r1/]
- 68. Chromatographic Measurements, Part 5: Determining LOD and LOQ... [https://www.sepscience.com/hplc-solutions-126-chromatographic-measurements-part-5-determining-lod-and-loq-based-on-the-calibration-curve-6959]
- 69. Comparison of Chromatographic and Electrochemical ... [https://www.mdpi.com/2076-3417/15/10/5504]
- 70. Electrochemical and chromatographic methods for the ... [https://www.sciencedirect.com/science/article/abs/pii/S0308814624041414]
- 71. Comparison of colorimetric, spectroscopic and ... [https://pmc.ncbi.nlm.nih.gov/articles/PMC10910492/]
- 72. Comparison of Chromatographic and Electrochemical ... [https://doaj.org/article/db19940538e7481ea9ad58ef7741b017]
- 73. Intra-laboratory testing of method accuracy from recovery ... [https://www.sciencedirect.com/science/article/abs/pii/S0039914098002719]
- 74. Spike and Recovery: How to Generate Reliable Data [https://www.cygnustechnologies.com/generating-spike-recovery-analysis-data?srsltid=AfmBOor-ow2ul-HrTeSBL-OreGT1VyPFKiPkAZXmuGnpew1wLPAoH4YP]
- 75. Low recovery factor & Validation Issue [https://nitrosamines.usp.org/t/low-recovery-factor-validation-issue/13549]
- 76. Systematic Assessment of Matrix Effect, Recovery, and ... [https://pmc.ncbi.nlm.nih.gov/articles/PMC12613129/]
- 77. Limit of Blank, Limit of Detection and Limit of Quantitation [https://pmc.ncbi.nlm.nih.gov/articles/PMC2556583/]
- 78. How to determine the LOD using the calibration curve? [https://mpl.loesungsfabrik.de/en/english-blog/method-validation/calibration-line-procedure]
- 79. A tutorial for computing limits of detection and ... [https://www.sciencedirect.com/science/article/abs/pii/S0003267021011685]
- 80. Points to Consider in Quality Control Method Validation ... [https://www.bioprocessintl.com/qa-qc/points-to-consider-in-quality-control-method-validation-and-transfer]
- 81. Analytical Method Transfer: Best Practices and Guidelines [https://www.labmanager.com/analytical-method-transfer-best-practices-and-guidelines-34130]