Potentiometry vs Voltammetry: A Comprehensive Sensitivity Comparison for Biomedical Analysis
This article provides a systematic comparison of sensitivity between potentiometry and voltammetry, two cornerstone electrochemical techniques in biomedical and pharmaceutical research.
Potentiometry vs Voltammetry: A Comprehensive Sensitivity Comparison for Biomedical Analysis
Abstract
This article provides a systematic comparison of sensitivity between potentiometry and voltammetry, two cornerstone electrochemical techniques in biomedical and pharmaceutical research. We explore their fundamental principles, operational mechanisms, and key sensitivity determinants through foundational theory and current methodological applications. The analysis covers practical implementation strategies, troubleshooting approaches for sensitivity enhancement, and validation protocols for reliable analytical results. Designed for researchers and drug development professionals, this review synthesizes recent advances including novel materials, miniaturized systems, and emerging trends to guide optimal technique selection for specific sensitivity requirements in clinical diagnostics and therapeutic monitoring.
Core Principles: Understanding the Fundamental Sensitivity Mechanisms
Sensitivity is a paramount figure of merit in analytical chemistry, critically determining the applicability and reliability of any technique. In electrochemical methods, sensitivity is rigorously defined as the slope of the calibration curve, representing the change in output signal per unit change in analyte concentration [1]. This fundamental parameter, however, manifests differently across electrochemical techniques due to their distinct operational principles and signal generation mechanisms.
This guide provides a objective comparison between two cornerstone electrochemical methods—potentiometry and voltammetry—focusing on their sensitivity characteristics within the context of trace analysis. The discussion is framed around experimental data and fundamental principles to equip researchers and drug development professionals with the information necessary to select the optimal technique for their specific analytical challenges.
Fundamental Principles and Operational Modes
At their core, electrochemical techniques measure electrical properties arising from redox reactions. Potentiometry is a zero-current technique that measures the potential difference between two electrodes (a working indicator electrode and a reference electrode) under conditions of equilibrium, where the measured potential relates to analyte activity via the Nernst equation [2] [3]. In contrast, voltammetry is a dynamic technique that applies a controlled potential profile to a working electrode and measures the resulting current generated by the oxidation or reduction of analytes [4] [3]. This fundamental difference in the measured signal (potential vs. current) directly influences how sensitivity is defined, quantified, and achieved in each method.
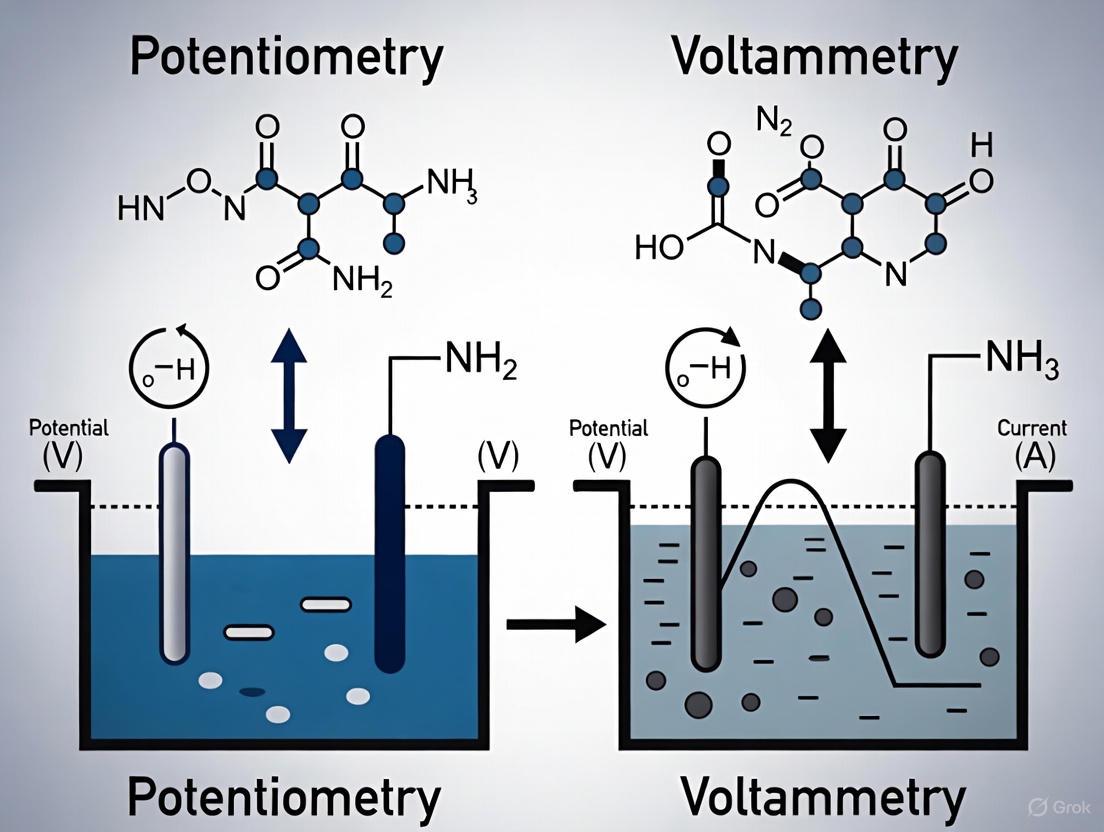
The following diagram illustrates the core operational workflows and logical relationships for each technique, highlighting their contrasting approaches to signal measurement.
Comparative Sensitivity Performance Data
The theoretical basis for sensitivity translates into practical performance, which can be quantitatively compared using key analytical figures of merit. The following table summarizes experimental data from direct comparisons and recent sensor studies, highlighting the typical working ranges and detection capabilities of advanced potentiometric and voltammetric sensors.
Table 1: Comparative Analytical Performance of Potentiometry and Voltammetry
| Analyte | Method | Specific Technique / Sensor | Linear Range (M) | Reported Detection Limit (M) | Sensitivity | Key Reference |
|---|---|---|---|---|---|---|
| Cadmium (Cd²⁺) | Potentiometry | Solid-contact Cd²⁺-ISE | Not Specified | ( 2.0 \times 10^{-10} ) | Not Specified | [5] |
| Lead (Pb²⁺) | Potentiometry | Solid-contact Pb²⁺-ISE | Not Specified | ( 2.0 \times 10^{-9} ) | Not Specified | [5] |
| Nitrite (NO²⁻) | Voltammetry | AuNRs/MWCNT/PEDOT:PSS/GCE | ( 2.0 \times 10^{-7} ) to ( 1.0 \times 10^{-4} ) | ( 8.0 \times 10^{-8} ) | 0.0634 μA μM⁻¹ cm⁻² | [1] |
| Nitrite (NO²⁻) | Voltammetry | AuNRs/ErGO/PEDOT:PSS/GCE | ( 8.0 \times 10^{-7} ) to ( 1.0 \times 10^{-4} ) | ( 2.0 \times 10^{-7} ) | 0.0451 μA μM⁻¹ cm⁻² | [1] |
Interpretation of Performance Data
The data in Table 1 reveals that both modern potentiometry and voltammetry are capable of achieving detection limits in the nanomolar range or lower, making them suitable for trace analysis [5] [1]. The sensitivity in voltammetry is often reported as a direct quantitative value (e.g., μA μM⁻¹ cm⁻²), reflecting the slope of the current-versus-concentration plot [1]. In potentiometry, while a "sensitivity" value is less commonly stated in the same way, the lower detection limit serves as a key performance metric, demonstrating its ability to respond to minute changes in analyte activity at trace levels [5].
Experimental Protocols for Direct Comparison
A direct, side-by-side comparison of potentiometry and anodic stripping voltammetry (ASV) for measuring cadmium and lead offers the most insightful data for sensitivity assessment [5]. The following protocols detail the key methodologies from such a study.
Potentiometric Measurements for Cadmium and Lead
- Electrode Preparation: The solid-contact ion-selective microelectrodes (ISEs) are prepared using specialized ionophores. The Cd²⁺-ISE membrane incorporates ETH 5435 ionophore, while the Pb²⁺-ISE uses Lead Ionophore IV. The membrane components are dissolved in dichloromethane and degassed with N₂ before coating the microelectrodes [5].
- Conditioning Protocol: The fabricated Cd²⁺-ISE is conditioned sequentially in ( 10^{-3} ) M Cd(NO₃)₂ and then in ( 10^{-9} ) M Cd(NO₃)₂ containing ( 10^{-3} ) M Ca(NO₃)₂ (one day each). The Pb²⁺-ISE is conditioned in ( 10^{-3} ) M Pb(NO₃)₂ and subsequently in ( 10^{-9} ) M Pb(NO₃)₂ containing ( 10^{-4} ) M HNO₃ (one day each). This conditioning is critical for achieving low detection limits [5].
- Measurement: Potentiometric measurements are performed at room temperature (22°C) in a 100 mL sample using a high-impedance interface and a data acquisition board, with a commercial double-junction reference electrode completing the circuit [5].
Anodic Stripping Voltammetric (ASV) Measurements
- Electrode System: A three-electrode system is used, comprising a bismuth-coated glassy carbon (GC) working electrode, a platinum wire counter electrode, and a Ag/AgCl reference electrode [5].
- Electrode Preparation (Bismuth Film Deposition): The GC electrode is meticulously polished with alumina slurry, rinsed, and ultrasonically cleaned. The bismuth film is pre-plated by immersing the electrode in a solution containing 100 ppm Bismuth in 0.1 M acetate buffer (pH 4.6) and applying a deposition potential of -0.6 V for 10 minutes with slow stirring [5].
- Measurement Protocol: Analysis is performed in an acetate buffer medium. The method involves a preconcentration step where a deposition potential is applied for 5 minutes with stirring (-0.9 V for Pb, -1.2 V for Cd). This is followed by a square-wave voltammetric scan in a quiescent solution, which strips the deposited metals back into solution, generating the analytical current signal [5].
Critical Comparison: Selectivity and Practical Considerations
While sensitivity is crucial, the practical utility of an analytical method is equally dependent on its selectivity. A key finding from direct comparative studies is that potentiometric ISEs can offer higher selectivity in the presence of excess interfering metal ions like thallium, indium, and tin, which are common interferents in ASV operations [5].
The selectivity of an ISE is quantified by its potentiometric selectivity coefficient (( K_{A,B}^{pot} )). For instance, the Cd²⁺-ISE demonstrated logarithmic selectivity coefficients of -4.8 for In³⁺ and -5.2 for Tl⁺, while the Pb²⁺-ISE showed a value of -5.8 for Sn²⁺, indicating a strong preference for the primary ion over the interferent [5]. In voltammetry, overlapping stripping peaks from different metals can pose significant analytical challenges, requiring careful optimization of the waveform and potential control to resolve signals.
The following diagram outlines the logical decision-making process for selecting the appropriate technique based on analytical goals and sample matrix.
The Scientist's Toolkit: Essential Research Reagents and Materials
The performance of both potentiometric and voltammetric sensors is heavily dependent on the materials used in their construction. The table below lists key reagents and their functions based on the protocols discussed.
Table 2: Key Research Reagents and Materials for Electrochemical Sensors
| Reagent/Material | Function | Example Application |
|---|---|---|
| Ionophores (e.g., ETH 5435, Lead Ionophore IV) | Selective binding of target ions in the membrane phase. | Potentiometric ISEs for Cd²⁺ and Pb²⁺ [5]. |
| Lipophilic Ionic Additives (e.g., NaTFPB) | Balances charge in the sensing membrane, improves selectivity, and lowers detection limit. | Potentiometric ISEs [5]. |
| Copolymer Matrices (e.g., MMA-DMA) | Forms the polymeric membrane backbone; reduces ion fluxes to achieve lower detection limits. | Solid-contact ISEs [5]. |
| Bismuth (Bi) | Non-toxic "green" alternative to mercury for forming films on electrodes for metal preconcentration. | Bismuth-film working electrode for ASV [5]. |
| Gold Nanorods (AuNRs) | Nanostructured material providing high surface area, good biocompatibility, and fast electron transfer. | Voltammetric nitrite sensor [1]. |
| Carbon Nanomaterials (MWCNTs, ErGO) | Enhance electrode conductivity and surface area; improve electrocatalytic activity and sensitivity. | Composites in voltammetric sensors [1]. |
| Conductive Polymers (e.g., PEDOT:PSS) | Increases electrode conductivity and can contribute to selectivity; used to composite with nanomaterials. | Electrode modifier in voltammetric sensors [1]. |
The choice between potentiometry and voltammetry for achieving optimal sensitivity is not a matter of one technique being universally superior. Instead, it requires a careful consideration of the analytical problem. Modern potentiometry excels in applications demanding high selectivity and low detection limits for specific ions in complex matrices without the need for a preconcentration step. Conversely, voltammetry offers powerful multi-analyte capability and exceptionally low detection limits, particularly when coupled with stripping techniques, and provides valuable insights into reaction mechanisms. The most robust analytical strategy may involve leveraging these techniques in parallel or developing hybrid systems to exploit their complementary strengths, thereby providing a more comprehensive analytical solution for demanding fields like drug development and environmental monitoring [5].
Potentiometric sensing is a cornerstone electrochemical technique that measures the potential difference (voltage) between two electrodes under conditions of zero or negligible current flow. This fundamental principle distinguishes it from other electrochemical methods, such as voltammetry and amperometry, which involve applying potentials and measuring resulting currents. As a potentiometric sensor operates without drawing significant current, the measurement is non-destructive and does not alter the chemical composition of the sample solution, making it exceptionally valuable for continuous monitoring and analysis of delicate biological systems [6] [7]. The core of this technique relies on the Nernst equation, which provides a quantitative relationship between the measured potential and the activity (concentration) of the target ion. Modern potentiometric sensors have evolved into sophisticated devices, including solid-contact ion-selective electrodes (SC-ISEs) and wearable formats, finding expansive applications in clinical diagnostics, environmental monitoring, and pharmaceutical analysis [8].
This guide objectively compares the performance of potentiometric sensing with its primary alternative, voltammetric sensing, focusing on their fundamental operational principles, sensitivity, and suitability for different analytical scenarios, particularly in the context of drug development and biomedical research.
Theoretical Foundation: The Nernst Equation
The Nernst equation is the fundamental theoretical framework that governs potentiometric sensing. It describes the relationship between the electromotive force (EMF) of an electrochemical cell and the activities of the ions involved in the cell reaction [6]. For a general electrode reaction for a cation, ( M^{n+} + ne^- \rightleftharpoons M ), the Nernst equation is expressed as:
[ E = E^0 - \frac{RT}{nF} \ln\left(\frac{1}{a{M^{n+}}}\right) = E^0 + \frac{2.303 RT}{nF} \log(a{M^{n+}}) ]
Variables of the Nernst Equation:
- ( E ): The measured electrode potential (in Volts, V)
- ( E^0 ): The standard electrode potential for the ion-selective system (V)
- ( R ): The universal gas constant (8.31439 J·mol⁻¹·K⁻¹)
- ( T ): The absolute temperature in Kelvin (K)
- ( n ): The charge number of the ion
- ( F ): The Faraday constant (96495.7 C·mol⁻¹)
- ( a_{M^{n+}} ): The activity of the target ion ( M^{n+} ) [6]
At a standard temperature of 25°C (298.15 K), the term ( \frac{2.303 RT}{F} ) simplifies to approximately 0.05916 V. Thus, for a monovalent ion (n=1), the potential changes by about 59.16 mV for every tenfold change in ion activity. For a divalent ion (n=2), the change is approximately 29.58 mV per decade [6]. This logarithmic relationship is the reason why potentiometric sensors can exhibit a very wide dynamic range, often spanning several orders of magnitude of concentration.
The following diagram illustrates the fundamental components and the working logic of a potentiometric sensor based on the Nernst equation.
Potentiometric vs. Voltammetric Sensing: A Performance Comparison
The choice between potentiometric and voltammetric sensing depends heavily on the specific analytical requirements. The table below summarizes a direct comparison of their core characteristics, drawing on experimental data from dopamine sensing studies as a representative model [9].
Table 1: Performance comparison between potentiometric and voltammetric sensing for analyte detection.
| Feature | Potentiometric Sensing | Voltammetric Sensing |
|---|---|---|
| Measured Signal | Potential (Voltage) | Current |
| Current Flow | Zero or negligible (non-faradaic) | Significant (faradaic) |
| Analyte Consumption | Virtually zero | Yes (oxidation/reduction) |
| Theoretical Basis | Nernst Equation | Cottrell, Randles-Sevcik Equations |
| Selectivity Mechanism | Ionophore-mediated recognition | Applied potential & surface catalysis |
| Detection Limit (Dopamine) | Requires highly selective ionophore [9] | Down to 10⁻⁹ M or lower [9] |
| Small Sample Volume Suitability | Excellent (no analyte depletion) [9] | Challenged by analyte consumption & diffusion [9] |
| Key Advantage | No analyte consumption; intrinsic selectivity for cations over anions [9] | Very low detection limits; catalytic signal amplification [9] |
| Key Limitation | Requires highly selective ionophores for many analytes [9] | Diffusion-limited; requires stirring for optimal performance [9] |
As evidenced by the data, potentiometric sensing holds an intrinsic advantage in applications where sample preservation is critical or where the analyte is a cation and common interferences are anions [9]. For instance, in dopamine sensing, the primary interferents, ascorbic acid, and uric acid, are anionic and do not significantly interfere with cationic potentiometric sensors. In contrast, voltammetry excels when ultra-low detection limits are required, achieved by measuring the current from the electrochemical oxidation or reduction of the analyte itself [9].
Experimental Protocols for Potentiometric Sensing
The development and application of a potentiometric sensor involve a series of methodical experimental steps. The following workflow and detailed protocol are synthesized from multiple sensor development studies [10] [11].
Detailed Protocol: Fabrication and Calibration of a Solid-Contact Ion-Selective Electrode (SC-ISE)
The following protocol is typical for creating a coated graphite or carbon paste electrode, as used for the detection of ions like Pb²⁺ and Cu²⁺ [10] [11].
Sensor Fabrication:
- Membrane Preparation: Combine the key components in a mortar or via dissolution: Ionophore (e.g., 1-6% by weight), Polymeric matrix (e.g., PVC, 32%), Plasticizer (e.g., Nitrobenzene or o-NPOE, 40-65%), and a Lipophilic additive (e.g., NaTPB, 2%). The exact composition is optimized for each sensor [10] [11].
- Electrode Assembly: For a coated graphite electrode, the membrane cocktail is directly applied onto a graphite rod or screen-printed electrode. For a carbon paste electrode, the membrane components are thoroughly mixed with graphite powder and a plasticizer to form a homogeneous paste, which is then packed into an electrode body [11].
- Conditioning: The newly fabricated sensor is soaked in a solution containing the target ion (e.g., 10⁻³ M Pb²⁺ or Cu²⁺ solution) for several hours (often 24 hours) to establish a stable equilibrium at the membrane surface [11].
Calibration and Performance Characterization:
- Calibration Curve: The conditioned sensor is connected to a high-impedance potentiometer alongside a standard reference electrode (e.g., Ag/AgCl). The potential is measured in a series of standard solutions with known concentrations of the target ion, typically ranging from 10⁻⁷ M to 10⁻¹ M [10] [11].
- Data Analysis: The measured potential (E) is plotted against the logarithm of the ion activity (log a). A linear regression fit is applied to the linear portion of the plot. The slope of the line should be close to the theoretical Nernstian slope (∼59.2 mV/decade for n=1, ∼29.6 mV/decade for n=2), and the detection limit is determined from the intersection of the two linear segments of the calibration curve [11] [6].
- Selectivity Determination: The potentiometric selectivity coefficient (( K_{A,B}^{pot} )) is a critical parameter, quantifying the sensor's ability to distinguish the primary ion from interferents. It is determined using methods like the Separate Solution Method (SSM), Fixed Interference Method (FIM), or Matched Potential Method (MPM) [11].
Validation with Real Samples:
- The sensor's performance is validated by analyzing real samples (e.g., water, serum, pharmaceutical formulations) and comparing the results with those obtained from a standard reference method like Inductively Coupled Plasma Mass Spectrometry (ICP-MS) or Atomic Absorption Spectroscopy (AAS). Statistical tests (e.g., t-test) are used to confirm there is no significant difference between the results [10] [11].
The Scientist's Toolkit: Essential Research Reagents and Materials
The performance of a potentiometric sensor is highly dependent on the quality and composition of its materials. The table below lists key components used in modern sensor fabrication [10] [11] [8].
Table 2: Key materials and reagents for fabricating potentiometric sensors.
| Material/Reagent | Function | Examples |
|---|---|---|
| Ionophore | The molecular recognition element that selectively binds the target ion. | Crown ethers (e.g., Dicyclohexyl-18-crown-6), synthetic molecules, Metal-Organic Frameworks (MOFs), Schiff bases [9] [10] [11]. |
| Polymer Matrix | Provides the structural backbone for the ion-selective membrane. | Polyvinyl chloride (PVC), Silicone rubber [10] [11]. |
| Plasticizer | Imparts plasticity and mobility to membrane components; can influence dielectric constant. | o-Nitrophenyl octyl ether (o-NPOE), Nitrobenzene, Dioctyl phthalate (DOP) [10] [11]. |
| Ion-Exchanger | Introduces initial ionic sites in the membrane and governs the intrinsic membrane permselectivity. | Potassium tetrakis(p-Cl-phenyl)borate (KClTPB) [9]. |
| Solid Contact Material | Replaces the inner filling solution; mediates ion-to-electron transduction. | Conducting polymers (e.g., PEDOT), Carbon nanomaterials (e.g., MWCNTs), Nanocomposites [8]. |
| Solvent | Dissolves membrane components for homogeneous film casting. | Tetrahydrofuran (THF), Cyclohexanone [9]. |
Advanced Applications and Future Trends
Potentiometric sensing continues to evolve, with several advanced formats enhancing its applicability in biomedical and pharmaceutical research.
- Wearable Sensors: A major trend is the development of wearable potentiometric sensors for the continuous monitoring of electrolytes (e.g., K⁺, Na⁺), metabolites, and even pharmaceuticals in biofluids like sweat and interstitial fluid. This is particularly valuable for therapeutic drug monitoring (TDM) of pharmaceuticals with a narrow therapeutic index [8].
- 3D-Printed and Paper-Based Sensors: 3D printing offers rapid prototyping and customization of electrode designs, while paper-based sensors provide a cost-effective, disposable platform for point-of-care (POC) testing, ideal for in-field analysis [8].
- Light-Addressable Potentiometric Sensors (LAPS): LAPS is a semiconductor-based sensor that allows for spatially resolved chemical imaging. It can be integrated into multi-electrode systems to simultaneously monitor electrochemical reactions and ion distributions in solution [7].
- Drug Analysis in Biological Samples: Potentiometric sensors have been successfully applied to determine concentrations of various drug molecules in complex biological matrices like blood serum and urine, offering a simple and rapid alternative to more complex techniques [12].
Electrochemical analysis is a versatile discipline in analytical chemistry that measures electrical properties like current, voltage, or resistance to determine the chemical properties of a solution [3]. These methods have become indispensable tools across clinical diagnostics, pharmaceutical development, environmental monitoring, and materials science due to their excellent sensitivity for trace-level analysis, wide linear dynamic range, and relatively low cost of instrumentation [3]. At the heart of every electrochemical measurement is a chemical reaction involving the transfer of electrons, known as a redox reaction, which can be driven by an external electrical potential or can itself generate a potential [3].
Electrochemical techniques are broadly categorized based on the electrical property being measured and how it is controlled. Voltammetry encompasses techniques that measure current as a function of an applied potential, providing both qualitative and quantitative information about electroactive species [3] [8]. In contrast, potentiometry is a zero-current technique that measures the potential difference between two electrodes when no net current is flowing through the cell, providing a direct function of the concentration or activity of a specific ion in the solution [3] [8]. This guide provides a comprehensive comparison of these fundamental electrochemical approaches, with a focused examination of their relative sensitivities and applications in modern research and development contexts, particularly in pharmaceutical and environmental sciences.
Fundamental Principles and Comparison
Voltammetry: Current as a Function of Applied Potential
Voltammetry is a dynamic electrochemical technique that measures the current passing through an electrochemical cell as the applied potential is systematically varied [3]. The resulting plot of current versus potential, called a voltammogram, provides a wealth of qualitative and quantitative information about the analyte, including its identity, concentration, and details about the kinetics and mechanisms of redox reactions [3]. The fundamental setup for most voltammetric analysis involves a three-electrode system: a working electrode where the redox reaction of interest occurs, a reference electrode that provides a stable and known potential, and a counter electrode that completes the circuit [3].
Various voltammetric techniques have been developed, each with specific advantages. Cyclic Voltammetry (CV) involves scanning the potential in a forward and reverse direction, creating a characteristic butterfly-shaped current-potential curve that reveals information about reaction reversibility, electron transfer rates, and the presence of intermediate species [3]. Square Wave Voltammetry (SWV) applies small, successive potential pulses to the working electrode and measures the current difference between forward and reverse pulses, significantly minimizing background current and resulting in a much better signal-to-noise ratio [13]. Differential Pulse Voltammetry (DPV) is another pulsed technique known for high sensitivity in trace analysis of organic compounds, pharmaceuticals, and heavy metals [3].
Potentiometry: Potential Measurement at Zero Current
Potentiometry measures the potential difference between two electrodes (an indicator electrode and a reference electrode) when no significant current is flowing through the cell [3] [8]. This potential difference is related to the concentration of a specific ion in the solution by the Nernst equation, which describes the relationship between the potential of an electrode and the concentration of the species undergoing a redox reaction [3]. The most familiar application of potentiometry is pH measurement using a glass electrode, but the technique has been extended to numerous other ions through the development of ion-selective electrodes (ISEs) [3].
Potentiometric sensors are classified based on the nature of the interface on the backside of the ion-selective membrane: liquid-contact (LC-ISE) and solid-contact (SC-ISE) electrodes [8]. Solid-contact ion-selective electrodes have gained prominence due to advantages such as ease of miniaturization, portability, stability, and enhanced detection in complex matrices [8]. Recent trends in potentiometric sensors include 3D printing for improved flexibility and precision in manufacturing, paper-based sensors for cost-effective point-of-care analysis, and wearable sensors for continuous monitoring of biomarkers, electrolytes, and pharmaceuticals [8].
Comparative Analysis: Voltammetry vs. Potentiometry
Table 1: Fundamental Comparison Between Voltammetry and Potentiometry
| Parameter | Voltammetry | Potentiometry |
|---|---|---|
| Measured Quantity | Current | Potential difference |
| Current Flow | Significant | Negligible (zero-current) |
| Primary Applications | Trace metal analysis, drug quantification, reaction mechanism studies [3] | pH measurement, ion-selective electrodes for Na+, K+, F−, clinical electrolyte analysis [3] |
| Sensitivity | Excellent for trace-level analysis (nM to pM range) [14] | Good for ion activity measurements (μM to mM range) [8] [11] |
| Selectivity | Achieved through potential control and electrode modification [14] | Achieved through ion-selective membranes [8] [11] |
| Information Obtained | Both qualitative and quantitative [3] | Primarily quantitative [3] |
| Technique Variants | Cyclic Voltammetry (CV), Square Wave Voltammetry (SWV), Differential Pulse Voltammetry (DPV) [3] [13] | Direct potentiometry, potentiometric titrations [3] |
Experimental Protocols and Methodologies
Voltammetric Experimental Design
Voltammetric experiments require careful optimization of parameters to achieve high sensitivity and reproducibility. A recent study demonstrating the determination of hazardous 2-nitrophenol (2-NP) in environmental samples provides an excellent example of systematic voltammetric method development [14]. The researchers prepared a modified glassy carbon electrode through the electropolymerization of 2-amino nicotinamide (2-AN) and used Square Wave Voltammetry (SWV) for quantification [14].
The experimental workflow comprised several critical steps. Electrode modification began with polishing the glassy carbon electrode, followed by electropolymerization of 2-AN using cyclic voltammetry with the optimum number of deposition cycles determined to be 5 [14]. The modified electrode surface was characterized using scanning electron microscopy (SEM) and Fourier transform infrared spectroscopy (FTIR) to confirm successful attachment of 2-AN to the GC surface [14]. For the SWV measurements, parameters including pulse amplitude, frequency, and potential step were optimized using Response Surface Methodology (RSM) experimental design to achieve the highest current response for 2-NP [14]. The reduction peak of 2-NP in Britton-Robinson buffer solution at pH 1.01 was used for quantitative determination [14]. The method was validated through the analysis of real samples including tap water and river water, with percentage relative standard deviation values between 1.0 and 3.9 and recovery values between 97.1 and 103.6% [14].
Diagram 1: Voltammetric Experimental Workflow. The diagram illustrates the systematic steps involved in developing a voltammetric method, from electrode preparation to method validation.
Potentiometric Sensor Fabrication and Measurement
The development of a potentiometric sensor for Cu(II) detection in environmental and pharmaceutical samples illustrates a comprehensive approach to potentiometric method design [11]. The researchers developed a graphite-based sensor modified with a Schiff base ligand (2-(((3-aminophenyl) imino) methyl) phenol) for selective determination of Cu(II) ions [11].
The sensor fabrication process involved several key stages. The Schiff base ligand was synthesized via a condensation reaction between m-phenylenediamine and 2-hydroxybenzaldehyde in ethanol, with the product characterized by FT-IR and 1H-NMR spectroscopy [11]. The carbon paste electrode was prepared by thoroughly mixing 250 mg of graphite powder with 5-20 mg of the synthesized ionophore and 0.1 mL of plasticizer, then filling the paste into a Teflon holder serving as the electrode body [11]. The sensor surface was characterized using scanning electron microscopy (SEM) combined with energy dispersive X-ray (EDX) for morphological analysis and elemental composition [11]. Potentiometric measurements were performed using a double-junction silver-silver chloride reference electrode, with the potential response measured across varying Cu(II) concentrations [11]. The sensor's performance was validated through the analysis of real samples including spiked water, multivitamin supplements, and vegetable foliar, with results compared to atomic absorption spectroscopy (AAS) as a reference method [11].
Sensitivity Comparison: Experimental Data Analysis
Quantitative Performance Metrics
Direct comparison of recent research applications demonstrates the distinct sensitivity profiles of voltammetric and potentiometric techniques across different analyte classes. The following table summarizes experimental detection capabilities reported in recent studies for both techniques.
Table 2: Sensitivity Comparison of Voltammetric and Potentiometric Techniques from Recent Studies
| Technique | Analyte | Matrix | Linear Range | Detection Limit | Reference |
|---|---|---|---|---|---|
| Square Wave Voltammetry | 2-Nitrophenol | Environmental water | 9.9 nM - 603 µM | 2.92 nM | [14] |
| Square Wave Voltammetry | Thymoquinone | Nigella sativa products | Not specified | 8.9 nM | [15] |
| Potentiometry | Cu(II) ions | Water, pharmaceuticals | 1×10⁻⁷ - 1×10⁻¹ M | 5.0×10⁻⁸ M (50 nM) | [11] |
| Potentiometry | Pb(II) ions | Aquatic environments | Not specified | 1.5×10⁻⁸ M (15 nM) | [16] |
| Potentiometry | Ca(II) ions | Extracellular fluid | 0.1 mM - 1 mM | Not specified | [17] |
| Potentiometry | Hg(II) ions | Aqueous solutions | 10⁻⁶ - 10⁻¹ M | Not specified | [18] |
Analysis of Sensitivity Profiles
The data presented in Table 2 reveals important insights about the sensitivity characteristics of voltammetric versus potentiometric techniques. Voltammetry demonstrates exceptional sensitivity for specific organic compounds, with detection limits reaching the nanomolar range, as evidenced by the 2.92 nM detection limit for 2-nitrophenol and 8.9 nM for thymoquinone [14] [15]. Modern potentiometric sensors also achieve impressive detection capabilities for metal ions, with demonstrated detection limits of 50 nM for Cu(II) and 15 nM for Pb(II) [11] [16]. The sensitivity of potentiometric sensors is highly dependent on the ionophore used in the selective membrane, with recent advancements in materials science contributing to improved performance [8] [11] [16].
Potentiometric sensors typically exhibit Nernstian response behavior, with theoretical slopes of approximately 29.6 mV per decade for monovalent ions and 19.7 mV per decade for divalent ions at 25°C [3]. Experimental studies have confirmed this behavior, with reported slopes of 29.571 mV per decade for Cu(II) [11], 33.0 mV per decade for Hg(II) [18], and approximately 20 mV per decade for Ca(II) [17]. This logarithmic relationship between potential and concentration provides potentiometry with a wide dynamic range, typically covering 4-6 orders of magnitude of concentration [11].
Research Reagent Solutions and Essential Materials
Successful implementation of electrochemical techniques requires specific materials and reagents optimized for each methodology. The following table details key components used in contemporary voltammetric and potentiometric research.
Table 3: Essential Research Reagents and Materials for Electrochemical Techniques
| Category | Specific Material/Reagent | Function/Application | Technique |
|---|---|---|---|
| Electrode Materials | Glassy Carbon Electrode | Working electrode substrate for modifications | Voltammetry [14] |
| Electrode Materials | Carbon Paste Electrode | Customizable working electrode matrix | Both [11] [15] |
| Electrode Materials | Silver/Silver Chloride Electrode | Stable reference electrode | Both [3] [15] |
| Modifiers/ Ionophores | 2-Amino Nicotinamide (2-AN) | Electrode modifier for enhanced 2-NP detection | Voltammetry [14] |
| Modifiers/ Ionophores | Schiff Base Ligands | Selective ionophores for metal ion recognition | Potentiometry [11] |
| Modifiers/ Ionophores | Thiophanate-Methyl (TPM) | Selective binding agent for Pb²⁺ detection | Potentiometry [16] |
| Modifiers/ Ionophores | BAPTA-based Copolymer | Calcium-selective polymer matrix | Potentiometry [17] |
| Supporting Electrolytes | Britton-Robinson Buffer | Versatile pH buffer for electrochemical studies | Voltammetry [14] |
| Supporting Electrolytes | Various Plasticizers (o-NPOE, DOP, TCP) | Membrane components for ion-selective electrodes | Potentiometry [11] |
Voltammetric and potentiometric techniques offer complementary capabilities for chemical analysis, each with distinct advantages for specific applications. Voltammetry provides exceptional sensitivity for trace-level analysis of electroactive organic compounds and offers the unique capability for mechanistic studies of redox processes. Potentiometry excels in direct ion activity measurements with relatively simple instrumentation, wide dynamic range, and recent advancements enabling miniaturization for point-of-care testing and continuous monitoring applications.
The choice between these techniques ultimately depends on the specific analytical requirements, including the nature of the target analyte, required detection limits, sample matrix, and available instrumentation. For researchers investigating redox-active pharmaceuticals or requiring mechanistic insights into electron transfer processes, voltammetric techniques offer unparalleled capabilities. For applications focused on monitoring specific ions in complex matrices like biological fluids or environmental samples, modern potentiometric sensors with advanced materials provide robust, selective, and sensitive detection.
Recent trends in both fields point toward increased miniaturization, materials innovation, and integration with portable instrumentation, expanding the applications of electrochemical analysis in field testing, point-of-care diagnostics, and continuous monitoring systems. The convergence of these techniques with advanced manufacturing methods like 3D printing and nanotechnology promises to further enhance their sensitivity, selectivity, and accessibility for research and applied analytical applications.
Electrochemical sensors are powerful tools in analytical chemistry, with potentiometry and voltammetry representing two foundational techniques. Potentiometry measures the potential difference between an indicator electrode and a reference electrode under conditions of zero current, with the signal being proportional to the logarithm of the target analyte concentration. In contrast, voltammetry applies a potential waveform to an electrode and measures the resulting current, which is directly proportional to the concentration of the electroactive species. The fundamental difference in their signal generation mechanisms—potential versus current measurement—leads to distinct performance characteristics in terms of sensitivity, detection limits, and dynamic range. These differences make each technique uniquely suited to particular applications, from environmental monitoring to pharmaceutical analysis and clinical diagnostics.
This guide provides a systematic comparison of key sensitivity parameters between potentiometric and voltammetric sensors, supported by experimental data from recent research. Understanding these parameters is essential for researchers, scientists, and drug development professionals to select the optimal analytical technique for their specific application needs.
Comparative Analysis of Sensitivity Parameters
Table 1: Comparison of Sensitivity Parameters for Potentiometric Sensors
| Analyte | Sensor Type | Linear Range | Response Slope (mV/decade) | Detection Limit | Reference |
|---|---|---|---|---|---|
| Sodium ions | Solid-contact ISE | 240 μM–250 mM | 57.1 | 2.4 μM | [19] |
| Copper ions | Graphite-based CPE | 0.1 μM–0.1 M | 29.57 | 0.05 μM | [20] |
| Calcium ions | BAPTA-based polymer | 0.1–1 mM | 20.0 | - | [17] |
| Bisoprolol | PVC membrane ISE | 1 μM–10 mM | 52.0 | 2.6 μM | [21] |
| Alverine | PVC membrane ISE | 1 μM–10 mM | 56.0 | 1.75 μM | [21] |
| Bromazepam | ISE (BRZ-PTA) | 1 μM–1 mM | 54.0 | - | [22] |
| Bromazepam | ISE (BRZ-TPB) | 1 μM–1 mM | 57.0 | - | [22] |
Table 2: Comparison of Sensitivity Parameters for Voltammetric Sensors
| Analyte | Sensor Type | Linear Range | Detection Limit | Reference |
|---|---|---|---|---|
| Tobramycin | MIP/Au-SPE | 0.001–60 pg/mL | 1.9 pg/mL | [23] |
| Melatonin | BDDE/CCPSA | - | 14.6 μg/L | [24] |
| Melatonin | BDDE/SWV | - | 110 μg/L | [24] |
| Luteolin | NC@ZIF-8/GCE | 0.05–30 μM | 0.011 μM | [25] |
Experimental Protocols for Sensor Characterization
Sensor Fabrication and Optimization
The construction of high-performance electrochemical sensors requires meticulous attention to material selection and fabrication protocols. For potentiometric sensors, a common approach involves preparing ion-selective membranes composed of poly(vinyl chloride) plasticized with various mediators such as o-nitrophenyl octyl ether (o-NPOE), dioctyl phthalate (DOP), or dibutyl sebacate (DBS). The electroactive components typically include ion-pair complexes formed between the target ion and appropriate counter ions such as phosphotungstic acid (PTA) or sodium tetraphenylborate (TPB). These components are dissolved in tetrahydrofuran (THF) and evaporated to form membranes of consistent thickness (typically 0.1 mm), which are then mounted on electrode bodies and conditioned in standard solutions of the target analyte for 24 hours prior to use [21] [22].
For voltammetric sensors, surface modification is crucial for enhancing sensitivity and selectivity. A representative protocol involves polishing glassy carbon electrodes (GCE) with alumina slurry to a mirror finish, followed by modification with advanced nanocomposites. For instance, nitrogen-doped hollow carbon sphere @ZIF-8 (NC@ZIF-8) composites can be prepared by synthesizing hollow carbon spheres using SiO₂ as a template, followed by in-situ growth of ZIF-8 crystals. The resulting composite is dispersed in a Nafion-containing solution, and a precise volume (typically 5 μL) is drop-cast onto the GCE surface and dried to create a uniform sensing layer [25].
Measurement Procedures and Data Acquisition
Potentiometric measurements are performed by immersing the conditioned indicator electrode along with an appropriate reference electrode (typically Ag/AgCl) in standard solutions with concentrations spanning the expected dynamic range. The potential is recorded under zero-current conditions after stabilization, and the values are plotted against the logarithm of analyte concentration. The ideal Nernstian slope is 59.16 mV/decade for monovalent ions and 29.58 mV/decade for divalent ions at 25°C, with deviations indicating non-ideal behavior [20] [21].
Voltammetric techniques encompass various potential waveforms and measurement strategies. For cyclic voltammetry (CV), the potential is scanned linearly between designated initial and switching potentials while recording the current response. Differential pulse voltammetry (DPV) applies potential pulses superimposed on a linear ramp, measuring the current difference just before and at the end of each pulse to minimize capacitive currents. Square wave voltammetry (SWV) uses a symmetrical square wave superimposed on a staircase ramp, offering excellent sensitivity and rejection of background currents. Constant current potentiometric stripping analysis (CCPSA), used for melatonin detection, involves an accumulation step where the analyte is concentrated onto the electrode surface, followed by a stripping step where the accumulated species is oxidized or reduced while monitoring the potential as a function of time [24] [25].
Limit of Detection Determination
The limit of detection (LOD) represents the lowest concentration of an analyte that can be reliably distinguished from the analytical background. Multiple approaches exist for LOD determination in electrochemical sensors. The signal-to-noise ratio (SNR) method defines LOD as the concentration yielding a signal three times the standard deviation of the blank measurement (LOD = 3 × σ) [26]. The linear calibration method calculates LOD using the formula LOD = 3.3 × σ/S, where σ is the standard deviation of the blank response and S is the slope of the calibration curve. For voltammetric sensors, visual evaluation through serial dilution until the voltammetric peak becomes indistinguishable from background noise provides a practical estimation, though this approach is more subjective [26]. Recent studies emphasize the importance of determining realistic LOD values under intermediate precision conditions that account for sample preparation, matrix effects, and measurement variability encountered in actual applications [26].
Visual Guide to Electrochemical Sensing
Essential Research Reagents and Materials
Table 3: Essential Research Reagents and Materials for Electrochemical Sensor Development
| Category | Specific Items | Function/Purpose | Representative Applications |
|---|---|---|---|
| Electrode Materials | Screen-printed gold electrodes (Au-SPE) | Transducer platform | Tobramycin detection [23] |
| Boron-doped diamond electrodes (BDDE) | Working electrode with wide potential window | Melatonin determination [24] | |
| Glassy carbon electrodes (GCE) | Versatile working electrode base | Luteolin sensor [25] | |
| Graphite powder | Conductive matrix for carbon paste electrodes | Copper ion sensor [20] | |
| Polymer Matrices | Poly(vinyl chloride) (PVC) | Membrane matrix for ion-selective electrodes | Bisoprolol, alverine, bromazepam sensors [21] [22] |
| Poly(3,4-ethylenedioxythiophene)-poly(styrene-sulfonate) (PEDOT-PSS) | Conductive polymer for solid-contact electrodes | Calcium ion sensor [17] | |
| Plasticizers | o-Nitrophenyl octyl ether (o-NPOE) | Solvent mediator for membrane electrodes | Various ISEs [20] [21] [22] |
| Dioctyl phthalate (DOP) | Alternative plasticizer | Membrane optimization [22] | |
| Ion Exchangers | Potassium tetrakis(p-chlorophenyl) borate (KTpClPB) | Anionic additive for cation-selective membranes | Pharmaceutical ISEs [21] |
| Sodium tetraphenylborate (TPB) | Ion-pairing agent for drug sensors | Bromazepam sensor [22] | |
| Nanomaterials | Silver nanoparticles (AgNPs) | Signal amplification | Tobramycin MIP sensor [23] |
| Nitrogen-doped hollow carbon spheres | Enhanced conductivity and surface area | Luteolin sensor [25] | |
| ZIF-8 metal-organic framework | High surface area for analyte preconcentration | Luteolin sensor [25] | |
| Solvents | Tetrahydrofuran (THF) | Membrane solvent for PVC-based ISEs | Sensor fabrication [22] |
| Phosphate buffered saline (PBS) | Supporting electrolyte | Electrochemical measurements [23] [25] |
The comparative analysis of sensitivity parameters reveals distinct advantages for both potentiometric and voltammetric techniques. Potentiometry generally offers wider linear ranges (typically spanning 3-6 orders of magnitude) and well-defined Nernstian response slopes, making it ideal for applications requiring the quantification of ionic species across broad concentration ranges, particularly in pharmaceutical quality control and environmental monitoring [19] [21]. The technique benefits from simple instrumentation, operational stability, and the ability to measure colored or turbid samples without interference.
In contrast, voltammetry demonstrates superior detection limits, often reaching picomolar or even sub-nanomolar levels, making it the technique of choice for trace analysis of electroactive organic compounds, pharmaceutical residues, and biomarkers in complex matrices [23] [25]. The trade-off typically involves narrower linear ranges and more complex measurement protocols that may require careful optimization of multiple waveform parameters.
Technique selection should be guided by the specific analytical requirements: potentiometry for broad-range ionic measurements with operational simplicity, and voltammetry for ultra-trace determination of electroactive compounds where higher sensitivity justifies more complex operational protocols. Recent advancements in materials science, particularly the development of novel nanomaterials and selective recognition elements, continue to push the sensitivity boundaries of both techniques, expanding their applications in pharmaceutical analysis, clinical diagnostics, and environmental monitoring.
The performance of electrochemical sensors is fundamentally governed by the properties of the electrode-solution interface. For researchers and drug development professionals, the choice between potentiometric and voltammetric techniques hinges on a deep understanding of how electrode materials and their surface characteristics control sensitivity, selectivity, and detection limits. While potentiometry measures potential at zero current, and voltammetry measures current under applied potential, both techniques rely on optimized electrode interfaces for effective analyte detection [9] [27]. Recent advances in nanostructured materials and surface modification strategies have significantly enhanced our ability to tailor these interfaces for specific sensing applications, pushing detection limits to trace levels for biologically and clinically relevant analytes [28] [27].
This guide provides a systematic comparison of how surface properties govern sensitivity in these two prominent electrochemical approaches, supported by experimental data and protocols relevant to pharmaceutical and clinical research.
Fundamental Principles and Sensitivity Mechanisms
Core Sensing Mechanisms
The fundamental difference in how potentiometric and voltammetric sensors generate signals leads to distinct considerations for electrode design and surface modification.
Potentiometric Sensors measure the equilibrium potential difference across an electrode interface relative to a reference electrode, which changes in response to analyte activity. This technique benefits from minimal analyte consumption, making it particularly suitable for small sample volumes or continuous monitoring where preserving sample integrity is crucial [9]. The potential is governed by the Nernst equation, and sensitivity is expressed as the Nernstian slope (mV/decade).
Voltammetric Sensors measure the current resulting from the oxidation or reduction of an electroactive analyte at a controlled potential. Sensitivity in this technique relates to the magnitude of the faradaic current, which is proportional to analyte concentration. A significant consideration is analyte consumption during the measurement process, which can be a limiting factor in small sample volumes or at low concentrations [9].
Key Electronic and Geometric Surface Properties
The following table summarizes the critical surface properties that influence sensitivity in both techniques.
Table 1: Key Surface Properties Governing Electrode Sensitivity
| Property | Impact on Potentiometric Sensitivity | Impact on Voltammetric Sensitivity |
|---|---|---|
| Electrocatalytic Activity | Indirect; affects equilibrium potential and response time. | Direct; lowers overpotential, increases electron transfer rate, and boosts current response. |
| Surface Area | Minimal impact on Nernstian slope, but can improve signal-to-noise ratio. | Major impact; directly increases faradaic current (i~Area). |
| Interfacial Architecture | Critical for ionophore-analyte interaction and membrane stability. | Critical for mass transport and accessibility of active sites. |
| Electrical Conductivity | Ensures efficient potential measurement; high conductivity is essential. | Directly influences electron transfer kinetics and measured current. |
| Binding Affinity/Selectivity | Governed by ionophore in the membrane; dictates selectivity and sensitivity. | Governed by surface modifiers; can be engineered for specific analyte recognition. |
Comparative Analysis: Potentiometry vs. Voltammetry
Direct Comparison of Advantages and Limitations
The choice between potentiometry and voltammetry involves trade-offs between sensitivity, selectivity, and practical implementation. The following diagram illustrates the fundamental operational difference between the two techniques.
The core operational differences lead to distinct practical advantages and limitations, which are compared in the table below.
Table 2: Comparative Analysis of Potentiometry and Voltammetry
| Feature | Potentiometry | Voltammetry |
|---|---|---|
| Fundamental Signal | Potential (V) at zero current [9] | Current (i) from redox reactions [9] |
| Analyte Consumption | Virtually zero [9] | Significant (can be a limitation in small volumes) [9] |
| Typical Detection Limit | ~10⁻⁶ to 10⁻⁸ M (highly dependent on ionophore) [9] [18] | Can reach ~10⁻⁹ M or lower with modified surfaces [9] |
| Selectivity Mechanism | Ionophore-analyte binding affinity in a membrane [9] | Applied potential and surface catalyst selectivity [9] |
| Impact of Mass Transport | Minimal | Critical; diffusion can be the rate-limiting step [9] |
| Key Advantage | Ideal for small volumes and continuous monitoring | Very high sensitivity and tunable via potential control |
| Primary Challenge | Requires highly selective ionophores for accurate measurement [9] | Susceptible to electrode fouling and interference from surface-active species [28] |
Quantitative Performance Data
Experimental data from recent studies highlights how material choices and surface modification directly impact sensor metrics. The following table compiles performance data for different electrode materials and modifications.
Table 3: Experimental Sensor Performance of Selected Electrode Materials and Modifications
| Analyte | Electrode Material / Modification | Technique | Reported Sensitivity / Performance | Detection Limit |
|---|---|---|---|---|
| Hg²⁺ Ions | WS₂-WO₃/Poly-2-aminobenzene-1-thiol Nanocomposite [18] | Potentiometry | Nernstian slope: 33.0 mV/decade [18] | Not Specified (Linear from 10⁻⁶ M) |
| Hg²⁺ Ions | WS₂-WO₃/Poly-2-aminobenzene-1-thiol Nanocomposite [18] | Cyclic Voltammetry | Sensitivity: 2.4 μA/M [18] | Not Specified (Linear from 10⁻⁶ M) |
| Dopamine | Bare Gold and Platinum Microelectrodes [9] | Voltammetry | -- | ~10⁻⁷ M (in 200 μl samples) [9] |
| Prostate Cancer Gene (PCA3) | DNA-coated Gold Electrode with PVA Protection [29] | Amperometry (CRISPR-based) | -- | Demonstrated after 2-month storage [29] |
Advanced Materials and Surface Modification Strategies
Material Classes and Their Functions
The integration of advanced functional materials has been a key driver in improving sensor sensitivity.
- Nanostructured Materials: Carbon nanotubes (CNTs), graphene, and metal nanoparticles provide a large surface area, excellent conductivity, and the ability to adsorb various analytes, significantly boosting the current response in voltammetry and improving the signal-to-noise ratio in potentiometry [28] [27].
- Metal-Organic Frameworks (MOFs): Materials like ZIF-8 and HKUST-1 offer high porosity and tunable structures that enhance interaction with target analytes. Their large surface areas provide numerous active sites, improving sensitivity for heavy metal ions, gas sensing, and biosensing [30] [27].
- Conducting Polymers: Polymers such as polyaniline (PANI) and polypyrrole (PPy) improve both electrochemical properties and mechanical stability when used to modify electrode surfaces. They offer biocompatibility and signal amplification properties, making them suitable for bio-detection [27].
- 2D Xenes: Silicene, a silicon analogue of graphene, shows promise for energy storage but is also relevant for sensing due to its high theoretical capacity, large surface area, and low diffusion energy barrier for ions [31].
Surface Modification Techniques
Modifying the electrode surface is crucial for optimizing its interface with the sample. Common techniques include:
- Drop Casting: A simple method where a droplet of modifier suspension is applied to the electrode surface and dried. A key challenge is the "coffee-ring" effect, which can lead to inhomogeneous coating [28].
- Electrochemical Deposition: A versatile method for fabricating layers of metal nanostructures or polymers on the electrode surface with precise control over thickness and morphology using either potentiostatic or potentiodynamic modes [28].
- Self-Assembled Monolayers (SAMs): Used to create highly ordered, single-molecule-thick layers on electrode surfaces, providing a platform for immobilizing biorecognition elements like enzymes or antibodies [27].
- Layer-by-Layer (LbL) Assembly: Allows for precise construction of multi-layered sensor surfaces with controlled composition and thickness, improving electrochemical response and selectivity [27].
Experimental Protocols for Sensor Characterization
Protocol: Fabrication of a Nanocomposite-Modified Electrode for Heavy Metal Sensing
This protocol outlines the synthesis and modification steps for creating a potentiometric Hg²⁺ sensor, as exemplified by the WS₂-WO₃/P2ABT nanocomposite [18].
Nanocomposite Synthesis (Oxidative Polymerization):
- Dissolve 0.06 M of the monomer 2-aminobenzene-1-thiol (2ABT) in 1.0 M hydrochloric acid (HCl).
- Add 0.14 M of an oxidizing agent (e.g., K₂S₂O₈) to initiate free radical formation and polymerize the monomer to P2ABT.
- Allow the reaction to proceed for 24 hours at ambient temperature.
- To form the WS₂-WO₃/P2ABT nanocomposite, use a mixture of Na₂WO₄ and K₂S₂O₈ as oxidizing agents in the presence of the monomer, facilitating the integration of WO₃ and WS₂ into the polymer matrix over 24 hours [18].
Electrode Modification (Drop Casting):
- Prepare a stable suspension or solution of the synthesized WS₂-WO₃/P2ABT nanocomposite.
- Apply a precise volume (e.g., 5-10 µL) of the suspension onto the surface of a clean, polished electrode (e.g., glassy carbon or gold).
- Allow the solvent to evaporate under controlled conditions (e.g., room temperature or under an infrared lamp) to form a thin, uniform film [28] [18].
Potentiometric Measurement (Two-Electrode Cell):
- Use the modified electrode as the working electrode and a calomel electrode (Hg/Hg₂Cl₂) or another suitable reference electrode.
- Immerse the electrode pair in standard solutions of Hg²⁺ with concentrations ranging from 10⁻⁶ M to 10⁻¹ M.
- Measure the equilibrium potential (in mV) for each solution without applying any current.
- Plot the potential vs. the logarithm of the Hg²⁺ concentration to obtain the calibration curve and calculate the Nernstian slope [18].
Protocol: Investigating Dopamine via Cyclic Voltammetry with Bare Electrodes
This protocol describes a voltammetric approach for detecting neurotransmitters like dopamine in small volumes, highlighting the critical role of mass transport [9].
Cell and Electrode Preparation:
- Use a miniature electrochemical cell (e.g., a "barrel" type cell with a 200 µL volume) to accommodate small sample volumes.
- Employ a standard three-electrode system: a bare gold or platinum microelectrode as the working electrode, a platinum wire as the counter electrode, and an Ag/AgCl reference electrode.
- Clean the working electrode surface meticulously according to established procedures (e.g., polishing, electrochemical cleaning) to ensure reproducibility [9].
Cyclic Voltammetry Measurement:
- Prepare dopamine solutions in a suitable buffer (e.g., phosphate buffer saline) across the desired concentration range (e.g., 10⁻⁷ M to 10⁻⁴ M).
- Set the potentiostat parameters: a scan rate typically between 50-100 mV/s, and a potential window that encompasses the oxidation and reduction peaks of dopamine (e.g., -0.2 V to +0.5 V vs. Ag/AgCl).
- Run the cyclic voltammetry scans for each dopamine solution. Note that without stirring, the diffusion of dopamine to the electrode surface can be the limiting factor [9].
Data Analysis:
- Record the peak oxidation current (iₚ) for each voltammogram.
- Plot the peak current (iₚ) against the dopamine concentration to establish the calibration curve and determine the sensor's sensitivity.
- To overcome diffusion limitations, consider using microelectrode arrays, which enhance mass transport and provide a steadier signal [9].
The Scientist's Toolkit: Essential Research Reagents and Materials
Table 4: Key Reagents and Materials for Electrode Development and Sensing
| Item | Function / Application |
|---|---|
| Glassy Carbon Electrodes | A common, stable baseline working electrode material with a wide potential window, often used as a substrate for modifications [28]. |
| Gold and Platinum Electrodes | Preferable for biomolecule immobilization (e.g., thiolated DNA) and applications requiring a well-defined, clean metal surface [29] [9]. |
| Ion-Selective Membranes | Used in potentiometry; typically consist of PVC, a plasticizer (e.g., o-NPOE), an ionophore, and an ion exchanger to provide selectivity for specific ions [9]. |
| Carbon Nanotubes & Graphene | Nanostructured carbon materials used to modify electrodes, providing high surface area and enhanced electron transfer kinetics [28] [27]. |
| Metal-Organic Frameworks (ZIF-8) | Porous crystalline materials used as modifying agents to create high-surface-area electrodes with selective adsorption properties [27]. |
| Conducting Polymers (PANI, PPy) | Polymers used to coat electrodes, improving conductivity, stability, and providing a matrix for embedding recognition elements [27]. |
| Self-Assembled Monolayer (SAM) Kits | Pre-formulated reagents for creating ordered monolayers on gold surfaces, used for functionalizing electrodes with specific molecular groups [27]. |
| CRISPR Cas12 Enzyme | A biological recognition element used in novel biosensors; upon detecting target DNA/RNA, it cleaves reporter DNA on the electrode, generating an electrical signal [29]. |
| Polyvinyl Alcohol (PVA) | A polymer used as a protective coating to stabilize DNA on electrode surfaces, extending sensor shelf-life [29]. |
The sensitivity of both potentiometric and voltammetric sensors is profoundly dictated by the physicochemical properties of the electrode-solution interface. Potentiometry offers distinct advantages for small-volume analysis due to its non-consumptive nature, but its success is contingent on the development of highly selective recognition layers. Voltammetry provides superior sensitivity and is highly tunable through material design and potential control, though it must overcome challenges related to mass transport and fouling. The ongoing integration of advanced nanomaterials like MOFs, conducting polymers, and 2D materials, coupled with sophisticated surface modification strategies, continues to push the boundaries of detection. For researchers in drug development, this evolving toolkit enables the design of increasingly sensitive, selective, and robust electrochemical sensors for a wide range of applications, from therapeutic monitoring to diagnostic assays.
Practical Implementation: Achieving Optimal Sensitivity in Real-World Applications
The pursuit of maximum analytical sensitivity is a central goal in electrochemical sensor development, driving innovations in fields from clinical diagnostics to environmental monitoring. Ion-Selective Electrodes (ISEs) represent a cornerstone of potentiometric sensing, valued for their simplicity, cost-effectiveness, and real-time measurement capabilities [32]. The fundamental operation of ISEs relies on measuring the potential difference across an ion-selective membrane at zero current, with the signal following a logarithmic relationship to ion activity as described by the Nernst equation [3] [32].
This guide objectively compares the sensitivity performance of potentiometric ISEs against voltammetric techniques, with a specific focus on design principles that enhance detection limits. While voltammetry often achieves lower detection limits through pre-concentration steps like in anodic stripping voltammetry (ASV) [33] [34], modern ISE designs incorporating advanced materials and nanostructures are progressively closing this sensitivity gap while maintaining superior selectivity and operational simplicity.
Fundamental Principles and Sensitivity Comparison
Core Principles of Potentiometry and Voltammetry
Potentiometric and voltammetric techniques operate on fundamentally different principles, which directly impact their sensitivity characteristics and applications. The table below compares their core operational mechanisms:
Table 1: Fundamental comparison of potentiometric and voltammetric techniques
| Feature | Potentiometry (ISE) | Voltammetry |
|---|---|---|
| Measured Quantity | Potential (voltage) at zero current [3] | Current as function of applied potential [3] |
| Governing Equation | Nernst equation [3] [32] | Butler-Volmer kinetics [35] |
| Detection Limit | Typically 10⁻⁶ to 10⁻⁸ M [32] | Can reach 10⁻¹¹ to 10⁻¹⁴ M with pre-concentration [33] [34] |
| Selectivity Mechanism | Ion-selective membrane [32] | Potential control and electrode modification [18] [34] |
| Technique Variants | Direct potentiometry, potentiometric titration [3] | Cyclic voltammetry, square wave voltammetry, anodic stripping voltammetry [33] [3] |
Quantitative Sensitivity Comparison
Direct comparison of reported detection limits for various metal ions reveals the distinct sensitivity profiles of these techniques:
Table 2: Experimental detection limits reported for potentiometric and voltammetric sensors
| Analyte | Technique | Sensor Design | Detection Limit | Reference |
|---|---|---|---|---|
| Cd²⁺ | Potentiometry | IIP/PVC membrane | 6.3 × 10⁻¹⁰ M | [34] |
| Cd²⁺ | Voltammetry (ASV) | IIP/Graphene Oxide | 7.0 × 10⁻¹⁴ M | [34] |
| Cu²⁺ | Voltammetry (ASV) | Carbon-based ISE | Nanomolar range | [33] |
| Hg²⁺ | Potentiometry | WS₂-WO₃/P2ABT nanocomposite | ~10⁻⁶ M (Nernstian response from 10⁻⁶ to 10⁻¹ M) | [18] |
| Ag⁺ | Potentiometry | Calix[4]arene/MWCNT | 4.1 × 10⁻⁶ M | [36] |
| Ca²⁺ | Potentiometry | Carbon-based μISE | 1 × 10⁻⁶ M | [33] |
The data demonstrates that voltammetric techniques, particularly those incorporating pre-concentration steps, generally achieve significantly lower detection limits—sometimes by several orders of magnitude. However, advanced ISE designs utilizing ion-imprinted polymers (IIPs) and nanomaterials are progressively bridging this sensitivity gap while maintaining the operational simplicity inherent to potentiometry.
Key Design Principles for Enhanced ISE Sensitivity
Membrane Composition and Ionophore Design
The ion-selective membrane represents the core recognition element of an ISE, and its composition directly determines sensor sensitivity and selectivity:
Ion-Selective Membranes: These membranes function based on selective ion recognition, typically employing ionophores that create coordination sites specific to target ions [32]. The selectivity pattern follows the Eisenman sequence, which describes the relative free energy differences during ion exchange [37].
Ion-Imprinted Polymers (IIPs): These advanced materials create molecular cavities complementary to the target ion in shape, size, and coordination chemistry. A Cd²⁺-IIP sensor demonstrated remarkable selectivity by using a benzo[f]chromene-based monomer that formed specific coordination sites for cadmium ions [34].
Macrocyclic Ligands: Molecules like calix[4]arene provide pre-organized cavity structures that selectively complex specific ions. In silver ion sensing, calix[4]arene demonstrated superior affinity over other potential ionophores, enabling selective Ag⁺ detection in pharmaceutical formulations [36].
Nanomaterial Integration and Solid-Contact Designs
Modern ISE designs increasingly incorporate nanomaterials and solid-contact configurations to enhance sensitivity:
Carbon Nanotubes as Transducers: Multi-walled carbon nanotubes (MWCNTs) serve as efficient ion-to-electron transducers in solid-contact ISEs. Their hydrophobic nature prevents formation of water layers at the electrode-membrane interface, significantly improving potential stability and signal reproducibility [36].
Graphene Oxide Enhancements: The large surface area and excellent electrical conductivity of graphene oxide significantly enhance electron transfer kinetics when incorporated into voltammetric sensors, contributing to the extremely low detection limits observed in IIP/GO composite sensors [34].
Nanochannel-Based Membranes: Precisely engineered nanochannels with dimensions approaching the Debye length can create ion-selective environments through overlapping electrical double layers. Surface charge, channel dimensions, and morphology critically influence ion transport selectivity, particularly for challenging separations like lithium extraction from complex matrices [38] [37].
Interface Engineering and Signal Transduction
The interface between the membrane and electrode conductor plays a crucial role in determining ISE sensitivity:
Solid-Contact Designs: Traditional liquid-contact ISEs have been largely superseded by solid-contact designs that eliminate internal solution requirements, enhance miniaturization potential, and improve mechanical stability [36]. The carbon-based Ca²⁺-selective microelectrode exemplifies this approach, achieving a Nernstian slope of 29 mV/decade with a 1 μM detection limit [33].
Minimizing Water Layer Formation: Unintended water layers at the electrode-membrane interface cause potential drift and instability. Hydrophobic intermediate layers like MWCNTs effectively block water penetration, maintaining interface integrity and signal stability over extended operation [36].
Diagram 1: ISE signal transduction pathway
Experimental Protocols for Sensitivity Optimization
Fabrication of Solid-Contact ISE with MWCNT Interlayer
The following protocol details the fabrication of a high-sensitivity solid-contact ISE, optimized for silver ion detection [36]:
Electrode Pretreatment: Clean screen-printed electrodes (SPEs) sequentially with ethanol and deionized water, then dry under nitrogen stream.
MWCNT Dispersion Preparation: Disperse 2.0 mg of multi-walled carbon nanotubes in 1.0 mL of dimethylformamide (DMF) using 30 minutes of ultrasonic agitation.
Transducer Layer Application: Deposit 10 μL of MWCNT dispersion onto the SPE working electrode surface. Allow solvent evaporation at room temperature for 12 hours.
Membrane Cocktail Preparation: Combine the following components in a glass vial:
- 150 mg plasticizer (NPOE)
- 75 mg PVC polymer
- 1.5 mg ionophore (calix[4]arene)
- 0.8 mg ionic additive (NaTetrakis)
- 1.5 mL THF solvent
Membrane Deposition: Apply 20 μL of membrane cocktail over the MWCNT-modified electrode. Allow THF evaporation for 24 hours at room temperature to form a uniform sensing membrane.
Conditioning: Condition the completed ISE in 1.0 × 10⁻³ M AgNO₃ solution for 24 hours before calibration.
Sensor Calibration and Performance Validation
Proper calibration and validation are essential for accurate sensitivity determination:
Calibration Protocol: Prepare standard solutions across the concentration range from 1.0 × 10⁻⁷ to 1.0 × 10⁻² M. Measure the potential response of the ISE for each standard, allowing stabilization until potential drift falls below 0.1 mV/min.
Data Analysis: Plot measured potential (mV) against logarithm of ion activity. Perform linear regression on the linear portion to determine slope (mV/decade), linear range, and detection limit.
Detection Limit Calculation: Calculate the method detection limit (MDL) from the calibration curve using the IUPAC recommended approach: intersection of the two linear segments of the calibration curve, or as concentration corresponding to three times the standard deviation of the blank signal.
Selectivity Assessment: Determine potentiometric selectivity coefficients (Kᵖᵒₜₐ,ᴮ) using the separate solution method (SSM) or matched potential method (MPM) with relevant interfering ions.
Research Reagent Solutions for ISE Development
The table below summarizes essential materials and their functions in advanced ISE fabrication:
Table 3: Key research reagents for ISE development and their functions
| Reagent Category | Specific Examples | Function in ISE | Considerations for Sensitivity |
|---|---|---|---|
| Ionophores | Calix[4]arene, crown ethers, ion-imprinted polymers [34] [36] | Molecular recognition element for target ions | Determines selectivity coefficient and detection limit |
| Polymer Matrices | Polyvinyl chloride (PVC), silicone rubber [33] [36] | Structural support for membrane components | Affects ion diffusion and membrane stability |
| Plasticizers | 2-Nitrophenyl octyl ether (NPOE), dioctyl sebacate (DOS) [33] [36] | Provides membrane flexibility and modulates dielectric constant | Influences ionophore solubility and mobility |
| Ionic Additives | Sodium tetrakis[3,5-bis(trifluoromethyl)phenyl]borate (NaTFPB) [36] | Controls membrane permselectivity and reduces ohmic resistance | Critical for optimizing response slope |
| Transducer Materials | Multi-walled carbon nanotubes (MWCNTs), graphene oxide, conductive polymers [34] [36] | Converts ionic signal to electronic signal in solid-contact ISEs | Reduces impedance and improves signal stability |
| Membrane Solvents | Tetrahydrofuran (THF), cyclohexanone [33] [36] | Dissolves membrane components for deposition | Affects membrane morphology and performance |
Advanced Nanochannel-Based Membrane Design
Emerging membrane designs utilizing nanochannels and nanopores represent a frontier in ion-selective membrane technology, particularly for challenging separations such as lithium extraction [38] [37]. The design principles for these advanced membranes include:
Diagram 2: Nanochannel membrane design principles
Surface Charge Engineering: Creating fixed negative charges within nanochannels generates cation selectivity through electrostatic interactions. When channel dimensions approach the Debye length (typically 1-100 nm), overlapping electrical double layers create ion-selective environments [37].
Dimensional Control: Nanochannel size must be precisely tuned to match the target application's ionic strength. For lithium extraction from brines, channel dimensions must facilitate discrimination between similarly sized monovalent cations (Li⁺, Na⁺, K⁺) [38] [37].
Multi-parameter Optimization: Maximum sensitivity requires coordinated optimization of surface charge, wettability, external driving force, and nanochannel morphology. These parameters interact complexly to determine ultimate membrane performance [38].
The pursuit of maximum potentiometric sensitivity in Ion-Selective Electrodes requires a multifaceted approach spanning membrane composition, interface engineering, and structural design. While voltammetric techniques currently demonstrate superior detection limits for trace metal analysis, advanced ISE designs incorporating ion-imprinted polymers, nanomaterial transducers, and solid-contact configurations are progressively narrowing this sensitivity gap.
The optimal technique selection depends critically on application requirements. Potentiometric ISEs offer operational simplicity, excellent selectivity, and cost-effectiveness for direct measurements, while voltammetric methods provide unparalleled sensitivity when trace-level detection is paramount. Future developments in nanochannel-based membranes and hybrid techniques that combine potentiometric and voltammetric operation hold particular promise for achieving both exceptional sensitivity and selectivity in electrochemical sensing.
The quest for ultra-sensitive detection of chemical species, particularly in complex matrices like biological fluids or environmental samples, places a premium on analytical technique selection. Within electrochemical analysis, two primary philosophies emerge: voltammetry, which measures current resulting from a controlled potential change, and potentiometry, which measures potential at zero current [3]. This guide frames the comparison of advanced voltammetric methods within this broader context, highlighting that while potentiometry offers the advantage of being non-consumptive of the analyte—a critical factor for small sample volumes—voltammetry often provides superior sensitivity and the ability to detect multiple analytes simultaneously [9] [3]. The following sections provide a detailed objective comparison of key voltammetric techniques, supported by experimental data and protocols, to guide researchers in selecting the optimal method for their trace analysis challenges.
Voltammetry encompasses a family of techniques that quantify an analyte based on the current-flow resulting from an applied potential waveform. The choice of waveform and measurement strategy directly impacts sensitivity, detection limit, and resolution. Table 1 summarizes the core characteristics, advantages, and limitations of the primary voltammetric methods discussed in this guide.
Table 1: Comparison of Key Voltammetric Techniques for Trace Analysis
| Technique | Fundamental Principle | Key Advantages | Typical Detection Limits | Common Applications |
|---|---|---|---|---|
| Cyclic Voltammetry (CV) | Scans potential linearly in a forward and reverse direction [3]. | Rapid assessment of reaction kinetics and reversibility [3]. | ~10⁻⁶ to 10⁻⁷ M [9] | Studying redox mechanisms, electrode kinetics [3]. |
| Differential Pulse Voltammetry (DPV) | Applies small potential pulses and measures the current difference just before and during the pulse [3]. | Minimizes capacitive background current, leading to high sensitivity [3]. | ~10⁻⁸ to 10⁻⁹ M [9] [39] | Trace analysis of organic compounds, pharmaceuticals, and metals [3]. |
| Square Wave Voltammetry (SWV) | Applies a symmetrical square wave on a staircase ramp, measuring current at the end of each forward and reverse pulse [40]. | Very fast scan times and extremely low detection limits; can effectively reject capacitive currents [40]. | Can be superior to DPV [40] | Ultra-trace metal analysis and sensitive detection of organic molecules [40]. |
| Anodic Stripping Voltammetry (ASV) | Pre-concentrates metal ions onto the electrode by reduction, then oxidizes (strips) them back into solution while measuring current [39]. | Exceptional sensitivity due to the pre-concentration step [39]. | 10⁻⁹ to 10⁻¹⁰ M (ppt-ppb range) [39] | Determination of trace heavy metals (e.g., Pb, Cd, Cu) in water [40] [39]. |
| Cyclic Voltammetric Stripping (CVS) | Cycles potential to repeatedly plate and strip a metal, measuring the charge required, which is affected by organic additives [41] [42]. | Measures the effective activity of organic additives in a plating bath, emulating the full process [41]. | Varies by additive | Quantitative analysis of organic additives in electroplating baths [41] [42]. |
Experimental Protocols for Key Voltammetric Methods
Anodic Stripping Voltammetry (ASV) for Trace Metal Detection
ASV is a premier method for detecting trace metal ions at parts-per-billion levels, outperforming many spectroscopic techniques in cost and portability [40] [39].
- 1. Working Electrode Preparation: A common configuration is the Mercury Film Electrode (MFE), formed by electrodepositing a thin mercury film onto a glassy carbon electrode. Alternatives include bismuth film or bare gold and platinum electrodes [39] [9].
- 2. Electrolyte and Deaeration: The supporting electrolyte (e.g., 0.1 M HCl) is added to the sample to ensure sufficient conductivity. Dissolved oxygen is removed by purging with an inert gas (e.g., nitrogen or argon) for 5-10 minutes, as oxygen can interfere with the reduction and oxidation steps.
- 3. Pre-concentration/Deposition Step: The solution is stirred, and a constant negative potential (e.g., -1.0 V vs. Ag/AgCl) is applied to the working electrode for a defined time (60-300 seconds). During this step, target metal ions (e.g., Pb²⁺, Cd²⁺) are reduced and concentrated into the mercury film, forming an amalgam [39].
- 4. Equilibration Step: Stirring is stopped, and the potential is maintained for a short period (10-30 seconds) to allow the solution to become quiescent and the deposited metal to distribute evenly in the mercury [39].
- 5. Stripping Step: The potential is swept anodically (toward more positive values) using a sensitive waveform like Square Wave Voltammetry. As the potential reaches the oxidation potential of each metal, it is stripped from the electrode, producing a sharp current peak. The peak current is proportional to the concentration of the metal in the solution [39].
Table 2: Exemplary ASV Experimental Data for Lead and Cadmium Determination
| Analyte | Supporting Electrolyte | Deposition Potential | Stripping Peak Potential (Approx.) | Reported Detection Limit |
|---|---|---|---|---|
| Lead (Pb²⁺) | 0.1 M HCl [43] | -1.0 V to -1.2 V | -0.4 V to -0.5 V | 1 ppb [43] |
| Cadmium (Cd²⁺) | 0.1 M HCl [43] | -1.0 V to -1.2 V | -0.6 V to -0.7 V | 1 ppb [43] |
Cyclic Voltammetric Stripping (CVS) for Additive Analysis
CVS is a specialized, industry-standard technique for monitoring organic additives in electroplating baths, crucial for ensuring deposit quality [41] [42].
- 1. Electrochemical Cell Setup: A standard three-electrode system is used, comprising a Platinum Rotating Disk Electrode (RDE) as the working electrode, a platinum counter electrode, and a stable reference electrode (e.g., Ag/AgCl) [41] [42].
- 2. Voltammogram Acquisition: The potential of the Pt RDE is cycled repeatedly between set negative and positive limits in the plating solution. A typical cycle includes:
- Plating Region: A negative-going potential where metal (e.g., copper) is deposited onto the Pt electrode.
- Stripping Region: A positive-going potential where the deposited metal is oxidized back into solution.
- Adsorption/Cleaning Region: A positive potential held to desorb organics and clean the electrode surface, ensuring reproducibility [41].
- 3. Data Analysis: The key measured parameter is the charge (in milliCoulombs, mC) required to strip the deposited metal, obtained by integrating the current under the anodic stripping peak. Organic additives (e.g., carriers/levelers) suppress the plating rate, decreasing the stripping peak area, while others (e.g., brighteners) can increase it [41]. Quantification is achieved by standard addition, spiking the production bath with a known amount of fresh additive and measuring the change in response.
The Scientist's Toolkit: Essential Reagents and Materials
Successful implementation of advanced voltammetric methods requires specific materials and reagents. Table 3 details a core toolkit for researchers.
Table 3: Essential Research Reagent Solutions and Materials for Voltammetry
| Item | Function and Importance |
|---|---|
| Glassy Carbon Electrode | A versatile, solid working electrode with a wide potential window, used for many organic and inorganic analytes [9]. |
| Platinum Rotating Disk Electrode (RDE) | Provides controlled hydrodynamics; essential for techniques like CVS to ensure reproducible mass transport [41] [42]. |
| Mercury Film Electrode (MFE) | The working electrode of choice for many ASV applications, as it forms amalgams with metals, leading to sharp, well-resolved stripping peaks [39]. |
| Ion-Selective Electrode | For potentiometric comparisons; used with a high-impedance potentiometer to measure ion activity without consumption [3]. |
| Supporting Electrolyte (e.g., KNO₃, KCl, HCl) | Minimizes solution resistance and ensures the current is limited by faradaic processes, not ohmic drop [43]. |
| Standard Solutions of Analytes | High-purity materials for preparing calibration standards and for standard addition methods. |
| Nanomaterial Modifiers (e.g., CNTs, Graphene) | Used to modify electrode surfaces to enhance sensitivity, selectivity, and stability by increasing surface area and catalytic activity [40]. |
Visualizing Voltammetric Workflows and Comparisons
The following diagrams illustrate the core logical workflows for ASV and the fundamental current-potential signatures of different voltammetric techniques, providing a visual summary of their operational principles.
Diagram 1: ASV Workflow vs. Potentiometry. This workflow highlights the key steps in Anodic Stripping Voltammetry (ASV), contrasting its consumptive nature with the non-consumptive, zero-current approach of potentiometry [39] [9] [3].
Diagram 2: Voltammetric Technique Signatures. This diagram conceptually represents the different potential inputs and characteristic current outputs for CV, DPV, and ASV, illustrating why DPV and ASV yield peak-shaped signals ideal for sensitive quantitative analysis [3] [39].
The selection of an advanced voltammetric method is dictated by the specific analytical problem. For mechanistic studies, Cyclic Voltammetry is unparalleled. When supreme sensitivity for electroactive organics is required, Differential Pulse or Square Wave Voltammetry are excellent choices. For the ultra-trace determination of metals, Anodic Stripping Voltammetry remains a gold standard, offering detection limits rivaling large, expensive instruments like ICP-MS but in a portable, cost-effective format [40] [39]. Finally, for niche industrial applications like electroplating bath control, Cyclic Voltammetric Stripping provides unique, process-relevant data.
When framed against potentiometry, voltammetry's primary strength is its remarkable sensitivity for trace analysis, albeit with consumption of the analyte. Potentiometry, with its zero-current measurement, is ideal for non-destructive, continuous monitoring of specific ions where extreme sensitivity is not the primary driver [9] [3]. The ongoing integration of novel nanomaterials and the development of robust, field-deployable instruments ensure that voltammetric techniques will continue to be vital tools for researchers and drug development professionals tackling the challenges of trace analysis.
In modern analytical science, the development of sensors with enhanced sensitivity is paramount for advancing fields ranging from clinical diagnostics to environmental monitoring. The core of this pursuit lies in the strategic application of novel materials—nanocomposites, conducting polymers, and biomimetic receptors—that fundamentally improve the interface between the sensor and the target analyte. These materials augment key performance parameters, notably the limit of detection (LOD) and selectivity, which are critical for detecting trace-level biomarkers or pollutants. The efficacy of these advanced materials is inherently linked to the electrochemical technique employed, with potentiometry and voltammetry representing two principal, yet fundamentally different, sensing paradigms. Potentiometry measures the potential difference at zero current, providing a direct readout of ion activity, while voltammetry measures current as a function of a controlled, changing potential, offering rich qualitative and quantitative information [3]. This article provides a comparative analysis of how novel materials are engineered to exploit the unique mechanisms of these techniques, thereby pushing the boundaries of sensing sensitivity for research and drug development professionals.
Performance Comparison: Material-Enhanced Potentiometry vs. Voltammetry
The integration of novel materials tailors the performance of potentiometric and voltammetric sensors for distinct applications. The following table summarizes the key attributes and enhancements brought by modern materials for each technique.
Table 1: Comparative performance of potentiometric and voltammetric sensors enhanced with novel materials.
| Feature | Potentiometry with Novel Materials | Voltammetry with Novel Materials |
|---|---|---|
| Core Principle | Measures potential at zero current; response governed by Nernst equation [3]. | Measures current as a function of applied potential [3]. |
| Typical LOD Range | Can achieve very low detection limits, suitable for ion activity in complex matrices [8]. | Extremely low LOD, especially with pulsed techniques (e.g., DPV, SWV) and stripping methods [44] [45]. |
| Key Material Innovations | Solid-contact layers (conducting polymers, carbon nanomaterials) to replace inner filling solution [8]. Nanocomposite transducers (e.g., MoS2/Fe3O4) to enhance capacitance and stability [8]. | Nanostructured electrodes (MOFs, graphene, CNTs) to increase surface area and electrocatalysis [46] [47]. Molecularly Imprinted Polymers (MIPs) for biomimetic recognition [46]. |
| Impact on Sensitivity & Selectivity | High selectivity from ionophores in the selective membrane [8]. Sensitivity maintained upon miniaturization; stability enhanced by nanomaterials reducing signal drift [8]. | Superior sensitivity from pre-concentration steps (e.g., stripping voltammetry) and low-background pulsed techniques [44] [45]. Selectivity from surface modification and applied potential. |
| Best-Suited Applications | Continuous monitoring of ions (e.g., K+, Na+) in biological fluids [8]. Wearable sensors for electrolytes [8]. Point-of-care testing with paper-based devices [8]. | Trace analysis of metals, pharmaceuticals, and organic pollutants [44] [45]. Detection of non-ionic molecules and biomarkers (e.g., cancer genes) [29]. |
Experimental Protocols and Data from Key Studies
Protocol 1: Enhancing Potentiometric Sensors with a Nanocomposite Solid Contact
A prominent study developed a solid-contact ion-selective electrode (SC-ISE) using a nanocomposite material to improve potential stability and sensitivity.
- Objective: To fabricate a stable potassium (K+) SC-ISE with a high capacitance solid-contact layer.
- Key Materials:
- Transducer Layer: A nanocomposite of Molybdenum Disulfide (MoS2) nanoflowers filled with Iron Oxide (Fe3O4) nanoparticles. The layered structure of MoS2 prevents the collapse of the structure and disperses the Fe3O4 nanoparticles, significantly enhancing the electrochemical characteristics and capacitance of the layer [8].
- Ion-Selective Membrane (ISM): A standard cocktail containing a K+ selective ionophore (e.g., valinomycin), a polymer matrix (e.g., PVC), a plasticizer, and a lipophilic salt [8].
- Methodology:
- The solid-contact layer was deposited on a gold or glassy carbon electrode substrate by drop-casting the suspension of the synthesized MoS2/Fe3O4 nanocomposite.
- The ion-selective membrane was then spin-coated or drop-casted onto the dried solid-contact layer.
- The sensor's performance was evaluated by measuring its potential response in a range of K+ standard solutions using a high-input impedance potentiometer versus a traditional reference electrode (e.g., Ag/AgCl) [8].
- Resulting Performance Data: The nanocomposite-based sensor demonstrated a stable potentiometric response with a Nernstian slope (approx. 59 mV/decade for K+). The enhanced capacitance of the solid contact minimized potential drift, leading to improved detection limits and long-term stability compared to sensors with a single-material transducer [8].
Table 2: Performance data for a nanocomposite-based solid-contact potentiometric sensor.
| Parameter | Performance with MoS2/Fe3O4 Nanocomposite |
|---|---|
| Linear Range | Typically 10^-5 to 10^-1 M (analyte-dependent) [8]. |
| Slope | ~59 mV/decade for monovalent ions [8]. |
| Detection Limit | Sub-micromolar levels, improved by stable baseline [8]. |
| Key Advantage | High capacitance from nanocomposite minimizes potential drift, enabling use in wearable, continuous monitoring [8]. |
Protocol 2: A MOF-Based Voltammetric Sensor for Environmental Pollutants
A 2025 study designed a highly sensitive voltammetric sensor for simultaneous detection of nitrophenol isomers, showcasing the power of material design and data processing.
- Objective: To simultaneously quantify 2-nitrophenol (2-NP) and 4-nitrophenol (4-NP) in binary mixtures using a modified electrode.
- Key Materials:
- Electrode Modifier: A multilayer nanocomposite consisting of Ni-MOF-74, Fe3O4/SiO2/NH2 core-shell nanoparticles, and β-cyclodextrin (β-CD). The MOF provided high surface area and unique interactions, while β-CD enhanced molecular recognition [47].
- Technique: Square-Wave Anodic Stripping Voltammetry (SWASV), which combines a pre-concentration step with a sensitive square-wave measurement [47].
- Methodology:
- A glassy carbon electrode (GCE) was polished and cleaned. The modifier suspension was drop-casted onto the GCE surface to create the Ni-MOF-74/Fe3O4/SiO2/NH2/β-CD/GCE.
- The sensor was immersed in a stirred sample solution containing both 2-NP and 4-NP, and a pre-concentration potential was applied to adsorb the analytes onto the modified surface.
- The square-wave voltammogram was recorded, generating overlapping signals for the two isomers.
- Due to the severe signal overlap, an Artificial Neural Network (ANN) was trained using the voltammetric data to deconvolute and accurately predict the concentration of each nitrophenol in the mixture [47].
- Resulting Performance Data: The integrated system of advanced materials and ANN processing successfully resolved the overlapping signals. The sensor demonstrated high calibration accuracy (R² = 0.9302 for 2-NP and 0.9604 for 4-NP) across a broad dynamic range, suitable for monitoring these pollutants at levels below the regulatory limit of 20 ppb [47].
Signaling Pathways and Experimental Workflows
The fundamental operational principles of potentiometric and voltammetric sensors, and the role of materials within them, can be visualized as distinct signaling pathways. The following diagram illustrates the key steps for a material-enhanced sensor, from sample contact to analytical readout.
Diagram 1: Signaling pathways for material-enhanced electrochemical sensors. This flowchart contrasts the core signaling pathways for potentiometric (Path A) and voltammetric (Path B) sensors. Both begin with analyte recognition at a specialized material interface, but diverge in their transduction mechanism and final readout.
The Scientist's Toolkit: Essential Research Reagents and Materials
The development and fabrication of high-sensitivity sensors rely on a core set of functional materials and reagents.
Table 3: Key research reagents and materials for developing novel electrochemical sensors.
| Reagent/Material | Function in Sensor Development | Exemplary Use Cases |
|---|---|---|
| Conducting Polymers (e.g., PEDOT:PSS, PANI, PPy) | Act as ion-to-electron transducers in solid-contact ISEs; provide a biocompatible, conductive matrix for immobilization [8] [46] [48]. | Stabilizing the potential in potentiometric sensors; serving as a scaffold for biomolecules in voltammetric biosensors [8] [48]. |
| Carbon Nanomaterials (CNTs, Graphene) | Enhance electrical conductivity and surface area; often used in nanocomposites to facilitate electron transfer and increase capacitance [8] [46]. | Component of solid-contact layers in ISEs; modifier for glassy carbon electrodes in voltammetry to lower LOD [8] [46]. |
| Metal-Organic Frameworks (MOFs) | Provide extremely high surface area and tunable porosity for analyte preconcentration; can offer catalytic activity [47]. | Electrode modifier for selective adsorption and detection of trace organics and gases in voltammetry [47]. |
| Molecularly Imprinted Polymers (MIPs) | Create synthetic, biomimetic recognition sites with high affinity for a specific target molecule (e.g., drugs, pesticides) [46]. | Selective layer in potentiometric sensors or as a pre-concentrating agent on voltammetric electrodes [46]. |
| Ionophores | Selective ion-recognition elements embedded in the membrane of potentiometric sensors [8]. | Key component for imparting selectivity to ion-selective electrodes (e.g., valinomycin for K+) [8]. |
| Biomimetic Polymers (e.g., PVDF-HFP) | Exhibit piezoelectric and capacitive properties, mimicking biological mechanoreceptors [49]. | Developing dual-sensing materials for wearable devices that respond to both slow and fast pressure fluctuations [49]. |
The strategic integration of novel materials is unequivocally enhancing the sensitivity of both potentiometric and voltammetric sensors, albeit through different mechanistic pathways. The choice between techniques is guided by the analytical problem: potentiometry, enhanced with stable solid-contact materials, excels in decentralized, continuous monitoring of ionic species. In contrast, voltammetry, supercharged with nanostructured modifiers and sophisticated data processing like ANN, achieves unparalleled sensitivity for the trace-level detection of a wider range of electroactive species. The future of electrochemical sensing lies in the intelligent design of multifunctional materials—such as the dual-sensing PVDF-HFP/CB nanocomposite [49]—and the fusion of these materials with artificial intelligence to create sensors that are not only highly sensitive and selective but also intelligent and adaptive to complex real-world environments.
In clinical diagnostics and pharmaceutical development, the accurate measurement of biomarkers and drug concentrations is paramount for effective disease diagnosis, therapeutic drug monitoring (TDM), and personalized medicine. Electrochemical sensing techniques, particularly potentiometry and voltammetry, have emerged as powerful tools for this purpose, offering distinct advantages and limitations. Potentiometry measures the potential difference between two electrodes at near-zero current, following the Nernst equation, which relates potential to the logarithm of ion activity [8] [3]. In contrast, voltammetry is a dynamic technique that applies a potential sweep or pulse to a working electrode and measures the resulting current, providing both quantitative and qualitative information about electroactive species [3] [45]. The selection between these methods often hinges on the specific sensitivity requirements of the application, which can range from monitoring trace-level pharmaceuticals with narrow therapeutic indices to detecting disease biomarkers in complex biological matrices. This guide provides a systematic comparison of their performance, supported by experimental data and detailed protocols, to inform researchers and drug development professionals.
Fundamental Principles and Comparative Advantages
Core Operational Principles
The fundamental difference between these techniques lies in what they measure.
- Potentiometry is a zero-current technique that measures the stable potential (voltage) across an ion-selective membrane. This potential is logarithmically related to the target ion's activity, as described by the Nernst equation [3] [50]. Its primary strength lies in direct ion activity measurement.
- Voltammetry is a controlled-potential technique that applies a varying potential and measures the resulting faradaic current generated by the reduction or oxidation of an analyte. This current is directly proportional to the concentration of the analyte in the solution, enabling highly sensitive detection of a wide range of electroactive species [3] [45].
Inherent Advantages and Limitations
Each technique offers a unique profile of benefits and constraints, making them suitable for different analytical scenarios.
Potentiometry:
- Advantages: Simple instrumentation, suitability for continuous and real-time monitoring, insensitivity to sample color or turbidity, high selectivity for specific ions when using tailored ionophores, and compatibility with miniaturized and solid-contact designs for wearable sensors [8] [3].
- Limitations: Generally higher detection limits compared to voltammetry, primarily limited to ionic analytes, and potential signal drift from reference electrode instability [8] [45].
Voltammetry:
- Advantages: Exceptionally low detection limits (down to nanomolar and picomolar levels), ability to study redox reaction mechanisms and kinetics, and capability for multiplexed detection of several analytes in a single run using techniques like differential pulse voltammetry (DPV) and square wave voltammetry (SWV) [15] [3] [51].
- Limitations: More complex instrumentation, susceptibility to electrode fouling in complex matrices, and potential interference from other electroactive species present in the sample [45] [51].
Quantitative Performance Comparison
The following tables summarize key sensitivity parameters for both techniques across clinical and pharmaceutical applications, based on recent experimental data.
Table 1: Sensitivity Performance of Potentiometric Sensors in Bioanalysis
| Target Analyte | Sample Matrix | Linear Range | Detection Limit | Sensitivity (Nernstian Slope) | Key Material/Technique |
|---|---|---|---|---|---|
| Ca²⁺ [17] | Interstitial Fluid (Simulated) | 0.1 mM – 1 mM | Not Specified | 20 ± 0.3 mV/decade | BAPTA-based conductive copolymer |
| Ca²⁺ [17] | Aqueous Solution | 10⁻⁴ – 10⁻¹ M | Not Specified | 37.7 mV/decade | PEDOT:PSS polymer layer |
| Hg²⁺ [18] | Aqueous Solution | 10⁻⁶ – 10⁻¹ M | Not Specified | 33.0 mV/decade | WS₂-WO₃/P2ABT Nanocomposite |
Table 2: Sensitivity Performance of Voltammetric Sensors in Bioanalysis
| Target Analyte | Sample Matrix | Linear Range | Detection Limit | Sensitivity (Current) | Key Material/Technique |
|---|---|---|---|---|---|
| Thymoquinone [15] | Nigella Sativa Oil | Not Specified | 8.9 nmol·L⁻¹ (LOD) | Based on peak current height | Square-Wave Voltammetry (Oxidation) |
| Tryptophan/Tryptamine [51] | Saliva/Serum | Sub-nanomolar | Sub-nanomolar | Signal amplification via nanomaterials | CNTs/Gr with Metal Nanoparticles |
| Hg²⁺ [18] | Aqueous Solution | 10⁻⁶ – 10⁻¹ M | Not Specified | 2.4 μA M⁻¹ | WS₂-WO₃/P2ABT Nanocomposite, CV |
Experimental Protocols for Sensitivity Assessment
Potentiometric Sensor Protocol for Ion Detection
The following workflow outlines a standard procedure for developing a solid-contact potentiometric sensor, exemplified by a calcium ion sensor for detecting inflammation [17].
Title: Potentiometric Sensor Development Workflow
Detailed Methodology:
- Sensor Fabrication: A solid-contact ion-selective electrode is fabricated. This often involves electrochemically polymerizing a conductive monomer solution onto a solid substrate (e.g., gold, glassy carbon). For a Ca²⁺ sensor, the monomer may be a 2,2'-bithiophene (BT) derivative copolymerized with a selective ionophore like BAPTA [17].
- Measurement & Calibration: The fabricated sensor and a stable reference electrode (e.g., Ag/AgCl) are immersed in standard solutions with known concentrations of the target ion. The potential (EMF) is measured under zero-current conditions for each solution [8] [50].
- Data Analysis: The measured potential is plotted against the logarithm of the ion activity. A linear regression is performed on the data. The slope of the line (ideally close to the theoretical Nernstian slope of ~29.6 mV/decade for a divalent ion at 25°C) and the lower limit of detection (LOD), determined by the intersection of the linear slopes, are key performance metrics [17].
- Selectivity Assessment: The sensor's selectivity is critically evaluated against potentially interfering ions (e.g., Mg²⁺ for a Ca²⁺ sensor) using methods like the Separate Solution Method (SSM) or Fixed Interference Method (FIM). The selectivity coefficient (log K) is calculated, where a more negative value indicates higher selectivity for the primary ion [17].
Voltammetric Sensor Protocol for Molecular Detection
This protocol describes a voltammetric approach for detecting specific molecules, such as thymoquinone in pharmaceutical products [15].
Title: Voltammetric Analysis Workflow
Detailed Methodology:
- Electrode and Sample Preparation: A three-electrode system is used: a working electrode (e.g., a carbon paste electrode (CPE)), a reference electrode (e.g., Ag/AgCl), and a counter electrode (e.g., platinum wire) [15]. The working electrode is polished and cleaned. The sample is diluted in a suitable supporting electrolyte.
- Measurement: A voltammetric technique such as Square-Wave Voltammetry (SWV) is employed. A series of potential pulses is applied to the working electrode, and the faradaic current is measured at the end of each pulse [15].
- Signal Processing: The resulting voltammogram displays peaks where oxidation or reduction occurs. The analytical signal (peak current height or peak area) is extracted [15].
- Quantification and LOD Calculation: A calibration curve is constructed by plotting the peak signal against analyte concentration. The Limit of Detection (LOD) and Limit of Quantification (LOQ) are calculated using the formulas LOD = 3.3σ/S and LOQ = 10σ/S, where σ is the standard deviation of the blank response and S is the slope of the calibration curve [15].
Essential Research Reagent Solutions
The performance of both potentiometric and voltammetric sensors is heavily dependent on the materials used for electrode modification and recognition. The table below lists key reagents and their functions.
Table 3: Key Reagents and Materials for Electrochemical Sensor Development
| Reagent/Material | Function in Sensor | Application Examples |
|---|---|---|
| Ionophores (e.g., BAPTA) [17] | Selectively binds to a target ion in the membrane, imparting selectivity. | Ca²⁺ sensing in potentiometry. |
| Conducting Polymers (e.g., PEDOT:PSS, Polythiophene) [8] [17] | Acts as an ion-to-electron transducer in solid-contact electrodes; stabilizes potential. | Solid-contact layer in SC-ISEs. |
| Carbon Nanomaterials (CNTs, Graphene) [8] [51] | Enhances electron transfer kinetics, increases surface area, and lowers overpotential. | Voltammetric sensors for Trp/Tryp; transducer material in SC-ISEs. |
| Metal Nanoparticles (Ni, Co) [51] | Provides catalytic activity, amplifies electrochemical signals, and improves sensitivity. | Functionalization of carbon electrodes in voltammetry. |
| Molecularly Imprinted Polymers (MIPs) [51] | Creates synthetic recognition sites for a specific molecule, enabling selectivity for non-ionic analytes. | Detection of pharmaceuticals and biomarkers in voltammetry/potentiometry. |
The choice between potentiometry and voltammetry is application-dependent. Potentiometry is the technique of choice for the direct, continuous, and selective monitoring of specific ions (e.g., electrolytes like Ca²⁺, K⁺, Na⁺) in complex biological samples, and is ideally suited for wearable sensors and point-of-care devices where simplicity and form factor are critical [8] [52]. Voltammetry is superior when ultra-high sensitivity is required for the detection of trace-level pharmaceuticals, drugs of abuse, or specific biomarkers (e.g., tryptophan, thymoquinone) that are electroactive, making it indispensable for TDM of drugs with narrow therapeutic indices and early disease diagnosis [15] [51].
For researchers implementing these methods, the decision pathway is clear: Select potentiometry for robust, continuous ion monitoring. Opt for voltammetry when pursuing the lowest possible detection limits for molecular analytes. Future advancements in nanomaterials, artificial intelligence for data analysis, and the fusion of both techniques in integrated systems will further push the boundaries of sensitivity and specificity in clinical and pharmaceutical analysis [45] [51].
The field of electroanalysis is undergoing a transformative shift, driven by innovations in sensor design and fabrication that are creating new paradigms for chemical detection and biomedical monitoring. For researchers and drug development professionals, selecting the appropriate sensing platform and electrochemical technique is critical for achieving desired analytical performance in applications ranging from pharmaceutical quality control to personalized therapeutics. This guide provides an objective comparison of three emerging platforms—wearable sensors, paper-based devices, and 3D-printed electrodes—with a specific focus on their performance within the context of sensitivity comparisons between potentiometry and voltammetry. These platforms represent distinct approaches to modern analytical challenges, each with unique advantages in sensitivity, manufacturing scalability, and application suitability. By examining experimental data and detailed methodologies, this review aims to equip scientists with the necessary information to select optimal platforms for their specific research needs in pharmaceutical development and bioanalysis.
The evolution of electrochemical sensing platforms has expanded the toolbox available to researchers, with each platform offering distinct advantages for specific application contexts. Wearable sensors have gained significant traction for their ability to provide continuous, real-time physiological monitoring, with the market projected to reach USD 7.2 billion by 2035 [53]. These devices are particularly valuable for therapeutic drug monitoring and tracking cardiovascular health through parameters like electrocardiograms and pulse wave velocity [54]. Paper-based analytical devices represent a sustainable and cost-effective approach for point-of-care testing and environmental monitoring, with recent advances focusing on electrochemical detection for pharmaceutical analysis [55]. 3D-printed electrodes offer unprecedented design flexibility and rapid prototyping capabilities, enabling the creation of customized geometries that enhance sensor performance for diagnostic applications [56].
Each platform exhibits different affinity for the primary electrochemical techniques discussed in this review. Voltammetry generally demonstrates superior sensitivity across platforms, particularly for trace analysis, while potentiometry offers advantages in simplicity and ion-selective monitoring. The following sections provide a detailed examination of each platform's performance characteristics, supported by experimental data and methodological protocols.
Sensitivity Comparison: Potentiometry vs. Voltammetry
Sensitivity is a paramount consideration in selecting electrochemical techniques for pharmaceutical analysis and biomarker detection. Both potentiometry and voltammetry offer distinct advantages and limitations across different sensing platforms, which are quantified in the table below.
Table 1: Sensitivity Performance Comparison of Potentiometry and Voltammetry Across Platforms
| Platform | Technique | Analyte | Linear Range | Detection Limit | Key Advantages |
|---|---|---|---|---|---|
| Wearable Sensors | Voltammetry (SWV) | miRNA-4676 | 0.001-400 nM | 1 pM | Picomolar detection for disease biomarkers [56] |
| Paper-Based Devices | Voltammetry (SWV) | Thymoquinone | 8.9 nmol·L⁻¹ (LOD) | 29.8 nmol·L⁻¹ (LOQ) | Cost-effective pharmaceutical analysis [15] |
| 3D-Printed Electrodes | Voltammetry (SWV) | miRNA-4676 | 0.001-400 nM | 1 pM | Custom geometries enhance sensitivity [56] |
| Wearable Sensors | Potentiometry | Cu(II) ions | 1×10⁻⁷-1×10⁻¹ mol·L⁻¹ | 5.0×10⁻⁸ mol·L⁻¹ | Selective ion monitoring [11] |
| Conventional Electrodes | Potentiometry | Cu(II) ions | 1×10⁻⁷-1×10⁻¹ mol·L⁻¹ | 5.0×10⁻⁸ mol·L⁻¹ | Wide linear range for metal ions [11] |
The data reveals that voltammetry consistently achieves lower detection limits compared to potentiometry across platforms, with square-wave voltammetry (SWV) enabling detection down to picomolar concentrations for specific biomarkers like miRNA [56]. This exceptional sensitivity makes voltammetry particularly valuable for diagnostic applications where early disease detection requires measurement of trace biomarkers. In contrast, potentiometry provides a wider linear range for ion-selective applications, as demonstrated in the detection of Cu(II) ions across seven orders of magnitude [11], making it suitable for environmental monitoring and quality control where analyte concentrations may vary significantly.
The choice between techniques involves important trade-offs. Voltammetric methods generally offer superior sensitivity and the ability to detect multiple analytes simultaneously but may require more complex instrumentation and data interpretation. Potentiometric sensors provide simplicity, real-time monitoring capabilities, and lower power consumption—particularly advantageous for wearable applications—but with typically higher detection limits and primarily ion-selective response [45]. For pharmaceutical professionals, this balance must be weighed against specific application requirements, with voltammetry preferred for trace analysis and potentiometry better suited for continuous ion monitoring.
Experimental Protocols and Methodologies
Voltammetric Protocol for Pharmaceutical Compound Analysis
The exceptional sensitivity of voltammetry for pharmaceutical analysis is demonstrated in a recent protocol for thymoquinone quantification in Nigella sativa products [15]. This method showcases the technique's capability for sensitive compound detection in complex matrices.
Table 2: Key Reagents for Voltammetric Analysis of Thymoquinone
| Reagent/Material | Function | Specifications |
|---|---|---|
| Carbon Paste Electrode | Working electrode | Graphite powder and paraffin oil (1.0 g:0.3 mL) |
| Thymoquinone Standard | Analytic | Dissolved in distilled water |
| Britton-Robinson Buffer | Supporting electrolyte | pH 2.0-6.0 |
| Platinum Wire | Auxiliary electrode | - |
| Ag/AgCl Electrode | Reference electrode | 3 mol·L⁻¹ KCl |
Experimental Workflow:
- Electrode Preparation: Prepare carbon paste electrode by thoroughly mixing graphite powder with paraffin oil in a 1.0g:0.3mL ratio [15].
- Sample Preparation: Dissolve thymoquinone standard in distilled water (note: complete dissolution requires approximately two days). Prepare working solutions through appropriate dilution of stock solution [15].
- Measurement Parameters: Utilize square-wave voltammetry with optimized parameters. The oxidation peak current height provides the broadest linear range for quantification [15].
- Calibration: Construct calibration curve based on thymoquinone peak current height, establishing linear range with LOD of 8.9 nmol·L⁻¹ and LOQ of 29.8 nmol·L⁻¹ [15].
- Validation: Validate method through analysis of real samples including Nigella sativa seed oil and dietary supplements, with correlation to HPLC reference method [15].
This protocol highlights how voltammetry, particularly square-wave voltammetry, achieves superior sensitivity for pharmaceutical compounds compared to traditional methods, with the additional advantage of minimal sample preparation requirements.
Potentiometric Protocol for Ion-Selective Detection
Potentiometric sensors offer robust ion-selective detection with wide linear ranges, as demonstrated in a protocol for Cu(II) ion determination using a modified carbon paste electrode [11].
Table 3: Key Reagents for Potentiometric Cu(II) Detection
| Reagent/Material | Function | Specifications |
|---|---|---|
| Graphite Powder | Electrode base material | Synthetic 1-2 μm |
| Schiff Base Ligand | Ionophore | 2-(((3-aminophenyl)imino)methyl)phenol |
| o-NPOE | Plasticizer | - |
| Silver Paint | Reference electrode component | - |
| CuSO₄·5H₂O | Analytic standard | - |
Experimental Workflow:
- Schiff Base Synthesis: Conduct condensation reaction between m-phenylenediamine (129.4 mmol, 14 g) and 2-hydroxybenzaldehyde (129.4 mmol, 15.8 g) in ethanol under reflux for three hours [11].
- Electrode Preparation: Mix 250 mg graphite powder with 5-20 mg ionophore and 0.1 mL plasticizer (o-NPOE) thoroughly. Store modified paste in distilled water for 24 hours before use [11].
- Electrode Assembly: Fill prepared paste into Teflon holder electrode body. Establish electrical contact with stainless steel rod. Polish fresh surface on filter paper [11].
- Measurement: Measure potential using double-junction Ag/AgCl reference electrode. Electrode exhibits Nernstian slope of 29.571 ± 0.8 mV/decade across linear range of 1×10⁻⁷-1×10⁻¹ mol·L⁻¹ [11].
- Validation: Apply to real samples (water, multivitamin, vegetable foliar) using direct or standard addition methods. Compare results with atomic absorption spectroscopy [11].
This protocol demonstrates how potentiometric sensors provide excellent selectivity for specific ions like Cu(II) with a wide linear response range, making them suitable for environmental monitoring and pharmaceutical quality control where ion concentrations may vary significantly.
Platform-Specific Technical Performances
Wearable Sensing Platforms
Wearable sensors have evolved significantly, with recent advances focusing on multimodal monitoring for comprehensive health assessment. These platforms increasingly incorporate both physical and biochemical sensors to provide complementary data streams [54].
Technical Performance Characteristics:
- Physical Sensors: Optical PPG sensors can monitor cardiovascular parameters including heart rate, oxygen saturation, and pulse wave velocity. Reflection-mode PPG sensors dominate wrist-worn devices but offer lower signal-to-noise ratio compared to transmission-mode sensors used in clinical settings [54].
- Biochemical Sensors: Emerging wearable electrochemical sensors can detect biomarkers in sweat, saliva, and tears, including glucose, lactate, cholesterol, and cardiac enzymes [54]. These increasingly employ voltammetric techniques for their sensitivity in detecting multiple biomarkers simultaneously.
- Flexible Electronics: Ultra-thin, flexible designs (as thin as 3 μm) improve skin conformity and signal quality by minimizing motion artifacts [54]. Materials innovation includes organic semiconductors with responsivity up to 0.5 A/W in NIR region [54].
For pharmaceutical development, wearable sensors offer particular promise for clinical trials, enabling continuous therapeutic drug monitoring rather than sporadic sampling. This provides more comprehensive pharmacokinetic profiles and better assessment of patient adherence [53].
Paper-Based Electrochemical Devices
Paper-based analytical devices represent a rapidly advancing field, particularly for point-of-care diagnostic applications in resource-limited settings. Recent innovations have focused on enhancing their sensitivity and specificity for pharmaceutical analysis [55].
Technical Performance Characteristics:
- Manufacturing: Wax printing and inkjet deposition techniques enable rapid, cost-effective device fabrication [55].
- Fluid Control: Capillary action within cellulose matrices provides passive pumping, eliminating need for external power sources [55].
- Sensitivity Enhancement: Incorporation of nanomaterials improves detection limits, with recent devices achieving nanomolar to picomolar detection ranges for various pharmaceuticals [55] [45].
- Analytical Applications: Particularly suited for drug quality control, environmental monitoring of pharmaceutical residues, and therapeutic drug monitoring [55].
Paper-based devices predominantly utilize voltammetric techniques due to their superior sensitivity for pharmaceutical compounds, with square-wave and differential pulse voltammetry providing the lowest detection limits [55] [45].
3D-Printed Electrochemical Platforms
3D printing technology has revolutionized electrode fabrication through design flexibility, material efficiency, and rapid prototyping capabilities. Fused Filament Fabrication (FFF) using conductive thermoplastics like carbon black/PLA enables complete electrochemical system production in a single print [56].
Technical Performance Characteristics:
- Design Flexibility: Enables creation of complex geometries not achievable with traditional electrodes, including microwell integration and custom electrode configurations [56].
- Performance: 3D-printed electrodes can achieve detection limits comparable to conventional systems, with demonstrated picomolar detection of miRNA biomarkers for lung cancer [56].
- Material Considerations: CB/PLA filaments require precise parameter tuning (extruder: 230°C, print bed: 50°C, layer thickness: 0.1 mm) for optimal performance [56].
- Applications: Particularly valuable for diagnostic applications requiring customized form factors, with demonstrated success in miRNA detection using square-wave voltammetry [56].
Table 4: 3D-Printed Electrode Performance in miRNA Detection
| Parameter | Performance | Measurement Conditions |
|---|---|---|
| Detection Principle | Hybridization with MB-labeled DNA probe | Signal-OFF detection |
| Linear Range | 0.001 to 400 nM | Square-wave voltammetry |
| Detection Limit | 1 pM | Potential range: 0.05 to -0.6 V |
| Selectivity | High for target miRNA vs. control sequences | Amplitude: 0.01 V, Frequency: 50 Hz |
Research Reagent Solutions
Successful implementation of electrochemical sensing platforms requires specific materials and reagents optimized for each approach. The following table details essential research reagents and their functions across the featured platforms.
Table 5: Essential Research Reagents for Electrochemical Sensing Platforms
| Category | Specific Reagent | Function | Platform Applicability |
|---|---|---|---|
| Electrode Materials | Carbon Paste (Graphite:Paraffin oil) | Working electrode substrate | Paper-based, Conventional |
| CB/PLA Filament | 3D printing conductive material | 3D-Printed Electrodes | |
| Silver/Silver Chloride | Reference electrode | All platforms | |
| Recognition Elements | Schiff Base Ligands | Ionophore for ion-selective detection | Potentiometric Sensors |
| DNA Probes (MB-labeled) | Recognition element for miRNA | 3D-Printed, Voltammetric | |
| Electrochemical Mediators | Methylene Blue (MB) | Redox mediator for hybridization assays | Voltammetric Platforms |
| Ferricyanide | Redox probe for system characterization | All platforms | |
| Sample Processing | Britton-Robinson Buffer | Supporting electrolyte | Pharmaceutical Analysis |
| Potassium Chloride | Supporting electrolyte | All platforms |
These reagents form the foundation for developing sensitive and selective electrochemical sensors across platforms. Researchers should select reagents based on their specific analytical goals, with voltammetric applications requiring redox mediators and potentiometric systems benefiting from highly selective ionophores.
The comparative analysis of wearable sensors, paper-based devices, and 3D-printed electrodes reveals a dynamic landscape in electrochemical sensing, with each platform offering distinct advantages for pharmaceutical research and drug development. Voltammetry consistently demonstrates superior sensitivity across platforms, achieving detection limits up to picomolar ranges for critical biomarkers, making it indispensable for trace analysis and early disease detection. Potentiometry provides robust ion-selective monitoring with wider linear ranges, offering advantages for continuous physiological monitoring and environmental sensing. Platform selection remains application-dependent, with wearable sensors excelling in continuous physiological monitoring, paper-based devices offering cost-effective point-of-care solutions, and 3D-printed electrodes enabling customized diagnostic platforms through rapid prototyping. As these technologies continue to converge with advancements in nanomaterials, artificial intelligence, and flexible electronics, researchers can expect further enhancements in sensitivity, selectivity, and functionality across all platforms. For drug development professionals, understanding these performance characteristics and methodological approaches enables informed selection of optimal sensing strategies for specific research needs, ultimately accelerating pharmaceutical development and improving patient outcomes through enhanced analytical capabilities.
Maximizing Performance: Sensitivity Enhancement and Interference Management
Ion-selective electrodes (ISEs) are fundamental tools in modern analytical chemistry, enabling the precise quantification of specific ions in diverse samples, from pharmaceutical formulations to environmental samples. A critical design aspect of these sensors is their internal configuration, primarily categorized into liquid-contact and solid-contact systems. Liquid-contact ISEs (LC-ISEs) represent the traditional design, featuring an internal filling solution that mediates the ionic-to-electronic signal transduction. In contrast, solid-contact ISEs (SC-ISEs) eliminate this liquid component, employing a solid material layer to facilitate this charge transfer. The choice between these configurations profoundly impacts the sensor's analytical performance, stability, and suitability for specific applications. This guide provides an objective, data-driven comparison of these two designs, focusing on their performance characteristics, underlying mechanisms, and optimal use cases within the broader context of electrochemical sensing techniques.
The evolution from liquid-contact to solid-contact designs has been driven by the need for more robust, stable, and miniaturizable sensors. While LC-ISEs have been the workhorse for decades, offering well-understood behavior and reliable performance, they possess inherent limitations related to their construction. SC-ISEs have emerged to address these limitations, promising enhanced stability, simpler construction, and better suitability for miniaturization and field-deployable devices. Understanding the comparative advantages and drawbacks of each system is essential for researchers and professionals in drug development, environmental monitoring, and clinical analysis to select the optimal sensor configuration for their specific needs.
Comparative Performance Analysis: Key Experimental Data
Direct comparative studies provide the most compelling evidence for the performance differences between solid-contact and liquid-contact configurations. The data, summarized in the table below, reveals consistent trends across multiple applications and target analytes.
Table 1: Performance Comparison of Solid-Contact vs. Liquid-Contact Ion-Selective Electrodes
| Analyte | Electrode Type | Linear Dynamic Range (mol L⁻¹) | Slope (mV/decade) | Detection Limit (mol L⁻¹) | Reference |
|---|---|---|---|---|---|
| Benzalkonium Chloride | Solid Contact (Ag-coated) | (2.0 \times 10^{-8} ) to ( 1.0 \times 10^{-2} ) | 60.0 ± 0.3 | ( 2.0 \times 10^{-8} ) | [57] |
| Benzalkonium Chloride | Liquid Contact (PVC membrane) | (2.0 \times 10^{-7} ) to ( 1.0 \times 10^{-2} ) | 55.0 ± 1.2 | ( 1.5 \times 10^{-7} ) | [57] |
| Letrozole | Solid Contact (PANI nanoparticle) | (1.00 \times 10^{-8} ) to ( 1.00 \times 10^{-3} ) | 20.30 | Not Specified | [58] |
| Letrozole | Liquid Contact (TBCAX-8) | (1.00 \times 10^{-5} ) to ( 1.00 \times 10^{-2} ) | 19.90 | Not Specified | [58] |
| Copper (II) | Solid Contact (Graphite/Schiff base) | (1 \times 10^{-7} ) to ( 1 \times 10^{-1} ) | 29.57 ± 0.8 | ( 5.0 \times 10^{-8} ) | [11] |
| Lead (II) | Solid Contact (PEDOT) | (10^{-3} ) to ( 10^{-6} ) (activity) | ~Nernstian | ~ ( 10^{-7} ) | [59] |
| Lead (II) | Coated Wire | (10^{-3} ) to ( 10^{-5} ) (activity) | ~Nernstian | ~ ( 10^{-5} ) | [59] |
A study on benzalkonium chloride (BzCl) sensors provides a direct, head-to-head comparison. The solid-contact electrode exhibited a lower detection limit by an order of magnitude ((2.0 \times 10^{-8}) M) compared to the liquid-contact design ((1.5 \times 10^{-7}) M) [57]. This improvement is attributed to diminished ion fluxes in the solid-contact architecture, which prevent the extraction of the primary ion and its counterions from the inner filling solution into the membrane—a process that can degrade the detection limit in traditional LC-ISEs [57]. Furthermore, the solid-contact electrode demonstrated a wider linear dynamic range, extending further into lower concentrations.
This trend is corroborated by research on sensors for the anticancer drug Letrozole. A solid-contact electrode modified with polyaniline (PANI) nanoparticles showed a linear response range extending three orders of magnitude lower ((10^{-8}) to (10^{-3}) M) than a conventional liquid-contact sensor based on a calixarene ionophore ((10^{-5}) to (10^{-2}) M) [58]. The superior performance of solid-contact designs is also evident in their enhanced potential stability. A comparative study on lead-selective electrodes found that sensors with conducting polymer contacts (e.g., PEDOT) exhibited superior within-day and between-days potential stability compared to coated wire (a simple type of solid contact) and hydrogel-contact electrodes [59].
Mechanisms and Experimental Protocols
Fundamental Working Principles
The core function of any ion-selective electrode is to convert the activity of a specific ion in solution into a measurable electrical potential. The fundamental difference between the two configurations lies in the mechanism of signal transduction at the inner side of the ion-selective membrane (ISM).
Liquid-Contact ISEs feature a hydrophobic polymeric membrane, impregnated with an ionophore and plasticizer, which separates the sample solution from an internal reference electrolyte (filling solution). A reference element (e.g., an Ag/AgCl wire) is immersed in this filling solution. The potential is established by the equilibrium at the membrane-sample interface and the constant potential provided by the internal reference element [60]. However, this design has inherent drawbacks, including the evaporation and osmotic flow of the inner solution, which can lead to instability and a limited operational lifetime [60].
Solid-Contact ISEs eliminate the inner solution by placing a solid conductive material between the ion-selective membrane and the electron-conducting substrate (e.g., a metal wire or glassy carbon). This solid-contact layer must perform a dual function: it acts as an ion-to-electron transducer, and it provides a high intrinsic capacitance to ensure a stable potential [60]. Common materials for this layer include conducting polymers (e.g., poly(3,4-ethylenedioxythiophene) - PEDOT, polyaniline - PANI) [59] [58] and carbon-based nanomaterials (e.g., graphene, graphene nanocomposite - GNC) [58]. The high hydrophobicity of some materials, such as polyoctylthiophene (POT), also helps prevent the formation of a detrimental water layer between the membrane and the substrate, which is a known source of potential drift [59] [61].
Detailed Experimental Protocol for Fabrication and Conditioning
The performance of an ISE is highly dependent on a meticulous fabrication and conditioning process. Below is a generalized protocol for creating and optimizing a solid-contact ISE, based on methodologies described in the search results.
Fabrication of a Solid-Contact ISE with Conducting Polymer [59] [58] [61]:
- Substrate Preparation: Begin with a conductive substrate such as a glassy carbon electrode, a gold-sputtered copper electrode, or a simple graphite rod. The surface should be polished and cleaned according to standard electrochemical procedures.
- Application of Solid-Contact Layer:
- Conducting Polymer (e.g., PEDOT, PANI): The polymer layer can be applied by drop-casting a commercial aqueous dispersion (e.g., Baytron P for PEDOT) or a solution of a soluble polymer (e.g., polyoctylthiophene in chloroform) onto the substrate. This is typically done in multiple layers, allowing the solvent to dry between applications. Alternatively, electrochemical polymerization can be used for a more controlled deposition [59].
- Carbon Nanomaterial (e.g., Graphene Nanocomposite - GNC): Disperse the nanomaterial (e.g., 10 mg) in an organic solvent (e.g., xylene) and sonicate. Separately, dissolve the polymer matrix (e.g., PVC) in tetrahydrofuran (THF) with a plasticizer. Mix the two solutions thoroughly and sonicate to create a homogeneous cocktail [58].
- Membrane Cocktail Preparation: In a glass vial, combine the required components by mass:
- Polymer matrix (e.g., PVC or a plasticizer-free copolymer like MMA-DMA): ~30-33%
- Plasticizer (e.g., DOS, DOP, o-NPOE): ~60-65%
- Ionophore (specific to the target ion): ~1-2%
- Lipophilic additive (e.g., NaTFPB): ~0.5-1%
- Dissolve these components in a volatile organic solvent (e.g., THF, cyclohexanone) to create a homogeneous cocktail.
- Membrane Deposition: Drop-cast the membrane cocktail directly onto the prepared solid-contact layer. The solvent is allowed to evaporate slowly, often over several hours or under a glass cover, to form a dense, homogeneous membrane with a typical thickness of 200-300 µm.
- Conditioning: This critical step equilibrates the membrane. The newly fabricated electrode is soaked in a solution of the primary ion. The concentration and duration of conditioning can be optimized to achieve the best detection limit. For example, a protocol might involve conditioning in a (10^{-3}) M primary ion solution for 24 hours, followed by a second conditioning step in a more dilute solution (e.g., (10^{-6}) to (10^{-9}) M) for another 24-48 hours [61].
The Scientist's Toolkit: Essential Research Reagents
The construction and performance of ion-selective electrodes rely on a specific set of chemical components, each serving a critical function.
Table 2: Key Reagents and Materials for Fabricating Ion-Selective Electrodes
| Component Category | Specific Examples | Function | Key References |
|---|---|---|---|
| Polymer Matrices | Polyvinyl Chloride (PVC), Poly(methyl methacrylate-decyl methacrylate) (MMA-DMA) | Serves as the structural backbone of the sensing membrane, providing mechanical stability. | [57] [61] |
| Plasticizers | Dioctyl phthalate (DOP), Dibutyl phthalate (DBP), Bis(2-ethylhexyl) sebacate (DOS), o-Nitrophenyl octyl ether (o-NPOE) | Imparts plasticity and mobility to the membrane, dissolving active components and influencing dielectric constant. | [57] [60] [11] |
| Ionophores | Valinomycin (K⁺), 4-tert-butylcalix[4]arene (Pb²⁺), Schiff bases (Cu²⁺), Molecular Cages (NO₃⁻) | The key selective element; it selectively binds to the target ion, dictating the sensor's selectivity. | [62] [61] [11] |
| Lipophilic Additives | Sodium tetrakis[3,5-bis(trifluoromethyl)phenyl]borate (NaTFPB), Tetradodecylammonium tetrakis(4-chlorophenyl)borate (ETH 500) | Reduces membrane resistance and diminishes interference from lipophilic sample ions; ensures permselectivity. | [60] [61] |
| Solid-Contact Materials | Poly(3,4-ethylenedioxythiophene) (PEDOT), Polyaniline (PANI), Poly(3-octylthiophene) (POT), Graphene Nanocomposite (GNC) | Acts as an ion-to-electron transducer, provides high capacitance, and prevents water layer formation. | [60] [59] [58] |
Contextualizing Sensitivity: Potentiometry vs. Voltammetry
The user's thesis requires framing this electrode comparison within the broader context of sensitivity in potentiometry versus voltammetry. It is crucial to understand that "sensitivity" has distinct meanings in these two electrochemical techniques.
In potentiometry, sensitivity is typically expressed as the Nernstian slope (mV per decade of concentration change) and the lower detection limit (the lowest concentration that can be reliably distinguished from zero) [57]. The optimization of electrode design, as detailed in this guide, directly targets the improvement of these parameters. The shift from liquid-contact to solid-contact configurations is a primary strategy in potentiometry to push detection limits to nanomolar and even picomolar levels by controlling undesired ion fluxes [57] [61].
In contrast, voltammetry is an amperometric technique where a controlled potential is applied, and the resulting current is measured. Here, sensitivity is the magnitude of the Faradaic current per unit concentration (e.g., µA M⁻¹) [18]. For instance, a WS₂-WO₃/P2ABT nanocomposite sensor used for detecting Hg²⁺ ions demonstrated a sensitivity of 2.4 µA M⁻¹ in its voltammetric mode [18].
Therefore, a direct numerical comparison of a "mV/decade" slope and a "µA M⁻¹" sensitivity is not meaningful. The choice between the techniques depends on the application. Potentiometry excels in direct, continuous monitoring of free ion activity with simple instrumentation, while voltammetry often provides lower absolute detection limits and can speciate between different oxidation states of an element, albeit often with more complex instrumentation and sample pretreatment requirements [18].
The objective comparison of electrode configurations clearly demonstrates that solid-contact ISEs offer significant performance advantages over traditional liquid-contact designs, particularly in terms of achieving lower detection limits and superior potential stability. The elimination of the inner filling solution minimizes ion fluxes, reduces maintenance requirements, and facilitates sensor miniaturization and integration into portable, wearable, and automated devices [60].
The ongoing research in this field is focused on further optimizing the solid-contact layer. The development of novel materials, including hydrophobic conducting polymers and various carbon nanostructures, aims to enhance capacitance and block the formation of water layers more effectively [60] [58]. Furthermore, the exploration of plasticizer-free polymer matrices and the integration of digitalization and flexible manufacturing principles promise to yield the next generation of robust, reliable, and environmentally friendly sensors [63] [61]. For researchers and drug development professionals, the solid-contact configuration is often the superior choice for new sensor development, especially for applications requiring high sensitivity, miniaturization, or long-term stability.
Electrochemical analysis provides powerful tools for analytical chemistry, but its effectiveness depends on signal purity. For researchers choosing between potentiometry and voltammetry, understanding their distinct noise and interference profiles is crucial. This guide compares their performance based on experimental data and provides practical strategies for enhancing signal integrity.
Potentiometry measures the potential difference between two electrodes at zero current, relating this potential to analyte concentration via the Nernst equation [3] [64]. This zero-current operation inherently minimizes certain types of interference, particularly from redox-active species that don't interact with the ion-selective membrane [5] [8].
Voltammetry measures current as a function of systematically changing applied potential, offering both quantitative and qualitative information through voltammograms [3]. Its pulsed variants like Square Wave Voltammetry (SWV) enhance sensitivity by minimizing background current [65].
The fundamental difference in what each method measures (potential vs. current) underlies their different vulnerability profiles. Potentiometry's signal stability can be compromised by factors affecting the reference electrode potential or membrane integrity, while voltammetry must contend with both charging currents and faradaic interferences [8] [3].
Experimental Comparison: Cadmium and Lead Detection
A direct comparison of advanced potentiometric and stripping voltammetric measurements for cadmium and lead detection reveals complementary strengths [5]:
- Potentiometric Sensors: Solid-contact Cd²⁺ and Pb²⁺ ion-selective electrodes (ISEs) achieved detection limits of 0.2 nM and 2.0 nM, respectively, using highly selective ionophores in a copolymeric matrix [5].
- Voltammetric Method: Employed a bismuth-coated glassy carbon working electrode with deposition at -0.9 V (Pb) and -1.2 V (Cd) for 5 minutes, followed by square-wave voltammetric scanning [5].
When tested in the presence of interfering ions (thallium, indium, tin), the potentiometric sensors demonstrated superior selectivity. The logarithmic selectivity coefficients (log K) for the Cd²⁺-ISE were -4.8 for In³⁺ and -5.2 for Tl⁺, and for the Pb²⁺-ISE, -5.8 for Sn²⁺, indicating strong rejection of these common voltammetric interferents [5].
Diagram illustrating the different interference mechanisms in potentiometric and voltammetric systems.
Quantitative Performance Comparison
Table 1: Analytical Performance Comparison for Trace Metal Detection
| Parameter | Potentiometric ISEs | Anodic Stripping Voltammetry |
|---|---|---|
| Detection Limit (Cd²⁺) | 0.2 nM [5] | Similar nanomolar range [5] |
| Detection Limit (Pb²⁺) | 2.0 nM [5] | Similar nanomolar range [5] |
| Selectivity (Tl⁺ interference) | log K = -5.2 [5] | Significant interference [5] |
| Selectivity (Sn²⁺ interference) | log K = -5.8 [5] | Significant interference [5] |
| Sample Perturbation | Minimal (non-exhaustive) [5] | Moderate (preconcentration required) [5] |
| Analysis Speed | Rapid (direct measurement) [8] [11] | Moderate (requires deposition time) [5] |
Table 2: Interference Management Strategies Comparison
| Strategy Type | Potentiometric Approaches | Voltammetric Approaches |
|---|---|---|
| Fundamental | Selective ionophores (e.g., ETH 5435 for Cd²⁺) [5] | Optimized deposition potentials [5] |
| Chemical | Membrane composition optimization [5] [17] | Complexing agents [65] |
| Instrumental | Solid-contact designs to reduce water layer effects [8] [17] | Square Wave Voltammetry with current averaging [65] |
| Data Processing | N/A | 3D i-t-E plots for window optimization [65] |
Advanced Noise Reduction Protocols
Potentiometric Sensor Optimization
Solid-Contact ISE Fabrication reduces traditional liquid-contact limitations. A proven protocol for cadmium ISEs includes [5]:
- Membrane Composition: ETH 5435 ionophore (15 mmol kg⁻¹), NaTFPB cation exchanger (5 mmol kg⁻¹), ETH 500 lipophilic salt (10 mmol kg⁻¹) in MMA-DMA copolymer matrix [5].
- Electrode Conditioning: Sequential conditioning in 10⁻³ M Cd(NO₃)₂ followed by 10⁻⁹ M Cd(NO₃)₂ containing 10⁻³ M Ca(NO₃)₂ (1 day each) [5].
- Contact Stability: Using conducting polymers like poly(3-octylthiophene) as ion-to-electron transducers prevents aqueous layer formation and potential drift [8] [17].
Novel Material Integration further enhances stability. Recent research demonstrates that nanomaterials and nanocomposites in the solid-contact layer improve capacitance and reduce signal drift. Examples include MoS₂ nanoflowers with Fe₃O₄ and tubular gold nanoparticles with Tetrathiafulvalene, which provide superior signal stability [8].
Voltammetric Signal Purification
Current Averaging Optimization in Square Wave Voltammetry can significantly suppress interferent signals. A 2024 study demonstrated [65]:
- Full i-t Data Collection: Capture complete current-time transients at each potential step.
- 3D Visualization: Construct i-t-E plots to identify temporal current patterns.
- Window Selection: Choose early current averaging windows (2-10% of i-t response) to enhance analyte signals while suppressing overlapping interferents like Cu²⁺ in pH sensing [65].
Electrode Surface Engineering minimizes non-specific binding. For quinone-based voltammetric pH sensing in the presence of heavy metals, laser-machined boron-doped diamond electrodes with patterned sp² carbon centers provide robust platforms that resist fouling and offer distinct electron transfer characteristics [65].
Workflow for Square Wave Voltammetry signal optimization using current averaging window selection.
Essential Research Reagent Solutions
Table 3: Key Materials for Electrochemical Sensor Development
| Material/Reagent | Function | Application Examples |
|---|---|---|
| ETH 5435 Ionophore | Selective cadmium chelation | Cd²⁺-ISE membrane formulation [5] |
| Lead Ionophore IV | Selective lead complexation | Pb²⁺-ISE membrane formulation [5] |
| Na-TFPB | Lipophilic cation exchanger | Membrane potential stabilization [5] |
| MMA-DMA Copolymer | Polymer matrix | Low diffusion coefficient support [5] |
| Poly(3-octylthiophene) | Solid-contact transducer | Ion-to-electron transduction [5] [17] |
| Bismuth Film | Mercury-free electrode coating | Environmentally friendly stripping voltammetry [5] |
| BAPTA-based Polymers | Calcium-selective chelation | Inflammation sensing via Ca²⁺ detection [17] |
| Schiff Base Ligands | Copper ion recognition | Cu²⁺ selective carbon paste electrodes [11] |
The choice between potentiometry and voltammetry for minimizing noise and interference depends on the specific analytical challenge:
Choose potentiometry when analyzing specific ions in complex matrices where selectivity against redox-active interferents is crucial, and when direct, rapid measurement is preferred. Its superior selectivity in the presence of metals like thallium and tin makes it ideal for environmental and biological samples [5] [11].
Choose voltammetry when ultra-trace detection is needed, when analyzing multiple analytes simultaneously, or when information about reaction kinetics is required. Advanced signal processing like SWV current averaging provides powerful tools for deconvoluting overlapping signals [65].
For the most challenging applications, hybrid approaches or parallel measurement using both techniques can provide complementary data that enhances analytical confidence. The ongoing development of novel materials, particularly nanomaterials and engineered polymers, continues to push the detection limits of both techniques while improving their resistance to interference [8] [17].
Addressing Ohmic Drop and Other Sensitivity-Limiting Factors
In pharmaceutical research and drug development, the accurate quantification of analytes at increasingly lower concentrations is paramount. Electroanalytical techniques, primarily potentiometry and voltammetry, are cornerstone methods for such analyses, prized for their sensitivity, cost-effectiveness, and potential for miniaturization. However, the ultimate sensitivity and accuracy of these methods can be severely compromised by intrinsic experimental factors, most notably the ohmic drop. This phenomenon represents an uncompensated resistance within the electrochemical cell, leading to a measured potential that deviates from the true potential applied at the electrode-solution interface [66]. For researchers, understanding and mitigating the ohmic drop is not merely a technical exercise but a fundamental prerequisite for obtaining reliable data, particularly when operating at the limits of detection required for modern drug analysis, such as in therapeutic drug monitoring or trace impurity detection [8] [45].
This guide provides a structured comparison of how potentiometry and voltammetry are affected by the ohmic drop and other sensitivity-limiting factors. It outlines practical experimental strategies to address these challenges, equipping scientists with the knowledge to select the optimal technique and implement best practices for maximizing sensitivity in their work.
Core Technique Comparison: Potentiometry vs. Voltammetry
At their core, potentiometry and voltammetry differ fundamentally in their operational principles, which directly influences their susceptibility to the ohmic drop.
Potentiometry is a zero-current technique. It involves measuring the potential (voltage) difference between an indicator electrode (e.g., an Ion-Selective Electrode, ISE) and a reference electrode under conditions of negligible current flow [8] [67]. This key characteristic makes it inherently less vulnerable to ohmic drop effects and interference from other electroactive species [9] [67]. Its sensitivity is largely governed by the thermodynamics of the ion-selective membrane and the stability of the reference electrode.
Voltammetry, in contrast, is a current-measuring technique. It applies a time-dependent potential to the working electrode and measures the resulting current from the oxidation or reduction of analytes [68]. Since current flows through the resistive solution, the resulting ohmic drop can distort the applied potential, altering the observed current response and leading to significant errors in quantification, especially in low-conductivity solutions or at high currents [66].
Table 1: Fundamental Comparison of Potentiometry and Voltammetry
| Feature | Potentiometry | Voltammetry |
|---|---|---|
| Measured Signal | Potential (Voltage) | Current |
| Current Flow | Negligible (theoretical zero) | Significant |
| Primary Sensitivity Limit | Transmembrane ion fluxes, reference electrode stability, selectivity | Ohmic drop, charging current, slow analyte diffusion, surface fouling |
| Inherent Susceptibility to Ohmic Drop | Low [67] | High [66] |
| Analyte Consumption | Virtually none [9] | Yes, via redox reaction |
| Best Suited For | Direct ion activity measurement, continuous monitoring, small volumes | Tracing redox properties, kinetic studies, multi-analyte detection |
The Ohmic Drop: A Fundamental Challenge for Voltammetric Sensitivity
Definition and Impact
The ohmic drop ((IR{\Omega})) is the potential difference caused by current ((I)) flowing through the inherent resistance ((R{\Omega})) of the electrolyte and other cell components [66]. According to Ohm's law, the actual potential experienced at the working electrode surface ((V(t))) is the difference between the applied potential ((E(t))) and this ohmic drop: $$V(t) = E(t) - R_{\Omega}I(t)$$
This means that when a current flows, the potential effectively "seen" by the analyte at the electrode surface is less than the value set by the potentiostat. This distortion has several critical impacts on voltammetric measurements [66]:
- Peak Broadening and Shifting: In cyclic voltammetry, peaks become broader and shift to higher overpotentials, which can lead to incorrect identification of redox potentials.
- Inaccurate Current Quantification: The measured current is affected, compromising the accuracy of quantitative analysis.
- Reduced Resolution: The ability to distinguish between two electroactive species with similar redox potentials is diminished.
The effect is visually demonstrated in Tafel plots and cyclic voltammograms, where the introduction of series resistance visibly distorts the curve shape and peak potential [66].
Experimental Protocols for Ohmic Drop Correction
Addressing the ohmic drop requires a combination of good cell design and electronic compensation. The following protocols are essential for high-sensitivity voltammetry.
Protocol 1: Cell Design and Setup for Minimizing (R_{\Omega})
- Electrode Placement: Position the reference electrode's Luggin capillary as close as possible to the working electrode surface to minimize the resistance of the solution path. This is the most effective first step [66].
- Supporting Electrolyte: Use a high concentration (typically 0.1 M to 1.0 M) of an inert electrolyte (e.g., KCl, KNO₃, TBAPF₆) to increase the solution's conductivity. A supporting electrolyte to electroactive species ratio of at least 26:1 is recommended for full support [45].
- Solvent Choice: Prefer solvents with high dielectric constants and low inherent resistivity when possible.
- Electrode Size: For macroelectrodes, smaller electrodes generally produce less current, thereby reducing the magnitude of the (IR_{\Omega}) product.
Protocol 2: Electronic Ohmic Drop Compensation Modern potentiostats offer software-based techniques to determine and correct for the remaining ohmic drop after optimal cell design [66].
- Determination of (R{\Omega}):
- Electrochemical Impedance Spectroscopy (EIS): Perform EIS over a high-frequency range (e.g., 100 kHz). Fit the resulting Nyquist plot with an equivalent circuit to obtain an accurate value of the solution resistance ((R1)) [66].
- Current Interrupt Technique: The potentiostat briefly interrupts the current and measures the instantaneous change in potential, which is related to (R_{\Omega}).
- Software Compensation: Link an ohmic drop determination technique (like ZIR or EIS) to the voltammetric experiment in the instrument software. The software then uses the measured (R_{\Omega}) value to apply a real-time correction to the applied potential [66]. It is critical to note that hardware compensation has limitations and cannot compensate for resistances larger than the value of the shunt resistor used in the current-measuring circuit [66].
Diagram 1: Ohmic drop impact on voltammetry.
Beyond Ohmic Drop: A Broader Look at Sensitivity Limitations
While ohmic drop is a major challenge for voltammetry, both techniques face other significant sensitivity-limiting factors.
Limitations in Voltammetry
- Diffusion-Limited Current: For analytes without stirring, the current can be limited by the slow rate of diffusion from the bulk solution to the electrode surface. This can hinder measurements in small, quiescent volumes [9]. The use of microelectrode arrays has been shown to help overcome this limitation [9].
- Charging Current: The current used to charge the electrical double-layer at the electrode-solution interface constitutes a background signal that can swamp the faradaic current from the analyte, particularly at fast scan rates and low analyte concentrations.
- Electrode Fouling: Surface-active materials in complex samples (like blood or urine) can adsorb onto the electrode surface, blocking active sites and causing signal instability and drift [69].
- Selectivity Challenges: Achieving selectivity in the presence of structurally similar electroactive interferents (e.g., ascorbic acid and dopamine) often requires sophisticated electrode modifications [9].
Limitations in Potentiometry
- Selectivity of the Membrane: The primary limitation is the selectivity coefficient of the ionophore in the ISE membrane. An interfering ion with a similar size and charge can generate a non-negligible response, leading to overestimation of the target ion [8].
- Transmembrane Fluxes: At very low concentrations, ions can leach from the membrane into the sample (or vice versa), degrading the detection limit. Recent advances in membrane materials have made significant progress in mitigating this issue [8] [9].
- Reference Electrode Stability: Any potential drift in the reference electrode will directly translate into a drift of the measured cell potential, affecting long-term stability [8].
Table 2: Experimental Data Comparing Technique Performance in Analysis
| Analyte | Technique | Key Performance Metric | Reported Value | Noted Limitations / Experimental Conditions |
|---|---|---|---|---|
| Hg²⁺ Ions | Potentiometry (WS₂-WO₃/P2ABT Nanocomposite ISE) | Nernstian Slope | 33.0 mV/decade | Broad linear range (10⁻⁶ to 10⁻¹ M), excellent selectivity over Zn²⁺, Ni²⁺, etc. [18] |
| Hg²⁺ Ions | Cyclic Voltammetry (WS₂-WO₃/P2ABT Nanocomposite) | Sensitivity | 2.4 μA/M | Concentration range: 10⁻⁶ to 10⁻¹ M [18] |
| Cu²⁺ Ions | Potentiometry (Graphite/Schiff base CPE) | Detection Limit | 5.0 × 10⁻⁸ mol/L | Wide pH working range (3.5-6.5), fast response time (~15 s), high selectivity [11] |
| Dopamine | Voltammetry (Bare Au/Pt Electrodes) | Detection Limit | ~10⁻⁷ M (in 200 μL) | Diffusion is the limiting stage; requires stirring or microelectrode arrays for better performance [9] |
| Dopamine | Potentiometry (Tubular Flow-Through ISE) | -- | -- | Suffers from lack of highly selective ionophore; no analyte consumption is an advantage for small volumes [9] |
The Scientist's Toolkit: Essential Reagents and Materials
Successful implementation of sensitive electroanalysis depends on the appropriate selection of materials. The following table details key reagents and their functions in modern sensor design.
Table 3: Key Research Reagent Solutions for Electrochemical Sensing
| Reagent / Material | Function / Role | Application Examples |
|---|---|---|
| Ionophores (e.g., Crown Ethers, Schiff Bases) | Selective molecular recognition element within an ISE membrane; binds the target ion. | Dicyclohexyl-18-crown-6 for dopamine sensing [9]; Schiff base 2-(((3-aminophenyl) imino) methyl) phenol for Cu(II) sensing [11]. |
| Ion-to-Electron Transducers (e.g., PEDOT, Carbon Nanotubes, MXenes) | Replaces inner filling solution in Solid-Contact ISEs; converts ionic signal to electronic signal. | Critical for miniaturization and stability of potentiometric sensors [8]. |
| Plasticizers (e.g., o-NPOE, DOS) | Imparts mobility to ionophores and ion exchangers in the polymeric membrane of ISEs; determines membrane dielectric constant. | 2-nitrophenyl octyl ether (o-NPOE) is commonly used [9] [11]. |
| Supporting Electrolyte (e.g., KCl, TBAPF₆) | Increases conductivity of the test solution to minimize ohmic drop in voltammetry. | 0.1 M KCl is standard in many voltammetric experiments, such as the detection of ferricyanide [66]. |
| Conducting Polymers (e.g., Polyaniline, Polypyrrole) | Used for electrode modification; can catalyze reactions, improve selectivity, and enhance signal in voltammetry. | Molecularly imprinted polypyrrole for picomolar detection of dopamine [9]. |
The choice between potentiometry and voltammetry for a sensitive analytical method is not a simple one and is heavily influenced by the nature of the analyte and the sample matrix. Potentiometry offers a distinct advantage in scenarios where ohmic drop is a major concern, for continuous monitoring, or when analyzing small volumes without analyte consumption [9] [67]. Its simplicity, power efficiency, and inherent resistance to this key limiting factor make it a powerful tool, especially with ongoing advancements in solid-contact electrodes and novel ionophores.
Voltammetry, despite its challenges with ohmic drop, remains unparalleled for gaining insights into redox mechanisms, achieving extremely low detection limits with techniques like stripping voltammetry, and for multi-analyte detection when coupled with advanced pulse techniques [45]. With careful experimental design, including proper cell setup and ohmic drop correction protocols, its limitations can be effectively managed.
The future of sensitive electroanalysis lies in the convergence of these techniques with new materials and technologies. The integration of nanomaterials (graphene, MXenes) to enhance signal transduction, 3D printing for customized sensor design, AI-driven data interpretation, and the development of wearable, flexible sensors for real-time, in-field analysis are set to push the boundaries of sensitivity and application in pharmaceutical research and beyond [8] [45].
The electrochemical determination of active pharmaceutical ingredients (APIs), metabolites, and biomarkers in biofluids represents a significant challenge in pharmaceutical research and therapeutic drug monitoring. Biofluids such as blood, plasma, saliva, sweat, and urine constitute complex matrices containing numerous interfering compounds, including proteins, lipids, salts, and other endogenous substances that can foul electrode surfaces and diminish analytical sensitivity [70] [50]. These matrix effects pose substantial obstacles for both potentiometric and voltammetric techniques, necessitating sophisticated sample preparation strategies and sensor design approaches to maintain sensitivity and selectivity [70]. The fundamental challenge lies in distinguishing the target analyte signal from the background noise generated by these complex matrices, particularly when measuring trace concentrations of drugs or biomarkers present at nanomolar or picomolar levels [24] [71].
The selection between potentiometry and voltammetry for biofluid analysis often involves careful consideration of their respective capabilities for overcoming matrix effects. Potentiometric methods measure potential at zero current flow, offering advantages in power efficiency and reduced vulnerability to ohmic drop problems and interferents [8]. Conversely, voltammetric techniques apply potential waveforms to generate faradaic currents, providing exceptional sensitivity for electroactive species but often requiring more extensive sample preparation to mitigate fouling effects [72]. This guide provides a comprehensive comparison of experimental approaches, sensitivity data, and preparation protocols for maintaining analytical performance in complex biofluid matrices.
Fundamental Principles: Potentiometry vs. Voltammetry
Technical Foundations and Measurement Approaches
Potentiometry operates on the principle of measuring the potential difference between working and reference electrodes under conditions of negligible current flow [8] [50]. This potential develops across ion-selective membranes and follows the Nernst equation, providing a logarithmic response to target ion activity. Modern potentiometric sensors increasingly utilize solid-contact designs with ion-to-electron transducers such as conducting polymers (e.g., poly(3-octylthiophene), polyaniline) or carbon-based nanomaterials to enhance stability and facilitate miniaturization [8] [17]. A significant advantage in biofluid analysis is their relative insensitivity to matrix effects like fouling from proteins or other macromolecules, as no current passes through the sensing interface [8].
Voltammetry encompasses techniques that apply potential waveforms to measure resulting faradaic currents from redox-active species [45] [72]. These methods include pulse techniques (differential pulse voltammetry, square wave voltammetry) and stripping methods (anodic stripping voltammetry) that exploit preconcentration steps to enhance sensitivity [72]. Voltammetry provides superior sensitivity for electroactive APIs and biomarkers, with detection limits frequently extending to nanomolar or picomolar ranges [24] [72]. However, the electron transfer processes make these techniques more vulnerable to electrode fouling in complex matrices, necessitating careful electrode modification and sample preparation protocols [70] [24].
Table 1: Fundamental Comparison of Potentiometric and Voltammetric Techniques
| Parameter | Potentiometry | Voltammetry |
|---|---|---|
| Measured Signal | Potential (voltage) | Current |
| Current Flow | Negligible | Significant |
| Response | Logarithmic (Nernstian) | Linear |
| Detection Limit | Nanomolar range | Picomolar to nanomolar range |
| Selectivity Source | Ion-selective membrane/ionophore | Applied potential & electrode material |
| Susceptibility to Fouling | Lower | Higher |
| Suitable Analytes | Ions, charged molecules | Electroactive species |
Signaling Pathways and Experimental Workflows
The fundamental processes for biofluid analysis differ significantly between potentiometric and voltammetric approaches, particularly in how they handle matrix complexity. The following diagram illustrates the core signaling pathways and key decision points for each technique when applied to complex biofluid samples.
Quantitative Sensitivity Comparison in Biofluids
Experimental Performance Data
Direct comparison of sensitivity parameters between potentiometric and voltammetric techniques reveals distinct advantages depending on the target analyte and matrix complexity. The following table summarizes experimental data from recent studies investigating pharmaceutical compounds and biomarkers in biofluids.
Table 2: Experimental Sensitivity Data for Potentiometric vs. Voltammetric Detection in Biofluids
| Analyte | Technique | Sample Matrix | Sample Preparation | Linear Range | LOD | Reference |
|---|---|---|---|---|---|---|
| Calcium ions | Potentiometry (BAPTA-based sensor) | Extracellular fluid | None (direct measurement) | 0.1-1 mM | ~10 µM | [17] |
| Cadmium ions | Potentiometry with EMPM | Artificial seawater | Electrochemical preconcentration & matrix elimination | - | Low ppb | [71] |
| Melatonin | Potentiometric Stripping Analysis (PSA) | Pharmaceutical supplement | Dilution in BR buffer (pH 3.0) | - | 14.6 µg L⁻¹ | [24] |
| Melatonin | Square Wave Voltammetry (SWV) | Pharmaceutical supplement | Dilution in BR buffer (pH 3.0) | - | 110 µg L⁻¹ | [24] |
| 2-NP & 4-NP | Square-Wave Anodic Stripping Voltammetry (SWASV) | Environmental samples | Adsorptive accumulation | Up to 20 ppm | - | [47] |
| Neurotransmitters | Fast-Scan Cyclic Voltammetry (FSCV) | Brain tissue | None (direct in vivo measurement) | nM-µM range | ~10 nM | [72] |
Impact of Sample Preparation on Sensitivity
The data demonstrates that voltammetric techniques generally achieve lower detection limits for electroactive pharmaceutical compounds, with potentiometric stripping analysis (PSA) showing approximately 7.5-fold better sensitivity for melatonin detection compared to square wave voltammetry (SWV) in the same study [24]. This enhanced sensitivity in stripping techniques results from the preconcentration step that accumulates analyte on the electrode surface before measurement.
For potentiometric sensors, effective matrix elimination strategies can dramatically improve detection limits in complex samples. The Electrochemically Modulated Preconcentration and Matrix Elimination (EMPM) approach combined with potentiometric detection achieved low parts-per-billion sensitivity for cadmium in high-salinity matrices that would otherwise overwhelm conventional ion-selective electrodes [71]. This highlights how hybrid methodologies that incorporate voltammetric preconcentration with potentiometric detection can leverage the advantages of both techniques.
Experimental Protocols for Matrix Effect Mitigation
Sample Preparation Workflow for Complex Biofluids
Implementing appropriate sample preparation is crucial for maintaining sensitivity in biofluid analysis. The following workflow diagram illustrates the decision process for selecting and applying preparation methods based on the analytical technique and matrix complexity.
Detailed Methodologies for Enhanced Sensitivity
Electrochemically Modulated Preconcentration and Matrix Elimination (EMPM)
The EMPM method effectively addresses high electrolyte backgrounds that hamper trace analysis in potentiometry [71]. This hybrid approach combines electrochemical preconcentration with subsequent potentiometric detection:
- Preconcentration Phase: A bismuth-coated glassy carbon working electrode is immersed in the sample solution. A deposition potential of -0.6 V to -1.0 V (vs. Ag/AgCl) is applied for 60-300 seconds while slowly stirring the solution. This reduces target metal ions (e.g., Cd²⁺) to their metallic form and deposits them onto the bismuth film surface.
- Matrix Elimination: Following deposition, the electrode is transferred to a clean measurement cell containing a low-ionic-strength medium favorable to potentiometric detection (e.g., 10⁻³ M Ca(NO₃)₂).
- Stripping and Detection: An oxidizing potential is applied to dissolve the accumulated metals into the favorable medium, where their concentration is measured using solid-contact ion-selective microelectrodes.
This approach successfully eliminated sodium chloride interference at 0.5 M concentration, enabling cadmium detection at parts-per-billion levels in saline samples that would otherwise preclude direct potentiometric measurement [71].
Constant Current Potentiometric Stripping Analysis (CCPSA) for Melatonin
The CCPSA method demonstrated superior sensitivity for melatonin detection compared to voltammetric approaches [24]:
- Electrode Preparation: Boron-doped diamond (BDD) screen-printed sensors are cathodically pretreated to enhance electrochemical activity. Cathodic pretreatment increased melatonin responses more than four-fold compared to anodically pretreated electrodes.
- Optimized Conditions: Analysis is performed in Britton-Robinson buffer at pH 3.0. Accumulation is conducted at +0.8 V for 60 seconds, followed by stripping at a constant current of 0.3 µA.
- Fouling Mitigation: The irreversible oxidation of melatonin forms reactive quinoneimine that can lead to electrode fouling through electropolymerization. The CCPSA method minimizes this effect through optimized accumulation potentials and times.
This protocol achieved a detection limit of 14.6 µg L⁻¹, significantly lower than the 110 µg L⁻¹ obtained by square wave voltammetry using the same sensor [24].
The Scientist's Toolkit: Essential Research Reagents and Materials
Successful implementation of electrochemical biofluid analysis requires careful selection of materials and reagents. The following table catalogues essential components for constructing sensitive and robust electrochemical sensors.
Table 3: Essential Research Reagents and Materials for Biofluid Electroanalysis
| Category | Specific Material/Reagent | Function/Application | Technical Notes |
|---|---|---|---|
| Electrode Materials | Boron-doped diamond (BDD) | Working electrode substrate | Excellent properties: wide potential window, low background current, minimal fouling [24] |
| Bismuth film | Environmentally-friendly electrode coating | Alternative to mercury for stripping analysis; high hydrogen overvoltage [71] | |
| Conducting polymers (POT, PEDOT) | Solid-contact ion-to-electron transducer | Enhances stability of solid-contact ion-selective electrodes [8] [17] | |
| Ion-Selective Components | Ionophores (e.g., BAPTA, ETH 5435) | Selective analyte recognition | BAPTA provides exceptional Ca²⁺ selectivity; various ionophores available for different ions [17] [71] |
| Ionic additives (NaTFPB) | Membrane permselectivity control | Lipophilic salts optimize membrane resistance and selectivity [71] | |
| Plasticizers (o-NPOE) | Polymer membrane fluidity | Controls mobility of ionophore and ion-exchange sites [71] | |
| Sample Preparation | Britton-Robinson buffer | pH control and supporting electrolyte | Effective for melatonin analysis at pH 3.0 [24] |
| Microextraction phases | Analyte preconcentration & clean-up | Reduces matrix effects in voltammetric analysis [70] | |
| Advanced Materials | MXene (Ti₃C₂Tₓ) | Nanomaterial electrode modifier | Large specific surface area, high conductivity, biocompatibility [73] |
| Metal-organic frameworks (MOFs) | Selective recognition elements | Adjustable pore sizes, structural diversity for enhanced selectivity [47] |
The comparative analysis of potentiometric and voltammetric techniques for biofluid analysis reveals a complex landscape where technique selection must align with specific analytical requirements and matrix characteristics. Potentiometry offers superior practicality for direct measurements in complex matrices with minimal sample preparation, particularly for ionic species and charged molecules where suitable ionophores exist [8] [17]. The technique's insensitivity to fouling and dissolved oxygen, combined with its power efficiency, makes it ideal for miniaturized, wearable, and point-of-care applications [8] [50].
Voltammetry provides unmatched sensitivity for electroactive pharmaceuticals and biomarkers when appropriate sample preparation and electrode modification strategies are implemented [24] [72]. Stripping techniques, particularly potentiometric stripping analysis and anodic stripping voltammetry, leverage preconcentration steps to achieve exceptional detection limits that frequently surpass those of potentiometry [24] [71]. The development of hybrid approaches that combine voltammetric preconcentration with potentiometric detection represents a promising direction for maximizing sensitivity while maintaining selectivity in complex biofluids [71].
Future advancements will likely focus on integrating nanomaterials and artificial intelligence to further enhance sensitivity and selectivity while mitigating matrix effects [73] [45]. MXene-based sensors, metal-organic frameworks, and AI-driven data processing approaches show particular promise for multiplexed detection in clinical samples, potentially enabling simultaneous monitoring of multiple biomarkers or drugs in small sample volumes [47] [73]. As these technologies mature, the distinction between potentiometric and voltammetric approaches may blur, giving rise to integrated systems that leverage the complementary advantages of both techniques for comprehensive biofluid analysis in pharmaceutical research and clinical diagnostics.
Critical Assessment: Validating and Comparing Sensitivity Across Techniques
In the pharmaceutical sciences, the reliability of analytical data is paramount. Method validation provides the evidence that an analytical procedure is suitable for its intended purpose, establishing a scientific foundation for decision-making in drug development, quality control, and regulatory compliance. For electrochemical techniques—primarily potentiometry and voltammetry—validation protocols demonstrate that these methods can deliver precise, accurate, and sensitive measurements for pharmaceutical compounds. The determination of detection limits and sensitivity parameters forms the cornerstone of this validation process, ensuring methods can reliably detect and quantify target analytes at relevant concentrations [45] [74].
This guide objectively compares validation approaches for potentiometric and voltammetric methods, focusing on experimental protocols for establishing key performance characteristics. With the pharmaceutical industry increasingly adopting electrochemical sensors for drug monitoring, understanding these validation fundamentals enables researchers to select the optimal technique for specific applications, from active pharmaceutical ingredient (API) quantification to environmental monitoring of drug residues [45] [75].
Core Principles: Detection Limits and Sensitivity
Defining Key Validation Parameters
- Limit of Detection (LOD): The lowest concentration of an analyte that can be reliably detected, though not necessarily quantified with exact precision. It represents the point at which the measurement signal becomes statistically significant from the background noise [74].
- Limit of Quantification (LOQ): The lowest concentration of an analyte that can be quantified with acceptable precision and accuracy under stated experimental conditions [76].
- Sensitivity: In electrochemical methods, sensitivity often refers to the slope of the calibration curve (response versus concentration). In potentiometry, this is the Nernstian slope (mV/decade), while in voltammetry, it is the current response per unit concentration (e.g., µA/µM) [3] [9].
- Selectivity: The ability of a method to measure the analyte accurately in the presence of potential interferents, such as excipients, metabolites, or co-formulated drugs [77] [9].
Statistical Foundations for Detection Limit Determination
The realm of analytical chemistry continues to struggle with defining and evaluating the limit of detection, with multiple definitions, criteria, and calculation methods adopted across disciplines [74]. Common approaches for determining LOD include:
- Signal-to-Noise Ratio: Typically 3:1 ratio of analyte signal to background noise.
- Standard Deviation of Blank: LOD = 3.3 × σ/S, where σ is the standard deviation of the blank response, and S is the slope of the calibration curve.
- Statistical Confidence Intervals: Using regression analysis and prediction intervals to determine the lowest concentration that provides statistically significant detection.
Each approach has advantages and limitations, requiring researchers to select the most appropriate method based on the specific application and regulatory requirements [74].
Comparative Analysis: Potentiometry vs. Voltammetry
Fundamental Measurement Principles
Electrochemical methods are categorized based on the electrical property being measured and how it is controlled [3]:
Potentiometry is a zero-current technique that measures the potential difference between two electrodes (indicator and reference) when no net current is flowing through the cell. This potential relates to analyte concentration via the Nernst equation [3]. Voltammetry applies a controlled, varying potential to a working electrode and measures the resulting current, which is proportional to the concentration of the electroactive species [3] [45].
Performance Characteristics Comparison
Table 1: Comparison of validation parameters between potentiometric and voltammetric methods
| Validation Parameter | Potentiometry | Voltammetry |
|---|---|---|
| Typical LOD Range | 10⁻⁶ – 10⁻⁸ M [77] [9] | 10⁻⁷ – 10⁻⁹ M [9] [76] |
| Sensitivity Measure | Nernstian slope (mV/decade) [77] [78] | Calibration curve slope (current vs. concentration) [76] |
| Dynamic Range | Typically 4-6 orders of magnitude [77] | Typically 3-5 orders of magnitude [76] |
| Selectivity Approach | Ion-selective membranes/molecularly imprinted polymers [77] | Applied potential control/modified electrodes [9] |
| Sample Consumption | Minimal (non-consumptive) [9] | Analytic consumption during measurement [9] |
| Measurement Time | Fast response (seconds) [78] | Varies with technique (seconds to minutes) [45] |
| Precision (RSD) | Typically <2% [77] | Typically <5% [76] |
Advantages and Technical Limitations
Each technique presents distinct advantages and limitations that influence method validation strategies:
Potentiometry Advantages: Simple instrumentation, suitable for colored/turbid solutions, non-destructive measurement, direct relationship between potential and concentration via Nernst equation, minimal sample preparation, and capability for continuous monitoring [3] [78]. Potentiometry Limitations: Generally higher detection limits than voltammetry, requires ion-selective recognition element, sensitivity to temperature and pH variations, and potential interference from ions with similar properties [77] [9].
Voltammetry Advantages: Lower detection limits, capability for simultaneous multi-analyte detection, provides information on reaction kinetics and mechanisms, wide range of modified electrodes available for enhanced selectivity, and excellent sensitivity for electroactive species [45] [3]. Voltammetry Limitations: Consumption of analyte during measurement, fouling of electrode surfaces, requires supporting electrolyte, more complex data interpretation, and sensitivity to dissolved oxygen in some applications [9] [76].
Experimental Protocols for Method Validation
Potentiometric Method Validation Protocol
The following protocol outlines the validation procedure for potentiometric sensors, based on established guidelines such as EURACHEM [77] [78]:
Sensor Fabrication and Calibration
For cytarabine determination, molecularly imprinted polymers (MIPs) were synthesized using cytarabine (0.5 mmol) as a template, methacrylic acid (1.5 mmol) as a functional monomer, and ethylene glycol dimethacrylate (1.5 mmol) as a crosslinker in acetonitrile [77]. The membrane contained MIP beads (8.8 mg), PVC (66.5 mg), plasticizer o-NPOE (127 mg), and potassium tetrakis(3,5-bis(trifluoromethyl)phenyl)borate (2.2 mg) dissolved in tetrahydrofuran [77].
The sensor is calibrated by measuring potential responses to cytarabine standards (10⁻⁶ – 10⁻³ M) in acetate buffer (pH 3.5). The potential is plotted against the logarithm of concentration, yielding a linear range with a near-Nernstian slope of 52.3 ± 1.2 mV/decade [77].
Detection Limit Determination
For the cytarabine sensor, LOD was calculated based on the intersection of the two extrapolated linear segments of the calibration curve, yielding 5.5 × 10⁻⁷ M. LOQ was established as the lowest point on the linear range that could be quantified with acceptable precision (RSD < 2%) [77].
Selectivity Assessment
Selectivity coefficients are determined using the Separate Solution Method or Fixed Interference Method. The potentiometric cytarabine sensor showed excellent selectivity over common interferents like Na⁺, K⁺, Ca²⁺, and urea, which is crucial for applications in biological samples [77].
Voltammetric Method Validation Protocol
The following protocol outlines the validation procedure for voltammetric methods, as demonstrated for amoxicillin determination in river water [76]:
Sensor Preparation and Optimization
A glassy carbon electrode is modified with reduced graphene oxide and Nafion to enhance sensitivity and selectivity. The modification procedure includes drop-casting the nanocomposite suspension onto the polished electrode surface and allowing it to dry [76].
Square-wave voltammetry parameters are optimized: frequency (25-100 Hz), pulse amplitude (10-100 mV), and step potential (1-10 mV). The optimal conditions for amoxicillin detection were determined as frequency 50 Hz, amplitude 70 mV, and step potential 10 mV [76].
Calibration and Detection Limits
Calibration standards of amoxicillin (1.8-5.4 μmol L⁻¹) are prepared in supporting electrolyte. The square-wave voltammogram is recorded for each standard, and the peak current is plotted against concentration. The LOD (0.36 μmol L⁻¹) and LOQ (1.2 μmol L⁻¹) are calculated using the formulas LOD = 3.3 × σ/S and LOQ = 10 × σ/S, where σ is the standard deviation of the blank response, and S is the slope of the calibration curve [76].
Precision and Accuracy Evaluation
Repeatability (intra-day precision) is assessed by analyzing six replicates of low, medium, and concentration standards on the same day. Intermediate precision (inter-day precision) is evaluated by analyzing the same standards over three different days. Accuracy is demonstrated through recovery studies in spiked river water samples, with mean recovery rates statistically compared to a reference chromatographic method [76].
Essential Research Reagent Solutions
Table 2: Key reagents and materials for electrochemical method validation
| Reagent/Material | Function/Purpose | Example Applications |
|---|---|---|
| Molecularly Imprinted Polymers (MIPs) | Synthetic recognition elements for enhanced selectivity | Potentiometric cytarabine sensor [77] |
| Ionophores | Selective binding of target ions | Crown ethers for dopamine sensing [9] |
| Plasticizers (o-NPOE, DOP, TCP) | Provide proper membrane fluidity and dielectric constant | PVC membrane electrodes [77] [78] |
| Ion-Exchangers (KTFPB, KClTPB) | Facilitate ion transfer in polymeric membranes | Cation-selective electrodes [77] [9] |
| Electrode Modifiers (graphene oxide, Nafion) | Enhance sensitivity and selectivity | Voltammetric amoxicillin sensor [76] |
| Supporting Electrolytes | Provide ionic strength and control mass transport | Various voltammetric methods [45] [76] |
| Polymeric Matrices (PVC) | Form the sensing membrane structure | Ion-selective electrodes [77] [9] |
Case Studies in Pharmaceutical Analysis
Potentiometric Determination of Cytarabine
Cytarabine, an antileukemia drug, was successfully determined using potentiometric sensors based on molecularly imprinted polymers. The validated method demonstrated excellent performance characteristics with a linear range of 1.0 × 10⁻⁶ – 1.0 × 10⁻³ M, detection limit of 5.5 × 10⁻⁷ M, and near-Nernstian slope of 52.3 ± 1.2 mV/decade [77]. The method was applied to cytarabine determination in pharmaceutical formulations and spiked biological fluids, showing good agreement with reference methods. The sensors exhibited enhanced selectivity towards cytarabine over various foreign common ions and maintained stable performance over time [77].
Voltammetric Determination of Amoxicillin
A square-wave voltammetry method was developed and validated for amoxicillin determination in river water using a glassy carbon electrode modified with reduced graphene oxide and Nafion. The method showed a linear range of 1.8-5.4 μmol L⁻¹ with detection and quantification limits of 0.36 and 1.2 μmol L⁻¹, respectively [76]. The method was selective towards interferents such as humic acids and benzylpenicillin, with adequate precision (RSD < 5%) and accuracy confirmed through recovery studies and comparison with chromatography [76].
Comparative Study of Dopamine Sensing
A direct comparison of potentiometric and voltammetric sensing of dopamine revealed fundamental differences in their operational characteristics. Potentiometric sensors offered the advantage of minimal analyte consumption, making them suitable for small sample volumes, while voltammetric sensors provided lower detection limits (down to 10⁻⁷ M in 200 μL samples) but consumed analyte during measurement [9]. The study highlighted that dopamine diffusion to the electrode surface can be the limiting factor in voltammetric measurements, a limitation that can be overcome using microelectrode arrays [9].
The selection between potentiometry and voltammetry for pharmaceutical analysis depends on multiple factors, including required detection limits, sample volume, matrix complexity, and available resources. Potentiometry offers simplicity, minimal sample consumption, and direct relationship between potential and concentration, making it ideal for routine analysis of ions and charged molecules in quality control environments. Voltammetry provides superior sensitivity and lower detection limits, making it suitable for trace analysis and speciation studies, particularly for electroactive pharmaceutical compounds [45] [3] [9].
Method validation protocols for both techniques must be rigorously applied to ensure reliability and regulatory compliance. The continuing advancement of electrode materials, nanotechnology, and sensing platforms promises further improvements in both potentiometric and voltammetric methods, with emerging trends focusing on miniaturization, portability, and integration with artificial intelligence for enhanced data interpretation [45] [75]. By understanding the fundamental principles, validation requirements, and performance characteristics of each technique, researchers can make informed decisions when developing analytical methods for pharmaceutical applications.
The selection of an appropriate electrochemical sensing technique is a critical decision in analytical chemistry, impacting the reliability, cost, and efficiency of quantitative analysis. This guide provides an objective comparison of two fundamental electrochemical methods—potentiometry and voltammetry—focusing on their direct sensitivity performance in pharmaceutical and environmental applications. Sensitivity, defined as the ability of a method to produce a signal change in response to minute concentration variations, is a key determinant in technique selection for trace analysis. While potentiometry measures potential at zero current following the Nernst equation, voltammetry measures current as a function of applied potential, employing various waveform profiles to enhance sensitivity. Through experimental case studies and quantitative data comparison, this article provides researchers and drug development professionals with a practical framework for selecting the optimal technique based on their specific sensitivity requirements and application context.
Theoretical Foundations and Measurement Principles
Potentiometric Sensing Fundamentals
Potentiometry is a zero-current technique that measures the potential difference between two electrodes (working and reference) when no significant net current flows between them [3]. This potential develops across an ion-selective membrane and relates to the analyte activity via the Nernst equation:
[ E = E^0 + \frac{RT}{zF} \ln a ]
where E is the measured potential, E⁰ is the standard potential, R is the gas constant, T is temperature, z is the ion charge, F is Faraday's constant, and a is the ion activity. The sensitivity of a potentiometric sensor is reflected in its Nernstian slope, ideally 59.16/z mV per decade at 25°C [3]. Modern potentiometric sensors achieve low detection limits through carefully formulated ion-selective membranes containing selective ionophores, lipophilic ionic sites, and polymer matrices that minimize undesired ion fluxes [79]. The technique excels in applications requiring continuous monitoring of specific ions with minimal sample perturbation.
Voltammetric Sensing Fundamentals
Voltammetry encompasses a group of techniques that measure current resulting from electrochemical oxidation or reduction of an analyte at a working electrode under controlled potential conditions [3]. Unlike potentiometry, voltammetry applies potential waveforms to drive electron transfer reactions, with current response proportional to analyte concentration. Key voltammetric techniques include cyclic voltammetry (CV) for mechanistic studies, and pulsed techniques like square-wave voltammetry (SWV) and differential pulse voltammetry (DPV) for trace analysis [3]. The sensitivity of voltammetric methods is enhanced through preconcentration steps (e.g., in anodic stripping voltammetry) and pulsed waveforms that minimize charging current. The fundamental relationship follows:
[ i_p = k \cdot C ]
where iₚ is the peak current, C is concentration, and k is a constant depending on electrode geometry, diffusion coefficients, and kinetic parameters. Voltammetry provides both quantitative concentration data and qualitative information about redox characteristics.
Experimental Protocols for Sensitivity Comparison
Potentiometric Sensor Fabrication and Measurement
The fabrication of modern solid-contact ion-selective electrodes follows meticulous procedures to ensure optimal sensitivity and reproducibility. For heavy metal detection, a typical protocol involves preparing a membrane solution by dissolving selective ionophores (e.g., ETH 5435 for cadmium or lead ionophore IV for lead), lipophilic ionic sites (e.g., NaTFPB), polymer matrix (e.g., MMA-DMA copolymer), and lipophilic salts (e.g., ETH 500) in organic solvent [80]. This membrane solution is then applied to solid-contact substrates, often using conductive polymers like poly(3-octylthiophene) as ion-to-electron transducers. Electrodes are conditioned sequentially in primary ion solutions (e.g., 10⁻³ M Cd(NO₃)₂) followed by dilute solutions containing background electrolytes to establish stable potential baselines [80]. Measurements are performed in stirred solutions using high-impedance potentiometers with commercial reference electrodes (e.g., double-junction Ag/AgCl). Calibration involves recording potential values while sequentially adding standard solutions to cover the concentration range from 10⁻⁹ to 10⁻¹ M, with careful temperature control and ionic strength adjustment [79].
Voltammetric Measurement Procedures
Stripping voltammetry protocols for trace metal analysis typically employ a three-electrode system with bismuth- or mercury-film working electrodes, platinum counter electrodes, and Ag/AgCl reference electrodes [80]. The measurement consists of two fundamental steps: preconcentration and stripping. During preconcentration, target metals are electrodeposited onto the working electrode at a constant potential (e.g., -1.2 V for cadmium, -0.9 V for lead) with solution stirring for fixed durations (typically 2-10 minutes). Following a quiet period, the stripping step applies a potential scan (linear sweep, square-wave, or differential pulse) toward positive potentials, oxidizing the deposited metals and generating characteristic current peaks [80]. For pharmaceutical analysis, modified carbon paste electrodes are often prepared using composites of graphite powder, ionic liquids (e.g., 1-ethyl-3-methylimidazolium tetrafluoroborate), and metal oxide nanoparticles (e.g., ZnFe₂O₄) to enhance electron transfer kinetics [81]. Measurements are performed in buffered solutions with standard addition or calibration curve methods for quantification, optimizing parameters like deposition time, pulse amplitude, and step potential to maximize sensitivity while maintaining resolution [82].
Comparative Sensitivity Analysis in Environmental Monitoring
Heavy Metal Detection in Water Samples
Environmental monitoring of toxic heavy metals represents a critical application where sensitivity directly impacts regulatory decisions and public health protection. Direct comparison studies under identical conditions reveal that both potentiometric and voltammetric techniques can achieve nanomolar detection limits for metals like cadmium and lead, but through different mechanisms and with complementary advantages [80].
Table 1: Direct Sensitivity Comparison for Heavy Metal Detection in Environmental Analysis
| Analyte | Technique | Electrode Configuration | Linear Range (M) | Detection Limit (M) | Sensitivity Indicator |
|---|---|---|---|---|---|
| Cadmium | Potentiometry | Solid-contact Cd²⁺-ISE [80] | 10⁻⁸ - 10⁻² | 2.0 × 10⁻¹⁰ | Nernstian slope: 29.5 mV/decade |
| Cadmium | Stripping Voltammetry | Bi-coated GCE [80] | 10⁻⁸ - 10⁻⁶ | 5.0 × 10⁻⁹ | Peak current: 45 nA/nM |
| Lead | Potentiometry | Solid-contact Pb²⁺-ISE [80] | 10⁻⁸ - 10⁻² | 2.0 × 10⁻⁹ | Nernstian slope: 29.8 mV/decade |
| Lead | Stripping Voltammetry | Bi-coated GCE [80] | 10⁻⁸ - 10⁻⁶ | 3.0 × 10⁻⁹ | Peak current: 52 nA/nM |
| Lead | Potentiometry | ZMTE-MOF modified electrode [10] | 10⁻⁷ - 10⁻¹ | 7.5 × 10⁻⁸ | Nernstian slope: 30.3 mV/decade |
| Mercury | Potentiometry | WS₂-WO₃/P2ABT nanocomposite [18] | 10⁻⁶ - 10⁻¹ | ~10⁻⁶ | Nernstian slope: 33.0 mV/decade |
| Copper | Potentiometry | Schiff base modified CPE [11] | 10⁻⁷ - 10⁻¹ | 5.0 × 10⁻⁸ | Nernstian slope: 29.6 mV/decade |
The data demonstrates that properly formulated ion-selective electrodes can achieve detection limits comparable to stripping voltammetry without requiring preconcentration steps. However, the operational principles differ significantly: potentiometry measures free ion activity directly, while stripping voltammetry measures total concentration after electrochemical accumulation [80]. This distinction becomes crucial in complex environmental matrices where metal speciation affects bioavailability and toxicity.
Selectivity Considerations in Complex Matrices
While sensitivity determines the lowest detectable concentration, selectivity ensures accurate measurement in the presence of interfering species. Comparative studies reveal that potentiometric sensors often exhibit superior selectivity against certain metal ions that commonly interfere in voltammetric analysis. For cadmium detection, potentiometric sensors show logarithmic selectivity coefficients of -5.2 against thallium and -4.8 against indium, whereas these ions cause significant interference in anodic stripping voltammetry due to overlapping stripping peaks [80]. Similarly, for lead detection, potentiometric sensors demonstrate a selectivity coefficient of -4.2 against tin, a common interferent in voltammetric analysis [80]. This enhanced selectivity stems from the molecular recognition properties of advanced ionophores like ETH 5435 and lead ionophore IV, which provide precise coordination geometries for target ions while excluding interferents with similar redox potentials.
Comparative Sensitivity Analysis in Pharmaceutical Applications
Drug Compound Quantification
Pharmaceutical analysis demands sensitive techniques for active ingredient quantification in complex formulations and biological fluids. Voltammetric methods generally demonstrate superior sensitivity for organic drug molecules compared to potentiometric approaches, particularly when employing advanced electrode modifications and pulsed voltammetric techniques.
Table 2: Sensitivity Comparison for Pharmaceutical Compound Analysis
| Analyte | Technique | Electrode Configuration | Linear Range (M) | Detection Limit (M) | Sensitivity Indicator |
|---|---|---|---|---|---|
| Paracetamol | Square Wave Voltammetry | poly(ARS)/GCE [82] | 1.0 × 10⁻⁸ - 2.5 × 10⁻⁴ | 1.0 × 10⁻⁹ | Current enhancement: 6-fold vs. bare GCE |
| Resorcinol | Square Wave Voltammetry | ZnFe₂O₄/NPs/IL/CPE [81] | 3.0 × 10⁻⁶ - 5.0 × 10⁻⁴ | 1.5 × 10⁻⁶ | Peak current: 0.0276 Cₚ (µM) + 0.5508 |
| Hydroquinone | Square Wave Voltammetry | ZnFe₂O₄/NPs/IL/CPE [81] | 5.0 × 10⁻⁶ - 3.5 × 10⁻⁴ | ~10⁻⁶ | Separation: 360 mV from resorcinol |
The exceptional sensitivity of voltammetry for pharmaceutical compounds stems from several factors: the catalytic activity of modified electrode surfaces, the enhanced mass transport during preconcentration steps, and the discrimination against charging currents using pulsed techniques. For paracetamol detection, the poly(ARS)/GCE modification yields a sixfold current increase compared to unmodified electrodes, achieving nanomolar detection limits suitable for therapeutic drug monitoring in serum [82]. Similarly, the combination of ZnFe₂O₄ nanoparticles and ionic liquids in carbon paste electrodes enables simultaneous determination of resorcinol and hydroquinone with minimal sample preparation, demonstrating voltammetry's advantage for multi-analyte pharmaceutical formulations [81].
Bioanalytical Applications
The detection of biomarkers and physiological ions represents an emerging application where sensitivity requirements often push the limits of electrochemical techniques. Potentiometric sensors excel in continuous monitoring of inorganic ions in biological systems, with recent developments focusing on implantable designs for real-time health monitoring. For calcium detection, a critical secondary messenger in inflammation processes, potentiometric sensors based on BAPTA-integrated conductive polymers demonstrate Nernstian responses (20.0 ± 0.3 mV/decade) across the physiologically relevant range (0.1-1.0 mM) with selectivity coefficients of -0.4 against magnesium interference [17]. This performance enables detection of elevated calcium levels associated with inflammation or infection around implants, showcasing potentiometry's potential for in vivo monitoring despite generally higher detection limits than voltammetry.
Essential Research Reagent Solutions
The experimental protocols for sensitivity comparison rely on specialized reagents and materials that fundamentally impact analytical performance. The selection of appropriate research reagents is crucial for achieving optimal sensitivity in both potentiometric and voltammetric applications.
Table 3: Essential Research Reagents for Electrochemical Sensitivity Studies
| Reagent Category | Specific Examples | Function in Sensitivity Enhancement | Application Domain |
|---|---|---|---|
| Ionophores | ETH 5435 (Cd²⁺) [80], Lead Ionophore IV [80], BAPTA (Ca²⁺) [17] | Molecular recognition for target ions; determines selectivity and membrane potential | Potentiometric sensors |
| Ionic Additives | NaTFPB [80], ETH 500 [80] | Lipophilic salts that control membrane permselectivity; reduce ion fluxes | Potentiometric sensors |
| Polymer Matrices | MMA-DMA copolymer [80], PVC [10] | Membrane scaffold with controlled diffusivity; minimizes water layer formation | Solid-contact ISEs |
| Conductive Polymers | Poly(3-octylthiophene) [80], PEDOT-PSS [17] | Ion-to-electron transduction; stabilize potential in solid-contact ISEs | Solid-contact ISEs |
| Nanoparticles | ZnFe₂O₄ nanoparticles [81] | Increase electroactive surface area; enhance electron transfer kinetics | Voltammetric sensors |
| Ionic Liquids | 1-ethyl-3-methylimidazolium tetrafluoroborate [81] | Improve conductivity and modify electrode interface; preconcentrate analytes | Voltammetric sensors |
| Electrode Modifiers | Alizarin Red S polymer [82], WS₂-WO₃/P2ABT nanocomposite [18] | Catalyze specific redox reactions; lower overpotentials | Voltammetric sensors |
The strategic combination of these reagents enables researchers to optimize sensor sensitivity for specific applications. For potentiometry, the careful formulation of ion-selective membranes with appropriate ionophore-ion exchanger ratios is critical for achieving Nernstian response slopes and low detection limits [79]. In voltammetry, nanocomposite materials that integrate conductive polymers with catalytic nanoparticles provide synergistic effects that significantly enhance current response while lowering overpotentials for analyte oxidation/reduction [82] [81].
Technical Guidelines for Method Selection
Sensitivity vs. Selectivity Trade-offs
The choice between potentiometry and voltammetry involves careful consideration of sensitivity and selectivity requirements specific to the analytical problem. Potentiometry generally offers superior selectivity against ions with similar redox potentials but different coordination chemistries, while voltammetry provides higher sensitivity for organic molecules and metals that undergo facile electron transfer reactions [80]. For environmental heavy metal monitoring, potentiometric sensors excel in samples with high interference from other metals (e.g., thallium, indium, tin), whereas voltammetry demonstrates advantage in ultra-trace analysis of single metal species in cleaner matrices [80].
Matrix Compatibility and Operational Constraints
Sample matrix composition significantly influences technique selection based on sensitivity requirements. Potentiometric sensors perform more reliably in turbid or colored samples where optical techniques face challenges, and their continuous monitoring capability makes them suitable for process control applications [3] [79]. However, voltammetry offers greater flexibility for complex pharmaceutical formulations where multiple electroactive components must be resolved based on their distinct oxidation potentials, as demonstrated by the simultaneous determination of resorcinol and hydroquinone with 360 mV peak separation [81]. Operational factors including analysis time, instrument portability, and required operator expertise further guide method selection, with potentiometry generally offering simpler operation and voltammetry providing richer chemical information at the cost of more complex instrumentation.
This direct sensitivity comparison demonstrates that both potentiometry and voltammetry offer viable pathways for trace analysis in pharmaceutical and environmental applications, with distinct advantages dictated by specific analytical requirements. Potentiometry provides simpler operation, superior selectivity against certain interferents, and continuous monitoring capability with detection limits reaching nanomolar levels for heavy metals [80]. Voltammetry achieves superior sensitivity for organic pharmaceuticals, enables simultaneous multi-analyte detection, and offers greater flexibility for complex sample matrices through various waveform strategies and electrode modifications [82] [81]. The optimal technique selection depends on a comprehensive consideration of target analytes, required detection limits, matrix complexity, and operational constraints. Future developments in materials science and sensor design will likely further narrow the sensitivity gap between these complementary techniques, enhancing their capabilities for addressing emerging analytical challenges in pharmaceutical research and environmental monitoring.
Statistical Approaches for Method Comparison and Sensitivity Evaluation
Electroanalytical methods are indispensable tools in modern laboratories, particularly in pharmaceutical and biomedical research, where the demand for fast, sensitive, and cost-effective analytical methods is constant [3]. These techniques measure electrical properties like voltage, current, or resistance to gain insights into the chemical properties of a solution [3]. This guide focuses on the comparison between two primary electroanalytical techniques: potentiometry and voltammetry. The core distinction lies in what they measure; potentiometry is a zero-current technique that measures the potential difference between two electrodes, while voltammetry measures the current that flows in an electrochemical cell as a function of an applied potential [3] [64]. Understanding their relative performance, especially in terms of sensitivity and the statistical frameworks for their comparison, is crucial for selecting the appropriate method in drug development and other scientific fields.
Fundamental Principles and Analytical Performance
Core Principles and Techniques
Potentiometry operates on the principle of measuring the potential at an indicator electrode relative to a reference electrode under conditions of zero current. This potential is related to the concentration (more precisely, the activity) of an ion in solution by the Nernst equation [83] [3]. The most ubiquitous application is the pH glass electrode. Beyond pH, ion-selective electrodes (ISEs) are used to measure specific ions like sodium (Na⁺), potassium (K⁺), calcium (Ca²⁺), and chloride (Cl⁻) in clinical and environmental samples [3]. A variant is chronopotentiometry, which applies a constant current and measures potential as a function of time [64].
Voltammetry encompasses a family of techniques where the current is monitored as the potential applied to a working electrode is systematically varied. The resulting plot of current versus potential is called a voltammogram [83] [3]. Key voltammetric techniques include:
- Cyclic Voltammetry (CV): The potential is scanned linearly in a forward and reverse direction, creating a characteristic "duck-shaped" or butterfly-like plot. It is primarily used to study the reversibility, kinetics, and mechanism of redox reactions [3] [84].
- Differential Pulse Voltammetry (DPV) and Square Wave Voltammetry (SWV): These pulsed techniques apply small, successive potential pulses to the working electrode. They minimize background (charging) current, leading to significantly higher sensitivity for trace analysis of organic compounds, pharmaceuticals, and heavy metals compared to classical voltammetry [3].
- Anodic Stripping Voltammetry (ASV): This is a two-step technique involving the pre-concentration of an analyte onto the electrode surface by electrochemical reduction, followed by a potential sweep that oxidizes (strips) the material back into solution. This pre-concentration step grants ASV exceptional sensitivity, allowing for the detection of metal ions at sub-parts-per-billion levels [83].
Comparative Analytical Figures of Merit
The following table summarizes the key performance characteristics of potentiometry and voltammetry, highlighting their differences and optimal use cases.
Table 1: Comparative Analytical Performance of Potentiometry and Voltammetry
| Feature | Potentiometry | Voltammetry |
|---|---|---|
| Measured Signal | Potential (Volts) | Current (Amperes) |
| Typical Sensitivity | ~ 10⁻⁸ M (for ISEs) [83] | 10⁻¹² to 10⁻¹ M (wide linear range) [83] |
| Key Applications | pH measurement, ion-selective electrodes (Na⁺, K⁺, Ca²⁺), potentiometric titrations [3] | Trace metal analysis, drug quantification, study of reaction kinetics and mechanisms, detection of eluted analytes in HPLC [83] [3] |
| Key Advantages | Simple, fast, non-destructive, suitable for continuous monitoring, low-cost instrumentation [3] | Excellent sensitivity, wide linear dynamic range, provides both qualitative and quantitative data, well-suited for automation and miniaturization [83] [3] |
| Limitations | Generally lower sensitivity than voltammetry; selectivity can be an issue for some ISEs; measures ion activity, not direct concentration | Requires dissolved electroactive species; can be affected by dissolved oxygen; more complex instrumentation and data interpretation |
Statistical Framework for Method Comparison
When introducing a new analytical method, it is essential to determine its comparability to an established one. This is done through a method-comparison study, which assesses the bias (a measure of systematic error) between the two methods [85]. The fundamental question is whether the two methods can be used interchangeably without affecting clinical or research outcomes [86].
Study Design and Data Collection
A well-designed experiment is the foundation of a valid method comparison [86]. Key considerations include:
- Sample Selection: At least 40, and preferably 100, patient or test samples should be used. These samples must cover the entire clinically or analytically meaningful measurement range to adequately assess the relationship between the methods across all potential values [86] [85].
- Paired Measurements: Each sample is measured by both the established (reference) method and the new (test) method. To minimize random variation, duplicate measurements for both methods are recommended [86].
- Timing: Measurements with the two methods should be made as simultaneously as possible, especially if the analyte is unstable or changes rapidly [85].
- Analysis over Multiple Runs: Samples should be measured over several days (at least 5) and multiple analytical runs to mimic real-world conditions and capture between-run variability [86].
Data Analysis and Interpretation
A common mistake is using inappropriate statistical tests like correlation analysis or the t-test. Correlation (e.g., Pearson's r) measures the strength of a linear relationship between two methods, not their agreement. A high correlation does not imply that the methods are equivalent, as one method could consistently read higher than the other [86]. The t-test detects whether the average values of two sets of measurements are statistically different, but with a large sample size, it may flag a statistically significant but clinically irrelevant difference, or with a small sample, miss a large but clinically important difference [86].
The recommended analytical approach involves both graphical and statistical methods:
- Scatter Plot: A simple plot of the reference method (X-axis) versus the test method (Y-axis) provides a visual overview of the data and helps identify the relationship and potential outliers [86].
- Bland-Altman Plot: This is the gold standard for assessing agreement between two methods [85]. The plot displays the average of the two methods [(Method A + Method B)/2] on the X-axis against the difference between them (Method A - Method B) on the Y-axis.
- Bias: The mean of all the differences is plotted as a solid horizontal line, representing the average systematic difference between the two methods [85].
- Limits of Agreement (LOA): The bias ± 1.96 standard deviations of the differences is plotted as dashed horizontal lines. These limits define the range within which 95% of the differences between the two methods are expected to lie [85].
- Interpretation: The clinical or analytical acceptability is judged by whether the bias and the LOA fall within pre-defined, clinically acceptable limits. If they do, the methods can be considered interchangeable.
The following diagram illustrates the logical workflow and key outputs of a robust method-comparison study:
Experimental Protocols for Sensitivity Evaluation
General Electrochemical Cell Setup
Both potentiometry and voltammetry typically use a three-electrode system, which provides precise control over the working electrode potential [3].
- Working Electrode (WE): This is where the redox reaction of interest occurs. Common materials include glassy carbon, platinum, gold, and for some voltammetric applications, mercury [83] [3].
- Reference Electrode (RE): This electrode provides a stable and known potential (e.g., Ag/AgCl, saturated calomel electrode) against which the working electrode's potential is measured or controlled [83] [3].
- Counter Electrode (CE): Also known as the auxiliary electrode, this completes the circuit, carrying the current needed to balance the current at the working electrode [83] [3].
Protocol: Cyclic Voltammetry for Reaction Reversibility
Cyclic voltammetry is a powerful tool for probing the electrochemical properties of a compound [84].
Workflow:
- Preparation: Switch on the potentiostat ~30 minutes before use to warm up. Clean the working and counter electrodes with a suitable solvent [84].
- Cell Assembly: Prepare an electrolyte solution containing the analyte. Insert the three electrodes into the cell. Gently bubble inert gas (e.g., N₂) through the solution for ~10 minutes to remove dissolved oxygen, which can interfere with the measurement [84].
- Parameter Setting: In the software, set the initial potential, final potential, and switching potential(s). Select an appropriate scan rate (e.g., 50-500 mV/s).
- Measurement: Withdraw the gas tube and start the measurement. The potential is swept linearly from the initial to the final potential and then back again [84].
- Data Analysis: The resulting voltammogram provides key parameters:
- Anodic Peak Current (Ipa) and Potential (Epa)
- Cathodic Peak Current (Ipc) and Potential (Epc)
- Reversibility Assessment: For a reversible reaction, the peak potential separation (ΔEp = Epa - Epc) is approximately 59/n mV (at 25°C), and the ratio of peak currents (Ipa/Ipc) is close to 1 [84].
The experimental workflow for a voltammetric analysis, highlighting the critical steps for obtaining reliable data, is shown below:
The Scientist's Toolkit: Essential Research Reagents and Materials
Table 2: Key Reagents and Materials for Electroanalytical Experiments
| Item | Function | Example Use Cases |
|---|---|---|
| Potentiostat | The main instrument that controls the potential between WE and RE and measures the current between WE and CE. | Essential for all voltammetric and amperometric experiments [3]. |
| Electrochemical Cell | The container that holds the sample solution and electrodes. Material (e.g., glass, Teflon) is selected to minimize reaction with the sample [83]. | Used in all electrochemical experiments. |
| Working Electrodes (Glassy Carbon, Pt, Au) | Provides the surface where the controlled redox reaction occurs. Material is chosen based on the potential window and analyte [83] [84]. | Glassy carbon is a common general-purpose electrode. |
| Reference Electrodes (Ag/AgCl, SCE) | Provides a stable, known reference potential for the working electrode [83] [3]. | Used in all potentiometric and voltammetric experiments to ensure potential control. |
| Supporting Electrolyte | A high-concentration, electroinactive salt (e.g., KCl, TBAPF₆) added to the solution. It carries current to minimize solution resistance and defines the ionic strength [84]. | Used in virtually all voltammetry experiments to ensure conductivity. |
| Redox Active Probe | A well-characterized compound used to validate instrument and electrode performance. | Ferrocene/Ferrocenium couple is often used in non-aqueous solvents [84]. |
Potentiometry and voltammetry offer complementary strengths for analytical scientists. Potentiometry excels in simple, direct ion activity measurements like pH and specific ions, while voltammetry provides superior sensitivity and a powerful platform for both quantitative trace analysis and qualitative mechanistic studies. The choice between them hinges on the specific analytical problem: required sensitivity, the need for speciation information, and the nature of the analyte.
A rigorous, statistically sound method-comparison study, centered on Bland-Altman analysis rather than correlation coefficients, is critical for objectively evaluating a new method against an established one. By adhering to proper experimental design, employing the appropriate statistical tools, and understanding the fundamental capabilities of each technique, researchers and drug development professionals can make informed decisions to ensure the accuracy and reliability of their analytical data.
For researchers and scientists in drug development, selecting the appropriate analytical technique is paramount for obtaining reliable, sensitive, and actionable data. Electrochemical methods, particularly potentiometry and voltammetry, offer powerful tools for quantifying analytes across diverse applications, from pharmaceutical analysis to environmental monitoring. However, their fundamental operational principles dictate distinct sensitivity profiles, making each technique uniquely suited to specific analytical challenges. This guide provides a objective comparison of potentiometry and voltammetry, focusing on their performance characteristics for sensitivity-driven applications. We examine the underlying theoretical frameworks, present experimental data, and detail methodologies to empower professionals in making informed decisions aligned with their research objectives and sensitivity requirements.
The core distinction lies in what each technique measures. Potentiometry is a zero-current technique that measures the potential (voltage) difference between two electrodes when no significant current flows through the electrochemical cell [3] [87] [2]. This potential is logarithmically related to the activity (concentration) of the target ion via the Nernst equation. In contrast, voltammetry is a dynamic technique that applies a controlled potential profile to an electrochemical cell and measures the resulting current response [3] [88] [89]. This current is directly proportional to the concentration of the electroactive species, providing a direct quantitative signal.
Theoretical Foundations and Sensitivity
Fundamental Operational Principles
The sensitivity of each technique is governed by its fundamental operational principles and the mathematical relationship between the measured signal and analyte concentration.
Potentiometric Sensitivity is governed by the Nernst equation: E = E° + (RT/nF) ln(a) where E is the measured potential, E° is the standard electrode potential, R is the gas constant, T is the absolute temperature, n is the number of electrons transferred, F is the Faraday constant, and a is the ion activity [87] [2]. This logarithmic relationship means that a tenfold change in concentration results in a fixed potential change—approximately 59.2 mV for a monovalent ion and 29.6 mV for a divalent ion at 25°C [87]. This establishes an inherent limitation: detecting small concentration changes requires highly precise voltage measurements. For instance, distinguishing a 1% change in concentration for a monovalent ion demands a measurement precision of about 0.25 mV [90].
Voltammetric Sensitivity arises from the direct proportionality between the faradaic current and the concentration of the electroactive species, as described by various voltammetric equations (e.g., the Cottrell equation for chronoamperometry). The measured current i is related to concentration C by: i = nFACf(t) where A is the electrode area, and f(t) is a function of time and mass transport [88]. This linear relationship allows voltammetry to achieve exceptionally low detection limits, often in the nanomolar to picomolar range, particularly with pulsed techniques like Differential Pulse Voltammetry (DPV) or Square Wave Voltammetry (SWV) that effectively minimize the non-faradaic (capacitive) background current [3] [88].
Direct Sensitivity Comparison Table
The following table summarizes the key sensitivity parameters for potentiometry and voltammetry, illustrating their distinct performance characteristics.
Table 1: Sensitivity and Performance Parameters of Potentiometry and Voltammetry
| Parameter | Potentiometry | Voltammetry |
|---|---|---|
| Fundamental Relationship | Logarithmic (Nernstian) [87] [2] | Linear [88] [89] |
| Theoretical Sensitivity | ~59.2 mV/decade (monovalent ion) [87] | Current directly proportional to concentration |
| Typical Detection Limits | ~10⁻⁶ to 10⁻⁸ M [3] [18] | ~10⁻⁸ to 10⁻¹¹ M [3] [91] |
| Precision Requirement | High (e.g., ±0.1 mV for <0.4% conc. change) [90] | Moderate |
| Dynamic Range | Wide, typically several decades [3] | Wide, typically several decades [3] |
| Key Advantage for Sensitivity | Excellent for precise measurement at moderate-to-high concentrations | Superior for trace-level analysis and low detection limits |
Experimental Protocols for Sensitivity Assessment
Protocol for Potentiometric Sensitivity Measurement
This protocol outlines the procedure for determining the sensitivity and detection limit of an Ion-Selective Electrode (ISE), a common potentiometric sensor.
1. Electrode and Solution Preparation:
- Ion-Selective Electrode (ISE): Use a commercial or lab-fabricated ISE (e.g., solid-contact K⁺-ISE with valinomycin ionophore) [90].
- Reference Electrode: Use a stable reference electrode (e.g., Ag/AgCl with KCl electrolyte) [3] [87].
- Standard Solutions: Prepare a series of standard solutions of the primary ion (e.g., KCl for K⁺) spanning a concentration range from 10⁻⁷ M to 10⁻¹ M. Use a constant, high ionic strength background (e.g., 0.1 M NaClO₄ or a specific buffer) to maintain a consistent ionic strength and minimize junction potentials [87].
2. Measurement Procedure:
- Condition the ISE in a solution of the primary ion (e.g., 0.01 M KCl) until a stable potential is obtained [90].
- Immerse the ISE and reference electrode in the standard solution with the lowest concentration. Stir the solution gently and continuously.
- Measure the cell potential (EMF) once it stabilizes (±0.1 mV over 60 seconds). Use a high-impedance voltmeter (>10¹² Ω) to prevent current draw [2] [92].
- Rinse the electrodes thoroughly with deionized water between measurements.
- Repeat the measurement for each standard solution in order of increasing concentration.
3. Data Analysis and Sensitivity Determination:
- Plot the measured potential (E, mV) versus the logarithm of the primary ion activity (log a). Activity can be approximated by concentration for initial assessments.
- Perform linear regression on the linear portion of the calibration curve.
- The slope of the linear region is the experimental sensitivity (mV/decade), which should be close to the theoretical Nernstian slope (59.2/z mV/decade at 25°C) [87].
- The detection limit is conventionally determined from the intersection of the two extrapolated linear segments of the calibration curve (Nernstian and non-Nernstian regions) [8].
Protocol for Voltammetric Sensitivity Measurement (Differential Pulse Voltammetry)
This protocol utilizes Differential Pulse Voltammetry (DPV), a highly sensitive voltammetric technique, for trace metal analysis [91].
1. Electrode and Solution Preparation:
- Working Electrode: Prepare a clean solid electrode (e.g., Glassy Carbon Electrode). Polish sequentially with 1.0, 0.3, and 0.05 μm alumina slurry on a microcloth, followed by sonication in deionized water [90].
- Reference and Counter Electrodes: Use an Ag/AgCl reference electrode and a platinum wire or graphite rod as the counter electrode [18].
- Supporting Electrolyte: Prepare a high-purity electrolyte solution (e.g., 0.1 M acetate buffer, pH 4.5, or 0.59 M NaCl for seawater analysis) that does not produce interfering Faradaic currents in the potential window of interest [91].
- Analyte Standard Solutions: Prepare a stock solution of the target analyte (e.g., Cd²⁺) and serially dilute with the supporting electrolyte to create standards covering the expected concentration range (e.g., 10⁻⁹ to 10⁻⁶ M).
2. Measurement Procedure (DPV):
- Transfer the supporting electrolyte into the electrochemical cell. De-aerate with an inert gas (e.g., N₂ or Ar) for at least 10 minutes to remove dissolved oxygen.
- Immerse the three-electrode system (working, reference, counter) into the solution.
- Set the DPV parameters on the potentiostat. Typical settings include: pulse amplitude of 50 mV, pulse width of 50 ms, scan increment of 2-5 mV, and a scan rate of 10-20 mV/s [3] [91].
- Run the DPV scan over the appropriate potential window to establish a baseline.
- Add small, known volumes of the analyte stock solution to the cell. After each addition, de-aerate briefly and run a new DPV scan.
3. Data Analysis and Sensitivity Determination:
- Measure the peak current (iₚ) for each voltammogram.
- Plot the peak current (iₚ) versus the analyte concentration.
- Perform linear regression analysis. The slope of the resulting calibration curve represents the experimental sensitivity (e.g., in μA/μM) [91] [18].
- The limit of detection (LOD) is calculated as 3 times the standard deviation of the blank (y-intercept) divided by the sensitivity (slope) of the calibration curve.
Essential Research Reagent Solutions
Successful implementation of the aforementioned protocols requires specific, high-quality materials. The following table details key reagents and their functions.
Table 2: Essential Research Reagents for Potentiometric and Voltammetric Experiments
| Reagent/Material | Function | Example Application |
|---|---|---|
| Ionophores (e.g., Valinomycin) | Selective binding of target ions in the ISE membrane [87] [90] | Potentiometric K⁺-selective electrodes |
| Ion-Exchangers (e.g., KTFPB) | Provides ionic sites and controls membrane resistance in polymer membranes [90] | Solid-contact ISEs for various cations and anions |
| Polymer Membrane Matrix (e.g., PVC) | Serves as a support matrix for the ion-sensing components [87] [90] | Fabrication of ISE membranes |
| Plasticizers (e.g., DOS, o-NPOE) | Provides fluidity and solubility for membrane components [90] | Optimizing ISE membrane properties |
| Conducting Polymers (e.g., PEDOT(PSS)) | Acts as an ion-to-electron transducer in solid-contact ISEs [8] [90] | Improving potential stability of SCISEs |
| Supporting Electrolyte Salts | Minimizes migration current and provides a conductive medium [91] [88] | Voltammetric analysis in aqueous solutions |
| Electrode Polishing Materials | Renews the electrode surface for reproducible results [90] | Cleaning glassy carbon and metal electrodes |
The choice between potentiometry and voltammetry for sensitivity needs is not a matter of one technique being universally superior, but rather of matching the technique's inherent strengths to the specific analytical problem.
Choose Potentiometry when the application involves direct measurement of ionic activity (e.g., pH, Na⁺, K⁺, Ca²⁺) at physiologically or environmentally relevant concentrations, where the primary requirement is high precision for moderate concentration changes rather than ultra-low detection limits [3] [87]. Its simplicity, portability, and suitability for continuous monitoring and miniaturization in point-of-care devices make it ideal for clinical chemistry and process control [8]. Recent advancements in solid-contact ISEs and coulometric transduction are progressively addressing its traditional sensitivity limitations [90].
Choose Voltammetry when the analytical challenge requires trace-level detection (e.g., heavy metals in environmental samples, pharmaceutical impurities), speciation analysis, or the study of reaction kinetics and mechanisms [3] [91] [88]. Its linear response and direct concentration readout offer superior sensitivity and lower detection limits. Pulsed techniques like DPV and SWV are particularly effective for analyzing complex matrices. Voltammetry is the preferred method for quantifying specific electroactive organic molecules, drugs, and for applications demanding the utmost sensitivity.
Ultimately, the decision should be guided by the required detection limit, the nature of the analyte (ionic vs. electroactive molecule), the sample matrix, and the desired operational context (e.g., field-portable vs. lab-based analysis). By leveraging their complementary strengths, researchers can effectively harness these powerful electrochemical tools to advance their scientific and developmental goals.
In pharmaceutical and biological analysis, the ability to detect minute concentrations of active compounds, metabolites, and biomarkers directly impacts diagnostic capabilities, therapeutic monitoring, and research outcomes. Electrochemical sensing techniques, primarily potentiometry and voltammetry, have emerged as powerful tools in this pursuit, offering distinct pathways to achieving high sensitivity. Potentiometry measures the potential difference between electrodes at equilibrium conditions (zero current), with the response following a logarithmic relationship to analyte concentration as described by the Nernst equation [3]. In contrast, voltammetry is a dynamic technique that applies a controlled potential sweep to an electrode and measures the resulting current, providing a direct proportional relationship between current response and analyte concentration [3] [45]. The fundamental differences in their sensing principles inherently shape their sensitivity profiles and applicability domains.
Recent advancements in nanomaterials science and electrode engineering have significantly accelerated progress in both techniques, pushing detection limits toward previously unattainable ranges. Novel composite materials, including two-dimensional MXenes, metal-organic frameworks (MOFs), molecularly imprinted polymers, and precisely engineered nanoparticle composites, have demonstrated remarkable capabilities in enhancing electron transfer kinetics, increasing electroactive surface areas, and improving selectivity in complex matrices [93] [94]. This comparative analysis examines the evolving sensitivity boundaries of modern potentiometric and voltammetric sensors, evaluates their performance across pharmaceutical applications, and explores how emerging materials and methodological innovations are reshaping the landscape of electrochemical analysis.
Fundamental Principles and Sensitivity Mechanisms
Theoretical Foundations Governing Sensitivity
The theoretical frameworks governing sensitivity in potentiometry and voltammetry stem from their distinct operational principles. In potentiometric sensors, the measured potential (E) relates to the target ion activity (a) through the Nernst equation: E = E⁰ + (RT/zF)ln(a), where E⁰ is the standard potential, R is the gas constant, T is temperature, z is the ion charge, and F is Faraday's constant [3]. This logarithmic relationship provides a wide dynamic range but can theoretically detect infinitesimal changes in activity, with practical limitations arising from the phase boundary potential stability and membrane composition.
Voltammetric techniques, including cyclic voltammetry (CV) and differential pulse voltammetry (DPV), rely on the relationship between faradaic current and analyte concentration governed by the Cottrell equation or Randles-Ševčík equation, depending on the mass transport conditions [45]. The current response is directly proportional to concentration, enabling highly sensitive detection at trace levels, particularly when using pulsed techniques that minimize charging currents [94] [3]. For reversible systems, sensitivity is ultimately constrained by the diffusion layer thickness and electron transfer kinetics, which nanomaterials can dramatically optimize.
Key Sensitivity Parameters in Comparative Analysis
- Detection Limit: The lowest concentration distinguishable from background noise, typically calculated as 3× signal-to-noise ratio (S/N)
- Dynamic Range: The concentration interval over which the sensor provides a linear or logarithmic response
- Slope Sensitivity: For potentiometry, the Nernstian slope (mV/decade); for voltammetry, the current-concentration slope (μA/μM)
- Signal-to-Noise Ratio: The ratio of faradaic current to non-faradaic background in voltammetry; potential stability in potentiometry
Performance Comparison: Quantitative Data Analysis
Table 1: Comparative Sensitivity Performance of Modern Potentiometric and Voltammetric Sensors
| Analyte | Technique | Sensor Material | Linear Range | Detection Limit | Sensitivity | Reference |
|---|---|---|---|---|---|---|
| Hg²⁺ | Potentiometry | WS₂-WO₃/P2ABT nanocomposite | 10⁻⁶ to 10⁻¹ M | - | 33.0 mV/decade | [18] |
| Hg²⁺ | Cyclic Voltammetry | WS₂-WO₃/P2ABT nanocomposite | 10⁻⁶ to 10⁻¹ M | - | 2.4 μA/M | [18] |
| Cu²⁺ | Potentiometry | Schiff base-modified CPE | 10⁻⁷ to 10⁻¹ M | 5.0×10⁻⁸ M | 29.57 mV/decade | [11] |
| Thymoquinone | Square-Wave Voltammetry | Carbon paste electrode | - | 8.9 nM | - | [15] |
| Dopamine | Voltammetry | Microelectrode arrays | - | 10⁻⁷ M | - | [9] |
| Oligopeptides & Amino Acids | Voltammetric E-tongue (PLS-DA) | Carbon-paste electrodes with NPs | - | - | Accuracy: ~94% (test set) | [95] |
Table 2: Advanced Material Contributions to Sensitivity Enhancement
| Material Category | Key Properties Enhancing Sensitivity | Demonstrated Impact | Compatible Techniques |
|---|---|---|---|
| MXenes | High electrical conductivity, large surface area, tunable surface chemistry | Sub-nanomolar detection limits for antibiotics and NSAIDs | Voltammetry, EIS [94] |
| Schiff base ligands | Selective metal coordination, stable complex formation | Nernstian response for Cu²⁺ with LOD of 50 nM | Potentiometry [11] |
| Pillar[5]arenes | Rigid tubular structure, host-guest complexation | Broad cross-sensitivity for cation detection | Potentiometry [96] |
| Metal oxide-polymer nanocomposites | Synergistic enhancement, increased active sites | Nernstian response to Hg²⁺ over 6 orders of magnitude | Potentiometry, Voltammetry [18] |
| Molecularly Imprinted Polymers (MIPs) | Predefined molecular recognition cavities | Excellent selectivity in complex matrices | Voltammetry, Potentiometry [93] |
Experimental Protocols for High-Sensitivity Applications
Protocol 1: Nanocomposite-Based Potentiometric Sensor for Metal Ions
This protocol outlines the development of a highly sensitive potentiometric sensor for heavy metal detection, adapted from methodologies with proven sub-micromolar detection capabilities [18] [11].
Sensor Fabrication:
- Composite Synthesis: Prepare WS₂-WO₃/P2ABT nanocomposite by oxidative polymerization of 2-aminobenzene-1-thiol (0.06 M) in 1.0 M HCl with simultaneous addition of Na₂WO₄ (0.06 M) and K₂S₂O₈ (0.06 M) as oxidants. React for 24 hours at ambient temperature to ensure complete nanocomposite formation [18].
- Electrode Preparation: For carbon paste electrodes, thoroughly mix 250 mg graphite powder with 5-20 mg ionophore (e.g., Schiff base ligand) and 0.1 mL plasticizer (o-NPOE, DOP, TCP, DBP, or DHP) in a mortar until homogeneous [11].
- Sensor Assembly: Pack the modified paste into a Teflon electrode body equipped with a stainless-steel rod for electrical contact. Polish the sensor surface on filter paper to create a fresh, reproducible sensing interface.
Measurement Procedure:
- Conditioning: Soak the prepared sensor in distilled water for 24 hours before initial use to stabilize the membrane potential.
- Potential Measurement: Use a two-electrode cell configuration with the modified sensor as working electrode and a saturated calomel electrode (Hg/Hg₂Cl₂) or Ag/AgCl as reference [18] [3].
- Data Collection: Measure potential values across a concentration range from 10⁻⁷ to 10⁻¹ M, allowing 15-30 seconds for stabilization at each concentration [11].
- Calibration: Plot potential (mV) versus logarithm of concentration to obtain the Nernstian slope, with ideal performance achieving 59.16/z mV/decade for monovalent ions at 25°C.
Protocol 2: Advanced Voltammetric Sensing of Bioactive Compounds
This protocol describes a highly sensitive voltammetric approach for quantifying electroactive pharmaceutical compounds, incorporating optimal signal enhancement strategies [94] [15].
Electrode Preparation and Modification:
- Surface Pretreatment: For glassy carbon electrodes (GCE), polish sequentially with 0.3 and 0.05 μm alumina slurry on a microcloth, followed by rinsing with distilled water and solvent (ethanol/acetone) [94].
- Nanomaterial Deposition: Prepare a dispersion of MXene (Ti₃C₂Tₓ) or carbon nanotubes (1 mg/mL) in DMF and deposit 5-10 μL onto the electrode surface. Allow to dry under infrared lamp to form a uniform film [94].
- Alternative Approach: For carbon paste electrodes, mix graphite powder with paraffin oil in a 1.0g:0.3mL ratio. Incorporate modifying agents directly into the paste composition for enhanced stability [15].
Voltammetric Measurement:
- Supporting Electrolyte Selection: Use Britton-Robinson buffer (pH 2.0-6.0) or specific electrolytes optimized for target analyte, ensuring adequate ionic strength [15].
- Technique Selection: Apply square-wave voltammetry (SWV) with optimized parameters (pulse amplitude 25 mV, frequency 15 Hz, step potential 5 mV) for maximal sensitivity with minimal background contribution [94] [15].
- Standard Addition Method: For complex matrices, employ standard addition methodology with 3-5 successive additions of standard analyte solution to account for matrix effects.
- Signal Verification: Perform repeated measurements (n≥3) to ensure reproducibility, with relative standard deviation (RSD) ideally below 5%.
Data Analysis:
- Peak Identification: Determine characteristic oxidation/reduction potentials through initial cyclic voltammetry scans at 50-100 mV/s [45].
- Calibration Construction: Plot peak current (height or area) versus concentration, applying linear regression analysis. For the thymoquinone quantification, peak current height provided the broadest linear range [15].
- Detection Limit Calculation: Calculate LOD as 3σ/slope, where σ is the standard deviation of the blank signal and slope is from the calibration curve.
Advanced Materials and Nanofabrication Strategies
Novel Material Classes Enhancing Sensitivity
The strategic incorporation of advanced materials has demonstrated remarkable capabilities in pushing sensitivity boundaries for both potentiometric and voltammetric platforms:
MXenes and 2D Materials: These emerging two-dimensional transition metal carbides, nitrides, and carbonitrides offer exceptional electrical conductivity (≈10,000 S/cm) and rich surface chemistry that facilitates rapid electron transfer kinetics. Their metallic conductivity and hydrophilic surfaces make them particularly effective for enhancing signal-to-noise ratios in voltammetric detection of pharmaceuticals, enabling sub-nanomolar detection limits for antibiotics and NSAIDs [94].
Supramolecular Recognition Elements: Pillar[5]arenes and related macrocyclic compounds provide precisely defined molecular cavities for host-guest interactions. Their rigid, pillar-shaped architecture with tunable functional groups enables selective binding of specific ions and molecules through multiple non-covalent interactions. While these materials often demonstrate broad cross-sensitivity rather than sharp selectivity, they create valuable recognition motifs for array-based sensing and multisensor systems [96].
Metal-Organic Frameworks (MOFs) and Coordination Polymers: These porous crystalline materials offer exceptionally high surface areas and programmable functionality through careful selection of metal nodes and organic linkers. Their well-defined pore structures can be engineered for size-selective recognition, while their redox-active metal centers can provide additional electron transfer pathways for signal amplification in voltammetric applications [93].
Molecularly Imprinted Polymers (MIPs): These synthetic polymers create predetermined recognition sites complementary to target molecules in shape, size, and functional group orientation. Their thermal and chemical stability surpasses biological recognition elements, making them ideal for harsh measurement environments. The "fingerprint" matching between cavity and analyte significantly enhances selectivity in complex matrices, directly improving measurable sensitivity by reducing interference effects [93].
Nanofabrication Techniques for Sensitivity Optimization
Precise nanofabrication methods enable controlled integration of sensitive materials onto transducer surfaces:
Electrodeposition: This potential-controlled or current-controlled technique allows precise thickness control of nanostructured films through manipulation of deposition parameters. The method particularly benefits metal nanoparticle deposition and conducting polymer formation, creating high-surface-area architectures that enhance both potentiometric and voltammetric responses [93].
Drop-Casting and Self-Assembled Monolayers (SAMs): Simple solution-phase deposition of nanomaterial dispersions provides a straightforward approach for creating modified electrodes. When combined with SAMs of functionalized thiols on gold or silanes on oxide surfaces, these methods produce highly organized interfacial architectures with controlled orientation of recognition elements [93].
Screen-Printing and Microfabrication: These mass production techniques enable cost-effective sensor manufacturing with excellent reproducibility. Recent advances permit integration of multiple working electrodes, reference electrodes, and even microfluidic channels onto single platforms, minimizing sample volume requirements while maximizing measurement consistency [93] [94].
The Scientist's Toolkit: Essential Research Reagents and Materials
Table 3: Essential Research Reagents and Materials for High-Sensitivity Electrochemical Sensing
| Category | Specific Materials | Function in Sensitivity Enhancement | Application Examples |
|---|---|---|---|
| Electrode Materials | Glassy carbon, Screen-printed carbon, Gold disk, Platinum wire | Provide stable, reproducible electrode surface with minimal background | Baseline electrodes for modification [94] |
| Nanomaterials | MXenes, Carbon nanotubes, Graphene, Metal nanoparticles | Enhance electron transfer, increase surface area, catalytic activity | Signal amplification in voltammetry [93] [94] |
| Recognition Elements | Schiff bases, Pillar[5]arenes, Crown ethers, Molecularly imprinted polymers | Selective target binding, molecular recognition, host-guest chemistry | Ion-selective membranes, sensor arrays [11] [96] |
| Polymer Matrices | PVC, Poly(3,4-ethylenedioxythiophene), Nafion, Polyvinylpyrrolidone | Membrane formation, ion-to-electron transduction, interference rejection | Potentiometric membranes, electrode modification [93] [96] |
| Plasticizers | o-Nitrophenyl octyl ether, Dioctyl phthalate, Tricresyl phosphate | Adjust membrane dielectric constant, influence ionophore selectivity | PVC-based ion-selective membranes [11] [96] |
| Electrolytes | Phosphate buffer, Britton-Robinson buffer, Lithium perchlorate, Potassium chloride | Control ionic strength, pH, provide conducting medium | Supporting electrolytes [18] [15] |
Future Perspectives and Concluding Analysis
The ongoing pursuit of sensitivity boundaries in electrochemical sensing is increasingly focused on hybrid approaches that leverage the complementary strengths of both potentiometric and voltammetric principles. Several emerging trends are positioned to further push detection limits:
Intelligent Sensor Systems: The integration of machine learning algorithms with multisensor arrays represents a paradigm shift from single-analyte detection to comprehensive sample profiling. As demonstrated in electronic tongue systems employing pattern recognition techniques like PLS-DA and SVM-DA, computational analysis of cross-sensitive sensor responses can extract meaningful information from complex mixtures, effectively enhancing functional sensitivity through multivariate calibration [95]. This approach is particularly valuable for pharmaceutical analysis where multiple interfering compounds may be present.
Advanced Material Architectures: Future developments will likely explore more sophisticated heterostructures and composite materials that combine the advantages of multiple nanomaterial classes. Examples include MXene-metal organic framework hybrids that offer both exceptional conductivity and molecular sieving capabilities, or stimuli-responsive polymers integrated with redox-active species that provide signal amplification mechanisms. These tailored architectures will address specific sensitivity limitations related to mass transport, electron transfer kinetics, and interfacial recognition events [93] [94].
Miniaturization and In Vivo Sensing: The development of microelectrode arrays and nanoelectrodes has already demonstrated significant improvements in mass transport efficiency, enabling sensitive detection in small sample volumes and spatially resolved measurements [9] [93]. Continued progress in microfabrication and wireless connectivity will support the creation of implantable sensors for continuous therapeutic monitoring, potentially detecting biomarkers at physiologically relevant concentrations in complex biological matrices.
In conclusion, while voltammetric techniques generally offer lower absolute detection limits for specific electroactive compounds, potentiometric systems provide distinct advantages for continuous monitoring and applications requiring wide dynamic range. The choice between these techniques ultimately depends on the specific analytical requirements, matrix complexity, and desired measurement paradigm. Future breakthroughs will likely emerge from interdisciplinary approaches that combine novel materials with sophisticated measurement protocols and computational analysis, further blurring the traditional boundaries between these complementary electrochemical techniques.
Conclusion
Both potentiometry and voltammetry offer distinct sensitivity profiles that make them uniquely suited for different analytical scenarios in biomedical research. Potentiometry provides exceptional selectivity for ionic species with direct activity measurements and minimal power requirements, while voltammetry enables unparalleled detection limits for electroactive compounds through pre-concentration strategies and multi-parametric information. The choice between techniques ultimately depends on specific sensitivity requirements, target analytes, and matrix complexity. Future advancements in nanomaterials, miniaturization, and data analysis will further enhance sensitivity capabilities, paving the way for next-generation diagnostic tools, point-of-care devices, and sophisticated therapeutic monitoring systems that push detection boundaries to unprecedented levels.
References
- 1. Comparison of the analytical performance of two different ... [https://pubs.rsc.org/en/content/articlehtml/2024/ra/d4ra04629c]
- 2. 11.2: Potentiometric Methods [https://chem.libretexts.org/Bookshelves/Analytical_Chemistry/Analytical_Chemistry_2.1_(Harvey)/11%3A_Electrochemical_Methods/11.02%3A_Potentiometric_Methods]
- 3. Electrochemical Analysis Methods: Potentiometry, ... [https://www.labmanager.com/electrochemical-analysis-methods-potentiometry-voltammetry-and-more-34242]
- 4. 7.5: Voltammetric Methods [https://chem.libretexts.org/Bookshelves/Analytical_Chemistry/Supplemental_Modules_(Analytical_Chemistry)/Analytical_Sciences_Digital_Library/In_Class_Activities/Electrochemical_Methods_of_Analysis/02_Text/7%3A_Electrochemical_Analytical_Methods/7.5%3A_Voltammetric_Methods]
- 5. Comparison Between Potentiometric and Stripping Voltammetric Detection of Trace Metals: Measurements of Cadmium and Lead in the Presence of Thalium, Indium, and Tin - PMC [https://www.ncbi.nlm.nih.gov/pmc/articles/PMC2836769/]
- 6. The Nernst Equation | Knowledge Center [https://www.hamiltoncompany.com/knowledge-base/article/the-nernst-equation?srsltid=AfmBOooAnkoceioY-JvQdI2PiglWUjo5WexJo6eLm2tPPJz2DpWfuLgJ]
- 7. Control Circuits for Potentiostatic/Galvanostatic ... [https://pmc.ncbi.nlm.nih.gov/articles/PMC11398221/]
- 8. New trends in potentiometric sensors: From design to ... [https://www.sciencedirect.com/science/article/abs/pii/S0039914025001092]
- 9. Voltammetric vs. potentiometric sensing of dopamine [https://www.sciencedirect.com/science/article/abs/pii/S0925400514008624]
- 10. A potentiometric sensor for highly selective and sensitive ... [https://www.sciencedirect.com/science/article/abs/pii/S0026265X25008501]
- 11. Characterization of a simple potentiometric graphite based ... [https://www.nature.com/articles/s41598-025-25089-y]
- 12. Applications of Potentiometric Sensors for the ... [https://pubmed.ncbi.nlm.nih.gov/32991203/]
- 13. Square Wave Voltammetry (SWV) [https://pineresearch.com/support-article/square-wave-voltammetry/]
- 14. Optimization of voltammetric parameters and sensitive ... [https://www.sciencedirect.com/science/article/abs/pii/S2214714425012371]
- 15. A voltammetric approach for the quantification of ... [https://www.nature.com/articles/s41598-025-03347-3]
- 16. Preparation and utilization of a new TPM potentiometric ... [https://pubmed.ncbi.nlm.nih.gov/41004942/]
- 17. BAPTA-based potentiometric polymer sensor - RSC Publishing [https://pubs.rsc.org/en/content/articlehtml/2025/tb/d4tb02586e]
- 18. Simple potentiometry and cyclic voltammetry techniques for ... [https://pmc.ncbi.nlm.nih.gov/articles/PMC10811525/]
- 19. Fully 3D-printed solid-contact potentiometric sensor for ... [https://www.sciencedirect.com/science/article/pii/S0956566325007420]
- 20. Characterization of a simple potentiometric graphite based ... [https://pmc.ncbi.nlm.nih.gov/articles/PMC12627583/]
- 21. Novel potentiometric methods for the estimation of bisopr... [https://www.degruyterbrill.com/document/doi/10.1515/revac-2021-0129/html?lang=en&srsltid=AfmBOopU5z8jkaDnu9WgqvDpATaShSru1a0Mbz5ZfHkYNzBPCA8x0YJw]
- 22. Potentiometric Sensors for the Selective Determination of ... [https://www.mdpi.com/2227-9040/10/2/74]
- 23. Electrochemical sensor based on molecularly imprinted ... [https://pubs.rsc.org/en/content/articlehtml/2025/ra/d5ra03963k]
- 24. Determination of melatonin by potentiometric stripping ... [https://www.sciencedirect.com/science/article/abs/pii/S0039914024016795]
- 25. Electrochemical sensor for luteolin detection [https://www.nature.com/articles/s41427-025-00615-6]
- 26. Strategies for Assessing the Limit of Detection in ... [https://pmc.ncbi.nlm.nih.gov/articles/PMC11300140/]
- 27. Perspective Chapter: Comprehensive Overview of Electrochemical Sensors – Advanced Functional Materials, Surface Modification Techniques, Emerging Applications, and Computational Modeling | IntechOpen [https://www.intechopen.com/online-first/1223369]
- 28. A brief review on methods and materials for electrode modification: electroanalytical applications towards biologically relevant compounds | Discover Electrochemistry [https://link.springer.com/article/10.1007/s44373-024-00012-8]
- 29. MIT engineers develop electrochemical for cheap... sensors [https://news.mit.edu/2025/mit-engineers-develop-electrochemical-sensors-cheap-disposable-diagnostics-0701]
- 30. Advances in Nanostructured Electrode Materials [https://pmc.ncbi.nlm.nih.gov/articles/PMC12609608/]
- 31. Recent experimental and theoretical progress in silicene ... [https://www.sciencedirect.com/science/article/abs/pii/S2352152X25002348]
- 32. Understanding Ion Selective Electrodes (ISEs) and Their ... [https://sensorex.com/ion-selective-electrodes/?srsltid=AfmBOophfd99PPNiBbyxtoqFNfINUcEsTWeEw-mPcfH0aeyAL3wubQot]
- 33. Anodic Stripping Voltammetry on a Carbon-based Ion-Selective... [https://pmc.ncbi.nlm.nih.gov/articles/PMC8415442/]
- 34. Selective and sensitive electrochemical sensors based on an ... [https://pubs.rsc.org/en/content/articlehtml/2021/ra/d1ra05489a]
- 35. : predicting and visualizing harmonics Alternating current voltammetry [https://link.springer.com/article/10.1007/s00339-025-08435-9]
- 36. Solid-contact ion-selective electrode for the determination ... [https://pmc.ncbi.nlm.nih.gov/articles/PMC12180174/]
- 37. Design principles of ion selective nanostructured ... [https://www.nature.com/articles/s41467-019-13648-7]
- 38. Recent advances in the design principles of lithium ... [https://www.sciencedirect.com/science/article/pii/S0043135425006335]
- 39. Electrochemical stripping analysis - Wikipedia [https://en.wikipedia.org/wiki/Electrochemical_stripping_analysis]
- 40. Recent Trends in Electrochemical Methods for Real-Time ... [https://www.sciencedirect.com/science/article/abs/pii/S2451910325001085]
- 41. Cyclic Voltammetry Stripping: The Fundamentals [https://www.azom.com/article.aspx?ArticleID=20125]
- 42. Cyclic Voltammetric Stripping (CVS) - Nova [https://www.novami.com/nova-technology/cyclic-voltammetric-stripping-cvs/]
- 43. of direct current, derivative direct current, pulse and... Comparison [https://pubs.rsc.org/en/Content/ArticleLanding/1998/AN/A800494C]
- 44. Electrochemical sensors: Types, applications, and the ... [https://www.sciencedirect.com/science/article/pii/S0956566324011060]
- 45. Electroanalysis Advances in Pharmaceutical Sciences [https://www.mdpi.com/2673-4532/6/2/12]
- 46. Polymer nanocomposite-based biomolecular sensor for ... [https://www.sciencedirect.com/science/article/abs/pii/S000186862500168X]
- 47. A novel MOF-based electrochemical sensor for simultaneous ... [https://pubs.rsc.org/en/content/articlehtml/2025/ra/d5ra03838c?page=search]
- 48. Conductive Polymers and Their Nanocomposites [https://pmc.ncbi.nlm.nih.gov/articles/PMC10536614/]
- 49. Biomimetic dual sensing polymer nanocomposite for ... [https://www.frontiersin.org/journals/bioengineering-and-biotechnology/articles/10.3389/fbioe.2024.1322753/full]
- 50. Electrochemical Sensor for Biological Samples Monitoring [https://link.springer.com/article/10.1007/s11244-025-02080-5]
- 51. Advanced Electrochemical Sensors for Rapid and ... [https://www.mdpi.com/2079-6374/15/9/626]
- 52. Biomarkers and Detection Platforms for Human Health and ... [https://pmc.ncbi.nlm.nih.gov/articles/PMC8895156/]
- 53. Wearable Sensors Market 2025-2035: Technologies, ... [https://www.idtechex.com/en/research-report/wearable-sensors-market-2025/1051]
- 54. State-of-the-art wearable sensors for cardiovascular health [https://www.nature.com/articles/s44325-025-00090-6]
- 55. Recent advances in electrochemical paper-based ... [https://www.sciencedirect.com/science/article/pii/S0013468625014446]
- 56. 3D printed electrode-microwell system: a novel ... [https://pmc.ncbi.nlm.nih.gov/articles/PMC12045820/]
- 57. A comparative study of solid and liquid inner contact ... [https://www.sciencedirect.com/science/article/abs/pii/S0039914012007618]
- 58. A comparative study of green solid contact ion selective ... [https://www.nature.com/articles/s41598-023-47240-3]
- 59. Experimental study on stability of different solid contact ... [https://www.sciencedirect.com/science/article/abs/pii/S0039914010002699]
- 60. Recent Developments and Challenges in Solid-Contact Ion ... [https://pmc.ncbi.nlm.nih.gov/articles/PMC11244314/]
- 61. Solid Contact Potentiometric Sensors for Trace Level ... [https://pmc.ncbi.nlm.nih.gov/articles/PMC2883716/]
- 62. Nitrate sensing with molecular cage ionophores [https://pubs.rsc.org/en/content/articlehtml/2025/sd/d4sd00359d]
- 63. Current and future trends in lithium-ion battery electrode ... [https://www.sciencedirect.com/science/article/pii/S0306261925016988]
- 64. Electroanalytical methods - Wikipedia [https://en.wikipedia.org/wiki/Electroanalytical_methods]
- 65. A Current Averaging Strategy for Maximizing Analyte and ... [https://pmc.ncbi.nlm.nih.gov/articles/PMC11170553/]
- 66. Ohmic drop correction: a means of improving measurement ... [https://www.biologic.net/topics/ohmic-drop-correction-a-means-of-improving-measurement-accuracy-with-potentiostats/]
- 67. Recent Advances in Potentiometric Biosensing - PMC [https://pmc.ncbi.nlm.nih.gov/articles/PMC8162913/]
- 68. 11.4: Voltammetric Methods [https://chem.libretexts.org/Courses/Northeastern_University/CHEM_1000%3A_General_Chemistry/11%3A_Electrochemical_Methods/11.4%3A_Voltammetric_Methods]
- 69. Limitations of Voltmmtrry | PDF | Chemistry [https://www.scribd.com/document/836916921/Limitations-of-Voltmmtrry]
- 70. Strategies for the electrochemical determination of drugs in ... [https://www.sciencedirect.com/science/article/pii/S0731708525004480]
- 71. Electrochemical Sample Matrix Elimination for Trace Level ... [https://pmc.ncbi.nlm.nih.gov/articles/PMC2597708/]
- 72. Perspective—Advances in Voltammetric Methods for the ... [https://pmc.ncbi.nlm.nih.gov/articles/PMC11024638/]
- 73. Advances in MXene-Based Electrochemical Sensors for ... [https://www.mdpi.com/1422-0067/26/11/5368]
- 74. Strategies for assessing the limit of detection in ... [https://pubs.rsc.org/en/content/articlelanding/2024/an/d4an00636d]
- 75. White Analytical Chemistry-Driven Electroanalytical ... [https://www.sciencedirect.com/science/article/pii/S0013468625016986]
- 76. Development and validation of voltammetric method for ... [https://pubmed.ncbi.nlm.nih.gov/33161987/]
- 77. Validation of a Novel Potentiometric Method Based on ... [https://pmc.ncbi.nlm.nih.gov/articles/PMC7361695/]
- 78. A validated potentiometric method for the rapid ... [https://www.sciencedirect.com/science/article/abs/pii/S0308814621013303]
- 79. Reliable environmental trace heavy metal analysis with ... [https://www.sciencedirect.com/science/article/abs/pii/S0269749121014640]
- 80. Measurements of Cadmium and Lead in the Presence ... [https://pmc.ncbi.nlm.nih.gov/articles/PMC2836769/]
- 81. Voltammetric approach for pharmaceutical samples analysis [https://pmc.ncbi.nlm.nih.gov/articles/PMC9743491/]
- 82. Green voltammetric strategy for sensitive determination of ... [https://www.sciencedirect.com/science/article/pii/S2214180425000583]
- 83. Basics of Voltammetry and Potentiometry | PPT [https://www.slideshare.net/slideshow/voltammetry-and-potentiometry/26783046]
- 84. Cyclic Voltammetry Uses | How to Read a Voltammogram | Ossila [https://www.ossila.com/pages/cyclic-voltammetry-applications]
- 85. Design, Analysis and Interpretation of Method-Comparison ... [https://pmc.ncbi.nlm.nih.gov/articles/PMC2944826/]
- 86. Statistical analysis in method comparison studies part one [https://acutecaretesting.org/en/articles/statistical-analysis-in-method-comparison-studies-part-one]
- 87. Potentiometry - an overview [https://www.sciencedirect.com/topics/medicine-and-dentistry/potentiometry]
- 88. Voltammetric techniques of analysis: the essentials [https://link.springer.com/article/10.1007/s40828-015-0016-y]
- 89. Voltammetry - an overview [https://www.sciencedirect.com/topics/biochemistry-genetics-and-molecular-biology/voltammetry]
- 90. Improving the Sensitivity of Solid-Contact Ion-Selective ... [https://pmc.ncbi.nlm.nih.gov/articles/PMC6727616/]
- 91. Advantages and disadvantages of voltammetric method in ... [https://pubmed.ncbi.nlm.nih.gov/10774919/]
- 92. Potentiometry, voltamemtry and conductometry | PPTX [https://www.slideshare.net/slideshow/potentiometry-voltamemtry-and-conductometry/226119755]
- 93. Modern designs of electrochemical sensor for accurate ... [https://www.sciencedirect.com/science/article/abs/pii/S0254058425002342]
- 94. Recent Advances in Electrochemical Sensors for the ... [https://pmc.ncbi.nlm.nih.gov/articles/PMC12563010/]
- 95. Comparison of various data analysis techniques applied ... [https://www.sciencedirect.com/science/article/abs/pii/S0925400520316944]
- 96. Novel Pillar[5]arenes Show High Cross-Sensitivity in PVC- ... [https://www.mdpi.com/2227-9040/10/10/420]