Potentiometric Cell Setup and Components: A Comprehensive Guide for Biomedical Research and Drug Development
This article provides a comprehensive overview of potentiometric cell technology, from foundational principles to cutting-edge applications in biomedical research and drug development.
Potentiometric Cell Setup and Components: A Comprehensive Guide for Biomedical Research and Drug Development
Abstract
This article provides a comprehensive overview of potentiometric cell technology, from foundational principles to cutting-edge applications in biomedical research and drug development. It explores the core components and setup of electrochemical cells, detailing the function of indicator and reference electrodes, and explains the governing Nernst equation. The review covers significant methodological advancements, including the design of solid-contact ion-selective electrodes (SC-ISEs), the use of novel transducer materials like conducting polymers and nanomaterials, and innovative fabrication techniques such as 3D printing for rapid prototyping. It also addresses critical troubleshooting and optimization strategies for enhancing sensor stability, selectivity, and longevity, and discusses rigorous validation protocols and comparative analyses with other analytical techniques. Aimed at researchers and drug development professionals, this guide serves as a vital resource for leveraging potentiometric sensors in clinical diagnostics, therapeutic drug monitoring, and continuous health monitoring.
Core Principles and Components of a Potentiometric Cell
Potentiometry is a fundamental technique in instrumental analysis that involves measuring the potential (or voltage) of an electrochemical cell under static conditions, where no significant current flows through the system [1] [2]. This quantitative method relies on the measurement of the electrical potential difference between two electrodes—an indicator electrode and a reference electrode—when they are immersed in an analyte solution [3]. The measured potential is then related to the concentration of the analyte of interest through the Nernst equation, making potentiometry a powerful tool for quantitative analysis across chemistry, biology, and environmental science [2] [3].
The historical development of potentiometry dates back to the early 20th century when it was first used to measure pH levels in solutions [3]. A significant breakthrough occurred in 1906 when Cremer discovered that the potential difference across a thin glass membrane is a function of pH when opposite sides of the membrane contact solutions with different H₃O⁺ concentrations [2]. This discovery led to the development of the glass pH electrode in 1909, paving the way for modern ion-selective electrodes that have expanded potentiometric applications to a diverse array of analytes [2].
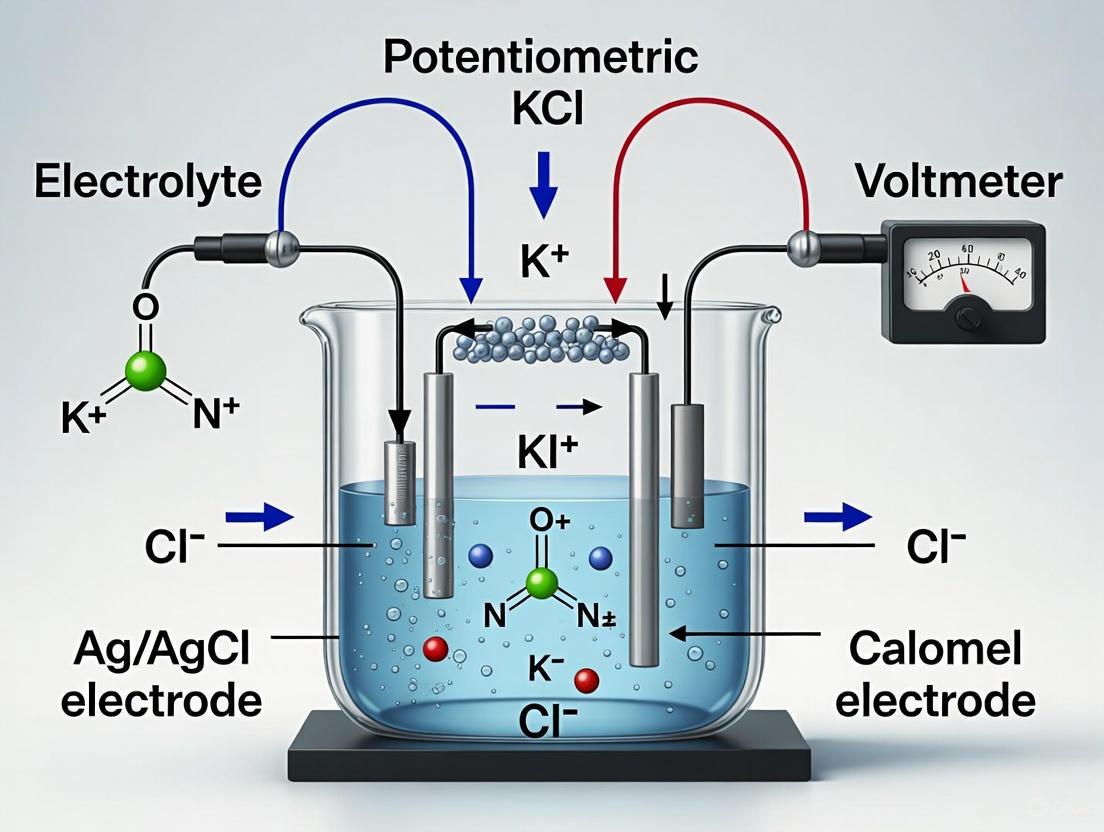
In the context of a broader thesis on potentiometric cell setup and components, understanding the fundamental principles of the two-electrode system is crucial. The conventional cell notation represents this system as reference electrode || indicator electrode, where the measured cell potential is Ecell = Eind - Eref [4]. This configuration forms the basis for all potentiometric measurements, with the reference electrode providing a stable, known potential against which changes in the indicator electrode's potential can be measured and correlated to analyte activity [4].
Theoretical Foundations
The Nernst Equation
The theoretical basis of potentiometry is rooted in the Nernst equation, which describes the relationship between the electrochemical cell potential and the concentration of ions in a solution [1] [3]. For a metal electrode immersed in a solution of its own ions at 25°C, the potential (E) is given by:
E = E⁰ + (0.0592/n) × logC [1]
Where:
- E⁰ represents the standard electrode potential
- n is the valency of the ions
- c is the concentration of ions
In a more general form applicable to various electrochemical systems, the Nernst equation is expressed as:
E = E⁰ - (RT/nF) lnQ [3]
Where:
- R is the gas constant
- T is the temperature in Kelvin
- F is the Faraday constant
- Q is the reaction quotient
It is crucial to note that the Nernst equation relates electrode potential to the activity of electroactive species, not directly to their concentration [2]. This distinction is particularly important in potentiometry, where the difference between activity and concentration cannot be ignored, unlike in some other electrochemical techniques where this difference introduces negligible error [2].
Potential Measurement Principles
In potentiometric measurements, the potential difference between the indicator and reference electrodes is measured under conditions of zero or negligible current flow [1] [2]. This static measurement ensures that the composition of the electrochemical cell remains unchanged during analysis, making potentiometry a non-destructive technique ideal for quantitative analysis [2] [3]. The indicator electrode generates a potential (Eind) that depends on analyte concentration, while the reference electrode maintains a constant potential (Eref) throughout the measurement [1] [4]. The salt bridge connecting the two half-cells completes the electrical circuit while preventing mixing of analyte components [1].
Table 1: Key Components of a Potentiometric Cell and Their Functions
| Component | Symbol | Function |
|---|---|---|
| Reference Electrode | Eref | Provides a stable, known reference potential independent of analyte composition |
| Indicator Electrode | Eind | Generates potential that varies with analyte activity/concentration |
| Salt Bridge | Ej | Completes electrical circuit while minimizing mixing of solutions; generates negligible potential |
| Analyte | A | Solution of interest containing the ions to be measured |
Components of the Potentiometric Cell
Reference Electrodes
Reference electrodes are designed to maintain a constant, stable potential regardless of the composition of the analyte solution [1] [4]. An ideal reference electrode should be easily assembled, rugged, insensitive to analyte concentration, and exhibit reversible behavior obeying the Nernst equation [1]. While the standard hydrogen electrode (SHE) is the primary reference standard against which all other electrode potentials are measured, its practical use is limited due to complexity and sensitivity to interfering substances [1]. Instead, two main reference electrodes find widespread application in modern potentiometry.
The saturated calomel electrode (SCE) is based on the redox couple between Hg₂Cl₂ (calomel) and Hg [1] [4]. The electrode reaction is:
Hg₂Cl₂(s) + 2e⁻ ⇌ 2Hg(l) + 2Cl⁻(aq) [1]
The potential of the SCE depends on the activity of Cl⁻ ions and is typically +0.2444 V at 25°C when using saturated KCl [1] [4]. The SCE consists of an inner tube packed with a paste of Hg, Hg₂Cl₂, and KCl, situated within a second tube containing a saturated KCl solution, with a porous wick serving as a salt bridge to the test solution [4]. A significant disadvantage of the SCE is that the solubility of KCl is temperature-sensitive, causing the electrode's potential to decrease at higher temperatures (+0.2444 V at 25°C vs. +0.2376 V at 35°C) [4].
The silver/silver chloride (Ag/AgCl) electrode is another widely used reference system based on the reduction of AgCl to Ag [1] [4]. The electrode reaction is:
AgCl(s) + e⁻ ⇌ Ag(s) + Cl⁻(aq) [1]
The potential of the Ag/AgCl electrode is +0.199 V when used with saturated KCl [1]. This electrode is simple, inexpensive, very stable, non-toxic, and can be used with saturated KCl or lower concentrations, or even directly in seawater [1]. The potential of this electrode, like the SCE, depends on both the concentration of KCl and the temperature [1].
Table 2: Comparison of Common Reference Electrodes
| Parameter | Standard Hydrogen Electrode | Saturated Calomel Electrode | Silver/Silver Chloride Electrode |
|---|---|---|---|
| Electrode System | Pt (H₂ (1 atm), H⁺ (1M) | Hg, Hg₂Cl₂, KCl (sat'd) | Ag, AgCl, KCl (sat'd) |
| Electrode Reaction | 2H⁺ + 2e⁻ ⇌ H₂ | Hg₂Cl₂(s) + 2e⁻ ⇌ 2Hg(l) + 2Cl⁻(aq) | AgCl(s) + e⁻ ⇌ Ag(s) + Cl⁻(aq) |
| Potential (at 25°C) | 0.000 V (by definition) | +0.2444 V | +0.199 V |
| Advantages | Primary standard; usable over entire pH range | Easy construction; stable potential | Simple; inexpensive; stable; non-toxic |
| Disadvantages | Easily poisoned; difficult H₂ pressure regulation | Temperature-dependent; toxic mercury | Can be difficult to prepare |
Indicator Electrodes
Indicator electrodes respond selectively to the activity of the target analyte in solution, generating a measurable potential (Eind) that varies with analyte concentration [1]. These electrodes are classified into several types based on their construction and operating principles.
Metallic indicator electrodes include several categories. Electrodes of the first kind are pure metal electrodes in direct equilibrium with their cations (e.g., Cu in Cu²⁺ solution) [1]. While simple, they lack selectivity and may be pH-dependent or easily oxidized [1]. Electrodes of the second kind respond to anions by forming precipitates or stable complexes (e.g., Ag electrode for Cl⁻ determination) [1]. Inert metallic electrodes (e.g., Pt, Au, Pd, C) serve as electron sources or sinks for redox systems without participating in the reaction [1].
Ion-selective electrodes (ISEs) utilize selective membranes that convert the activity of a specific ion dissolved in a solution into an electrode potential [1]. Also known as membrane electrodes, ISEs include several types. Glass membrane electrodes are commonly used for pH measurements and other cations [1]. Liquid membrane electrodes use a water-immiscible liquid ion exchanger suspended in a polymeric membrane [1]. Crystalline-membrane electrodes employ solid-state membranes made from insoluble inorganic salts [1]. Gas-sensing electrodes are complete galvanic cells with gas-permeable membranes that allow determination of dissolved gases like CO₂, NH₃, and O₂ [1].
Salt Bridge and Liquid Junction Potential
The salt bridge is a crucial component that connects the reference and indicator electrode compartments while preventing mixing of their solutions [1]. Typically containing an inert electrolyte such as KCl, the salt bridge allows ionic current to flow between the half-cells, thus completing the electrical circuit [2]. The porous frits at the ends of the salt bridge enable the electrolyte's ions to move freely while minimizing solution mixing [2].
A phenomenon known as liquid junction potential occurs at the interface between two solutions containing different electrolytes or different concentrations of the same electrolyte [1]. This potential arises from the unequal mobilities of positive and negative ions diffusing across the boundary [1]. While the salt bridge is designed to minimize this junction potential (designated Ej), it cannot be completely eliminated and must be considered in precise potentiometric measurements [1].
Measurement Techniques and Applications
Potentiometric Measurement Methods
Two primary approaches are employed in potentiometric measurements: direct potentiometry and potentiometric titration [1]. Direct potentiometry provides a rapid and convenient method for directly determining the activity of cations or anions in solution by measuring the potential difference between the indicator and reference electrodes and relating it to concentration via the Nernst equation [1]. This method requires careful calibration and is particularly useful for continuous monitoring applications [3].
Potentiometric titration involves measuring the potential of a suitable indicator electrode as a function of titrant volume [1]. This technique provides more reliable data than conventional titration methods, especially when dealing with colored or turbid solutions where visual endpoint detection is problematic [1]. Potentiometric titrations can be automated and offer high accuracy and precision for quantitative analysis of ions and molecules [3]. The endpoint is determined from the inflection point in the sigmoidal-shaped titration curve, where the potential change per unit volume of titrant is maximal [1].
Experimental Protocols and Methodologies
Calibration of Potentiometric Systems: Regular calibration is essential for accurate potentiometric measurements [1]. The calibration method involves measuring the potential of standard solutions with known concentrations and constructing a calibration curve of potential versus log(concentration) [1]. The standard addition method, where known increments of standard solution are added to the unknown sample, is particularly useful for analyzing complex matrices [1].
Validation of Reference Electrodes: To ensure measurement accuracy, reference electrodes should be periodically validated [5]. This involves performing an Open Circuit Voltage (OCV) measurement in a two-electrode setup using a "golden" reference electrode (a dedicated validation electrode) [5]. Electrochemical Impedance Spectroscopy (EIS) in Galvanostatic Mode (GEIS) can also be used to check reference electrode impedance, which should be below 1 kΩ for proper operation [5].
Potential Measurement Protocol: The precise measurement of cell potential requires allowing the system to reach equilibrium, typically by stirring the solution and waiting for a stable reading [2]. Measurements should be conducted at constant temperature due to the temperature dependence of the Nernst equation [1] [3]. The high-input impedance potentiometer must draw negligible current (typically < 10⁻¹² A) to prevent polarization effects and maintain the system at equilibrium [2].
Applications in Research and Industry
Potentiometry finds diverse applications across multiple scientific disciplines. In environmental monitoring, ion-selective electrodes are used to measure ions like nitrate, chloride, and fluoride in water samples, providing crucial data for water quality assessment [3]. In biological and pharmaceutical research, potentiometric methods enable the determination of ions like potassium and sodium in biological samples, with enzyme-based electrodes extending applications to molecules like glucose and urea [3]. Industrial process control utilizes potentiometric sensors for real-time monitoring of chemical parameters in manufacturing processes, with their non-destructive nature allowing continuous operation without disrupting production [3].
Table 3: Research Reagent Solutions for Potentiometric Experiments
| Reagent/Material | Function/Application | Technical Specifications |
|---|---|---|
| High-Purity KCl Solution | Electrolyte for reference electrodes and salt bridges | Saturated (≈4.2 M) or specific molarities (0.1 M, 1.0 M); provides stable potential and minimizes liquid junction potential |
| Standard Buffer Solutions | pH calibration and electrode characterization | Certified pH values at specific temperatures (e.g., pH 4.01, 7.00, 10.01); traceable to national standards |
| Ionic Strength Adjuster (ISA) | Sample pretreatment for ion-selective electrodes | Adjusts ionic background to constant level; masks interfering ions; composition specific to target analyte |
| Electrode Storage Solutions | Maintenance of electrode function and longevity | Prevents dehydration of sensing membranes; composition matches electrode type (e.g., diluted standard for pH electrodes) |
| Standard Ion Solutions | Calibration of ion-selective electrodes | Certified reference materials with known ion activities; cover expected concentration range of samples |
Advanced Considerations and Methodological Challenges
Electrode Selection and Optimization
Choosing the appropriate electrode system requires careful consideration of the analytical requirements and sample matrix. For pH measurements, glass electrodes offer exceptional selectivity for H⁺ ions and are unaffected by the presence of oxidizing or reducing agents [1]. However, glass electrodes exhibit alkaline error at pH > 9, where they become responsive to alkali cations, and acid error at pH < 0.5, where pH readings become higher than actual values [1]. For anion measurements, crystalline-membrane electrodes using materials like LaF₃ (for F⁻ determination) provide excellent selectivity and sensitivity [1]. These solid-state electrodes are typically made from crushed powder that is melted and formed, sometimes doped with elements like EuF₂ in LaF₃ membranes to increase conductivity by creating anion vacancies [1].
Liquid membrane electrodes represent another important category, employing hydrophobic ion-exchange agents dissolved in organic solvents immobilized in porous polymer membranes [1]. The calcium dialkyl phosphate electrode, for instance, uses a water-insoluble compound that binds Ca²⁺ strongly, making it ideal for measuring calcium ions in physiological processes [1]. Similarly, the K⁺-selective electrode utilizes valinomycin, an antibiotic that forms stable complexes with potassium ions, providing exceptional selectivity over other cations [1].
Method Validation and Quality Control
Ensuring the reliability of potentiometric measurements requires rigorous method validation and quality control protocols. Key validation parameters include accuracy (evaluated through recovery studies with spiked samples), precision (assessed by repeated measurements), detection limit (typically determined as the concentration corresponding to the signal-to-noise ratio of 3:1), and selectivity (quantified using the Nicolsky-Eisenman equation to account for interfering ions) [1] [5].
The impedance of reference electrodes should be periodically checked using electrochemical impedance spectroscopy (EIS) with a two-electrode connection [5]. High impedance values (typically > 1 kΩ) indicate junction blockage or aging, which can manifest as high-frequency artifacts in EIS measurements or inductive loops in Nyquist plots [5]. A simple solution to address high impedance in reference electrodes is adding a capacitor in parallel, which provides a low-impedance path at high frequencies [5].
Troubleshooting and Maintenance
Effective maintenance of potentiometric systems is essential for long-term reliability. Common issues include slow response times (often caused by membrane fouling or aging), drifting potentials (typically due to reference electrode degradation or temperature fluctuations), and erratic readings (frequently resulting from air bubbles, poor connections, or insufficient grounding) [1] [5].
Regular maintenance protocols should include proper storage in recommended solutions, periodic cleaning of membrane surfaces, rejuvenation of clogged junctions by soaking in appropriate solutions, and validation against certified reference materials [1] [5]. For glass electrodes, dehydration can cause irreversible damage, while for reference electrodes, ensuring a steady flow of electrolyte (1-2 mL/hr) through the junction maintains stable performance [1].
In potentiometric analysis, the accurate measurement of an electrochemical cell's potential under static (zero-current) conditions provides a powerful tool for determining ionic activity in solution [6]. The fundamental setup consists of two essential half-cells: the ion-selective electrode (ISE), which responds to the activity of a specific target ion, and the reference electrode, which maintains a stable, known potential independent of the solution's composition [6] [7]. Together, these components form a complete circuit for determining analyte concentration based on the Nernst equation, which relates the measured potential to the logarithm of the ionic activity [8] [9] [10]. This guide deconstructs the roles, operating principles, and interactions of these critical components within the context of a potentiometric cell, providing a technical foundation for researchers and drug development professionals.
The ISE and reference electrode perform distinct but complementary functions. Their core characteristics are summarized in Table 1.
Table 1: Core Functions and Characteristics of ISEs and Reference Electrodes
| Component | Primary Role | Key Characteristic | Measured Signal |
|---|---|---|---|
| Ion-Selective Electrode (ISE) | Senses the activity of a specific ion in the sample solution [8] [10] | Selective Permeability: Its membrane allows only the target ion to influence the potential [8] [11]. | Potential change relative to the reference electrode [11]. |
| Reference Electrode | Provides a stable, reproducible reference potential against which the ISE's potential is measured [6] [7] | Potential Stability: Its potential remains constant regardless of the sample composition [7]. | Constant, known potential completes the circuit [6]. |
The overall cell potential, E~cell~, is the difference between the potentials of these two electrodes [10]: E~cell~ = E~ISE~ - E~ref~.
In-Depth Analysis of the Ion-Selective Electrode (ISE)
Operating Principle and the Nernst Equation
The heart of an ISE is its ion-selective membrane [8]. When this membrane separates two solutions with different activities of the target ion, a membrane potential develops due to an ion-exchange or ion-transport process at each solution-membrane interface [8]. This charge separation creates a measurable electrical potential. In a typical setup, the internal solution of the ISE has a fixed concentration of the analyte, while the external solution is the sample [8]. The potential developed at the ISE is governed by the famous Nernst equation, which for a cation I^z+^ is [9] [6]:
E = E⁰ + (RT/zF) ln(a)
where E is the measured potential, E⁰ is a constant standard potential, R is the universal gas constant, T is the temperature in Kelvin, F is Faraday's constant, z is the charge on the ion, and a is the activity of the ion I^z+^ in the sample solution [9]. This equation confirms that the ISE's response is logarithmic and proportional to the ionic activity, not the concentration directly.
Key Types of Ion-Selective Membranes
The selectivity of the ISE is determined almost entirely by the composition of its membrane [8]. The four primary types of membranes are detailed in Table 2.
Table 2: Types of Ion-Selective Membranes in ISEs
| Membrane Type | Composition | Selectivity Examples | Key Features & Limitations |
|---|---|---|---|
| Glass Membranes [11] [10] | Silicate or chalcogenide glass [11]. | H⁺, Na⁺, Ag⁺ [10]. Pb²⁺, Cd²⁺ (chalcogenide) [11]. | High chemical durability; subject to alkali/acidic error in extreme pH [11]. |
| Crystalline Membranes [9] [10] | Mono- or polycrystalline solids [10]. | F⁻ (LaF₃ membrane), Ag⁺, S²⁻ (Ag₂S membrane) [9]. | Excellent selectivity; only ions entering crystal structure interfere [10]. |
| Liquid/Polymer Membranes [8] [9] | Plasticized PVC polymer with ionophore [9]. | K⁺ (valinomycin), Ca²⁺, NO₃⁻, various others [8] [9]. | Most widespread type; highly versatile but can have limited durability [10]. |
| Enzyme Electrodes [11] [10] | Enzyme-loaded membrane over a true ISE [10]. | Glucose, Urea, etc. [11]. | "Double-reaction" mechanism; not a true ISE but used similarly [10]. |
The development of new ionophores and polymer matrices, such as plasticizer-free poly(methyl methacrylate-co-decyl methacrylate), continues to enhance the performance and biocompatibility of liquid-membrane ISEs [12].
In-Depth Analysis of the Reference Electrode
The Role of a Stable Reference Potential
While the ISE produces a variable signal, the reference electrode must provide an invariant potential to complete the circuit and serve as a benchmark [7]. An ideal reference electrode exhibits high chemical stability, minimal potential drift, and low junction potential [7]. Its potential should be unaffected by the composition of the test solution.
Common Reference Electrode Systems
Several reference electrode systems are commonly used, each with a well-defined half-cell reaction and standard potential.
Table 3: Common Reference Electrode Systems and Their Properties
| Electrode Type | Half-Cell Reaction | Potential vs. SHE (at 25°C) | Best Applications & Notes |
|---|---|---|---|
| Silver/Silver Chloride (Ag/AgCl) [10] [7] | AgCl(s) + e⁻ ⇌ Ag(s) + Cl⁻ [7] | +0.197 V (in saturated KCl) [7] | Mercury-free; widely used in biological and environmental research [7]. |
| Saturated Calomel Electrode (SCE) [10] [7] | Hg₂Cl₂(s) + 2e⁻ ⇌ 2Hg(l) + 2Cl⁻ [10] | +0.244 V [7] | Stable and robust; contains toxic mercury [10] [7]. |
| Standard Hydrogen Electrode (SHE) [10] | 2H⁺(aq) + 2e⁻ ⇌ H₂(g) [10] | 0.000 V (by definition) [10] | Primary standard; inconvenient for routine lab use [10] [7]. |
Modern research is also advancing all-solid-state and plastic reference electrodes. These designs often use a conducting polymer (e.g., poly(3,4-ethylenedioxythiophene) or PEDOT) as an ion-to-electron transducer, coated with a non-selective polymer membrane containing lipophilic salts to eliminate dependence on sample composition [13]. This innovation is crucial for developing disposable, miniaturized, and robust potentiometric cells.
The Complete Potentiometric Cell and Measurement
In a practical measurement, the ISE and reference electrode are immersed in the same sample solution [6]. The potential difference between them is measured by a high-impedance potentiometer or pH meter, which ensures near-zero current flow and preserves the composition of the solution at the electrode interfaces [9] [6]. The relationship between the components and the measured signal is illustrated in the following diagram.
Diagram 1: Potentiometric cell signal pathway.
Experimental Protocol: Calibration of an Ion-Selective Electrode
To quantify analyte levels, an ISE must be calibrated with solutions of known concentration [11].
- Step 1: Preparation of Standard Solutions. Prepare a series of standard solutions encompassing the expected concentration range of the analyte. For example, for a calcium ISE, standards might range from 0.1 mM to 10 mM [12].
- Step 2: Measurement of Potential. Immerse the ISE and reference electrode in each standard solution, from the most dilute to the most concentrated. Measure the stable potential (in mV) for each standard after the reading stabilizes [11].
- Step 3: Construction of Calibration Curve. Plot the measured potential (E) versus the logarithm of the ion activity (log a). The plot should be linear and follow the Nernst equation [11].
- Step 4: Analysis of Unknowns. Measure the potential of the unknown sample and use the calibration curve to determine its ionic activity.
Advanced Research and Material Innovations
The field of potentiometric sensors is being revolutionized by new materials that improve performance, especially for biomedical applications. A key innovation is the use of conducting polymers like PEDOT and polythiophenes, which act as excellent ion-to-electron transducers in solid-contact ISEs, eliminating the need for an internal liquid filling solution [13] [12]. This simplifies miniaturization and fabrication of disposable sensors [13].
Furthermore, researchers are now covalently integrating ion-recognition sites directly into the conducting polymer backbone. For instance, a recent study developed a calcium-sensitive potentiometric sensor by electrochemically copolymerizing 2,2'-bithiophene (BT) with the calcium-chelating agent BAPTA [12]. This design integrates the ion-recognition element and the transducer within a single macromolecule, mitigating issues like ionophore leaching and enhancing sensor longevity [12]. Such sensors show Nernstian responses (≈20 mV/decade for Ca²⁺) and high selectivity, making them promising for early detection of inflammation or infection around orthopedic implants where local calcium concentration is elevated [12].
Reagent Toolkit for a Modern Potentiometric Sensor
Table 4: Essential Research Reagents for Fabricating a Solid-Contact Polymer-Based ISE
| Reagent / Material | Function | Example from Literature |
|---|---|---|
| Conducting Polymer | Serves as an ion-to-electron transducer; provides electrical contact [12]. | Poly(3,4-ethylenedioxythiophene) (PEDOT) [13], Polythiophene derivatives [12]. |
| Ionophore (Ion Receptor) | Selectively binds the target ion, imparting selectivity to the sensor [8] [9]. | Valinomycin (for K⁺) [8], BAPTA (for Ca²⁺) [12]. |
| Polymer Matrix | Forms the bulk of the sensing membrane, hosting the ionophore and other components [9] [12]. | Poly(vinyl chloride) (PVC) [9], plasticizer-free poly(methyl methacrylate-co-decyl methacrylate) [12]. |
| Lipophilic Salt | Reduces membrane resistance and minimizes interference from ambient light and O₂/CO₂ [13]. | Used in non-selective membranes for reference electrodes [13]. |
| Solid Support | Provides a mechanical base for depositing the sensor layers. | Plastic transparent foil (e.g., for laser printers) [13]. |
The potentiometric cell is an elegant system whose accuracy hinges on the precise and complementary functions of its two components: the ion-selective electrode and the reference electrode. The ISE provides a variable signal that is analytically rich with information about the target ion, while the reference electrode provides the stable foundation against which that signal is measured. A deep understanding of their respective roles, from the fundamental Nernstian response and membrane selectivity to the necessity of a stable reference potential, is critical for researchers designing experiments or developing new analytical methods. Ongoing materials science innovations, particularly in conducting polymers and covalently integrated recognition sites, are pushing the boundaries of what these sensors can achieve, opening new doors for applications in clinical diagnostics, environmental monitoring, and real-time biomedical sensing.
Potentiometric sensors represent one of the most widely used sensing devices in (bio)chemical analysis, performing billions of measurements globally each year [14]. These sensors operate under static conditions where no current—or only negligible current—flows through the electrochemical cell, allowing measurement of potential without changing the system's composition [15]. The theoretical foundation governing this potentiometric response is the Nernst equation, formulated in 1889, which relates an electrochemical cell's potential to the concentration of electroactive species in the cell [15]. This fundamental principle enables the quantitative analysis of ionic species across diverse fields including pharmaceutical development, environmental monitoring, and clinical diagnostics.
Within drug development specifically, potentiometric methods offer significant advantages for the direct determination of pharmaceuticals in line with green analytical chemistry principles [16]. These approaches provide rapid, cost-efficient, and environmentally friendly analysis without requiring complex sample preparation or purification, making them particularly valuable for routine analysis and quality control in pharmaceutical manufacturing [16] [17].
Theoretical Foundation of the Nernst Equation
Fundamental Principles and Mathematical Formulation
The Nernst equation provides a quantitative relationship between the standard electrode potential, temperature, and the activities (or concentrations) of reactants and products involved in a redox reaction [18]. It serves as a crucial bridge between thermodynamics and electrochemical cell potential, enabling calculation of cell potential under non-standard conditions [18].
The general form of the Nernst equation is expressed as:
$$ E = E^\circ - \frac{RT}{nF} \ln Q $$
Where:
- E = cell potential under non-standard conditions
- E° = standard cell potential
- R = universal gas constant (8.314 J/mol·K)
- T = temperature in Kelvin
- n = number of moles of electrons transferred in the redox reaction
- F = Faraday constant (96485 C/mol)
- Q = reaction quotient [18]
At room temperature (298 K), this equation simplifies to a more practical form using base-10 logarithms:
$$ E = E^\circ - \frac{0.05916}{n} \log Q $$
This simplified version is particularly valuable for rapid calculations in laboratory settings [18].
The Reaction Quotient (Q) and Activity
For a general reaction:
$$ aA + bB \leftrightarrow cC + dD $$
The reaction quotient Q is calculated as:
$$ Q = \frac{[C]^c [D]^d}{[A]^a [B]^b} $$
It is essential to recognize that the Nernst equation properly relates to the activities of the reactants and products rather than their concentrations [15]. Activity accounts for non-ideal behavior in solutions and differs from concentration, particularly in non-dilute systems. This distinction is crucial in potentiometry, where the accurate determination of analyte activity directly impacts measurement precision [15].
Table 1: Key Components of the Nernst Equation
| Component | Symbol | Description | Typical Units |
|---|---|---|---|
| Cell Potential | E | Measured potential under non-standard conditions | Volts (V) |
| Standard Cell Potential | E° | Potential under standard conditions (1 M, 1 atm, 298 K) | Volts (V) |
| Gas Constant | R | Universal physical constant relating energy and temperature | 8.314 J/mol·K |
| Temperature | T | Absolute temperature of the system | Kelvin (K) |
| Electrons Transferred | n | Number of moles of electrons in redox reaction | Dimensionless |
| Faraday Constant | F | Electric charge of one mole of electrons | 96485 C/mol |
| Reaction Quotient | Q | Ratio of product and reactant activities | Dimensionless |
Potentiometric Sensor Configuration and Components
Basic Potentiometric Cell Setup
A typical potentiometric electrochemical cell consists of two half-cells, each containing an electrode immersed in a solution of ions whose activities determine the electrode's potential [15]. These half-cells are connected by a salt bridge containing an inert electrolyte such as KCl, which completes the electrical circuit while preventing mixing of the half-cell solutions [15].
The two primary electrodes in a potentiometric cell are:
- Indicator/Working Electrode: This electrode responds to the analyte's activity and is typically designed to be selective toward a specific ion of interest [15].
- Reference Electrode: This electrode maintains a known, fixed potential throughout the measurement, providing a stable reference point against which the indicator electrode's potential can be measured [15].
By convention, the indicator electrode serves as the cathode (where reduction occurs) and the reference electrode as the anode (where oxidation occurs) in the potentiometric cell [15].
Evolution from Liquid-Contact to Solid-Contact Electrodes
The earliest potentiometric sensors were liquid-contact ion-selective electrodes (ISEs), which used an internal filling solution with a sensing membrane positioned between this solution and the sample [16]. While effective, these electrodes presented limitations including potential liquid leakage and challenges in miniaturization [16].
Modern potentiometry has largely transitioned to solid-contact ion-selective electrodes (SC-ISEs), which offer superior simplicity, stable and reproducible responses, ease of handling, and long-term storage capabilities [16]. These solid-contact configurations have overcome the limitation of liquid filling, enabling greater miniaturization, integration, and flexibility in sensor design [14].
A prominent type of SC-ISE is the screen-printed electrode (SPE), which has gained increasing attention due to its disposable nature, low production cost, and suitability for mass fabrication [16]. The advancement of printing technologies has opened a new paradigm for low-cost, large-scale fabrication of a new generation of potentiometric ion sensors suitable for wearable devices and electronic skin applications [14].
Diagram 1: Solid-contact potentiometric sensor configuration showing signal pathway from sample to measurement.
Advanced Sensor Fabrication: Printing Technologies
The development of compatible fabrication techniques has become a critical focus in potentiometric sensor advancement, with printing technology emerging as a particularly promising solution [14]. Printing offers reduced fabrication costs, simplified patterning techniques, and accelerated prototyping implementation, making it ideal for producing next-generation sensors [14].
Screen Printing Technology
Screen printing has been the most extensively used technique for fabricating printed potentiometric sensors, valued for its simplicity, low cost, high efficiency, and wide applicability [14]. This stencil printing technique uses a squeegee to force paste through a screen mesh onto a target substrate, creating well-defined conductive patterns [14].
In sensor fabrication, screen printing typically produces a three-layered structure:
- Conductive layer: Provides the electrical connection, often using carbon or silver-based inks
- Insulating layer: Defines the active electrode area and prevents short circuits
- Sensing layer: Contains the ion-selective components that determine sensor specificity [14]
Emerging Printing Methodologies
Beyond screen printing, several other printing technologies have shown promise for potentiometric sensor fabrication:
- Inkjet Printing: A digital manufacturing technique that deposits precise droplets of functional inks without physical contact with the substrate, enabling high-resolution patterns and complex geometries [14].
- Wax Printing: Creates hydrophobic barriers on paper-based substrates to define fluidic pathways and electrode structures, particularly useful for low-cost diagnostic devices [14].
- 3D Printing: Includes fused deposition modeling (FDM) and stereolithography (SLA) techniques that can build reproducible sensitive membranes and integrated functional structures layer by layer [14].
Despite these advancements, a fully printed potentiometric sensor has not yet been truly realized, representing a significant opportunity for future research and development [14].
Experimental Implementation in Pharmaceutical Analysis
Sensor Development for Silver Sulfadiazine Detection
A recent study demonstrates the practical application of potentiometric sensors in pharmaceutical analysis through the development of a solid-contact ion-selective electrode for detecting silver ions released from silver sulfadiazine (SSD) in wound care formulations [16]. This research employed a two-step optimization procedure to create sensors with enhanced selectivity and stability.
Initial Optimization - Ionophore Selection: Six different ionophores were evaluated to enhance sensor selectivity, with Calix[4]arene demonstrating the highest affinity for silver ions [16]. The inclusion of a cation-exchanger in the polymeric membrane ensured selective response toward Ag⁺ ions from SSD, exhibiting excellent permselectivity [16].
Secondary Optimization - Transducer Integration: A layer of multi-walled carbon nanotubes (MWCNTs) was incorporated between the Calix[4]-containing polymeric membrane and the solid-contact screen-printed electrode [16]. This MWCNT layer functioned as an efficient ion-to-electron transducer, improving potential stability by preventing the formation of a water layer at the interface between the electrode surface and the polymeric sensing membrane [16].
Diagram 2: Experimental workflow for potentiometric determination of silver sulfadiazine in pharmaceutical formulations.
Sensor Performance and Validation
The optimized MWCNT-modified sensor demonstrated exceptional analytical performance, achieving:
- High accuracy: 99.94% ± 0.413
- Wide linear response range: 1.0 × 10⁻⁵ to 1.0 × 10⁻² M
- Low detection limit: 4.1 × 10⁻⁶ M
- Near-Nernstian behavior: Slope of 61.029 mV/decade [16]
The sensor exhibited high selectivity for Ag⁺ ions from SSD in the presence of sodium hyaluronate in the pharmaceutical dosage form, enabling direct determination without extraction from the formulation [16]. This represents a significant advantage over traditional chromatographic methods that often require complex sample preparation and use of hazardous organic solvents [16].
Table 2: Performance Comparison of Potentiometric Sensors in Pharmaceutical Analysis
| Analyte | Sensor Type | Linear Range (M) | Detection Limit (M) | Slope (mV/decade) | Application |
|---|---|---|---|---|---|
| Silver ions from SSD | MWCNT/SPE | 1.0×10⁻⁵ to 1.0×10⁻² | 4.1×10⁻⁶ | 61.029 | Pharmaceutical formulation [16] |
| Atenolol | Coated Graphite Electrode | 6.2×10⁻⁶ to 1.0×10⁻² | 1.8×10⁻⁶ | 52.95 | Pure and commercial products [17] |
| Atenolol | Coated Wire Electrode | 4.5×10⁻⁸ to 1.0×10⁻² | 1.3×10⁻⁸ | 56.23 | Pure and commercial products [17] |
Essential Research Reagents and Materials
The development and implementation of potentiometric sensors requires specific materials and reagents tailored to the target analyte and sensor configuration. The following table summarizes key components used in advanced potentiometric sensor research.
Table 3: Essential Research Reagents for Potentiometric Sensor Development
| Reagent/Material | Function | Application Example |
|---|---|---|
| Calix[4]arene | Ionophore with specific binding affinity for target ions | Selective recognition of Ag⁺ ions in silver sulfadiazine sensors [16] |
| Multi-walled Carbon Nanotubes (MWCNTs) | Solid-contact transducer for ion-to-electron signal conversion | Enhancing potential stability in screen-printed electrodes [16] |
| Polyvinyl Chloride (PVC) | Polymer matrix for ion-selective membranes | Structural component of sensing membranes [16] |
| 2-Nitrophenyl Octyl Ether (NPOE) | Plasticizer for polymeric membranes | Improving membrane flexibility and ion mobility [16] |
| Sodium Tetrakis [3,5-bis(trifluoromethyl)phenyl]borate | Ion-exchanger for cation-selective membranes | Establishing permselectivity in Ag⁺-selective sensors [16] |
| Tetrahydrofuran (THF) | Solvent for membrane component dissolution | Preparing ion-selective membrane cocktails [16] |
| Screen-printed Electrodes (SPEs) | Conductive substrates for solid-contact sensors | Disposable, cost-effective sensor platforms [16] |
The Nernst equation continues to serve as the fundamental principle governing potentiometric response more than a century after its formulation. Its enduring relevance is evidenced by the sophisticated sensor technologies developed for pharmaceutical analysis, where precise potential measurements enable accurate quantification of target analytes in complex matrices. The ongoing evolution from traditional liquid-contact electrodes to advanced solid-contact configurations fabricated using modern printing technologies demonstrates the dynamic nature of this field.
For drug development professionals, potentiometric sensors offer compelling advantages including rapid analysis, minimal sample preparation, compatibility with green chemistry principles, and cost-effectiveness. The continued refinement of these sensors—particularly through the development of novel ionophores, enhanced transducer materials, and advanced fabrication techniques—promises to further expand their applications in pharmaceutical quality control, therapeutic drug monitoring, and clinical diagnostics. As printing technologies mature and our understanding of interfacial processes deepens, the realization of fully integrated, disposable potentiometric sensors for point-of-care testing appears increasingly attainable, potentially transforming how pharmaceutical analysis is performed in both developed and resource-limited settings.
In potentiometry, the potential of an indicator electrode is proportional to the analyte's activity, measured under static conditions where no current—or only negligible current—flows through the electrochemical cell, thus leaving its composition unchanged [19] [20]. Metallic electrodes constitute a primary class of indicator electrodes used for such potentiometric measurements, where the electrode potential responds to the activity of specific ions in the solution [19]. This technical guide provides an in-depth examination of the classification, operating principles, and experimental protocols for metallic electrodes of the first, second, and third kind, contextualized within potentiometric cell setup and components research.
The foundational principle governing the response of these electrodes is the Nernst equation, which relates the electrochemical cell's potential to the concentration of electroactive species. For a generic reduction reaction ( \text{M}^{n+} + n\text{e}^- \rightleftharpoons \text{M(s)}), the Nernst equation is expressed as: [ E = E^0{\text{M}^{n+} / \text{M}} - \frac{RT}{nF} \ln \frac{1}{a{\text{M}^{n+}}} ] where (E) is the measured potential, (E^0) is the standard electrode potential, (R) is the universal gas constant, (T) is temperature, (n) is the number of electrons transferred, (F) is the Faraday constant, and (a_{\text{M}^{n+}}) is the activity of the metal ion [19] [20]. The subsequent sections delineate the characteristics of each electrode kind, supported by quantitative data and experimental methodologies.
Electrodes of the First Kind
Principle and Theory
Electrodes of the first kind consist of a pure metal element in direct contact with a solution containing its own ion [19]. The potential developed at the electrode-solution interface is a direct function of the activity of the corresponding metal cation in the solution. A classic example is a copper electrode immersed in a solution of ( \text{Cu}^{2+} ) ions, governed by the following redox reaction: [ \text{Cu}^{2+}(aq) + 2e^{-} \rightleftharpoons \text{Cu}(s) ] The Nernst equation for this system at 25°C is: [ E = E{\mathrm{Cu}^{2+} / \mathrm{Cu}}^{\mathrm{o}} - \frac{0.05916}{2} \log \frac{1}{a{\mathrm{Cu}^{2+}}} = +0.3419 \mathrm{V} - \frac{0.05916}{2} \log \frac{1}{a{\mathrm{Cu}^{2+}}} ] When incorporated into a potentiometric electrochemical cell with a saturated calomel reference electrode (SCE), the overall cell potential is: [ E{\text{cell}} = E{\text{ind}} - E{\text{SCE}} = +0.3419 \mathrm{V} - \frac{0.05916}{2} \log \frac{1}{a{\mathrm{Cu}^{2+}}} - 0.2224 \mathrm{V} ] This simplifies to a general form for electrodes of the first kind: [ E{\mathrm{cell}} = K - \frac{0.05916}{n} \log \frac{1}{a{M^{n+}}} = K + \frac{0.05916}{n} \log a{M^{n+}} ] where (K) is a constant incorporating the standard-state potential of the ( \text{M}^{n+}/\text{M} ) redox couple and the potential of the reference electrode [19].
Experimental Protocol and Setup
The following workflow details the setup and measurement procedure for characterizing an electrode of the first kind.
Step-by-Step Procedure:
- Electrode Preparation: Mechanically polish the metallic electrode (e.g., Cu, Ag) with successively finer abrasives (e.g., alumina slurry) to a mirror finish, followed by rinsing with deionized water and an appropriate solvent to remove any surface contaminants [19].
- Solution Preparation: Prepare a series of standard solutions with known activities of the target metal ion (e.g., ( \text{Cu}^{2+} )). Use an inert electrolyte (e.g., KNO₃) to maintain a constant ionic strength [20].
- Cell Assembly: Immerse the prepared metallic electrode and a stable reference electrode (e.g., Saturated Calomel Electrode, SCE, or Ag/AgCl) into the analyte solution. Connect the two electrodes to a high-impedance potentiometer, ensuring minimal current draw [19] [20].
- Potential Measurement: Record the cell potential ((E_{\text{cell}})) once a stable reading is obtained, indicating equilibrium at the electrode-solution interface.
- Data Analysis: Plot (E{\text{cell}}) against ( \log a{M^{n+}} ). A linear relationship with a slope close to ( \frac{0.05916}{n} ) V at 25°C confirms Nernstian behavior [19].
Limitations and Applicable Metals
Electrodes of the first kind are subject to several limitations. Their performance can be compromised by slow kinetics of electron transfer at the metal-solution interface, the formation of metal oxides on the electrode surface, and interfering side reactions [19]. Furthermore, some metals are susceptible to oxidation by acids, as exemplified by the reaction of zinc with H⁺: [ \text{Zn}(s) + 2\text{H}^{+}(aq) \rightleftharpoons \text{H}_{2}(g) + \text{Zn}^{2+}(aq) ] Consequently, their use is restricted to a specific set of metals, primarily limited to Ag, Bi, Cd, Cu, Hg, Pb, Sn, Tl, and Zn [19].
Electrodes of the Second Kind
Principle and Theory
Electrodes of the second kind are metallic electrodes whose potential is governed by the activity of an anion that forms a sparingly soluble salt with the electrode's metal cation [19]. These are typically used to determine anion concentrations. A common example is the silver/silver chloride (Ag/AgCl) electrode, which can function as a reference electrode when the Cl⁻ activity is fixed or as an indicator electrode for Cl⁻ activity.
The system involves two simultaneous equilibria. The primary electrode reaction is: [ \text{Ag}^{+}(aq) + e^{-} \rightleftharpoons \text{Ag}(s) ] The potential is given by the Nernst equation: [ E = 0.7996\ \text{V} + 0.05916 \log a{\text{Ag}^{+}} ] This potential is coupled with the solubility equilibrium of the precipitated salt: [ \text{AgCl}(s) \rightleftharpoons \text{Ag}^{+}(aq) + \text{Cl}^{-}(aq) ] The solubility product constant is ( K{sp, \text{AgCl}} = a{\text{Ag}^{+}} \cdot a{\text{Cl}^{-}} ), which can be rearranged to ( a{\text{Ag}^{+}} = \frac{K{sp, \text{AgCl}}}{a{\text{Cl}^{-}}} ). Substituting into the Nernst equation yields: [ E = 0.7996\ \text{V} + 0.05916 \log \frac{K{sp, \text{AgCl}}}{a{\text{Cl}^{-}}} = 0.7996\ \text{V} + 0.05916 \log K{sp, \text{AgCl}} - 0.05916 \log a{\text{Cl}^{-}} ] This simplifies to: [ E = K' - 0.05916 \log a{\text{Cl}^{-}} ] where ( K' ) is a new constant amalgamating the standard potential and the solubility product [19]. Thus, the electrode potential responds to the logarithm of the chloride ion activity.
Experimental Protocol for Anion Determination
The following workflow outlines the process for using an electrode of the second kind to determine anion concentration.
Step-by-Step Procedure:
- Electrode Fabrication: For a Ag/AgCl electrode, anodize a clean silver wire in a KCl solution (e.g., at +0.6 V vs. SCE for several minutes) to form a uniform, low-solubility AgCl layer on its surface [19] [21].
- Cell Assembly and Measurement: For determining an anion like I⁻, saturate the analyte solution with AgI. Assemble the potentiometric cell as described in Section 2.2, using the prepared electrode (e.g., Ag) and a reference electrode [19].
- Calibration: Measure (E{\text{cell}}) for a series of standard solutions with known anion activities. Construct a calibration curve of (E{\text{cell}}) versus ( \log a_{\text{anion}} ).
- Analysis: Measure the potential for the unknown sample and determine the anion activity from the calibration curve. The slope of the calibration curve should be close to ( \frac{-0.05916}{n} ) V, where (n) is the charge of the anion.
Electrodes of the Third Kind
Principle and Theory
Electrodes of the third kind are employed to determine the activity of a metal ion (( \text{M}^{1} )) that forms a complex or a sparingly soluble salt with a second metal (( \text{M}^{2} )), which itself comprises the electrode. The system involves a cascade of equilibria linking the activity of ( \text{M}^{1} ) to the potential.
For instance, a zinc electrode can be used to determine the activity of ( \text{Mg}^{2+} ) if the solution is saturated with both ( \text{ZnC}2\text{O}4 ) and ( \text{MgC}2\text{O}4 ). The equilibria involved are:
- Electrode Equilibrium: ( \text{Zn}^{2+} + 2e^- \rightleftharpoons \text{Zn}(s) )
- Solubility Equilibrium for Zn: ( \text{ZnC}2\text{O}4(s) \rightleftharpoons \text{Zn}^{2+} + \text{C}2\text{O}4^{2-} )
- Solubility Equilibrium for Mg: ( \text{MgC}2\text{O}4(s) \rightleftharpoons \text{Mg}^{2+} + \text{C}2\text{O}4^{2-} )
The concentration of the common oxalate ion (( \text{C}2\text{O}4^{2-} )) is controlled by these simultaneous equilibria. From the solubility products, ( K{sp, \text{Zn}} = a{\text{Zn}^{2+}} \cdot a{\text{C}2\text{O}4^{2-}} ) and ( K{sp, \text{Mg}} = a{\text{Mg}^{2+}} \cdot a{\text{C}2\text{O}4^{2-}} ). Combining these relationships and substituting into the Nernst equation for the zinc electrode shows that the electrode potential becomes a function of ( \log a_{\text{Mg}^{2+}} ).
Experimental Considerations
Electrodes of the third kind are less common in practice due to significant experimental challenges. Achieving and maintaining simultaneous saturation with two solid phases within the electrochemical cell is difficult and can lead to slow response times and unstable potentials. Ensuring that the system reaches a stable equilibrium where all three equilibria are properly established requires careful control and is often not practical for routine analytical applications.
Comparative Analysis of Electrode Types
The table below summarizes the key characteristics of the three classes of metallic electrodes for direct comparison.
Table 1: Comparison of Metallic Electrodes of the First, Second, and Third Kind
| Feature | Electrodes of the First Kind | Electrodes of the Second Kind | Electrodes of the Third Kind |
|---|---|---|---|
| Measured Species | Own cation (( \text{M}^{n+} )) [19] | Anion forming insoluble salt with ( \text{M}^{n+} ) (e.g., Cl⁻, I⁻) [19] | Cation (( \text{M}^{1} )) forming insoluble salt/ complex with a ligand that also binds ( \text{M}^{2} ) of the electrode [19] |
| Governing Principle | Direct Redox Equilibrium: ( \text{M}^{n+} + n e^- \rightleftharpoons \text{M} ) | Solubility + Redox Equilibrium | Coupled Solubility + Redox Equilibrium |
| Nernstian Slope | ( +\frac{0.05916}{n} \text{V} ) (for cation) | ( -\frac{0.05916}{n} \text{V} ) (for anion) | ( +\frac{0.05916}{n} \text{V} ) (for cation ( \text{M}^{1} )) |
| Key Advantage | Simple principle and direct measurement. | Enables potentiometric measurement of anions. | Theoretically allows measurement of metals that cannot form direct electrode systems. |
| Key Limitation | Limited to few metals; prone to interferences [19]. | Requires solution saturation with the insoluble salt for accurate response [19]. | Experimentally complex; requires multiple equilibria; slow and unstable response. |
| Common Examples | Cu in ( \text{Cu}^{2+} ); Ag in ( \text{Ag}^{+} ) [19] | Ag electrode in AgCl-saturated solution for Cl⁻ detection [19] | Zn electrode in solution saturated with ( \text{ZnC}2\text{O}4 ) and ( \text{MgC}2\text{O}4 ) for ( \text{Mg}^{2+} ) |
The Scientist's Toolkit: Essential Research Reagents and Materials
Successful experimentation with metallic electrodes requires specific materials and reagents. The following table details the essential components of the research toolkit.
Table 2: Key Research Reagents and Materials for Potentiometric Experiments with Metallic Electrodes
| Item | Function and Specification |
|---|---|
| High-Impedance Potentiometer | Measures the potential difference between the indicator and reference electrode without drawing significant current, which is crucial for maintaining equilibrium conditions at the electrode surface [20]. |
| Reference Electrodes | Provides a stable, known reference potential against which the indicator electrode's potential is measured. Examples: Saturated Calomel Electrode (SCE), Silver/Silver Chloride (Ag/AgCl) [19] [20]. |
| Pure Metal Wires/Disks | Serve as the basis for fabricating indicator electrodes. Common types: Ag, Cu, Zn, Pb, and Cd wires of high purity (≥ 99.9%) [19]. |
| Ionic Strength Adjuster | A high-concentration, inert electrolyte (e.g., KNO₃, KCl) added to both standard and sample solutions to maintain a constant ionic strength, ensuring that the activity coefficient of the analyte remains constant [20]. |
| Polishing Supplies | Alumina powder or slurry (various grades from 1.0 µm to 0.05 µm) and polishing pads/cloths for creating a clean, reproducible electrode surface before each experiment [19]. |
| Sparingly Soluble Salts | High-purity salts (e.g., AgCl, AgI) for saturating solutions when working with electrodes of the second kind or for coating electrode surfaces [19]. |
Metallic electrodes of the first, second, and third kind represent foundational components in the potentiometric analysis of ionic species. Electrodes of the first kind provide a direct measurement of their cation's activity, while electrodes of the second kind elegantly extend this principle to anion sensing through coupled solubility equilibria. Although electrodes of the third kind offer a theoretical pathway for analyzing cations that lack their own reversible electrode, their practical application is limited by experimental complexity. A thorough understanding of the Nernst equation, the equilibria governing each system, and meticulous experimental technique are paramount for obtaining reliable and accurate potentiometric measurements. This knowledge forms a critical foundation for researchers and drug development professionals working with electrochemical sensors and analytical methods.
Potentiometric ion-selective electrodes (ISEs) are a cornerstone of modern electrochemical analysis, providing a powerful and versatile method for the sensitive and selective measurement of a wide variety of analytes [22]. These sensors measure the potential difference between a working electrode and a reference electrode under zero-current conditions, allowing for direct and rapid readout of ion concentrations in diverse fields including clinical diagnostics, environmental monitoring, and pharmaceutical analysis [22]. The evolution of this technology from traditional liquid-contact designs to advanced solid-contact configurations represents a pivotal transformation in sensor capabilities, enabling new applications in miniaturized, portable, and wearable devices [22] [23]. This review chronicles the key historical developments, technical innovations, and material advancements that have defined the journey from liquid-contact to solid-contact ISEs, providing researchers and drug development professionals with a comprehensive technical foundation for understanding modern potentiometric sensor design.
Fundamental Principles of Potentiometric Sensing
Potentiometric sensors are electrochemical devices that respond to the activity of specific ions in a solution by generating a measurable potential between a reference electrode and a working electrode under zero current conditions [24]. The potential developed at the working electrode arises from the selective interaction between an ion-selective membrane and the target ions, fundamentally described by the Nernst equation:
[E = E^0 + \frac{RT}{zF}\ln a]
where E is the measured potential, E⁰ is the standard potential, R is the gas constant, T is temperature, z is the ion charge, F is Faraday's constant, and a is the ion activity [25] [24]. For monovalent ions at 25°C, this equation yields a theoretical slope of approximately 59.16 mV per decade change in concentration [24].
The core component of any ISE is the ion-selective membrane (ISM), which can be glass (e.g., for pH sensors), crystalline, or polymeric liquid membranes based on polyvinyl chloride (PVC) doped with selective ionophores, plasticizers, and additives [24] [23]. These membranes are designed to achieve a Nernstian response while discriminating against interfering ions through selective binding interactions [23].
Table 1: Critical Analytical Parameters for Evaluating ISE Performance
| Parameter | Definition | Evaluation Method |
|---|---|---|
| Sensitivity | Slope of calibration curve (mV/decade) | Comparison to theoretical Nernstian value [24] |
| Detection Limit | Lowest detectable ion activity above background | Calculated from intersection of linear response segments [25] |
| Linear Range | Concentration interval with proportional response | Determined from calibration curves [25] |
| Selectivity | Ability to discriminate against interfering ions | Selectivity coefficients via SSM or fixed interference method [12] |
| Response Time | Time to reach stable potential after concentration change | Measured experimentally after solution transition [12] |
| Stability | Signal drift over time (µV/s) | Potential monitoring under constant conditions [25] |
The Era of Liquid-Contact Ion-Selective Electrodes
Design and Operational Principles
Traditional liquid-contact ISEs (LC-ISEs) consist of three main components: an ion-selective membrane, an internal electrolyte solution (inner-filling solution), and an internal reference electrode (typically Ag/AgCl) [22] [23]. The ISM is selective for the target ion, while the internal electrolyte contains a fixed concentration of the target ion [22]. The internal reference electrode, immersed in the internal electrolyte, provides ion-to-electron transduction [22]. The potentiometric measurement depends on the potential difference between the external reference electrode and the ISE, driven by the difference in target ion activity between the external sample and internal solutions [22].
Limitations and Challenges
Despite their widespread historical use and reliability under controlled conditions, LC-ISEs present significant limitations that hinder their application in modern sensing contexts [23]. These limitations include:
- Mechanical Instability: The presence of liquid components makes LC-ISEs susceptible to orientation and movement effects [22].
- Evaporation and Leakage: The internal filling solution can evaporate or leak, reducing shelf-life and requiring careful maintenance [22] [23].
- Miniaturization Difficulties: Reducing the volume of the internal filling solution below milliliter levels presents significant engineering challenges [23].
- Osmotic Pressure Effects: Differences in ion strength between samples and internal solutions cause water transport, leading to volume changes or membrane stratification [23].
- Steady-State Ionic Flux: Continuous ion exchange occurs between the internal filling solution and test solution, affecting long-term stability [23].
These factors collectively limited the development of LC-ISEs for emerging applications requiring miniaturization, portability, and field deployment [23].
The Solid-Contact Revolution: Key Historical Milestones
The transition from liquid-contact to solid-contact ISEs represents one of the most significant advancements in potentiometric sensing, enabled by materials science innovations and conceptual breakthroughs in ion-to-electron transduction.
First-Generation Solid-Contact Electrodes
The first solid-contact electrodes, known as Coated Wire Electrodes (CWEs), were developed by R. W. Cattrall and H. Freiser in 1971 [24]. Their design consisted of metal wires directly coated with an ion-selective polymer membrane, initially for calcium ion detection [24]. While this eliminated the internal solution, these early CWEs suffered from poor potential stability and reversibility due to the different conductivity types at the membrane-electrode interface (ionic versus electronic) and the lack of an efficient ion-to-electron transduction mechanism [25] [24].
The Conductive Polymer Breakthrough
A pivotal moment in SC-ISE development came with the discovery of electrically conductive polymers by Hideki Shirakawa and colleagues, which earned the Nobel Prize in Chemistry in 2000 [24]. These materials possess mixed electronic and ionic conductivity, making them ideal mediators between the ionic conduction of the membrane and electronic conduction of the substrate [12].
In the early 1990s, Lewenstam's team pioneered the application of conductive polymers as solid contacts, using polypyrrole (PPy) as an intermediate layer between the ion-selective membrane and electrical output [24]. This innovation significantly improved potential stability compared to simple coated wire electrodes and established conductive polymers as the cornerstone of modern SC-ISE design [24].
Nanomaterial and Nanocomposite Integration
The 2000s and 2010s witnessed the emergence of various nanomaterials as superior solid-contact materials, including carbon nanomaterials (carbon nanotubes, graphene), metal and metal oxide nanoparticles, and composite materials [22] [25]. These nanomaterials offer ultra-high surface areas, superior conductivity, and enhanced hydrophobicity compared to bulk materials [22].
Recent research has focused on developing nanocomposites with synergistic effects to further enhance sensing performance. For instance, embedding Fe₃O₄ nanoparticles within MoS₂ nanoflowers prevents structural collapse while increasing capacitance of the solid-contact layer [22]. Similarly, tubular gold nanoparticles with tetrathiafulvalene (Au-TFF) solid contacts have demonstrated high capacitance and stability for potassium detection [22].
Technical Mechanisms: Ion-to-Electron Transduction
The fundamental operation of SC-ISEs relies on efficient ion-to-electron transduction at the interface between the ion-selective membrane and the solid-contact layer. Two primary mechanisms have been experimentally verified for this transduction process [22] [23].
Redox Capacitance Mechanism
Conductive polymers (e.g., poly(3-octylthiophene), polypyrrole, PEDOT) function through reversible redox reactions that facilitate charge transfer [23]. When the ISM contacts the sample solution, target ion extraction occurs, generating an ionic signal. This signal is transduced to an electronic signal through the reversible oxidation or reduction of the conductive polymer backbone, as described by:
[ \text{CP}^+ \text{A}^- (\text{SC}) + \text{M}^+ (\text{SIM}) + e^- \rightleftharpoons \text{CP}^\circ \text{A}^- \text{M}^+ (\text{SC}) ]
[ \text{CP}^+ \text{R}^- (\text{SC}) + e^- \rightleftharpoons \text{CP}^\circ (\text{SC}) + \text{R}^- (\text{SIM}) ]
where CP represents the conductive polymer, A⁻ is the anion, M⁺ is the target cation, and R⁻ is the anionic site in the membrane [23]. This mechanism provides high capacitance and stable potential through Faradaic processes [23].
Electric Double-Layer Capacitance Mechanism
Carbon-based materials (carbon nanotubes, graphene) and certain metal nanoparticles operate through non-Faradaic processes, forming an electric double-layer at the interface [23]. When ions accumulate at the ISM/SC interface, electrons redistribute in the solid contact to maintain charge neutrality, creating a capacitor-like structure described by:
[ C = \frac{\varepsilonr \varepsilon0 A}{d} ]
where C is capacitance, εᵣ is the dielectric constant, ε₀ is vacuum permittivity, A is the surface area, and d is the double-layer thickness [23]. The high surface area of nanomaterials significantly increases this capacitance, leading to improved potential stability [22] [23].
Performance Comparison: Liquid vs. Solid Contact ISEs
The evolution from liquid-contact to solid-contact designs has yielded significant improvements across multiple performance parameters, particularly for applications requiring miniaturization, portability, and continuous monitoring.
Table 2: Comprehensive Performance Comparison: Liquid-Contact vs. Solid-Contact ISEs
| Parameter | Liquid-Contact ISEs | Solid-Contact ISEs | Technological Impact |
|---|---|---|---|
| Mechanical Stability | Poor (internal solution effects) [22] | Excellent (all-solid-state) [23] | Enables wearable, portable sensors [22] |
| Miniaturization Potential | Limited (ml-scale internal solution) [23] | Excellent (no volume constraints) [25] [23] | Chip integration, in vivo monitoring [23] |
| Response Time | Seconds to minutes [22] | Rapid (seconds) [22] [12] | Real-time monitoring capability [22] |
| Potential Stability | Good (with careful maintenance) [23] | Good to Excellent (with optimized SC) [25] | Reduced calibration frequency [25] |
| Manufacturing Complexity | Moderate (assembly required) [22] | Simple (layer-by-layer fabrication) [24] | Mass production, disposable sensors [24] |
| Sensitivity (Slope) | Nernstian (theoretical limit) [24] | Near-Nernstian to Nernstian [25] | Comparable analytical performance [25] |
| Lifespan | Limited (evaporation, flux) [23] | Extended (properly formulated) [25] | Reduced maintenance and replacement |
Advanced Materials for Next-Generation Solid-Contact ISEs
Conducting Polymers and Their Derivatives
Conducting polymers remain the most widely used solid-contact materials due to their excellent transduction properties. Common systems include poly(3-octylthiophene) (POT), poly(3,4-ethylenedioxythiophene) (PEDOT), polypyrrole (PPy), and more specialized polymers like perinone-based materials (PPer) [25] [12]. Recent innovations focus on covalently incorporating ion-recognition sites directly into the polymer backbone, creating multifunctional materials that combine ion-to-electron transduction with selective recognition [12]. For example, a BAPTA-based potentiometric copolymer sensor for calcium detection integrates the selective calcium chelating properties of BAPTA directly into a polythiophene matrix via electrochemical polymerization [12].
Carbon-Based Nanomaterials
Carbon nanomaterials offer exceptional hydrophobicity, high electrical conductivity, and large surface areas. Multi-walled carbon nanotubes (MWCNTs), graphene, colloid-imprinted mesoporous carbon, and their functionalized derivatives have been successfully employed as solid contacts [22] [25]. These materials typically operate through the electric double-layer capacitance mechanism and demonstrate excellent potential stability, particularly when formulated as nanocomposites with polymers or metal nanoparticles [25].
Metal and Metal Oxide Nanoparticles
Metal nanoparticles (e.g., gold, silver) and metal oxide nanoparticles (e.g., CuO, Fe₃O₄) provide alternative transduction mechanisms and high capacitance [25]. Gold nanoparticles functionalized with tetrathiafulvalene have shown exceptional potential stability for potassium detection [22], while copper(II) oxide nanoparticles demonstrate favorable temperature resistance when combined with carbon nanotubes in nanocomposite structures [25].
Nanocomposite Materials
Recent research emphasizes nanocomposites that combine multiple material classes to achieve synergistic effects. For instance, combining carbon nanotubes with copper oxide nanoparticles creates a composite with enhanced conductivity, capacitance, and mechanical stability compared to either component alone [25]. Similarly, embedding Fe₃O₄ nanoparticles within MoS₂ nanoflowers prevents structural collapse while increasing electrochemical capacitance [22].
Table 3: Research Reagent Solutions for Solid-Contact ISE Development
| Material Category | Specific Examples | Function in SC-ISE | Key Properties |
|---|---|---|---|
| Conductive Polymers | PEDOT:PSS, POT, PPer, Polypyrrole [25] [12] | Ion-to-electron transducer (redox mechanism) [23] | Mixed ionic/electronic conductivity, reversible electrochemistry [12] |
| Carbon Nanomaterials | MWCNTs, Graphene, Mesoporous Carbon [22] [25] | Ion-to-electron transducer (EDL mechanism) [23] | High surface area, hydrophobicity, electrical conductivity [25] |
| Metal/Metal Oxide NPs | Gold NPs, CuO NPs, Fe₃O₄ NPs [22] [25] | Capacitive intermediate layer | High capacitance, tunable surface chemistry [25] |
| Ionophores | Valinomycin (K⁺), BAPTA derivatives (Ca²⁺) [25] [12] | Selective ion recognition in ISM | High selectivity, sufficient lipophilicity [12] |
| Polymer Matrices | PVC, Acrylic esters, Polyurethane [24] [23] | ISM structural backbone | Mechanical stability, component compatibility [23] |
| Plasticizers | DOS, DBP, NOPE [23] | Adjust ISM mobility and dielectric | High lipophilicity, low volatility [23] |
| Ion Exchangers | NaTFPB, KTPCIPB, KTFPB [23] | Establish permselectivity | Lipophilic salts, Donnan exclusion [23] |
Experimental Protocols for SC-ISE Development and Characterization
Electrode Fabrication Methodology
Protocol 1: Solid-Contact Layer Deposition
- Substrate Preparation: Begin with polished glassy carbon electrodes (GCEs) or screen-printed electrodes. Sequentially polish with alumina suspensions (1.0, 0.3, and 0.05 µm), followed by thorough rinsing with deionized water and ethanol [25].
- Nanomaterial Dispersion: Prepare dispersions of solid-contact materials (e.g., MWCNTs at 1 mg/mL in DMF with 1-hour ultrasonication) [25].
- Layer Deposition: Apply the dispersion via drop-casting (e.g., 5 µL of MWCNT dispersion) and allow solvent evaporation under ambient conditions or controlled temperature [25].
- Conductive Polymer Electropolymerization: For polymer-based contacts, use electrochemical polymerization from monomer solutions (e.g., 0.01 M 3-octylthiophene in acetonitrile with 0.1 M LiClO₄ as supporting electrolyte) using cyclic voltammetry between appropriate potential limits for multiple cycles [12].
Protocol 2: Ion-Selective Membrane Application
- Membrane Cocktail Preparation: Dissolve membrane components in tetrahydrofuran (THF): PVC (32-33 wt%), plasticizer (65-66 wt%), ionophore (0.5-1.5 wt%), and lipophilic additive (0.5-1 wt%) [25] [23].
- Membrane Deposition: Apply the cocktail via drop-casting (e.g., 50-100 µL per electrode) onto the solid-contact layer and allow THF evaporation for 24+ hours [25].
- Conditioning: Condition the prepared electrodes in a solution of the primary ion (e.g., 0.01 M KCl for potassium ISEs) for 24 hours before use [25].
Potentiometric Characterization Methods
Protocol 3: Calibration and Sensitivity Measurement
- Solution Preparation: Prepare standard solutions of the primary ion across a concentration range (typically 10⁻⁷ to 10⁻¹ M) with constant ionic strength adjusted using appropriate electrolyte (e.g., 0.01 M MgCl₂ or NaNO₃) [25].
- Measurement Procedure: Measure potential values in order of decreasing concentration, starting with the most diluted solution, under continuous stirring. Record potential once stable (change < 0.1 mV/min) [25].
- Data Analysis: Plot potential versus logarithm of ion activity. Calculate slope from linear regression of the linear region and determine detection limit from intersection of extrapolated linear segments [25].
Protocol 4: Selectivity Coefficient Determination
- Separate Solution Method (SSM): Measure potential in separate solutions each containing only the primary ion (I) or interfering ion (J) at the same activity (e.g., 0.01 M). Calculate selectivity coefficient using: [ \log K{I,J}^{pot} = \frac{(EJ - EI)zF}{RT\ln 10} + \left(1 - \frac{zI}{zJ}\right)\log aI ] where E₁ and E₂ are measured potentials, z is charge, and a is activity [12].
- Fixed Interference Method (FIM): Measure potential in solutions with constant background of interfering ion (e.g., 0.01 M) while varying primary ion concentration. Determine detection limit for primary ion and calculate selectivity coefficient from this value [12].
Protocol 5: Stability and Reproducibility Assessment
- Short-Term Stability: Measure potential in fixed concentration solution over 1-2 hours. Calculate drift as µV/s or µV/h from linear regression of potential versus time [25].
- Long-Term Stability: Perform daily calibrations over 2-4 weeks. Monitor changes in slope, detection limit, and standard potential to assess lifespan [25].
- Temperature Resistance Testing: Perform complete calibrations at different temperatures (e.g., 10°C, 23°C, 36°C) using thermostated measurement cells. Compare slope, detection limit, and potential stability across temperatures [25].
Emerging Applications and Future Perspectives
The evolution to solid-contact ISEs has enabled transformative applications across multiple fields. In clinical medicine, SC-ISEs now facilitate continuous monitoring of electrolytes (K⁺, Na⁺, Ca²⁺) and pharmaceuticals through wearable sensors and point-of-care devices [22] [12]. For biomedical applications, implantable SC-ISEs enable real-time detection of inflammatory markers, such as elevated calcium concentrations around orthopedic implants, allowing early identification of infection [12].
Environmental monitoring benefits from robust, miniaturized SC-ISEs for field deployment, detecting heavy metals (Cu²⁺, Pb²⁺, Hg²⁺), nutrients (NO₃⁻, NH₄⁺), and chloride in soil and water samples [22]. Industrial process control employs SC-ISEs for quality assurance and therapeutic drug monitoring, particularly for pharmaceuticals with narrow therapeutic indices [22].
Future development trajectories include advanced manufacturing through 3D printing techniques (FDM, SLA) for customizable, low-cost sensor production [22] [24]. Multifunctional nanocomposites will continue to enhance stability, selectivity, and compatibility with complex sample matrices [25]. The convergence of SC-ISEs with wearable platforms and Internet of Things (IoT) systems will further expand their role in personalized medicine and environmental sensing [22] [23].
The historical evolution from liquid-contact to solid-contact ISEs represents a paradigm shift in potentiometric sensing, driven by materials innovations and deepening understanding of interfacial transduction mechanisms. Beginning with the first coated wire electrodes in the 1970s, progressing through the conductive polymer revolution of the 1990s, and culminating in today's sophisticated nanocomposite-based sensors, this journey has transformed ISEs from laboratory instruments to versatile tools for real-world monitoring. The elimination of internal solutions has enabled unprecedented miniaturization, stability, and application flexibility, while maintaining the fundamental analytical advantages of potentiometry. As research continues to address challenges in reproducibility, long-term stability, and biocompatibility, solid-contact ISEs are poised to play an increasingly central role in the next generation of chemical sensing platforms for healthcare, environmental protection, and industrial monitoring.
Advanced Sensor Designs and Their Biomedical Applications
Potentiometry is a well-established electrochemical technique that provides a powerful and versatile method for the sensitive and selective measurement of a variety of analytes by measuring the potential difference between two electrodes under conditions of zero current flow, allowing for a direct and rapid readout of ion concentrations [22]. This technique has become a valuable tool in diverse applications including clinical diagnostics, environmental monitoring, pharmaceutical analysis, and industrial process control [22]. The fundamental component of a potentiometric sensor is the ion-selective electrode (ISE), which generates an electrochemical potential that correlates with the activity of a specific target ion in solution according to the Nernst equation [24]. For decades, the dominant ISE design employed liquid-inner-contact systems, but these traditional electrodes face significant limitations that have prompted the scientific community to develop more advanced solid-contact ISEs (SC-ISEs) with superior performance characteristics [23] [26].
The evolution from liquid-contact to solid-contact designs represents a paradigm shift in potentiometric sensor technology. SC-ISEs have emerged as the largest and most widely utilized category of electrochemical sensors since the end of the last century, marked by the introduction of solid-contact electrodes [27]. These advanced sensors eliminate the internal filling solution present in traditional ISEs, replacing it with a solid-contact layer that serves as an ion-to-electron transducer [23] [28]. This fundamental architectural improvement has enabled the development of sensors with easy miniaturization, enhanced stability, reduced maintenance requirements, and greater compatibility with portable, wearable, and point-of-care analytical devices [22] [23]. Ongoing research in potentiometric sensors predominantly focuses on innovating new variations of solid contact to yield devices with improved analytical parameters, particularly for pharmaceutical and biomedical applications where simplicity, affordability, rapid analysis, and precision are paramount [27].
Limitations of Traditional Liquid-Contact ISEs
Traditional liquid-contact ion-selective electrodes (LC-ISEs) possess inherent limitations that have constrained their development and practical implementation, particularly for miniaturized and field-deployable applications [23]. These conventional electrodes consist of an ion-selective membrane (ISM), an internal electrolyte solution, and an internal reference electrode (typically Ag/AgCl) [22]. The ISM is selective for the target ion, while the internal electrolyte solution contains a fixed concentration of the target ion, and the internal reference electrode provides ion-to-electron transduction [22]. While functionally effective in controlled laboratory settings, this architecture introduces multiple points of potential failure and performance degradation.
The primary limitations of LC-ISEs stem from their reliance on an internal liquid component, which introduces significant mechanical and operational instabilities [23] [26]. These limitations include: (1) Evaporation, permeation, and leakage of the inner filling solution, which affect electrode response and reduce shelf-life; (2) Sensitivity to sample temperature and pressure changes that can cause fluid expansion or contraction; (3) Osmotic pressure effects resulting from differences in ion strength between the sample and internal solution, potentially causing water transfer across the membrane, volume changes, or membrane stratification; (4) The presence of a steady-state ionic flux between the inner filling solution and the test solution; and (5) Practical difficulties in reducing the internal solution volume to the microliter level, thereby hindering effective miniaturization [23]. These factors necessitate careful use and maintenance of LC-ISEs, increasing operational costs and limiting their deployment in field settings or for continuous monitoring applications [23].
Furthermore, the mechanical instability of liquid-contact systems presents particular challenges for modern analytical needs. The potential for leakage or evaporation of the internal solution reduces the shelf-life of the electrode and complicates long-term storage [22]. This structural vulnerability also makes LC-ISEs poorly suited for integration into emerging analytical platforms such as wearable sensors, lab-on-a-chip devices, or implantable medical monitors where consistent, maintenance-free operation is essential [26]. These significant drawbacks have driven sustained research efforts toward developing all-solid-state alternatives that eliminate liquid components while maintaining or improving analytical performance.
Fundamental Principles and Architecture of SC-ISEs
Structural Composition and Working Mechanism
Solid-contact ion-selective electrodes (SC-ISEs) feature a fundamentally different architecture from their liquid-contact counterparts, comprising three essential components: a conductive substrate, a solid-contact (SC) layer, and an ion-selective membrane (ISM) [23] [28]. In this configuration, the SC layer replaces the inner-filling solution and functions as an ion-to-electron transducer, converting ionic signals from the ISM into electronic signals that can be measured as potential [22]. Operationally, when the sensor is exposed to a sample containing the target ion, the ion carrier (ionophore) in the ISM specifically recognizes the ionic species, producing an input signal [22]. The ions in the ISM, serving as freely movable charge carriers, are then conducted to the SC layer, where ion-to-electron conversion occurs at the ISM/SC interface [22]. This elegant design eliminates the problematic liquid junction while maintaining the essential electrochemical transduction process.
The potential difference between SC-ISEs and the reference electrode (including the connected metal wire) represents the measured electromotive force (EMF), which equals the sum of all interfacial potentials in the system [23]. The ISM itself represents a sophisticated composite material typically consisting of several key components: a polymer matrix (e.g., polyvinyl chloride or PVC, polyurethane, acrylic esters) that provides structural integrity; a plasticizer (e.g., bis(2-ethylhexyl) sebacate or DOS, dibutyl phthalate or DBP) to improve membrane plasticity and ion mobility; an ionophore that selectively complexes with the target ion; and an ion exchanger (e.g., sodium tetrakis(pentafluorophenyl)borate or NaTFPB) to facilitate ion exchange and establish the membrane potential [23] [28]. Each component plays a critical role in determining the overall sensor performance, including selectivity, sensitivity, response time, and stability.
Ion-to-Electron Transduction Mechanisms
The fundamental operation of SC-ISEs relies on efficient transduction between ionic conduction in the membrane and electronic conduction in the underlying electrode. Two primary mechanisms have been identified for this critical interface function: redox capacitance and electric double-layer (EDL) capacitance [22] [23].
Redox Capacitance Mechanism: This approach employs conductive materials with large redox capacitance, typically conducting polymers (CPs) such as polyaniline (PANI), polypyrrole (PPy), or poly(3,4-ethylenedioxythiophene) (PEDOT) [23]. These materials exhibit both electronic and ionic conductivity through doping processes, enabling efficient ion-to-electron transduction [23]. The transduction occurs via reversible redox reactions where the conducting polymer undergoes oxidation or reduction accompanied by the incorporation or release of ions from the ISM [23]. For example, the reaction can be represented as: CP+A-(SC) + M+(SIM) + e- ⇌ CP°A-M+(SC), where CP represents the conducting polymer, A- refers to doping ions, and M+ represents the target ions [23]. This Faradaic process provides a stable potential by establishing a well-defined redox equilibrium at the SC/ISM interface.
Electric Double-Layer Capacitance Mechanism: This mechanism relies on non-Faradaic processes at the SC/ISM interface, where charge separation creates an electric double-layer with high capacitance [23] [26]. Materials such as three-dimensionally ordered mesoporous carbon, carbon nanotubes, graphene, and various nanomaterials provide extremely high surface areas that result in correspondingly high double-layer capacitance [26]. This large capacitance minimizes potential drift by effectively "buffering" against minor charge fluctuations, thereby stabilizing the electrode potential [26]. The transduction occurs through the physical separation of charge at the interface without electron transfer across the interface, similar to the operation of electrochemical capacitors.
The following diagram illustrates the fundamental architecture and transduction mechanisms of SC-ISEs:
Performance Optimization Strategies for SC-ISEs
Advanced Materials for Solid-Contact Layers
The performance of SC-ISEs critically depends on the properties of the solid-contact layer, which serves as the ion-to-electron transducer. Recent research has focused on developing and optimizing various classes of materials to enhance transduction efficiency, stability, and reproducibility. These materials can be broadly categorized into conducting polymers, carbon-based nanomaterials, and nanocomposites, each offering distinct advantages for specific applications [27].
Conducting Polymers: Materials such as polyaniline (PANI), polypyrrole (PPy), and poly(3,4-ethylenedioxythiophene) (PEDOT) remain widely employed due to their mixed ionic-electronic conductivity and well-established redox capacitance mechanisms [23] [29]. These polymers facilitate reversible redox reactions that enable efficient ion-to-electron transduction while providing reasonable hydrophobicity to minimize water layer formation [29]. For instance, in a study on letrozole detection, PANI nanoparticles significantly enhanced sensor performance, extending the linear range to 1.00 × 10⁻⁸ – 1.00 × 10⁻² M and improving stability compared to unmodified electrodes [29].
Carbon-Based Materials: Carbon nanomaterials including graphene, carbon nanotubes, colloid-imprinted mesoporous carbon, and fullerene derivatives have gained prominence due to their exceptionally high double-layer capacitance, chemical stability, and large surface areas [22] [26]. These materials operate primarily through the electric double-layer capacitance mechanism, providing excellent potential stability with minimal drift [26]. Graphene nanocomposites (GNC) have demonstrated particular utility, with their hydrophobic character helping to prevent the development of a water layer between the solid contact and the ion-selective membrane [29].
Nanocomposites and Hybrid Materials: Recent approaches have focused on developing nanocomposite materials that combine the advantages of multiple material classes to achieve synergistic effects [22]. For example, tubular gold nanoparticles with tetrathiafulvalene (Au-TTF) have been employed as solid-contact layers for potassium detection, demonstrating high capacitance and excellent stability [22]. Similarly, MoS₂ nanoflowers filled with Fe₃O₄ create stable structures with enhanced capacitance [22]. MXenes and other two-dimensional materials have also emerged as promising transducers due to their unique electrical properties and surface chemistries [27].
Ion-Selective Membrane Engineering
The ion-selective membrane represents another critical component where strategic optimization can significantly enhance SC-ISE performance. Beyond the fundamental composition (polymer matrix, plasticizer, ionophore, and ion exchanger), recent advances have focused on improving membrane integrity, selectivity, and longevity [23].
Key strategies include the development of highly hydrophobic ionophores to prevent leaching of membrane components into the sample solution [23]. Additionally, optimization of plasticizer polarity and compatibility with ionophores has been shown to enhance selectivity coefficients by orders of magnitude [23]. The use of alternative polymer matrices beyond traditional PVC, such as polyurethane, silicone rubber, and acrylic polymers, can improve mechanical stability and adhesion to the solid-contact layer [23]. Furthermore, incorporating lipophilic additives in optimal concentrations helps establish stable Donnan exclusion at the membrane-sample interface, reducing interference from lipophilic anions or cations [23].
Table 1: Key Material Classes for Solid-Contact Layers in SC-ISEs
| Material Class | Examples | Transduction Mechanism | Key Advantages | Limitations |
|---|---|---|---|---|
| Conducting Polymers | Polyaniline (PANI), Polypyrrole (PPy), PEDOT | Redox Capacitance | Mixed ionic-electronic conductivity, reproducible synthesis | Sensitivity to O₂, CO₂, light in some cases |
| Carbon Materials | Graphene, CNTs, Mesoporous Carbon | Electric Double-Layer Capacitance | High chemical stability, large surface area, hydrophobic | Potential water layer formation without proper hydrophobicity |
| Nanocomposites | MoS₂/Fe₃O₄, Au-TTF, Polymer-Carbon hybrids | Combined Mechanisms | Synergistic effects, tunable properties, enhanced stability | More complex fabrication, potential reproducibility challenges |
| MXenes and 2D Materials | Ti₃C₂Tₓ, Transition metal dichalcogenides | Primarily Double-Layer Capacitance | High conductivity, rich surface chemistry, modular functionality | Relatively new with limited long-term stability data |
Experimental Protocol for Fabricating Reproducible SC-ISEs
Achieving high electrode-to-electrode reproducibility requires meticulous attention to fabrication protocols. The following methodology outlines a standardized approach for constructing SC-ISEs with consistent performance characteristics, based on optimized procedures reported in recent literature [26] [29]:
Step 1: Substrate Preparation
- Begin with polished conductive substrates (glassy carbon, gold, or screen-printed electrodes)
- Clean substrates sequentially with alumina slurry (0.05 μm), distilled water, and ethanol in an ultrasonic bath
- Dry under a stream of inert gas (N₂ or Ar) to prevent oxidation
Step 2: Solid-Contact Layer Deposition
- For conducting polymers: Employ electrochemical polymerization by cycling potential in monomer solution (e.g., 0.1 M aniline in 0.5 M H₂SO₄ for PANI) or drop-cast from polymer solutions
- For carbon nanomaterials: Prepare dispersions in appropriate solvents (e.g., xylene for graphene) and sonicate for uniform dispersion. Deposit via drop-casting or spray-coating
- For nanocomposites: Optimize component ratios (e.g., 10% w/w graphene in polymer matrix) and employ solution blending followed by deposition
- Ensure uniform thickness through controlled deposition parameters (volume, concentration, spin-coating speed)
Step 3: Ion-Selective Membrane Application
- Prepare membrane cocktail containing polymer matrix (e.g., PVC), plasticizer (e.g., DOP), ionophore, and ion exchanger dissolved in tetrahydrofuran (THF)
- Typical composition: 1-2% ionophore, 0.5-1% ion exchanger, 30-33% PVC, and 65-66% plasticizer by weight
- Apply membrane cocktail over solid-contact layer using micro-syringe for precise volume control
- Allow slow solvent evaporation under controlled atmosphere for 24-48 hours to prevent membrane defects
Step 4: Conditioning and Characterization
- Condition fabricated SC-ISEs in solution containing primary ions (typically 0.01 M) for 24-48 hours to establish stable potentials
- Validate performance through calibration in standard solutions, checking for Nernstian slope, response time, and potential drift
- Assess reproducibility by fabricating multiple electrodes (n ≥ 5) from the same batch and calculating standard deviation of standard potentials
Comparative Performance Analysis: SC-ISEs vs. Liquid-Contact ISEs
The transition from liquid-contact to solid-contact ISE designs has yielded significant improvements across multiple performance parameters. The following table provides a comprehensive comparison of key characteristics between these two electrode architectures, highlighting the advantages of SC-ISEs for modern analytical applications.
Table 2: Performance Comparison: Liquid-Contact vs. Solid-Contact ISEs
| Parameter | Liquid-Contact ISEs | Solid-Contact ISEs | Implications for Applications |
|---|---|---|---|
| Miniaturization Potential | Limited by internal solution volume | Excellent, compatible with microfabrication | Enables wearable, implantable, and lab-on-chip devices |
| Response Time | Typically 10-30 seconds | Can be as fast as 2-3 seconds [27] | Suitable for rapid screening and high-throughput analysis |
| Signal Stability | Prone to drift due to internal solution changes | Enhanced stability with proper solid-contact design | Reduces recalibration frequency for long-term monitoring |
| Detection Limit | Typically 10⁻⁵ - 10⁻⁶ M | Can reach 10⁻⁸ M or lower with optimized transducers [27] [29] | Enables trace analysis in environmental and biomedical samples |
| Mechanical Stability | Vulnerable to orientation, pressure, and leakage | Robust, insensitive to position or movement | Ideal for field applications and portable devices |
| Manufacturing Reproducibility | Generally high between batches | Improving with advanced materials and protocols [26] | Critical for commercial production and standardized methods |
| Lifetime | Limited by internal solution depletion | Can exceed 6 months with stable materials [27] | Reduces cost per analysis for routine applications |
| Power Consumption | Moderate | Very low, operates at zero current | Suitable for battery-powered portable devices |
The performance advantages of SC-ISEs extend beyond these basic parameters to include enhanced compatibility with complex sample matrices. The elimination of the liquid junction prevents contamination of the internal solution and minimizes junction potentials that can arise with samples of varying ionic strength [23]. Additionally, the solid-state architecture provides greater resistance to fouling in biological or environmental samples, as the absence of fluid connections prevents clogging or microbial growth in confined spaces [22].
Applications in Pharmaceutical and Biomedical Analysis
SC-ISEs have found particularly valuable applications in pharmaceutical analysis and therapeutic drug monitoring (TDM), where their inherent advantages align well with the requirements for rapid, cost-effective, and precise determination of pharmaceutical compounds [27]. The ability to perform analyses directly on samples without extensive pretreatment makes SC-ISEs promising candidates for quality control in pharmaceutical manufacturing and clinical monitoring [27].
In pharmaceutical quality control, SC-ISEs enable rapid determination of active pharmaceutical ingredients (APIs) in various dosage forms, facilitating batch-to-batch consistency verification and detection of impurities [22] [27]. For example, potentiometric sensors have demonstrated effectiveness in detecting drugs like diclofenac with remarkably short response times of 2-3 seconds, significantly faster than many conventional analytical techniques [27]. Similarly, lidocaine hydrochloride sensors exhibit rapid response (4-6 seconds) and extended lifespans of up to 6 months, highlighting the practical utility of SC-ISEs for routine pharmaceutical analysis [27].
Therapeutic drug monitoring represents another critical application area, particularly for pharmaceuticals with narrow therapeutic indices or high inter-individual pharmacokinetic variability [22]. SC-ISEs permit frequent, cost-effective monitoring of drug concentrations in biological fluids, enabling personalized dosage adjustments to maintain therapeutic efficacy while minimizing adverse effects [22]. A notable example is the development of green SC-ISEs for the determination of Letrozole, an anticancer drug, in dosage forms and human plasma [29]. Sensors modified with polyaniline nanoparticles demonstrated exceptional sensitivity with a linear range of 1.00 × 10⁻⁸ – 1.00 × 10⁻² M, successfully applied to determine Letrozole in human plasma with recoveries ranging from 88.00 to 96.30% [29].
The following experimental workflow illustrates the development and application of SC-ISEs for pharmaceutical analysis:
Wearable potentiometric sensors represent one of the most promising biomedical applications of SC-ISEs, enabling continuous monitoring of biomarkers, electrolytes, and pharmaceuticals in biological fluids [22]. These devices can be integrated into epidermal patches, eyeglasses, watches, and tattoos, providing real-time physiological data through Bluetooth or NFC wireless communication protocols [27]. The miniaturization capability of SC-ISEs, coupled with their low power requirements, makes them ideally suited for such non-invasive monitoring applications, potentially revolutionizing personalized medicine and remote patient monitoring [22].
The Scientist's Toolkit: Essential Materials and Reagents
Successful development and implementation of SC-ISEs requires careful selection of materials and reagents optimized for specific applications. The following table provides a comprehensive overview of essential components used in the fabrication of high-performance SC-ISEs, along with their respective functions and representative examples.
Table 3: Essential Research Reagents for SC-ISE Development
| Component Category | Specific Function | Representative Examples | Application Notes |
|---|---|---|---|
| Polymer Matrices | Provides structural backbone for ion-selective membrane | PVC, polyurethane, acrylic esters, silicone rubber | PVC most common; alternatives offer improved adhesion or flexibility |
| Plasticizers | Imparts mobility to membrane components, controls viscosity | DOS, DBP, DOP, NOPE | Polarity affects selectivity; compatibility with ionophore is critical |
| Ionophores | Selective recognition and complexation of target ions | Valinomycin (K⁺), nonactin (NH₄⁺), calixarenes, synthetic carriers | Hydrophobicity prevents leaching; structure determines selectivity |
| Ion Exchangers | Facilitates ion exchange, establishes membrane potential | NaTFPB, KTPCIPB, KTFPB, NaTPB | Concentration affects selectivity and detection limit |
| Transducer Materials | Ion-to-electron conversion at ISM/SC interface | PANI, PPy, PEDOT (polymers); graphene, CNTs, mesoporous carbon (nanomaterials) | Choice determines transduction mechanism (redox vs. EDL capacitance) |
| Solvents | Dissolves membrane components for uniform deposition | THF, cyclohexanone, acetonitrile | Affects membrane morphology during evaporation; THF most common |
| Conductive Substrates | Provides electronic connection to measurement instrument | Glassy carbon, gold, platinum, screen-printed electrodes | Surface roughness affects adhesion; pretreatment critical for reproducibility |
This toolkit enables researchers to systematically optimize SC-ISE performance by selecting appropriate material combinations for specific analytical challenges. For instance, the development of sensors for highly lipophilic ions might benefit from more hydrophobic polymer matrices and plasticizers to minimize leaching, while applications requiring extreme miniaturization might prioritize nanomaterials with exceptionally high capacitance to maintain stability despite reduced interfacial area [23] [26]. The continuous expansion of available materials, including newly developed ionophores with enhanced selectivity and novel nanomaterials with tailored properties, provides an ever-increasing design space for optimizing SC-ISEs for specialized applications.
Future Perspectives and Concluding Remarks
The field of solid-contact ion-selective electrodes continues to evolve rapidly, driven by both fundamental advances in materials science and emerging application requirements. Several promising research directions are likely to shape the future development of SC-ISEs, including the refinement of nanomaterial transducers with optimized structures and surface properties, the development of increasingly selective ionophores through rational design and combinatorial screening approaches, and the integration of SC-ISEs with microfluidic systems for automated sample handling and analysis [27] [23].
The growing emphasis on sustainability and green analytical chemistry is also influencing SC-ISE development, with research focusing on environmentally benign alternative materials and fabrication methods [29]. The adoption of 3D printing techniques for sensor production represents another significant trend, offering improved flexibility and precision in the manufacturing of ion-selective electrodes while enabling rapid prototyping and optimization of critical electrochemical parameters [22] [24]. These additive manufacturing approaches facilitate the creation of customized sensor geometries tailored to specific applications, potentially reducing production costs and increasing accessibility of potentiometric sensing technology [24].
Despite substantial progress, challenges remain in achieving perfect electrode-to-electrode reproducibility, long-term stability under extreme conditions, and seamless integration with complex sample matrices [26]. The water layer formation between the ISM and SC, although better understood and controlled than in early SC-ISEs, continues to represent a potential source of instability that requires careful material selection and fabrication control to mitigate [26] [29]. Additionally, the translation of laboratory-developed SC-ISEs to commercially viable products demands improved manufacturing protocols that ensure consistent performance across production batches [26].
In conclusion, solid-contact ISEs have successfully overcome the fundamental limitations of traditional liquid-inner-contact designs, enabling a new generation of potentiometric sensors with enhanced miniaturization capability, stability, and application versatility. Through strategic implementation of advanced materials, particularly conducting polymers and nanomaterials serving as efficient ion-to-electron transducers, SC-ISEs have transformed from specialized research tools into robust analytical platforms ready to address challenging measurement needs across pharmaceutical, clinical, environmental, and industrial domains. As research continues to refine these promising sensors, their integration into wearable devices, point-of-care diagnostics, and intelligent monitoring systems promises to further expand their impact on scientific research and societal wellbeing.
The evolution of potentiometric ion sensors from conventional liquid-contact electrodes to all-solid-state architectures represents a paradigm shift in electrochemical sensing. This transition hinges on a critical component: the ion-to-electron transducer. This layer facilitates the conversion of an ionic signal from the sample into an electronic signal measurable by the underlying electrode, a process fundamental to the operation of solid-contact ion-selective electrodes (SC-ISEs) [30]. The absence of an internal filling solution in SC-ISEs bestows significant advantages, including ease of miniaturization, robustness, and suitability for portable and in-situ analysis [30] [31]. However, it also introduces the central challenge of establishing a stable and reproducible potential at the back-contact of the ion-selective membrane (ISM). The performance of this transducer layer directly dictates the sensor's potential stability, response time, and lifespan [32].
For decades, conducting polymers (CPs) were the dominant transducer material. More recently, carbon-based nanomaterials have emerged as powerful alternatives. This whitepaper provides an in-depth technical analysis of these two material classes, elucidating their fundamental transduction mechanisms, comparative performance characteristics, and detailed experimental protocols for their implementation. The insights are framed within the broader context of developing reliable potentiometric cells for advanced applications in pharmaceutical drug development, clinical diagnostics, and environmental monitoring.
Fundamental Transduction Mechanisms
The primary function of the transducer is to provide a non-polarizable interface with a high thermodynamic exchange current density, enabling a reversible transition between ionic and electronic conduction [30] [33]. The mechanisms by which this is achieved differ fundamentally between conducting polymers and capacitive carbon materials.
Conducting Polymers: Redox Capacitance
Conducting polymers such as PEDOT, PANi, and PPy function as redox capacitors [32]. These materials possess mixed ionic and electronic conductivity. Their backbone allows for electronic conduction, while their ability to be oxidized and reduced (doped and de-doped) with the simultaneous ingress or egress of ions from the adjacent membrane or solution provides the ionic pathway. The transduction mechanism is governed by the polymer's redox chemistry. A constant potential is maintained by the high redox capacitance of the polymer layer, which buffers against minor current flows, ensuring a stable potential at the inner interface [31] [32]. This mechanism can be represented by the following general redox reaction for a CP:
$$ \text{CP}^+ \text{A}^- + e^- \rightleftharpoons \text{CP} + \text{A}^- \quad \text{(for anion-doped CPs)} $$
Carbon-Based Materials: Electrical Double-Layer Capacitance
Carbon nanomaterials, including single-walled carbon nanotubes (SWCNTs), multi-walled carbon nanotubes (MWCNTs), and graphene, operate on a different principle: electrical double-layer capacitance (EDLC) [34] [32]. These materials are excellent electronic conductors but are typically not ionically conductive. Their transduction capability stems from their exceptionally high surface area, which allows for the formation of a large capacitive double layer at the interface between the solid transducer and the ion-selective membrane. This double layer, behaving as a capacitor, stores charge and stabilizes the potential. The capacitance ((C_{dl})) is a key parameter, with higher values leading to greater potential stability. The SWCNTs, for instance, provide stable potentiometric responses due to their "low resistance and large bulk double-layer capacitance" [34] [35].
The logical workflow for selecting and evaluating a transducer material based on its underlying mechanism is summarized in the following diagram:
Comparative Analysis of Transducer Materials
The choice between conducting polymers and carbon-based materials involves a trade-off between their respective advantages and limitations. A systematic comparison is essential for rational sensor design.
Table 1: Comparative Analysis of Ion-to-Electron Transducer Materials
| Property | Conducting Polymers (e.g., PEDOT, PANi) | Carbon-Based Materials (e.g., SWCNTs, Graphene) |
|---|---|---|
| Transduction Mechanism | Redox Capacitance [32] | Electrical Double-Layer Capacitance [34] [32] |
| Key Advantage | High inherent redox capacitance; well-established deposition methods [31] | High chemical stability; light insensitivity; prevents water layer formation [34] [30] |
| Primary Limitation | Sensitive to light, O₂, CO₂; prone to redox interference from sample [34] [31] | No inherent ion selectivity; requires optimized dispersion and deposition [30] |
| Hydrophobicity | Moderate, can be tuned via functionalization [31] | Very high, a key factor in blocking water layer [34] [33] |
| Stability (Potential Drift) | Can be susceptible to drift due to side reactions [31] | Very stable; e.g., MWCNT sensor showed drift as low as 34.6 µV/s [32] |
| Typical Deposition Method | Electropolymerization or solution casting [31] [12] | Spray-coating, drop-casting, or in-situ growth [34] |
Quantitative performance data across recent studies further highlights the capabilities of these materials.
Table 2: Performance Metrics of Carbon-Based Transducers in Solid-Contact ISEs
| SC Material | Base Electrode | Target Ion | Sensitivity (mV/decade) | Linear Range (M) | Response Time (s) | Reference |
|---|---|---|---|---|---|---|
| CNT | CNT | Na⁺ | 56 ± 3 | 7.08 × 10⁻⁷ to 1 | 57 | [30] |
| Graphene | Carbon electrode | Na⁺ | 60.2 ± 0.9 | 1 × 10⁻⁶ to 1 | 60 | [30] |
| Carbon Black | Screen-printed electrode | Na⁺ | 58 ± 3 | 1 × 10⁻⁷ to 1 | Not specified | [30] |
| 3DOMC | Ni mesh | K⁺ | 56.4 | 1.6 × 10⁻⁷ to 1 | Not specified | [30] |
| MWCNTs | Screen-printed | Venlafaxine | 56.1 ± 0.8 | 10⁻² to ~10⁻⁵ | Not specified | [32] |
Advanced Material Architectures and Composites
To overcome the limitations of pristine materials, the field is increasingly moving towards advanced composites and functionalized architectures.
Functionalized Conducting Polymers (FCPs): Chemical modification of CPs is a powerful strategy to enhance their properties. This includes creating substituted or derivatized FCPs, nanostructured FCPs, and multicomponent FCPs that combine CPs with carbonaceous materials, metal oxides, or other polymers [31]. These modifications aim to alter hydrophobicity, conductance, redox capacitance, and suppress undesirable sensitivities to pH, light, or gases [31]. For instance, a potentiometric sensor for Ca²⁺ was developed using a conductive copolymer of 2,2′-bithiophene and the calcium chelator BAPTA, integrating the ion-recognition site directly into the polymer backbone [12].
Carbon-Polymer and Other Composites: Combining carbon materials with other components can yield synergistic effects. A 2025 study reported a graphene-cobalt hexacyanoferrate composite used as a transducer interlayer. The graphene provided a hydrophobic, high-surface-area scaffold, while the cobalt hexacyanoferrate nanoparticles contributed to the electron transfer process, resulting in a sensor with improved potential steadiness and reproducibility [36]. Another approach to enhance selectivity, beyond the transducer's role, is the incorporation of Molecularly Imprinted Polymers (MIPs) as synthetic receptors within the ion-selective membrane [33] [36].
Experimental Protocols
The following section provides detailed methodologies for fabricating and characterizing SC-ISEs with different transducer layers, serving as a guide for research and development.
Protocol 1: Fabrication of SWCNT-Based Solid-State Reference Electrode
This protocol, adapted from a foundational study, details the creation of a transducer layer using single-walled carbon nanotubes [34].
- Step 1: Electrode Substrate Preparation. Begin with a glassy carbon (GC) rod. Polish the distal end sequentially with abrasive paper (e.g., P1200 grit) and alumina slurries of decreasing grain size (e.g., 30 μm, 5 μm, and 1 μm). Rinse thoroughly with deionized water after each polishing step.
- Step 2: SWCNT Dispersion Preparation. Disperse 25 mg of carboxylated SWCNTs and 100 mg of sodium dodecyl sulfate (SDS) in 10 mL of water. Homogenize the dispersion using a tip-sonicator for 60 minutes (e.g., at 60% amplitude, 0.5 cycle) to exfoliate the nanotubes and create a stable suspension.
- Step 3: SWCNT Layer Deposition. Spray the homogenized SWCNT dispersion onto the polished distal end of the GC rod. Allow the electrode to dry. To remove the SDS surfactant, heat the electrode at 300°C for 1 hour in an inert atmosphere. This results in a pure, porous SWCNT layer approximately 30 μm thick.
- Step 4: Application of Reference Membrane. Prepare a reference membrane cocktail containing the Ag/AgCl/Cl⁻ system dispersed in a polyacrylate polymer (e.g., photo-polymerised n-butyl acrylate). Deposit this cocktail onto the SWCNT layer and cure according to the polymer's requirements (e.g., UV light for photo-polymerised layers). The SWCNT layer acts as the transducer between the reference membrane and the GC conductor.
Protocol 2: Fabrication of a Graphene-Modified Coated Graphite Sensor
This protocol outlines the preparation of a solid-contact ion-selective electrode using graphene nanoplatelets as a hydrophobic transducer [33].
- Step 1: Transducer Layer Preparation. Disperse graphene nanoplatelets in a suitable solvent to create a homogeneous ink. Deposit this ink onto a glassy carbon electrode (GCE) surface and allow it to dry, forming a thin, conductive film. This layer is critical for preventing the formation of a water layer.
- Step 2: Ion-Selective Membrane (ISM) Preparation. Weigh out the membrane components: 45 mg Dioctyl phthalate (plasticizer), 45 mg PVC (polymer matrix), and 10 mg of the drug-ion exchanger complex (e.g., BNZ-TPB for benzydamine hydrochloride). Dissolve the mixture in 7 mL of tetrahydrofuran (THF) and stir thoroughly to create a homogeneous cocktail.
- Step 3: Sensor Assembly. Apply the ISM cocktail directly onto the graphene-modified GCE. One method is to use a petri dish to cast a master membrane, from which a disc is cut and glued to the electrode tip with THF. Alternatively, the cocktail can be drop-cast directly onto the transducer layer. The solvent (THF) is allowed to evaporate overnight, leaving a solid, adherent membrane.
- Step 4: Conditioning and Storage. Condition the assembled sensor by immersing it in a solution of the target analyte (e.g., 10⁻² M) for several hours to establish a stable equilibrium at the membrane interface. For storage, keep the sensor dry, typically under refrigeration.
The workflow for this potentiometric sensor fabrication is visualized below:
Key Electrochemical Characterization Techniques
To validate transducer performance, the following electrochemical methods are essential:
- Chronopotentiometry (CP): Used to assess the potential drift of the SC-ISE. A small constant current is applied, and the subsequent potential shift is recorded. A lower potential drift ((\Delta E/\Delta t)) indicates a higher capacitance and better potential stability [32]. This is the primary method for determining the total capacitance of the solid contact ((C = I / (dE/dt))).
- Electrochemical Impedance Spectroscopy (EIS): This technique deconvolutes the different resistive and capacitive elements of the sensor, including the bulk resistance ((Rb)), the geometric capacitance ((Cg)), and the double-layer capacitance ((C_{dl})) [32]. It is invaluable for diagnosing interfacial properties and understanding the transduction mechanism.
- Cyclic Voltammetry (CV): For conducting polymer-based transducers, CV verifies the electroactivity and redox properties of the polymer layer. It can also be used to estimate the redox capacitance.
The Scientist's Toolkit: Essential Research Reagents and Materials
The following table catalogs key materials and their functions for developing and fabricating advanced solid-contact ion-selective electrodes.
Table 3: Essential Reagents and Materials for SC-ISE Fabrication
| Material Category | Specific Examples | Function in Sensor Fabrication |
|---|---|---|
| Transducer Materials | Single/Multi-walled Carbon Nanotubes (SWCNTs/MWCNTs), Graphene Nanoplatelets, Poly(3,4-ethylenedioxythiophene) (PEDOT), Polyaniline (PANI) | Ion-to-electron transduction; stabilizes potential; blocks water layer [34] [30] [32] |
| Polymer Matrices | Poly(Vinyl Chloride) (PVC), poly(n-butyl acrylate) (nBA), poly(methyl methacrylate) (MMA), Fluoropolysiloxane (FPSX) | Forms the scaffold of the ion-selective membrane; determines diffusivity and adhesion [34] [37] [35] |
| Plasticizers | 2-Nitrophenyl octyl ether (o-NPOE), Dioctyl phthalate (DOP) | Imparts mobility to ionophores/exchangers within the membrane; influences dielectric constant [35] [32] |
| Ion Exchangers | Sodium tetraphenylborate (NaTPB), Potassium tetrakis(p-chlorophenyl)borate (K-TCPB) | Provides initial ionic sites in the membrane for proper ion-exchange operation [35] [33] |
| Selectivity Enhancers | Molecularly Imprinted Polymers (MIPs), Calix[n]arenes, specific ionophores | Imparts high selectivity for the target analyte over potential interferents [33] [36] |
| Solvents | Tetrahydrofuran (THF), Dimethylsulfoxide (DMSO) | Dissolves membrane components for uniform deposition and film formation [35] [33] |
The development of high-performance potentiometric cells is intrinsically linked to the rational design and implementation of the ion-to-electron transducer layer. Both conducting polymers and carbon-based materials offer distinct and powerful transduction mechanisms—redox capacitance and electrical double-layer capacitance, respectively. The choice between them, or the decision to combine them into composite structures, depends on the specific application requirements, such as the need for extreme stability, resistance to light or redox interferents, and the complexity of the sample matrix.
Future progress in this field will be driven by the continued refinement of functionalized materials and composite transducers that synergistically combine the benefits of different material classes. Furthermore, the integration of synthetic receptors like MIPs will push the boundaries of selectivity, enabling the direct analysis of complex biological and pharmaceutical samples. As these transducer technologies mature, they will unlock new possibilities for miniaturized, robust, and highly sensitive potentiometric sensors, solidifying their role as indispensable tools in modern drug development and analytical science.
The Rise of Wearable Potentiometric Sensors for Continuous Monitoring of Biomarkers and Electrolytes
Wearable potentiometric sensors (WPS) represent a paradigm shift in biosensing, translating the foundational principles of potentiometric cell setup—comprising a reference electrode, an ion-selective membrane, and an internal filling solution—into miniaturized, robust platforms for continuous, real-time biochemical monitoring. The core thesis of modern potentiometric research is the evolution of these classical components into solid-contact and all-solid-state architectures to overcome the limitations of traditional electrochemistry for decentralized, longitudinal analysis. This guide details the technical advancements, materials, and methodologies driving this field.
Core Components & Signal Transduction Mechanisms
The fundamental operation of a WPS is governed by the Nernst equation, which relates the measured potential (E) to the ionic activity (a_i) of the target analyte:
E = E⁰ + (RT/zF) ln(a_i)
Where E⁰ is the standard potential, R is the gas constant, T is temperature, z is the ion charge, and F is the Faraday constant.
Evolution of Potentiometric Cell Components for Wearables
Table 1: Evolution of Key Potentiometric Cell Components
| Component | Traditional Lab Setup | Wearable Sensor Implementation | Key Advancement |
|---|---|---|---|
| Ion-Selective Membrane (ISM) | PVC matrix with ionophore/plasticizer. | Polymer matrices (e.g., PU, PDMS) or Hydrogels; printed electrodes. | Enhanced biocompatibility, flexibility, and resistance to biofouling. |
| Internal Filling Solution | Aqueous solution containing fixed Cl⁻ concentration. | Eliminated. Replaced by a solid-contact layer. | Moves from liquid-contact to solid-contact, enabling miniaturization and mechanical stability. |
| Solid-Contact (SC) Layer | Not present. | Conducting polymers (PEDOT:PSS), graphene, CNTs, or 3D porous carbons. | Ion-to-electron transduction, prevents water layer formation, improves potential stability. |
| Reference Electrode | Ag/AgCl in saturated KCl with porous frit. | Solid-state reference (e.g., Ag/AgCl with ion-selective or lipophilic membranes). | All-solid-state designs for resilience against sweat rate and composition changes. |
Diagram 1: WPS Signal Transduction
Key Experimental Protocols
Protocol: Fabrication of a Solid-Contact Potentiometric Sensor for Sweat Na⁺ Monitoring
Objective: To fabricate a flexible, solid-contact ion-selective electrode (SC-ISE) for sodium detection in sweat.
Materials:
- Substrate: Polyimide or PET film.
- Electrodes: Screen-printed carbon or inkjet-printed gold electrodes.
- Solid-Contact Material: PEDOT:PSS dispersion or Graphene ink.
- Ion-Selective Cocktail: Sodium ionophore X, Na-TFPB (ion-exchanger), PVC, and o-NPOE (plasticizer) dissolved in THF.
- Reference Electrode Cocktail: PVC, DOS (plasticizer), and KTpClPB (lipophilic salt).
Methodology:
- Electrode Patterning: Pattern the working (WE) and reference (RE) electrode tracks onto the substrate using screen-printing or inkjet printing. Cure according to ink specifications.
- Solid-Contact Deposition: Deposit 5-10 µL of PEDOT:PSS onto the WE area. Dry at 60°C for 30 minutes to form a uniform, conductive film.
- Ion-Selective Membrane (ISM) Casting:
- Prepare the Na⁺-ISM cocktail: 1.0 wt% Sodium ionophore X, 0.5 wt% Na-TFPB, 33.0 wt% PVC, and 65.5 wt% o-NPOE in THF.
- Drop-cast 20-50 µL of the cocktail onto the PEDOT:PSS-modified WE.
- Allow the THF to evaporate slowly for 24 hours at room temperature to form a homogeneous, elastic membrane.
- Reference Membrane Casting:
- Prepare the RE cocktail: 1.0 wt% KTpClPB, 65.5 wt% DOS, and 33.0 wt% PVC in THF.
- Drop-cast an equivalent volume onto the RE track and allow to dry similarly.
- Conditioning: Condition the assembled sensor in a 0.01 M NaCl solution for at least 12 hours before calibration.
Protocol: In-Vitro Calibration and Analytical Characterization
Objective: To determine the sensor's sensitivity, detection limit, and selectivity.
Methodology:
- Setup: Connect the WE and RE to a high-input-impedance potentiostat or data acquisition system.
- Calibration: Sequentially immerse the sensor in a series of standard NaCl solutions (e.g., 10⁻⁵ M to 0.1 M) under gentle stirring. Record the stable potential (E) at each concentration after 60 seconds.
- Data Analysis:
- Plot E (mV) vs. log(a_Na⁺). The slope of the linear region is the sensitivity. A Nernstian slope of ~59.2 mV/decade at 25°C is ideal.
- The detection limit is calculated from the intersection of the two extrapolated linear segments of the calibration curve.
- Selectivity Test: Perform the separate solution method by measuring the potential in solutions of a fixed activity (e.g., 0.01 M) of Na⁺ and interfering ions (K⁺, Ca²⁺, Mg²⁺). Calculate the potentiometric selectivity coefficient (log Kpot) using the Nicolsky-Eisenman equation. A highly negative log Kpot indicates high selectivity for Na⁺ over the interferent.
Protocol: On-Body Validation for Continuous Monitoring
Objective: To validate sensor performance during human subject exercise.
Methodology:
- Sensor Integration: Integrate the fabricated Na⁺ sensor and RE into a flexible epidermal patch incorporating a microfluidic sweat channel.
- Subject & Protocol: Recruit human subjects following IRB-approved protocols. Affix the sensor patch to the forearm or lower back.
- Stimulus: Subjects perform stationary cycling at a controlled workload to induce sweat.
- Data Collection: Continuously record the potentiometric signal from the sensor. Simultaneously, collect sweat samples at regular intervals (e.g., every 5 minutes) via the microfluidic channel or via absorbent pads.
- Reference Analysis: Analyze the collected sweat samples for Na⁺ concentration using a gold-standard method (e.g., Ion Chromatography or ICP-MS).
- Correlation: Statistically correlate the continuously recorded sensor signal with the discretely measured reference values to determine accuracy (e.g., via Pearson correlation coefficient and Bland-Altman analysis).
Diagram 2: WPS Validation Workflow
Quantitative Performance Data
Table 2: Performance Metrics of Recent Wearable Potentiometric Sensors
| Analyte | Sample Matrix | Linear Range | Sensitivity (mV/decade) | Detection Limit | Selectivity (log K_pot) | Ref. Method Correlation (R²) |
|---|---|---|---|---|---|---|
| Na⁺ | Sweat | 10 mM - 100 mM | 58.5 ± 1.2 | 0.1 mM | K⁺: -2.8; Ca²⁺: -4.1 | 0.98 vs. IC |
| K⁺ | Sweat | 1 mM - 32 mM | 59.8 ± 0.8 | 0.01 mM | Na⁺: -2.5; Mg²⁺: -3.9 | 0.97 vs. ICP-MS |
| Ca²⁺ | Sweat | 0.1 mM - 10 mM | 29.1 ± 0.5 | 0.02 mM | Na⁺: -4.5; K⁺: -4.2 | 0.95 vs. IC |
| H⁺ (pH) | Sweat/Wound | pH 4 - 8 | -54.2 ± 1.5 (theoretical -59.2) | - | Na⁺: -11.2 | 0.99 vs. pH meter |
| Cl⁻ | Sweat | 10 mM - 150 mM | -52.3 ± 1.8 | 0.5 mM | HCO₃⁻: -2.9 | 0.96 vs. ISE |
The Scientist's Toolkit: Essential Research Reagents & Materials
Table 3: Key Reagent Solutions for WPS Development
| Item | Function / Rationale |
|---|---|
| Ionophores (e.g., Valinomycin for K⁺) | The molecular recognition element that selectively binds the target ion, determining sensor selectivity. |
| Ion-Exchangers (e.g., Na-TFPB, KTpClPB) | Lipophilic salts added to the ISM to prevent anion interference and establish a stable phase boundary potential. |
| Polymer Matrices (e.g., PVC, PU, Hydrogels) | The structural backbone of the ISM, providing mechanical stability and hosting the sensing chemistry. |
| Plasticizers (e.g., o-NPOE, DOS) | Impart flexibility to the polymer membrane, dissolve ionophores, and modulate the membrane's dielectric constant. |
| Conducting Polymers (e.g., PEDOT:PSS) | Serve as the solid-contact layer, providing high capacitance and efficient ion-to-electron transduction. |
| Lipophilic Salt Additives (for RE) | Added to the reference electrode membrane to stabilize the potential by minimizing junction potentials. |
| Tetrahydrofuran (THF) | A volatile solvent used to dissolve the ISM cocktail components for drop-casting or spin-coating. |
The field of electrochemical sensing is undergoing a transformative shift with the integration of additive manufacturing, commonly known as 3D printing. This paradigm is particularly impactful for potentiometric cell setups, which measure ion activity by detecting electrical potential under zero-current conditions [24] [38]. Traditional manufacturing of these sensors often involves labor-intensive, manual processes that can lead to device-to-device variability and hinder miniaturization and complex design integration [39] [14].
3D printing addresses these challenges by enabling the layer-by-layer fabrication of complete sensing systems—including electrode housings, solid contacts, conductive traces, and even the ion-selective membranes themselves [24] [40]. This capability facilitates unprecedented design freedom, rapid prototyping, and the creation of complex, customized geometries that are difficult or impossible to achieve with conventional methods [41] [42]. For researchers and drug development professionals, this technology streamlines the path from conceptual design to functional prototype, accelerating development cycles for point-of-care diagnostics, wearable monitors, and integrated lab-on-a-chip systems [38] [43].
3D Printing Technologies for Potentiometric Sensors
Several 3D printing technologies are employed in sensor fabrication, each with distinct mechanisms, advantages, and suitable applications. The most prevalent techniques are Fused Filament Fabrication (FFF) and stereolithography (SLA).
The table below summarizes the operating principles, common materials, and key characteristics of these prominent 3D printing techniques in the context of potentiometric sensor fabrication.
Table 1: Comparison of Primary 3D Printing Techniques Used in Potentiometric Sensor Fabrication
| Printing Technique | Operating Principle | Common Materials | Key Advantages | Key Limitations/Challenges |
|---|---|---|---|---|
| Fused Filament Fabrication (FFF) | Thermoplastic filament is heated, extruded through a nozzle, and deposited layer-by-layer [40] [44]. | Polylactic acid (PLA), PLA-carbon black (PLA-CB), Polyethylene terephthalate glycol (PETg), Acrylonitrile butadiene styrene (ABS) [39] [44]. | Low-cost equipment and materials; Multi-material printing capability; High mechanical strength [39] [40]. | Lower resolution compared to SLA; Potential for voids in conductive traces; May require post-processing [44]. |
| Stereolithography (SLA) | A UV laser selectively cures liquid photopolymer resin in a vat, layer-by-layer [40] [43]. | Photocurable resins (e.g., methacrylate-based) [43]. | High resolution and smooth surface finish; Excellent for microfluidics and fine features [40] [43]. | Limited material choices; Resins often lack conductivity; Typically requires post-printing curing. |
Detailed Experimental Protocols for Fabricating 3D-Printed Potentiometric Sensors
This section provides detailed methodologies for fabricating key components of a potentiometric cell using 3D printing, from the solid-contact electrode to the integrated sensor.
Protocol 1: Fabrication of a Solid-Contact Ion-Selective Electrode via Multimaterial FFF
This protocol, adapted from a 2024 study, describes an automated method for producing highly reproducible solid-contact ion-selective electrodes (SC-ISEs) using a multimaterial FFF approach [39].
- Objective: To fabricate a potassium-selective electrode (K+-ISE) with a recessed well for precise membrane deposition, achieving high electrode-to-electrode reproducibility.
- Materials & Reagents:
- 3D Printer: FFF 3D printer (e.g., Prusa) with a single nozzle.
- Filaments: Conductive polylactic acid-carbon black (PLA-CB) composite filament; Insulating polyethylene terephthalate glycol (PETg) filament.
- Ion-Selective Membrane (ISM) Cocktail: 1% Valinomycin (ionophore), 0.5% Sodium tetrakis[3,5-bis(trifluoromethyl)phenyl] borate (NaTFPB, ion exchanger), 65% Dioctyl sebacate (DOS, plasticizer), 32.5% Polyvinyl chloride (PVC, polymer matrix). Dissolve 100 mg of this mixture in 1 mL Tetrahydrofuran (THF) [39].
- Step-by-Step Procedure:
- CAD Design: Design the electrode using software (e.g., Fusion 360). The model should include a base insulating layer (PETg), a groove for the conductive element, the conductive electrode itself (PLA-CB), and a top insulating layer (PETg) with a hole to create a well for the ISM [39].
- Slicing and G-code Modification: Export the design as an STL file and slice it using appropriate software (e.g., PrusaSlicer). Key printing parameters include: 100% infill, extrusion multiplier of 1.1 (to prevent voids), nozzle temperature of 240°C for PLA-CB, and bed temperature of 90°C. Modify the G-code to enable filament swapping at the designated layers for multimaterial printing [39].
- 3D Printing: Execute the print job. The resulting electrode will have a layered structure: a PETg base, an embedded PLA-CB circular working electrode (4 mm diameter), and a top PETg layer with a 5-mm-diameter opening, forming a well [39].
- Membrane Deposition: Pipette 5 aliquots of 10 µL of the ISM cocktail into the well of the printed electrode. Allow each layer to dry for 20 minutes at room temperature before adding the next.
- Final Curing and Conditioning: After the final aliquot, let the membrane dry completely for 1 hour. Condition the finished 3D-printed SC-ISE overnight in a 10 mM potassium chloride (KCl) solution prior to potentiometric measurements [39].
The workflow for this automated fabrication process is illustrated below.
Protocol 2: Development and 3D Printing of a Biodegradable PLA-Based Bulk Membrane
This protocol outlines an innovative approach for creating ion-selective membranes using biodegradable polylactic acid (PLA) as the polymer matrix, replacing conventional PVC [44].
- Objective: To produce a green, ionic additive-free, bulk ion-selective membrane for cation detection (e.g., Hg2+) using filament extrusion and 3D printing.
- Materials & Reagents:
- Polymer Matrix: Ingeo Biopolymer 3100HP polylactic acid (PLA) pellets.
- Plasticizers: Polyethylene glycol derivatives (e.g., PEG-400, PEG-1500, PEG-monolaurate).
- Ionophore: A synthesized lipophilic acridono-18-crown-6 ether.
- Equipment: Twin-screw extruder (e.g., Labtech LTE), Fused Deposition Modeling (FDM) 3D printer, drying oven.
- Step-by-Step Procedure:
- Material Pre-treatment: Dry the PLA pellets at 80°C for 24 hours in a drying oven to remove moisture.
- Filament Extrusion: Use a twin-screw extruder to plasticize the PLA pellets with the selected PEG derivative and incorporate the ionophore simultaneously. The extrusion process produces a customized, ionophore-containing filament suitable for FDM printing.
- 3D Modeling: Design the membrane geometry using 3D modeling software (e.g., CATIA).
- Membrane Printing: Utilize the FDM printing process with the custom-extruded filament to fabricate the potentiometrically active membrane structures. Optimize printing parameters (e.g., nozzle temperature, bed temperature, print speed) for the specific filament composition.
- Sensor Assembly and Testing: Integrate the 3D-printed membrane into an electrode body (e.g., Philips IS-561). For potentiometric detection of Hg2+, use a 10-3 mol L-1 mercury(II) acetate solution as the inner filling solution during calibration [44].
Performance and Applications of 3D-Printed Potentiometric Sensors
Quantitative Performance Metrics
3D-printed potentiometric sensors have demonstrated performance comparable to, and in some aspects superior to, their traditionally manufactured counterparts. The following table summarizes key analytical performance data reported for various 3D-printed sensors.
Table 2: Performance Metrics of Selected 3D-Printed Potentiometric Sensors
| Target Analyte | 3D Printing Technique | Sensitivity (Slope) | Linear Range | Remarks / Comparative Advantage | Source |
|---|---|---|---|---|---|
| Potassium (K+) | Multimaterial FFF | Near-Nernstian (~59 mV/decade) | Not Specified | Electrode-to-electrode reproducibility (E0 RSD ± 3 mV); Cost: ~€0.32/sensor | [39] |
| Magnesium (Mg2+) | SLA (Membrane) | 27.5 mV/decade | 39 μM to 10 mM | Low drift (13 μV/h over 10 h); High resilience to biofouling; Integrated into microfluidics | [43] |
| Mercury (Hg2+) | FDM (PLA Membrane) | Near-Nernstian | Not Specified | Uses biodegradable, ionic additive-free PLA-based membrane | [44] |
Key Application Scenarios
The unique advantages of 3D printing have enabled the development of advanced sensor configurations for diverse applications:
- Wearable Health Monitoring: The flexibility and customizability of 3D printing allow for the fabrication of miniaturized sensors that can be integrated into patches, bands, or textiles for continuous, non-invasive monitoring of electrolytes in sweat or other biofluids [24] [38] [14].
- Integrated Microfluidic Lab-on-a-Chip Systems: 3D printing excels at creating monolithic devices that incorporate microfluidic channels and sensors into a single platform. An exemplar is the integration of a Mg2+ sensor into a 3D-printed microfluidic device for quantifying ions in low-volume samples of sweat, saliva, and urine, which is ideal for point-of-care diagnostics [43].
- Environmental Monitoring: The ability to produce robust, low-cost, and portable sensors makes 3D printing suitable for decentralized environmental analysis. This has been demonstrated by sensors developed for detecting pollutants like mercury in water [44] and for creating submersible probes for water quality analysis [39].
The Scientist's Toolkit: Essential Research Reagents and Materials
Successful fabrication of 3D-printed potentiometric sensors relies on a specific set of functional materials.
Table 3: Essential Materials for 3D-Printed Potentiometric Sensor Development
| Material / Reagent | Function in Sensor Fabrication | Specific Examples |
|---|---|---|
| Conductive Thermoplastic Composites | Serves as the electrode material and solid-contact ion-to-electron transducer [39] [44]. | PLA-Carbon Black (PLA-CB) [39] |
| Insulating Thermoplastics | Forms the sensor body, housing, and insulation layers to define and protect the conductive elements [39] [40]. | Polyethylene terephthalate glycol (PETg) [39] |
| Photocurable Resins | Used in SLA printing to create high-resolution sensor components, membranes, and microfluidic architectures [43]. | Methacrylate-based resins [43] |
| Ionophores | The key sensing component that selectively recognizes and binds the target ion within the membrane [24] [44]. | Valinomycin (for K+) [39], Acridono-18-crown-6 ether (for Hg2+) [44] |
| Membrane Matrix Polymers | Forms the bulk of the ion-selective membrane, hosting the ionophore and other components. | Polyvinyl Chloride (PVC) [39], Biodegradable Polylactic Acid (PLA) [44] |
| Plasticizers | Imparts flexibility and modulates the viscosity of the polymer membrane, influencing ion mobility and sensor response time [44]. | Dioctyl sebacate (DOS) [39], Polyethylene Glycol (PEG) derivatives [44] |
Challenges and Future Directions
Despite significant progress, several challenges remain in the widespread adoption of 3D-printed potentiometric sensors. Key issues include the limited availability of multi-material printing systems capable of simultaneously processing all required functional materials, and the long-term stability and chemical resistance of some printed materials in real-world conditions [24] [42]. Furthermore, performance parameters like hysteresis, drift, and long-term stability are often underreported, making it difficult to fully benchmark new sensors against the state of the art [41].
Future research is directed towards:
- Material Development: Creating new printable materials with enhanced electrical, chemical, and mechanical properties, including more stable conductive composites and specialized sensing polymers [24] [42].
- Standardization: Establishing standardized reporting metrics and performance comparison frameworks to accelerate progress and facilitate the replication of results across different labs [41].
- Hybrid Manufacturing: Combining 3D printing with other fabrication techniques to leverage the strengths of each method, thereby overcoming current limitations in resolution, material compatibility, and integration of external electronics [40] [42].
- Full Integration: Advancing towards the vision of a fully printed, calibration-free potentiometric sensor that includes the reference electrode, which remains a significant challenge [14].
The ongoing innovation in 3D printing technologies and materials science is poised to further solidify the role of additive manufacturing in developing the next generation of sophisticated, affordable, and decentralized analytical devices for healthcare, environmental monitoring, and industrial process control [41] [24] [43].
The integration of potentiometric cell technology into point-of-care (POC) diagnostics represents a paradigm shift in clinical analysis, enabling rapid, decentralized testing from ion detection to therapeutic drug monitoring (TDM). Potentiometry, which measures the potential difference between two electrodes under conditions of zero current, provides a powerful and versatile method for the sensitive and selective measurement of a variety of analytes [22]. This technical guide explores the core principles, emerging trends, and practical applications of potentiometric sensors in clinical settings, framed within the broader context of potentiometric cell setup and components research. The convergence of novel materials, manufacturing technologies like 3D printing, and innovative designs such as wearable and thread-based sensors is revolutionizing how clinicians monitor electrolytes, biomarkers, and drug concentrations at the point-of-care [22] [45] [24].
Core Principles of Potentiometric Sensing
Potentiometric sensors are electrochemical devices that respond to the activity of specific ions in a solution by generating a measurable potential, recorded between a reference electrode and a working electrode using a high-impedance voltmeter [24]. The potential developed at the working electrode arises from the selective interaction between the ion-selective membrane and the target ions in solution, fundamentally described by the Nernst equation:
[E = E_0 + \frac{RT}{nF}\ln a]
Where (E) is the measured potential, (E_0) is the standard potential, (R) is the universal gas constant, (T) is temperature, (n) is the ion charge, (F) is the Faraday constant, and (a) is the ion activity [24].
Ion-selective electrodes (ISEs) operate through a membrane that selectively interacts with a specific ion, generating a potential that varies according to the ion's activity in the test solution. These membranes can be glass (commonly used in pH sensors), crystalline (e.g., LaF₃ for fluoride detection), or polymeric liquid membranes based on polyvinyl chloride (PVC) doped with ionophores [24]. The primary classification of ISEs depends on the membrane interface configuration:
- Liquid-Contact ISEs (LC-ISEs): Consist of an ion-selective membrane, internal electrolyte solution, and internal reference electrode [22]. While providing excellent performance, they suffer from mechanical instability, potential leakage or evaporation of the internal solution, and challenges in miniaturization [22].
- Solid-Contact ISEs (SC-ISEs): Replace the inner-filling solution with a solid contact layer that acts as an ion-to-electron transducer [22]. This configuration offers significant advantages for POC applications, including ease of miniaturization, portability, stability, and enhanced detection in complex matrices [22].
The critical performance parameters for potentiometric sensors include sensitivity (slope of the calibration curve), detection limit, linear range, response time, selectivity against interfering species, and long-term stability [24].
Figure 1: Working Principle of a Solid-Contact Ion-Selective Electrode
Emerging Trends in Point-of-Care Potentiometric Sensors
Advanced Manufacturing and Materials
3D Printing: The integration of 3D printing into potentiometric sensor fabrication has revolutionized design and production capabilities. Techniques like fused deposition modeling (FDM) and stereolithography (SLA) enable customizable, low-cost, and rapid prototyping of sensor components, including electrode housings, solid contacts, reference electrodes, and microfluidic systems [24]. This approach addresses key challenges in traditional sensor manufacturing by enabling smaller size, flexible shapes, multi-material integration, and rapid iteration of working prototypes [24].
Nanocomposite Transducers: Advanced nanomaterials are being increasingly employed as transducers in SC-ISEs to enhance sensor performance. Nanomaterials provide superior signal stability due to their ultra-high surface areas and unique electronic properties [22]. Recent innovations include nanocomposites such as MoS₂ nanoflowers filled with Fe₃O₄ to prevent structural collapse and increase capacitance, and tubular gold nanoparticles with tetrathiafulvalene (Au-TFF) for potassium ion detection [22].
Novel Platform Designs
Wearable Sensors: Wearable potentiometric sensors represent one of the most promising applications for continuous monitoring of biomarkers, electrolytes, and pharmaceuticals in biological fluids [22]. These devices typically take the form of watches, bands, or patches, making them ideal for non-invasive, continuous health monitoring [24].
Thread-Based Sensors: Thread-based potentiometric ion sensing offers a revolutionary approach to POC testing. Researchers have developed sensors for detecting sodium, potassium, chloride, and calcium ions using thread as a substrate and heat-shrinkable tubing as low-cost materials [45]. These sensors perform comparably to commercial electrodes but require much smaller sample volumes and are suitable for point-of-care applications at a fraction of the cost [45].
Paper-Based Devices: Paper-based sensors provide cost-effective and versatile platforms for in-field POC analysis, permitting rapid determination of various analytes [22]. Their simplicity, portability, and low cost make them particularly valuable for resource-limited settings.
Integration with Microfluidics and AI
Microfluidic Systems: Recent research has demonstrated integrated microfluidic systems for POC ion detection. One innovative approach developed a microfluidic finger-pump chip and micro-spectrometer platform to measure sodium ion concentration in human serum using only 10 μL of sample [46]. The entire detection process is completed in just 3 minutes, offering significant advantages over traditional reporting turnaround times of several hours in medical institutions [46].
Artificial Intelligence and Machine Learning: The integration of AI and ML into POC testing platforms enhances accuracy, sensitivity, and efficiency [47]. ML algorithms can process complex datasets to identify patterns or subtle changes in biomarker profiles, improving sensitivity and accuracy despite biological sample variability [47]. These technologies also enhance multiplexing capabilities through parallel analysis of multiple sensing channels and enable automated result interpretation, reducing reliance on trained personnel [47].
Ion Detection in Clinical Diagnostics
Electrolyte monitoring represents a fundamental application of potentiometric sensors in clinical settings. Sodium ions (Na⁺), accounting for approximately 90% of total cations in human blood serum, are highly representative and clinically significant in medical diagnostics [46]. In normal healthy adults, serum Na⁺ concentration ranges from 135 to 145 mM. Abnormal levels can indicate serious conditions: concentrations below 135 mM indicate hyponatremia with symptoms including nausea, vomiting, muscle cramps, and seizures; concentrations exceeding 145 mM indicate hypernatremia, leading to thirst, fatigue, muscle weakness, and central nervous system abnormalities [46].
Electrolyte imbalances are particularly common in hospitalized patients and are associated with higher mortality and morbidity. According to one study, 15% of subjects suffered from at least one electrolyte imbalance, with hyponatremia (7.7%) and hypernatremia (3.4%) being the most prevalent [22]. Even slight abnormalities can result in significant functional variations, including neurological problems such as seizures and cardiac arrhythmias [22].
Table 1: Clinically Significant Ions Detectable via Potentiometric Sensors
| Ion | Normal Range | Clinical Significance | Related Conditions |
|---|---|---|---|
| Sodium (Na⁺) | 135-145 mM | Maintains extracellular fluid osmotic balance, nerve conduction | Hyponatremia, hypernatremia, chronic kidney disease [46] |
| Potassium (K⁺) | 3.5-5.0 mM | Regulates muscle contraction, heart function | Hypokalemia, hyperkalemia, cardiac arrhythmias [22] |
| Calcium (Ca²⁺) | 2.2-2.6 mM | Bone formation, blood clotting, nerve impulse transmission | Hypocalcemia, hypercalcemia, seizures [22] |
| Chloride (Cl⁻) | 98-106 mM | Maintains fluid balance, acid-base balance | Metabolic acidosis, alkalosis [46] |
Therapeutic Drug Monitoring (TDM) Applications
Principles and Importance of TDM
Therapeutic drug monitoring is the clinical practice of measuring specific drugs at designated intervals to maintain a constant concentration in a patient's bloodstream, thereby optimizing individual dosage regimens [48]. TDM is particularly crucial for drugs with narrow therapeutic ranges, marked pharmacokinetic variability, medications for which target concentrations are difficult to monitor, and drugs known to cause both therapeutic and adverse effects [48].
The process of TDM is predicated on the assumption that a definable relationship exists between dose and plasma or blood drug concentration, and between concentration and therapeutic effects [48]. For a limited number of drugs with a better relationship between plasma concentration and response than between dose and response, measuring plasma concentrations has become a valuable surrogate index of drug exposure in the body [48].
Table 2: Common Drugs Monitored Through Therapeutic Drug Monitoring
| Drug Category | Examples | Therapeutic Range | Clinical Context |
|---|---|---|---|
| Antibiotics | Amikacin, gentamycin, vancomycin | Varies by drug | Prevent toxicity while maintaining efficacy [49] |
| Anti-seizure medicines | Phenobarbital, phenytoin | Varies by drug | Optimize seizure control while minimizing side effects [49] |
| Heart medicines | Amiodarone, digoxin, lidocaine | Varies by drug | Manage arrhythmias with narrow therapeutic index [49] |
| Immunosuppressants | Cyclosporine, tacrolimus | Varies by drug | Prevent organ transplant rejection while reducing toxicity [49] [50] |
| Mood stabilizers | Lithium | 0.6-1.2 mEq/L | Treat bipolar disorder with careful toxicity monitoring [49] |
TDM in Clinical Practice
TDM begins when a drug is first prescribed and involves determining an initial dosage regimen appropriate for the clinical condition and patient characteristics such as age, weight, organ function, and concomitant drug therapy [48]. When interpreting concentration measurements, factors that need consideration include the sampling time in relation to drug dose, dosage history, patient response, and desired medicinal targets [48].
The indications for drug monitoring have widened to include efficacy assessment, compliance monitoring, drug-drug interaction detection, toxicity avoidance, and therapy cessation monitoring [48]. For example, measuring plasma digoxin concentrations is particularly helpful in digitalis-treated patients with borderline renal function, aged subjects, and patients with rapid atrial fibrillation who require higher digitalis doses for heart rate control [48].
Experimental Protocols and Methodologies
Microfluidic Sodium Ion Detection System
A recently developed microfluidic system for detecting sodium ions in human serum provides an excellent example of modern POC potentiometric applications [46]. The experimental protocol involves the following steps:
Device Fabrication:
- Construct a finger-pump microchip comprising a PCR plate sealing film, an upper PET layer (0.1 mm thickness), two PMMA substrates (1.5 mm thick) containing finger pumps, reagent chamber, sample chamber, serpentine channel, detection chamber, and a check valve, sealed by a lower PET layer [46].
- Create chambers and microchannels in the PMMA chips using a CO₂ laser system with microchannel widths of 180 μm and depths of 90 μm [46].
- Bond PET and PMMA layers through oxygen plasma treatment and assemble PMMA layers using thermal compression bonding [46].
Reagent Preparation:
- Prepare 0.1 M Tris-HCl buffer at pH 7.4 by adding 12.1 g of Tris to 800 mL deionized water, adjusting pH with concentrated HCl, and bringing final volume to 1 L [46].
- Prepare 2.14 M NaCl stock solution by dissolving 5 g of NaCl in 40 mL of Tris-HCl buffer, then serially dilute to produce NaCl standard samples with Na⁺ concentrations ranging from 1 to 200 mM [46].
- For optode reagents: dissolve 10 mg of chromoionophore I (ETH5294) in 300 μL of THF (19 mM final concentration); dissolve 50 mg of potassium tetrakis [3,5-bis(trifluoromethyl)phenyl]borate (KTFPB) in 1000 μL of THF (39.5 mM final concentration); dissolve 100 mg of sodium ionophore VI in 1000 μL of THF (150.9 mM final concentration) [46].
Detection Protocol:
- Preload 100 μL of reagent solution into the reagent chamber and seal with a PET strip [46].
- Introduce 10 μL of serum sample into the sample chamber and seal with a PCR plate sealing film [46].
- Activate finger pump 1 (FP1) to drive reagent into the sample/mixing chamber to initiate Na⁺ ion exchange [46].
- Activate finger pump 2 (FP2) to drive the reaction solution through the serpentine channel to complete mixing and reaction [46].
- Continue finger pump actuation until reaction solution flows into the waste chamber, indicating the detection chamber is filled [46].
- Insert the chip into the detection system containing a micro-spectrometer and analyze the reaction complex at wavelengths of 555 and 666 nm [46].
- Calculate Na⁺ concentration inversely from the measured A₅₅₅/A₆₆₆ absorbance ratio using specialized software [46].
This system demonstrated a strong correlation (R² = 0.9885) with conventional indirect ion-selective electrode methods and achieved an average recovery rate of 99.4% when testing 60 serum samples from chronic kidney disease patients [46].
Figure 2: Microfluidic Sodium Ion Detection Workflow
Thread-Based Ion-Selective Electrode Fabrication
The protocol for fabricating thread-based potentiometric ion sensors includes:
Sensor Construction:
- Select appropriate thread substrate based on wicking properties and chemical compatibility [45].
- Functionalize thread with ion-selective membranes specific to target ions (sodium, potassium, chloride, or calcium) [45].
- Assemble reference electrode using heat-shrinkable tubing to create stable reference junctions [45].
- Bundle multiple ion-selective threads together for multiplexed sensing capabilities [45].
Measurement Procedure:
- Apply small sample volumes (200 μL) directly to the thread sensor array [45].
- Allow sufficient time for capillary action to transport sample to sensing regions [45].
- Measure potential differences between ion-selective and reference electrodes [45].
- Interpret results within 10 minutes of sample application [45].
These thread-based sensors enable multiplexed detection of blood electrolytes without requiring separate devices for each ion, providing results in less than 10 minutes compared to several hours or days with central laboratory testing [45].
The Scientist's Toolkit: Essential Research Reagents and Materials
Table 3: Key Research Reagent Solutions for Potentiometric Sensor Development
| Reagent/Material | Function | Application Examples |
|---|---|---|
| Chromoionophore I (ETH5294) | Ionophore that changes optical properties upon ion binding | Sodium ion detection in microfluidic optode systems [46] |
| Sodium ionophore VI | Selective recognition element for sodium ions | Sodium-selective electrodes in clinical diagnostics [46] |
| Potassium tetrakis [3,5-bis(trifluoromethyl)phenyl]borate (KTFPB) | Lipophilic additive for improved ion-exchange kinetics | Enhancing response characteristics in ion-selective optodes [46] |
| Poly(3-octylthiophene) | Conducting polymer for ion-to-electron transduction | Solid-contact layer in SC-ISEs [22] |
| Poly(3,4-ethylenedioxythiophene) | Conducting polymer with high stability | Transducer material for wearable potentiometric sensors [22] |
| Valinomycin | Potassium-selective ionophore | Potassium-selective electrodes for electrolyte monitoring [24] |
| Colloid-imprinted mesoporous carbon | High-surface-area carbon material | Capacitive transducer in solid-contact ISEs [22] |
| MXenes | Two-dimensional conductive nanomaterials | Enhanced transduction in nanocomposite-based sensors [22] |
The field of point-of-care potentiometric sensors has evolved dramatically from basic ion detection to sophisticated therapeutic drug monitoring applications. The integration of advanced materials, innovative manufacturing techniques like 3D printing, and novel platform designs including wearable, thread-based, and microfluidic sensors has significantly expanded the capabilities of clinical analysis outside traditional laboratory settings. These technological advancements, coupled with the integration of artificial intelligence and machine learning for data analysis, are paving the way for more personalized, efficient, and accessible healthcare. As research continues to address challenges related to sensor stability, reproducibility, and integration into clinical workflows, potentiometric point-of-care systems are poised to play an increasingly vital role in both diagnostic testing and therapeutic management across diverse healthcare settings.
Organic Electrochemical Transistors (OECTs) have emerged as a promising platform for bio-sensing, offering significant advantages such as intrinsic signal amplification, material flexibility, and facile fabrication. However, their use in potentiometric sensing—a technique that measures open circuit potential (OCP) shifts at an electrode interface—has been fundamentally limited. Conventional OECT configurations require direct voltage or current application to the gate electrode, preventing the system from reaching the thermodynamic equilibrium essential for accurate and stable potentiometric measurements [51].
The novel potentiometric-OECT (pOECT) configuration overcomes this limitation. This innovative design re-wires the transistor architecture to maintain the sensing electrode under true open circuit potential conditions, thereby enabling high-accuracy potentiometric sensing while retaining the benefits of OECT technology, such as miniaturization potential and high signal-to-noise ratio [51]. This guide details the operational principles, experimental protocols, and key performance data of pOECTs, providing researchers and drug development professionals with the technical foundation needed to implement this advanced sensing platform.
Core Principles and Configuration of pOECTs
Limitations of Conventional OECTs for Potentiometry
In a standard OECT configuration used for sensing, the gate (G) electrode functions as the sensing interface. A gate-source voltage (V~GS~) is applied, modulating the current between the drain (D) and source (S) terminals. This setup creates a critical conflict:
- Potentiometric Requirement: True potentiometric sensing must occur at zero current flow or under open circuit potential (OCP) to allow the sensing interface to reach thermodynamic equilibrium with the analyte [51].
- Conventional OECT Operation: The sensing gate is actively biased, resulting in a continuous gate current (I~GS~). This Faradaic current prevents the establishment of OCP, leading to unreliable readings, potential damage to delicate biorecognition elements (e.g., enzymes, antibodies), and triggering of parasitic electrochemical reactions [51] [52].
The pOECT Architecture: A Paradigm Shift
The pOECT configuration introduces a fundamental architectural change by functionally separating the gate into two distinct electrodes [51]:
- Sensing Gate (G~S~): This electrode is chemically modified to be sensitive to the target analyte. It is connected as a reference electrode (RE) within the circuit and is maintained under open circuit conditions, with negligible current flow. Its electrochemical potential is governed solely by its interaction with the analyte.
- Gating Gate (G~G~): This electrode acts as a counter electrode (CE) and is responsible for actively applying the voltage needed to modulate the channel's conductivity.
This separation, shown in the diagram below, ensures that the critical sensing interface (G~S~) remains at thermodynamic equilibrium, while the G~G~ handles the current-carrying duties. The pOECT is, therefore, a gate-referenced OECT where the sensing electrode functions as a stable reference point [51].
Diagram: The pOECT architecture separates the gating and sensing functions. The Sensing Gate (G~S~) detects the analyte without current flow, while the Gating Gate (G~G~) modulates the channel conductivity. This ensures potentiometric measurement conditions.
Quantitative Performance and Comparative Analysis
The pOECT configuration demonstrates superior performance compared to both conventional two-electrode potentiometry and traditional OECTs. The tables below summarize key quantitative metrics.
Table 1: Performance Comparison of Different Potentiometric Sensing Configurations
| Performance Metric | 2-Electrode Setup | Conventional OECT | pOECT Configuration |
|---|---|---|---|
| Sensing Principle | OCP Measurement | Non-Equilibrium Gating | OCP-Compliant Gating |
| Gate Current (I~GS~) | Zero (Theoretical) | Present (Faradaic) | Minimized (Near-Zero) |
| Signal Amplification | No | Yes (Intrinsic) | Yes (Intrinsic) |
| Reference Electrode | Required | Not Required | Not Required |
| Stability / Accuracy | High (when RE is stable) | Prone to Drift | High |
| Miniaturization Potential | Limited by RE | High | High |
| Biocompatibility | Limited (RE materials) | High | High [51] [52] |
Table 2: Exemplary pOECT Sensor Performance for Different Analytes
| Target Analyte | Sensing Gate (G~S~) Interface | Sensitivity | Key Advantage Demonstrated |
|---|---|---|---|
| Sulfide Anion (S²⁻) | Ag/Ag~n~S | 0.52 V/decade | Surpasses Nernst limit (0.029 V/decade) [52] |
| Protons (H⁺) | Ion-selective Membrane (pH) | Higher than 2-electrode setup | Superior response and accuracy [51] |
| Sodium (Na⁺) | Ion-selective Membrane | Higher than 2-electrode setup | Confirmed OCP conditions [51] |
| Barrier Tissue Integrity | Cell-based Gate | N/A | Multi-parameter monitoring without device optimization [51] |
Experimental Protocols for pOECT Implementation
Fabrication of the pOECT Device
- Substrate Preparation: Clean a flexible (e.g., PET) or rigid (e.g., glass) substrate using standard protocols (oxygen plasma, solvents).
- Channel Patterning: Pattern the OMIEC channel (e.g., PEDOT:PSS) via spin-coating, inkjet printing, or photolithography. PEDOT:PSS is a common choice due to its high transconductance and stability in aqueous environments [52].
- Electrode Deposition: Define the Drain (D) and Source (S) contacts (typically Au or Pt) via thermal evaporation or sputtering, followed by lift-off.
- Gate Electrode Fabrication: Fabricate the two separate gate electrodes.
- The Gating Gate (G~G~) can be a simple, high-surface-area conductor like a Pt coil or a bare Au electrode [51].
- The Sensing Gate (G~S~) must be functionalized for the target analyte (see Section 4.2).
- Encapsulation and Integration: Encapsulate the entire device, leaving only the OMIEC channel and the gate electrodes exposed to the electrolyte.
Functionalization of the Sensing Gate (G~S~)
The protocol for G~S~ modification depends on the target analyte.
- For Ion Sensing (e.g., K⁺, Na⁺, Cl⁻): Apply an ion-selective membrane (ISM). A typical cocktail includes an ionophore (1-2% w/w), an ion exchanger (~1% w/w), a plasticizer (~65% w/w), and a polymer matrix like PVC (~33% w/w). For biocompatibility, consider covalently tethering these components or using green solvents and alternative polymers [53].
- For Biosensing (e.g., Glucose, Antibodies): Immobilize a biorecognition element (enzyme, antibody, aptamer) onto the G~S~ surface. This can be achieved via covalent chemistry (e.g., EDC-NHS coupling to a self-assembled monolayer) or physical adsorption.
Electrical Characterization and Sensing Measurement
- Setup: Immerse the pOECT in the sample solution containing the gate electrodes (G~S~ and G~G~) and the OMIEC channel.
- Biasing: Apply a fixed drain-source voltage (V~DS~). For PEDOT:PSS-based OECTs, this is typically a small positive voltage (e.g., +0.2 to +0.5 V).
- Measurement: The system reaches an equilibrium state where the channel's Fermi level aligns with the potential of the G~S~ electrode, which is controlled by analyte concentration [52]. Monitor the drain current (I~D~) over time.
- Calibration: Relate the steady-state I~D~ or its change (ΔI~D~) to the concentration of the target analyte to create a calibration curve.
The following workflow diagram illustrates the experimental journey from device fabrication to data analysis.
Diagram: The key stages in developing and utilizing a pOECT sensor, from substrate preparation to final data analysis.
The Scientist's Toolkit: Essential Research Reagents and Materials
Successful implementation of pOECTs relies on a specific set of materials and reagents, each serving a critical function.
Table 3: Essential Materials and Reagents for pOECT Research
| Category | Item / Reagent | Function / Role | Notes for Biocompatibility |
|---|---|---|---|
| Channel Material | PEDOT:PSS | Organic Mixed Ionic/Electronic Conductor (OMIEC); transduces chemical signal into electrical current. | Considered highly biocompatible; suitable for bio-interfaces [52]. |
| Electrode Materials | Gold (Au), Platinum (Pt) | Form Drain, Source, and Gating Gate (G~G~) contacts; provide stable, inert conduction. | Biocompatible; Pt is often used for G~G~ [51]. |
| Sensing Gate Materials | Silver/Silver Halide (Ag/AgX) | Forms a stable, reversible interface for anion detection (Cl⁻, Br⁻, I⁻, S²⁻) [52]. | Leaching of Ag ions can be a concern [53]. |
| Ion-Selective Membranes | Provides selectivity for specific ions (K⁺, Na⁺, H⁺, Ca²⁺). | Use covalently bonded components and biocompatible plasticizers (e.g., DOS) to mitigate toxicity [53]. | |
| Membrane Components | Ionophores (e.g., Valinomycin) | Selective ion recognition element within the membrane. | Assess cytotoxicity; valinomycin is highly toxic [53]. |
| Plasticizers (e.g., DOS, oNPOE) | Provides fluidity and mobility to membrane components. | Can leach into biological samples; alternatives like PEG-based polymers are being explored [53]. | |
| Polymers & Solvents | Poly(vinyl Chloride) (PVC) | Classic polymer matrix for ion-selective membranes. | Leaching of plasticizer and monomers is a concern. Consider alternatives like polyurethanes or silicones [53]. |
| Tetrahydrofuran (THF) | Solvent for casting polymeric membranes. | Toxic; investigate "green" solvent alternatives where possible [53]. |
Solving Common Challenges and Enhancing Sensor Performance
Potentiometry, a well-established electrochemical technique, measures the potential difference between two electrodes under static conditions where negligible current flows, providing a direct readout of ion activity [2]. However, a persistent challenge in this field is potential drift, the gradual and often unpredictable change in a sensor's measured potential over time, which compromises measurement accuracy and long-term reliability. For researchers and scientists in drug development, this instability can introduce significant variables into pharmaceutical analysis, therapeutic drug monitoring, and continuous biomarker sensing.
This technical guide examines the fundamental causes of potential drift within the context of modern potentiometric cell components and presents validated, cutting-edge strategies to mitigate these instabilities. The stability of a potentiometric sensor is not governed by a single component but by the complex interplay between the ion-selective membrane (ISM), the solid-contact transducer layer, the reference electrode, and the interfaces between them. By addressing each of these domains systematically—from the leaching of membrane components to the instability of reference systems—this whitepater provides a comprehensive framework for achieving superior signal stability in both research and applied clinical settings.
Potential drift originates from multiple physical and chemical processes within the electrochemical cell. A primary source is the uncontrolled flux of membrane components from the ion-selective membrane into the sample solution. Classical polymeric ISMs, often based on poly(vinyl chloride) (PVC), contain critical but potentially problematic constituents: ionophores for selective recognition, ionic sites (ion-exchangers) to maintain electroneutrality, and plasticizers that provide appropriate membrane fluidity [53]. These components are physically entrapped rather than covalently anchored, making them susceptible to leaching, particularly during long-term contact with biological fluids in wearable or implantable sensors [53]. Even minimal leaching changes the membrane's compositional equilibrium, directly altering its potential-response characteristics.
Another critical failure mechanism is the formation of a water layer between the ion-selective membrane and the underlying solid-contact transducer. This occurs when water molecules penetrate the ISM, forming a thin aqueous film that becomes a secondary, ill-defined electrochemical environment. This water layer destabilizes the potential by creating a floating system sensitive to changes in dissolved CO2, pH, and interfering ions [12]. The problem is particularly prevalent in solid-contact ion-selective electrodes (SC-ISEs), where it represents "a primary cause of sensor failure" due to the resulting potential instability and inadequate adhesion [12].
Reference electrode instability further compounds drift challenges. The conventional silver/silver chloride (Ag/AgCl) reference electrode, while stable and simple, often relies on screen-printed inks with high silver content (~60%) and polyvinylbutyral or other polymeric binders [53]. These materials can create unstable liquid junction potentials, especially in varying ionic strength solutions. Furthermore, junction potentials in cells with transference represent a "scientific enigma with serious practical consequences," directly impacting the accuracy and stability of potential measurements, including critical parameters like pH [54].
Table 1: Primary Sources of Potential Drift in Potentiometric Sensors
| Drift Source | Underlying Mechanism | Impact on Signal Stability |
|---|---|---|
| Component Leaching | Gradual partitioning of plasticizer, ionophore, and ion-exchanger from the ISM into the sample solution [53]. | Alters membrane composition and equilibrium, causing a continuous baseline drift. |
| Water Layer Formation | Water penetration through the ISM, forming a thin aqueous film at the membrane/transducer interface [12]. | Creates a floating potential sensitive to sample pH and CO₂, causing erratic drift. |
| Reference Electrode Instability | Unstable liquid junction potentials and changes in the reference electrode's internal fill solution or coating [53] [54]. | Introduces a variable offset to the measured cell potential. |
| Transducer Inefficiency | Inadequate capacitance or redox activity in the solid-contact layer, leading to poor ion-to-electron transduction [22] [12]. | Causes sensitivity to external electrical interference and oxygen, leading to noise and drift. |
Material & Design Strategies for Stable Solid-Contact ISEs
The transition from traditional liquid-contact to all-solid-state ion-selective electrodes (SC-ISEs) marks a significant advancement in combating drift, but it introduces new challenges that require careful material selection and design.
Advanced Solid-Contact Transducer Layers
The solid-contact (SC) layer, which replaces the inner filling solution, must efficiently transduce the ionic signal from the membrane into an electronic signal for the conducting support. Its properties are paramount for stability. Conducting polymers such as poly(3-octylthiophene-2,5-diyl) (POT), polypyrrole (PPy), and poly(3,4-ethylenedioxythiophene) (PEDOT) are exceptionally valuable as they offer mixed ionic and electronic conductivity, high capacitance, and can be electrodeposited onto conductors [22] [12].
Recent research demonstrates the superior performance of nanomaterial-based composites. For instance, one study developed a sensor using electropolymerized polypyrrole as a solid contact, which demonstrated "superior stability, with minimal, nearly parallel shifts between regression lines" even after one-month periods of dry storage [55]. Another approach involves creating nanocomposites, such as filling MoS₂ nanoflowers with Fe₃O₄, to prevent structural collapse and significantly increase the capacitance of the solid-contact layer, thereby enhancing potential stability [22]. High capacitance is critical as it buffers against potential changes arising from current flow, making the system more robust.
Covalent Stabilization of Membrane Components
A powerful strategy to eliminate the primary source of drift—component leaching—is to covalently anchor key constituents within the sensor architecture. This approach moves beyond simple physical mixing to create chemically integrated, stable systems.
A leading method involves covalently binding ion-recognition sites directly to the conducting polymer backbone. This integration merges the ion-to-electron transducer with the ionophore into a single macromolecule [12]. For example, a novel potentiometric sensor for detecting calcium ions was developed using an electrically conductive copolymer of 2,2′-bithiophene (BT) and 1,2-bis(o-aminophenoxy)ethane-N,N,N′,N′-tetraacetic acid (BAPTA), where the BAPTA moiety, with its high selectivity for calcium, was incorporated into the polymer matrix via electrochemical polymerization [12]. This design prevents the "gradual leak of the ionophore, which strongly limits the lifetime of such sensors" [12].
Another innovative technique involves covalently attaching the sensing membrane to both the inert polymer substrate and the conductive carbon contact. This method creates a robust, multi-point covalent architecture that secures the entire sensing ensemble, drastically improving adhesion and preventing delamination or water layer formation [53].
Biocompatible and Plasticizer-Free Membranes
For biomedical applications, leaching is doubly problematic as it causes drift and raises toxicity concerns. The development of plasticizer-free membranes is a major step forward. One research direction uses alternative polymer matrices like methyl methacrylate-co-decyl methacrylate, which are inherently more flexible and do not require added plasticizers [12]. Other approaches employ "green materials" and biopolymers to improve sensor safety and stability for in vivo use [53].
Table 2: Advanced Materials for Drift Mitigation in Solid-Contact ISEs
| Material/Strategy | Function | Key Benefit | Exemplary System |
|---|---|---|---|
| Polypyrrole (PPy) / PEDOT | Solid-Contact Transducer | High capacitance and mixed (ionic/electronic) conductivity for stable transduction [55] [12]. | Nitrate sensor with PPy solid contact [55]. |
| MoS₂/Fe₃O₄ Nanocomposite | Solid-Contact Transducer | Prevents structural collapse and increases layer capacitance [22]. | All-solid-state sensor system [22]. |
| Covalent Bonding of Ionophore | Ion Recognition / Transduction | Prevents leaching and integrates functions [12]. | BAPTA-BT copolymer for Ca²⁺ sensing [12]. |
| Methyl Methacrylate-co-Decyl Methacrylate | Polymer Matrix (Membrane) | Inherent flexibility eliminates need for leachable plasticizers [12]. | Plasticizer-free ion-selective sensors [12]. |
Experimental Protocols for Validation
Protocol: Long-Term Stability Testing via Regression Line Analysis
Objective: To quantitatively evaluate the long-term potential drift of a solid-contact ion-selective electrode over a period of weeks to months.
Materials:
- Potentiometric sensor under test (e.g., solid-contact ISE)
- High-impedance potentiometer/data acquisition system
- Standard calibration solutions (e.g., 10⁻⁵ M to 10⁻² M of analyte)
- Reference electrode (e.g., Ag/AgCl)
- Controlled storage environment
Methodology:
- Initial Calibration: On day one, immerse the sensor and reference electrode in a series of standard solutions. Record the stable potential at each concentration. Perform a linear regression of E (mV) vs. log a(ion) to obtain the initial slope and standard potential (E°).
- Aging and Storage: Store the sensor under defined conditions (e.g., dry, in a dilute solution, or in a simulated sample matrix) between measurements.
- Periodic Re-calibration: At regular intervals (e.g., daily, weekly, monthly), repeat the full calibration procedure as in step 1.
- Data Analysis: Plot all regression lines over the testing period. Analyze the shifts between them. A stable sensor will show minimal, nearly parallel shifts. Calculate the average daily drift in the standard potential (ΔE°/day) from the intercepts of these lines [55].
Interpretation: Superior stability is indicated by a low daily drift value and the sensor's ability to retain its calibration slope and reproducibility even after extended storage, as demonstrated by a nitrate sensor that performed well after three months [55].
Protocol: Validating Leakage Reduction via Selectivity Comparison
Objective: To demonstrate the effectiveness of covalent immobilization in reducing ionophore leaching by comparing the selectivity of ionophore-doped and ionophore-free sensors.
Materials:
- Two fabricated sensors: one with a covalently bound ionophore and one without (or with a mobile ionophore).
- Potentiometric setup.
- Primary ion solution (e.g., 10⁻² M Palonosetron HCl).
- Interfering ion solutions (e.g., degradation products, structurally related compounds, or common inorganic ions).
Methodology:
- Calibration: Calibrate both sensors with the primary ion to establish their baseline Nernstian slopes.
- Separate Solutions Method (SSM): Measure the potential of each sensor in separate solutions of the primary ion and the interfering ions, all at the same activity (e.g., 0.01 M).
- Calculate Selectivity Coefficients: Use the Nikolsky-Eisenmann equation to calculate the logarithm of the selectivity coefficient, log Kᵖᵒᵗ. A value more negative than -2 indicates high selectivity for the primary ion over the interferent.
- Comparison: Compare the selectivity coefficients of the two sensors. The sensor with the covalently bound ionophore is expected to show significantly better (more negative) selectivity coefficients [56].
Interpretation: Enhanced selectivity in the covalently modified sensor is direct evidence of a more stable and effective ion-recognition phase, as the ionophore cannot leach out and remains available for complexation. This was confirmed in a study where an ionophore-doped sensor showed about one order of magnitude better selectivity compared to an ionophore-free sensor [56].
Systematic Workflow for Drift Mitigation
The following workflow synthesizes the key strategies discussed into a logical, step-by-step framework for developing stable potentiometric sensors. This diagram guides the researcher from material selection through to final validation, emphasizing critical decision points for minimizing potential drift.
The Scientist's Toolkit: Essential Research Reagents & Materials
Table 3: Key Research Reagents and Materials for Stable Potentiometric Sensors
| Category | Specific Material | Function/Purpose | Research Context |
|---|---|---|---|
| Conducting Polymers | Polypyrrole (PPy) | Solid-contact transducer; provides high capacitance and stable potential [55]. | Electropolymerized on screen-printed electrodes for nitrate sensing [55]. |
| Poly(3-octylthiophene) (POT) | Solid-contact transducer; hydrophobic backbone reduces water layer risk [22]. | Used in all-solid-state sensor systems as a benchmark material [22]. | |
| Ionophores | Covalently bound BAPTA | Selective recognition of Ca²⁺ ions; covalent attachment prevents leaching [12]. | Incorporated into a polythiophene copolymer for inflammation sensing [12]. |
| Calix[8]arene | Host molecule for selective complexation; improves sensor selectivity and LOD [56]. | Doped into PVC membranes for palonosetron HCl determination [56]. | |
| Polymer Matrices | Poly(decyl methacrylate-co-methyl methacrylate) | Plasticizer-free membrane matrix; enhances biocompatibility and reduces leaching [12]. | Used as a base for novel ion-selective membranes. |
| Nanomaterials | MoS₂ Nanoflowers / Fe₃O₄ NPs | Nanocomposite solid-contact; increases capacitance and structural stability [22]. | Dispersed in solid-contact layers to enhance performance. |
Achieving long-term signal stability in potentiometric sensors requires a holistic and strategic approach that addresses all cell components. As this guide has detailed, combating potential drift is not about finding a single solution but about systematically engineering each element of the sensor: employing high-capacitance, hydrophobic transducer layers like conducting polymers and nanocomposites; eliminating component leaching through covalent bonding and plasticizer-free matrices; and ensuring the stability of the reference electrode. The experimental protocols for long-term regression analysis and selectivity validation provide robust methods for benchmarking performance. For researchers in drug development and biomedical science, where reliability is paramount, these strategies pave the way for the creation of next-generation potentiometric sensors capable of delivering trustworthy data over extended durations, both in the lab and in clinical applications.
Solid-contact ion-selective electrodes (SC-ISEs) represent a significant advancement in potentiometric sensing, offering substantial benefits over their liquid-contact counterparts, including simplicity of design, enhanced portability, and greater suitability for miniaturization and mass production [57]. However, these sensors are plagued by a fundamental challenge known as the aqueous layer problem, which can severely compromise their long-term stability and analytical performance. This phenomenon occurs when a thin aqueous layer forms at the critical interface between the ion-selective membrane (ISM) and the underlying solid-contact material [58] [57].
The presence of this water layer creates an unintended secondary electrochemical system that operates in parallel with the primary ion-sensing mechanism. This aqueous phase can undergo independent ionic concentration changes, leading to unstable potentiometric signals and measurement drift over time [58]. The anomalous potentiometric response observed in SC-ISEs with thin-layer membranes has been directly linked to relatively rapid changes in the composition of this water layer, causing misinterpretation of analytical results [58]. Understanding and mitigating this phenomenon is therefore crucial for developing reliable potentiometric sensors for research, clinical diagnostics, and environmental monitoring.
Fundamental Causes and Mechanisms of Water Layer Formation
Thermodynamic and Kinetic Drivers
The formation of an aqueous layer at the solid-contact/ISM interface is primarily driven by thermodynamic instability of the multilayer sensor structure when in contact with aqueous samples. Despite the hydrophobic nature of many polymeric membrane components, water molecules can progressively permeate through the membrane via diffusion, eventually accumulating at the interface with the solid contact [57]. This process is facilitated by:
- Osmotic gradients created by differences in ionic strength between the sample solution and the internal interface
- Capillary forces within microporous solid-contact materials
- Hydrophilic domains on solid-contact surfaces that provide nucleation sites for water accumulation
Material-Dependent Factors
Research has demonstrated that the propensity for aqueous layer formation is strongly influenced by the physicochemical properties of the solid-contact material and the membrane itself [58]:
- Lipophilicity of solid-contact material: Less lipophilic (more hydrophilic) materials exhibit stronger tendencies for water layer formation [58]
- Membrane thickness: Thin-layer membranes (typically < 100 μm) are particularly susceptible to anomalous responses linked to water layers [58]
- Measurement timescale: The potentiometric response anomaly is time-dependent, manifesting more significantly at certain measurement durations [58]
- Membrane composition: While having a minor effect compared to other factors, specific membrane formulations can influence water uptake kinetics [58]
Experimental Detection and Diagnosis of Water Layers
Potentiometric Diagnostic Methods
The presence of an aqueous layer can be detected through several potentiometric protocols:
Water Layer Test: This diagnostic procedure involves sequentially exposing the SC-ISE to solutions of different primary ion concentrations (e.g., high to low or vice versa) while monitoring the potential response [58]. A significant drift or slow stabilization suggests the presence of a water layer whose composition is slowly equilibrating with the changing sample.
Stirring Effect Test: In thin supported liquid membranes, the effect of changing stirring rates on both sides of the membrane can indicate asymmetries caused by water layers. The disappearance of potential drift upon symmetrical stirring indicates the elimination of concentration gradients across the membrane [59].
Long-term Stability Monitoring: Continuous measurement of potential drift in a solution of constant composition provides insight into water layer dynamics. Excellent SC-ISEs demonstrate minimal drift, typically < 0.1 mV/h [60].
Protocol for Water Layer Test
Objective: To diagnose the presence of an undesired water layer between the solid contact and the ion-selective membrane.
Materials:
- Fully fabricated SC-ISE
- Reference electrode (e.g., Ag/AgCl double-junction)
- Potentiometer with high input impedance (>10¹³ Ω)
- Two standard solutions with significantly different concentrations of primary ion (e.g., 0.1 M and 0.001 M)
- Magnetic stirrer and stir bars
Procedure:
- Condition the SC-ISE in a primary ion solution (e.g., 0.01 M) for at least 30 minutes.
- Immerse the conditioned electrode in the high concentration solution (0.1 M) with continuous stirring.
- Record the potential every 30 seconds until stable (change < 0.1 mV/min).
- Quickly transfer the electrode to the low concentration solution (0.001 M) without rinsing.
- Immediately record the potential upon immersion, then continue monitoring every 30 seconds for at least 15-20 minutes.
- Analyze the potential-time trajectory for anomalous drifts.
Interpretation: A significant continuous drift (> 2 mV over 15 minutes) after transfer to the dilute solution suggests the presence of a water layer that is slowly equilibrating with the new sample composition [58].
Material Solutions for Preventing Water Layer Formation
Hydrophobic Transducer Layers
Incorporating highly hydrophobic nanomaterials as intermediate layers between the electrode substrate and the ion-selective membrane has proven to be one of the most effective strategies for suppressing water layer formation:
Carbon Nanotubes (CNTs): Both multi-walled (MWCNTs) and single-walled (SWCNTs) carbon nanotubes create a hydrophobic barrier that prevents water accumulation. MWCNTs serve as efficient ion-to-electron transducers while their hydrophobic nature prevents the formation of an aqueous film at the interface [57].
Laser-Induced Graphene (LIG): Graphene electrodes patterned onto MXene/PVDF nanofiber mats exhibit excellent electrical conductivity and enhanced hydrophobicity, contributing to reduced potential drift [60].
Porous Carbon Composites: Nanostructured porous carbons derived from metal-organic frameworks (MOFs) combined with CNTs yield high surface area and strong hydrophobicity (contact angle ~135°), leading to improved potential stability [60].
Membrane Modifications
The composition of the ion-selective membrane itself can be engineered to resist water penetration:
Block Copolymer Additives: Incorporating polystyrene-block-poly(ethylene-butylene)-block-polystyrene (SEBS) into conventional PVC/DOS-based membranes significantly improves hydrophobicity and mechanical strength. Optimal compositions (e.g., PVC:SEBS = 30:30 wt%) demonstrate superior long-term performance with potential drift below 0.04 mV/h [60].
Hydrophobic Nanoparticles: Adding hydrophobic TiO₂ nanoparticles during membrane fabrication creates π-π interactions within the composite, resulting in a robust 3D porous electrode architecture with enhanced ion transport and interfacial contact while resisting water layer formation [60].
The following diagram illustrates the structural differences between conventional and advanced SC-ISEs with hydrophobic barriers:
Figure 1: Comparison of conventional and advanced SC-ISE architectures showing how hydrophobic transducer layers replace the problematic aqueous layer.
Performance Comparison of Material Solutions
Table 1: Comparison of material strategies for mitigating aqueous layer formation in SC-ISEs
| Material Strategy | Key Components | Reported Potential Drift | Hydrophobic Properties | Implementation Complexity |
|---|---|---|---|---|
| MWCNT Transducer [57] | Multi-walled carbon nanotubes, PVC membrane | Not specified | High hydrophobicity, prevents water layer formation | Moderate |
| LIG/MXene Composite [60] | Laser-induced graphene, Ti₃C₂T𝓍-MXene, PVDF nanofibers | 0.04 mV/h (Na⁺), 0.08 mV/h (K⁺) | Enhanced hydrophobicity from composite structure | High |
| SEBS-Modified Membrane [60] | PVC-SEBS block copolymer blend | < 0.04 mV/h | Improved hydrophobicity and mechanical strength | Low to Moderate |
| MOF-Derived Carbon [60] | ZIF-8@ZIF-67 derived porous carbon, MWCNT | Not specified | Contact angle ~135° | High |
Advanced Experimental Protocols for SC-ISE Fabrication
MWCNT-Modified SC-ISE Fabrication Protocol
Objective: To fabricate a solid-contact ISE with enhanced stability against water layer formation using multi-walled carbon nanotubes as a hydrophobic transducer.
Materials:
- Screen-printed electrode (SPE) substrate
- Multi-walled carbon nanotube (MWCNT) powder
- Selective ionophore (e.g., Calix[4]arene for Ag⁺ ions) [57]
- High molecular weight poly(vinyl chloride) (PVC)
- Plasticizer (e.g., 2-Nitrophenyl octyl ether - NPOE)
- Ionic additive (e.g., Sodium tetrakis[3,5-bis(trifluoromethyl)phenyl]borate)
- Tetrahydrofuran (THF) solvent
Procedure:
- MWCNT Layer Preparation:
- Disperse MWCNT powder in THF (1-2 mg/mL) and sonicate for 30 minutes to achieve homogeneous dispersion.
- Drop-cast 50-100 μL of MWCNT dispersion onto the working electrode area of the SPE.
- Allow to dry at room temperature for 1 hour, forming a uniform black film.
Ion-Selective Membrane Preparation:
- Prepare membrane cocktail containing: 1.0 wt% ionophore, 0.5 wt% ionic additive, 32.5 wt% PVC, and 66 wt% plasticizer.
- Dissolve these components in 2 mL THF and stir thoroughly until complete dissolution (approximately 1 hour).
- Drop-cast 100 μL of the membrane cocktail directly onto the MWCNT-modified electrode.
- Allow solvent evaporation overnight at room temperature to form a uniform membrane approximately 200-300 μm thick.
Conditioning:
- Condition the fabricated SC-ISE in a solution containing 0.01 M of the primary ion for at least 12 hours before use.
- Store in the same conditioning solution when not in use.
Validation: Perform water layer test as described in Section 3.2 to verify absence of aqueous layer formation. The MWCNT-modified sensor should achieve high accuracy (e.g., 99.94% ± 0.413 for Ag⁺ detection) and stable potential response [57].
Laser-Induced Graphene SC-ISE Fabrication Protocol
Objective: To create a flexible SC-ISE with inherent hydrophobicity through laser-induced graphene formation on MXene/PVDF substrates.
Materials:
- Ti₃AlC₂ (MAX phase) precursor
- Poly(vinylidene fluoride) (PVDF) powder
- Hydrochloric acid (HCl) and hydrofluoric acid (HF) for etching
- Acetone and N,N-dimethylformamide (DMF) solvents
- CO₂ laser engraving system
- Electrospinning apparatus
Procedure:
- MXene Synthesis:
- Etch 1.0 g of Ti₃AlC₂ powder in a mixture of 12 mL HCl, 2 mL HF, and 6 mL DI water at 35°C for 24 hours with stirring.
- Wash the resulting multilayer MXene repeatedly with DI water by centrifugation until supernatant reaches pH ~6.
- Dry the sediment in a vacuum oven at 75°C overnight.
MXene@PVDF Nanofiber Mat Fabrication:
- Disperse multilayer MXene powder in acetone/DMF (7:5 v/v) solvent mixture at 2.1 wt% concentration.
- Add PVDF powder (12 wt% of total mass) and stir at 55°C for 2 hours to achieve homogeneous mixing.
- Electrospin the solution through a 21-gauge needle at 18 kV, with a flow rate of 2.0 mL/h and tip-to-collector distance of 12 cm.
- Collect nanofibers on aluminum foil and dry at 50°C for 3 hours.
Laser-Induced Graphene Patterning:
- Use CO₂ laser to directly pattern LIG electrodes onto the MXene@PVDF nanofiber mat.
- Optimize laser power to achieve simultaneous graphitization of PVDF and surface oxidation of Ti₃C₂Tₓ to generate TiO₂ nanoparticles.
- The resulting MPNFs/LIG@TiO₂ composite exhibits hierarchical porosity and enhanced hydrophobicity.
Membrane Application:
- Drop-cast ion-selective membrane cocktail (similar to Section 5.1) onto the LIG electrode area.
- Allow THF evaporation to form a complete sensor ready for conditioning and use.
Validation: The fabricated Na⁺ and K⁺ sensors should demonstrate near-Nernstian sensitivities (e.g., 48.8 mV/decade and 50.5 mV/decade, respectively) with minimal potential drift (< 0.1 mV/h) in prolonged sweat testing [60].
The Researcher's Toolkit: Essential Materials for Aqueous Layer Mitigation
Table 2: Key research reagents and materials for developing water-layer-resistant SC-ISEs
| Material Category | Specific Examples | Function in SC-ISE | Key Properties |
|---|---|---|---|
| Hydrophobic Transducers | Multi-walled Carbon Nanotubes (MWCNTs) [57] | Ion-to-electron transduction, hydrophobic barrier | High conductivity, large surface area, inherent hydrophobicity |
| Laser-Induced Graphene (LIG) [60] | Flexible electrode material with tunable hydrophobicity | Porous structure, excellent conductivity, mechanical flexibility | |
| MXene (Ti₃C₂Tₓ) Composites [60] | Conductive scaffold with enhanced interfacial properties | Metallic conductivity, surface functionalization capability | |
| Membrane Polymers | Poly(vinyl chloride) (PVC) [57] | Conventional polymer matrix for ISMs | Good ionophore compatibility, mechanical stability |
| SEBS Block Copolymer [60] | Hydrophobic membrane additive | Enhanced hydrophobicity, reduced water layer formation, improved mechanical strength | |
| Plasticizers | 2-Nitrophenyl octyl ether (NPOE) [57] | Membrane plasticizer for proper ionophore function | High lipophilicity, low aqueous solubility |
| Bis(2-ethylhexyl) sebacate (DOS) [60] | Alternative plasticizer for polymer membranes | Good compatibility with PVC, low volatility | |
| Ion-Exchangers | Sodium tetrakis[3,5-bis(trifluoromethyl)phenyl]borate [57] | Ionic additive for permselectivity | Lipophilic anion, prevents co-ion interference |
| Nanoparticle Additives | TiO₂ Nanoparticles [60] | Hydrophobic membrane additive | Induces π-π interactions, enhances interfacial stability |
The aqueous layer problem remains a significant challenge in the development of robust and reliable solid-contact ion-selective electrodes. Through systematic investigation of the underlying mechanisms, researchers have established that the lipophilicity of the solid-contact material, membrane thickness, and measurement timescale are critical factors influencing water layer formation [58]. The research community has responded with innovative material solutions centered on incorporating highly hydrophobic transducer layers such as carbon nanotubes [57] and laser-induced graphene composites [60] that effectively prevent water accumulation at the critical interface.
Advanced diagnostic protocols, particularly the water layer test and stirring effect analysis, provide researchers with reliable methods for detecting and quantifying this phenomenon [58] [59]. The continued development of SC-ISEs with enhanced resistance to water layer formation will enable more reliable potentiometric sensing across diverse applications including clinical diagnostics, environmental monitoring, and industrial process control. Future research directions will likely focus on further optimizing nanomaterial properties and developing novel membrane compositions that offer intrinsic resistance to water penetration while maintaining excellent electrochemical performance.
In the field of potentiometric analysis, ion-selective electrodes (ISEs) are prized for their ability to quantify specific ions in complex mixtures, from environmental samples to clinical diagnostics. The performance of these sensors hinges on one critical property: selectivity—the ability to accurately determine a target ion in the presence of other, potentially interfering, ions. The theoretical foundation for quantifying this selectivity is the Nikolsky-Eisenman equation, a cornerstone of potentiometric theory that describes the electrode potential when multiple ion species are present [61] [2]. Simultaneously, the practical realization of selectivity is achieved through the use of advanced ionophores, synthetic or natural molecules embedded within the sensor membrane that selectively bind to the target ion. This technical guide delves into the synergistic relationship between the theoretical model and the chemical components, providing researchers and drug development professionals with a comprehensive framework for optimizing ISE selectivity. The continuous development of novel ionophores is paramount, as even for challenging ions like sulfate, research demonstrates that strategic molecular modification of commercial ionophores can yield sensors with superior selectivity profiles for direct measurements in real-world matrices such as river water [62].
Theoretical Framework: The Nikolsky-Eisenman Equation
The Nikolsky-Eisenman equation is an extension of the classic Nernst equation and serves as the primary model for predicting the potentiometric response of an ion-selective membrane in the presence of interfering ions.
Mathematical Formalism and Significance
For an electrode sensitive to a primary ion, ( I^{zI} ), and an interfering ion, ( J^{zJ} ), with charges ( zI ) and ( zJ ) respectively, the potential ( E ) across the membrane is given by: [E = \text{constant} + \frac{RT}{zI F} \ln\left( aI + K{IJ}^{pot}(aJ)^{zI/zJ} \right)] Where:
- ( R ) is the universal gas constant
- ( T ) is the absolute temperature
- ( F ) is the Faraday constant
- ( aI ) and ( aJ ) are the activities of the primary and interfering ions
- ( K_{IJ}^{pot} ) is the potentiometric selectivity coefficient [2]
The selectivity coefficient, ( K_{IJ}^{pot} ), is the pivotal parameter in this equation. A value of 1 indicates equal response to both ions; a value less than 1 signifies a preference for the primary ion ( I ); and a value much less than 1 (e.g., ( 10^{-2} ) or ( 10^{-3} )) indicates high selectivity for ( I ) over ( J ). The ultimate sensitivity of a potentiometric sensor is governed by this Nernstian (or Nikolskian) response, which can be a limitation when higher sensitivity is required [61] [63].
The Challenge of Divalent Ions and Selectivity Assessment
A significant complication arises when the primary and interfering ions have different charges, as is often the case with ions like sulfate (( SO4^{2-} )). The conventional Fixed Interference Method (FIM) for determining ( K{IJ}^{pot} ) can yield counterintuitive and ambiguous results in such scenarios [62]. The exponent ( zI/zJ ) in the Nikolsky-Eisenman equation means that the interference from an ion with a different charge has a non-linear and potent impact. Research on sulfate ISEs highlights that a more reliable and intuitive alternative to a single ( K_{IJ}^{pot} ) value is to visualize the sensor's response curve towards the primary ion in the presence of a fixed background level of the interfering ion [62]. This graphical method provides an unambiguous assessment of real-world sensor performance.
The Role of Advanced Ionophores in Achieving Selectivity
Ionophores are the molecular workhorses responsible for imparting selectivity to the sensor membrane. They operate by forming selective complexes with the target ion.
Ionophore Mechanisms and Types
There are two primary mechanisms by which ionophores function:
- Ion Exchange: The ionophore, often a lipophilic organic anion, is immobilized in the membrane. The target cation from the sample displaces another cation from the ionophore in a reversible equilibrium, facilitating the partitioning of the target ion into the membrane phase [8].
- Ion Transport with a Neutral Carrier: The ionophore is a neutral molecule that acts as a "host" to "carry" the target ion (the "guest") across the membrane-solution interface. Classic examples include crown ethers for cations like potassium and valinomycin for potassium [8]. These neutral carriers can trap the analyte ion at the interface, enabling its partition into the organic membrane.
Table 1: Characteristics of Common Ionophore Types
| Ionophore Type | Mechanism | Target Ions | Key Features |
|---|---|---|---|
| Neutral Carrier (e.g., Valinomycin) | Encapsulates ion in a molecular cavity | Cations (K⁺, Ca²⁺) | High selectivity based on cavity size and polarity |
| Charged Ionophore | Ion-exchange or charged-site complexation | Anions (SO₄²⁻, HCO₃⁻), Cations | Can be engineered for non-Hofmeister behavior |
| Polyether Toxins (e.g., Okadaic Acid) | Facilitates cation transport across membranes | Cations | Natural ionophores with complex biological activities [64] |
Case Study: Designing Sulfate Ionophores
The development of potentiometric sensors for sulfate is particularly challenging due to sulfate's high hydrophilicity and poor affinity for lipophilic membranes [62]. The commercial sulfate ionophore (L0) is a bis-thiourea compound. Recent research has focused on synthesizing derivatives of L0 to enhance selectivity. Key strategies include [62]:
- Modifying the electron density at the thiourea NH groups to tune their hydrogen-bonding capability, which is crucial for binding the sulfate anion.
- Replacing aromatic phenyl groups with aliphatic cyclohexene groups (L1) to study the effect on binding properties.
- Introducing methylene spacers (L2) between the terminal phenyl groups and the thiourea moiety to alter the geometry and flexibility of the binding site.
- Incorporating electron-donating or electron-withdrawing substituents (e.g., -OCH₃ in L3, -NO₂ in L4, -F in L5) on the phenyl rings to systematically vary the acidity of the NH protons.
These studies confirm that synthetic modification is a powerful tool for creating sensors that outperform the commercial standard, demonstrating the tangible impact of advanced ionophore design [62].
Experimental Protocols for Selectivity Optimization
Membrane Fabrication and Sensor Preparation
A standard protocol for preparing a polymer-based ISE membrane is as follows [65] [62]:
Membrane Cocktail Preparation: Dissolve the following components in a volatile organic solvent (e.g., tetrahydrofuran - THF):
- Polymer Matrix: 30-33 wt% Poly(vinyl chloride) (PVC).
- Plasticizer: 60-65 wt% (e.g., o-Nitrophenyl octyl ether - o-NPOE). The plasticizer ensures membrane fluidity and governs the dielectric constant.
- Ionophore: 1-5 wt% (The selective component).
- Ion-Exchanger: 0.5-1 wt% (e.g., lipophilic salt like tetradodecylammonium bromide - TDDAB). This facilitates charge neutrality.
Casting and Evaporation: Pour the homogeneous cocktail into a glass ring on a leveled glass plate. Allow the THF to evaporate slowly over 12-24 hours, resulting in a flexible, transparent membrane disc.
Sensor Assembly: Punch a small disc from the cast membrane and mount it on the tip of an electrode body. Fill the electrode body with an internal reference solution containing a fixed concentration of the primary ion.
Assessing Potentiometric Selectivity
Two primary methods are used to determine the selectivity coefficient, ( K_{IJ}^{pot} ):
Separate Solution Method (SSM): The electrode potential is measured in two separate solutions, one containing only the primary ion ( I ) at a known activity ( aI ), and another containing only the interfering ion ( J ) at the same activity ( aJ ). The ( K_{IJ}^{pot} ) is calculated from the measured potential difference.
Fixed Interference Method (FIM): The electrode potential is measured in a series of solutions where the activity of the primary ion, ( aI ), is varied, while the activity of a single interfering ion, ( aJ ), is kept constant. The detection limit for the primary ion in the presence of the interferent is determined from the resulting calibration curve, and ( K_{IJ}^{pot} ) is calculated based on this limit. As noted, FIM can be problematic for ions of different charge, and visualizing the full response curve is recommended [62].
Visualizing the Workflow for ISE Development and Optimization
The following diagram illustrates the logical workflow and iterative process of designing and optimizing an ion-selective electrode, from initial component selection to performance validation.
Advanced Sensing Concepts and Future Directions
To overcome the fundamental sensitivity limit imposed by the Nernst equation, researchers are developing innovative signal transduction methods that move beyond traditional potentiometry.
Signal Amplification Beyond Potentiometry
A promising approach is the use of a reversed amperometric setup. In this configuration, the Ag|AgCl electrode serves as the working electrode, while the ISE functions as the reference electrode [61] [63]. A change in the primary ion's concentration alters the potential of the ISE reference, which in turn shifts the potential of the Ag|AgCl working electrode in the amperometric circuit. Due to the high slope of the current vs. potential dependence for the Ag|AgCl electrode, small changes in ISE potential result in significant changes in the measured current. This provides high amplification of the analytical signal and, advantageously, results in a linear dependence of current on analyte concentration [61]. Other emerging methods transduce the potentiometric response into other readable signals, such as charge, electrochemiluminescence, fluorescence, or color change, enabling user-friendly and highly sensitive detection schemes [63].
Application-Specific Ionophore Development
The drive for in-situ environmental monitoring continues to spur the development of novel ionophores for specific ions. A key area of focus is the detection of carbonate ions (( CO_3^{2-} )) to study ocean acidification [65]. Reliable in-situ carbonate sensing is crucial for understanding the impact of declining pH and carbonate saturation states on marine calcifying organisms. The development of highly selective, sensitive, and stable carbonate ionophores is an active field of research aimed at addressing this global environmental challenge [65].
The Scientist's Toolkit: Essential Research Reagents and Materials
Table 2: Key Materials for Ion-Selective Electrode Research
| Reagent/Material | Function in ISE Membrane | Common Examples |
|---|---|---|
| Ionophore | The active sensing component; selectively binds the target ion. | Valinomycin (for K⁺), bis-thiourea derivatives (for SO₄²⁻) [62], novel carbonate ionophores [65] |
| Polymer Matrix | Provides a solid, inert support for the membrane components. | Poly(vinyl chloride) - PVC [62] |
| Plasticizer | Imparts liquidity to the membrane; governs dielectric constant and influences ionophore selectivity. | o-Nitrophenyl octyl ether (o-NPOE), Dioctyl sebacate |
| Ion-Exchanger | A lipophilic salt that facilitates ion exchange and ensures charge neutrality within the membrane. | Tetradodecylammonium bromide (TDDAB), Potassium tetrakis(4-chlorophenyl)borate |
| Solvent | Dissolves membrane components for uniform casting. | Tetrahydrofuran (THF), Cyclohexanone |
| Internal Reference Solution | Fills the electrode body; provides a stable contact potential with the inner surface of the membrane. | A solution with a fixed concentration of the primary ion (e.g., 0.01 M KCl for a K⁺-ISE) |
Potentiometric sensing, a well-established electrochemical technique, measures the potential difference between two electrodes to determine the activity of target ions in a sample. Its versatility has led to widespread application in clinical diagnostics, environmental monitoring, and pharmaceutical analysis [22]. The core of a modern potentiometric sensor is the ion-selective electrode (ISE), whose performance is critically dependent on the materials used in its construction. Recent research has focused on two key material innovations: the integration of advanced nanocomposites to enhance signal transduction and the application of hydrophobic layers to improve sensor stability and reliability [22] [66]. These innovations address fundamental challenges in potentiometric sensing, including signal drift, water layer formation, and limited miniaturization capability. This technical guide explores these material advancements within the context of potentiometric cell setup, providing researchers and drug development professionals with detailed methodologies and performance data to facilitate the development of next-generation potentiometric sensors.
Core Principles of Potentiometric Cells and Material Challenges
A potentiometric cell typically consists of an ion-selective electrode (ISE) and a reference electrode, which together measure the potential difference that develops across an ion-selective membrane when exposed to a sample solution [22]. The potential is measured at near-zero current, making the technique highly power-efficient. ISEs are classified based on their construction: Liquid-Contact ISEs (LC-ISEs) contain an internal filling solution, while Solid-Contact ISEs (SC-ISEs) replace this solution with a solid-contact layer that acts as an ion-to-electron transducer [22].
Despite their apparent simplicity, potentiometric cells face several material-related challenges that impact their performance:
- Signal Instability: Traditional coated-disc electrodes often exhibit potential drift due to poor charge transfer between the ionic conductor (membrane) and electronic conductor (electrode) [66].
- Water Layer Formation: Water penetration between the membrane and underlying substrate creates an undesired aqueous layer that causes potential drift and shortens sensor lifetime [22] [66].
- Limited Miniaturization: LC-ISEs are difficult to miniaturize due to their internal liquid components, restricting their use in wearable and implantable devices [22].
These challenges have driven the investigation of nanocomposites and hydrophobic materials as solutions to create more robust, stable, and miniaturizable potentiometric sensors.
Nanocomposite Engineering for Enhanced Potentiometric Performance
Nanocomposites represent a revolutionary approach to designing the solid-contact layer in SC-ISEs. By combining nanomaterials with complementary properties, researchers have created transduction layers with superior electrical capacitance, enhanced stability, and improved mechanical properties.
Material Systems and Synergistic Effects
The strategic combination of carbon-based nanomaterials with metal oxides has yielded particularly promising results:
Table 1: Performance Characteristics of Carbon-Based Nanocomposites for Potassium-Selective Electrodes
| Nanocomposite System | Electrical Capacitance | Contact Angle | Linear Response Range | Key Advantages |
|---|---|---|---|---|
| NT + RuO₂ (Carbon Nanotubes) | ~14 mF | 100° | 10⁻¹ to 10⁻⁶ M K⁺ | Highest capacitance, superior hydrophobicity |
| CB + RuO₂ (Carbon Black) | ~5.5 mF | 80° | 10⁻¹ to 10⁻⁶ M K⁺ | Cost-effective, good performance |
| GR + RuO₂ (Graphene) | ~5.5 mF | 60° | 10⁻¹ to 10⁻⁶ M K⁺ | Large surface area, fast electron transfer |
These nanocomposites leverage synergistic effects: carbon nanomaterials provide high surface area and electronic conductivity, while RuO₂ contributes pseudocapacitive behavior and mixed ionic-electronic transduction capabilities [66]. The resulting materials exhibit electrical capacitance values significantly higher than either component alone, which translates to more stable potentiometric responses [66].
Other innovative nanocomposite systems include:
- Conducting Polymer Nanocomposites: Materials like poly(3,4-ethylenedioxythiophene) (PEDOT) combined with carbon nanotubes or graphene offer high conductivity and reversible redox properties [22].
- Metal-Organic Framework Composites: ZIF-polymer composites show exceptional porosity and tunable functionality for specialized sensing applications [67].
- Hierarchical Nanostructures: MoS₂ nanoflowers filled with Fe₃O₄ create stable structures with enhanced capacitance for the solid-contact layer [22].
Response Mechanisms
Nanocomposites enhance potentiometric performance through two primary mechanisms:
- Redox Capacitance Mechanism: Involves reversible faradaic reactions that store charge, providing high capacitance and potential stability [22].
- Electric-Double-Layer Capacitance: Based on non-faradaic charge separation at the electrode-electrolyte interface, contributing to rapid response times [22].
The combination of these mechanisms in nanocomposite materials results in superior performance compared to single-component systems.
Hydrophobic Layer Engineering for Sensor Stability
Hydrophobic modification represents a critical strategy for preventing the formation of water layers at the membrane-substrate interface, a common cause of potential drift and shortened sensor lifetime.
Hydrophobic Materials and Their Properties
The effectiveness of a hydrophobic layer is quantified by its contact angle with water, with higher values indicating greater hydrophobicity. Research has demonstrated that nanocomposites can inherently provide hydrophobic properties while serving as transduction layers [66]:
- Carbon Nanotube-RuO₂ Composites: Exhibit contact angles of approximately 100°, providing excellent hydrophobicity while maintaining high electrical capacitance [66].
- Carbon Black-RuO₂ Systems: Show contact angles of 80°, representing a balance between hydrophobicity and other material properties [66].
- Graphene-RuO₂ Combinations: Demonstrate contact angles of 60°, suitable for applications where moderate hydrophobicity is acceptable [66].
The hydrophobic character of these materials prevents the infiltration of water molecules, thereby eliminating the parasitic water layer that can develop between the ion-selective membrane and the solid-contact layer. This is particularly important for long-term stability in continuous monitoring applications.
Implementation Strategies
Hydrophobic properties can be incorporated into potentiometric sensors through several approaches:
- Intrinsic Material Hydrophobicity: Selecting naturally hydrophobic materials like certain carbon allotropes or fluorinated polymers for the solid-contact layer [66].
- Surface Modification: Applying hydrophobic coatings or treatments to existing materials to enhance their water-repellent properties.
- Molecular Engineering: Designing materials with specific functional groups that confer hydrophobic characteristics while maintaining other necessary electrochemical properties.
Experimental Protocols for Fabrication and Characterization
This section provides detailed methodologies for fabricating and characterizing nanocomposite-based potentiometric sensors with hydrophobic properties.
Protocol 1: Fabrication of Carbon-RuO₂ Nanocomposite Solid-Contact ISEs
Table 2: Research Reagent Solutions for Carbon-RuO₂ ISEs
| Reagent/Material | Specifications | Function in Experiment |
|---|---|---|
| Carbon Nanomaterials | Multiwalled CNTs, Graphene, Carbon Black (Printex U) | Transduction matrix providing high surface area and electronic conductivity |
| Ruthenium Dioxide | Hydrous form, nanoparticle size | Pseudocapacitive component enhancing charge storage capacity |
| Potassium Ionophore I | Valinomycin, ≥95% purity | Selective recognition element for potassium ions |
| Lipophilic Salt | KTpClPB (potassium tetrakis(4-chlorophenyl)borate) | Membrane component reducing membrane resistance and improving selectivity |
| Polymer Matrix | PVC (high molecular weight) | Structural matrix for the ion-selective membrane |
| Plasticizer | o-NPOE (2-nitrophenyl octyl ether) | Membrane solvent ensuring proper ionophore mobility and function |
| Solvents | DMF (for dispersion), THF (for membrane) | Processing solvents for layer deposition and membrane formation |
Step 1: Preparation of Nanocomposite Dispersion
- Weigh 3 mg of RuO₂ and 4 mg of carbon nanomaterial (CNTs, graphene, or carbon black)
- Disperse in 1 mL of dimethylformamide (DMF)
- Sonicate for 30 minutes using a probe sonicator (50% amplitude, 5s pulse on/5s pulse off) to achieve homogeneous dispersion
Step 2: Electrode Pretreatment
- Polish glassy carbon disc electrodes (3 mm diameter) sequentially with 1.0, 0.3, and 0.05 μm alumina slurries
- Clean ultrasonically in deionized water and methanol (3 minutes each)
- Dry under a nitrogen stream
Step 3: Nanocomposite Layer Deposition
- Apply 10-15 μL of nanocomposite dispersion onto the electrode surface using drop casting
- For CNT-based composites, use 15 μL to ensure homogeneous coverage
- Dry at 60°C for 2 hours to evaporate solvent and form solid layer
Step 4: Ion-Selective Membrane Application
- Prepare membrane cocktail containing: 1.10% (w/w) potassium ionophore I, 0.25% (w/w) KTpClPB, 65.65% (w/w) o-NPOE, and 33.00% (w/w) PVC dissolved in 1 mL THF
- Apply 60 μL of membrane cocktail over the nanocomposite layer
- Allow to dry at room temperature for 24 hours before use [66]
Protocol 2: Microfluidic Synthesis of Nanocapsules for Drug Sensing Applications
For pharmaceutical applications involving hydrophobic drugs, microfluidic synthesis enables precise encapsulation:
Step 1: Device Setup
- Use a microfluidic device with herringbone micromixers or 3D hydrodynamic flow focusing
- Set total flow rate (TFR) between 5-15 mL/min and flow rate ratio (FRR) according to drug properties
Step 2: Nanocapsule Formation
- Prepare separate solutions of hydrophobic drug (e.g., paclitaxel, curcumin, vitamin D), tannic acid, and iron chloride
- Introduce solutions simultaneously into microfluidic channels
- Optimize mixing timescale to be shorter than drug's nucleation timescale for uniform encapsulation
Step 3: Collection and Characterization
- Collect effluent containing formed nanocapsules
- Characterize using electron microscopy, dynamic light scattering, and HPLC
- Expected outcomes: particle size 100-200 nm, drug loading 40-70%, production rate up to 70 mg/hr per channel [68]
Protocol 3: Hydrophobicity and Electrochemical Characterization
Contact Angle Measurements
- Use a contact angle goniometer with sessile drop method
- Apply 2 μL deionized water droplets on the solid-contact layer surface
- Measure contact angle from captured images (minimum n=5 locations)
- Higher values (>90°) indicate superior hydrophobicity [66]
Electrochemical Impedance Spectroscopy
- Parameters: Frequency range 0.1 Hz to 100 kHz, amplitude 10 mV
- Measure in 0.1 M KCl solution using three-electrode setup
- Extract electrical capacitance from low-frequency region using C = -1/(2πfZ") [66]
Chronopotentiometric Stability Testing
- Apply constant current of ±1 nA for 60 s each direction
- Measure potential drift per unit time (ΔE/Δt)
- Lower values indicate higher stability (ideal: <0.1 mV/h) [22]
Performance Evaluation and Comparative Analysis
Rigorous evaluation of nanocomposite-based sensors demonstrates their superior performance compared to conventional designs:
Table 3: Comprehensive Performance Metrics of Nanocomposite-Modified Potentiometric Sensors
| Performance Parameter | Traditional Coated-Disc | CNT-RuO₂ Nanocomposite | Testing Conditions/Methodology |
|---|---|---|---|
| Electrical Capacitance | 0.1-1 mF | ~14 mF | EIS measurement at 0.1 Hz in 0.1 M KCl |
| Potential Drift | 0.5-2 mV/h | <0.1 mV/h | Chronopotentiometry (±1 nA current) |
| Response Time | 10-30 s | <10 s | Time to reach 95% final potential after concentration step |
| Lifetime | 2-4 weeks | >8 weeks | Stable Nernstian response in daily measurements |
| Water Layer Formation | Common | Eliminated | Contact angle >90°, no potential drift in ISC test |
| Linear Range | 10⁻¹-10⁻⁵ M | 10⁻¹-10⁻⁶ M | Potassium determination in aqueous solutions |
The integration of nanocomposites extends beyond performance enhancement to enable new sensor formats. The compatibility of these materials with 3D printing technologies facilitates rapid prototyping and manufacturing of customized sensor geometries [22]. Furthermore, their application in wearable sensors enables continuous monitoring of electrolytes and pharmaceuticals in biological fluids, particularly for drugs with narrow therapeutic indices [22].
The strategic implementation of nanocomposites and hydrophobic layers represents a paradigm shift in potentiometric sensor design. By addressing fundamental material limitations, these innovations enable sensors with enhanced stability, sensitivity, and reliability. The fusion of carbon nanomaterials with metal oxides like RuO₂ creates synergistic systems that outperform single-component materials, while inherent hydrophobicity eliminates the persistent challenge of water layer formation.
Future developments in this field will likely focus on several key areas: the integration of artificial intelligence for optimization of nanocomposite compositions [69], advancement of multi-functional materials that combine sensing, transduction, and self-calibration capabilities, and refinement of manufacturing techniques such as 3D printing for scalable production [22] [70]. As these material innovations continue to evolve, they will undoubtedly expand the applicability of potentiometric sensing in clinical diagnostics, pharmaceutical development, and environmental monitoring, ultimately contributing to more effective healthcare solutions and improved patient outcomes.
The evolution of potentiometric sensors toward miniaturization is a cornerstone of modern analytical chemistry, enabling advancements in point-of-care diagnostics, wearable health monitors, and real-time environmental sensing [71] [22]. However, this drive for smaller, more portable devices places immense stress on two critical components: the reference electrode (RE) and its ability to resist fouling [72] [73]. A stable and reliable reference electrode is fundamental to potentiometric measurements, providing a constant, well-defined potential against which the signal from the ion-selective electrode (ISE) is measured [73]. In traditional macroscopic systems, this stability is often achieved through large volumes of inner filling solutions. Miniaturization disrupts this paradigm, introducing challenges such as increased signal drift, potential instability from clogged liquid junctions, and heightened susceptibility to fouling by proteins, sulfides, or other chemical species in complex samples [72] [71]. This technical guide, framed within broader research on potentiometric cell setups, examines the root causes of these challenges and details the latest material strategies, design innovations, and experimental protocols to overcome them, providing a resource for researchers and drug development professionals working at the forefront of sensor technology.
Core Challenges in Miniaturized Reference Electrodes
The miniaturization of reference electrodes introduces specific physical and electrochemical constraints that directly impact their stability and resistance to fouling.
- Liquid Junction Instability: Conventional reference electrodes (e.g., Ag/AgCl) rely on a liquid junction between an inner filling solution and the sample. Miniaturization makes this junction prone to clogging or rapid electrolyte depletion, leading to significant potential drift [71] [73].
- Increased Fouling Susceptibility: As electrode size decreases, the surface-area-to-volume ratio increases, making the electrode more vulnerable to performance degradation from the accumulation of unwanted materials (fouling) [72]. Fouling can be broadly categorized as follows:
- Biofouling: The accumulation of biomolecules (e.g., proteins, lipids) on the electrode surface. Studies using Bovine Serum Albumin (BSA) and nutrient mixes like F12-K have shown that biofouling can significantly decrease sensor sensitivity and cause peak voltage shifts [72].
- Chemical Fouling: The deposition of chemical by-products or interfering species. For example, sulfide ions (S²⁻), prevalent in certain biological and environmental samples, can react with Ag/AgCl electrodes, forming a Ag₂S layer and drastically altering the reference potential [72].
- Signal Drift from Poor Solid-Contact: In all-solid-state reference electrodes (S-REs), the ion-to-electron transducer layer is critical. An unstable or low-capacitance solid contact can lead to high signal drift, poor reproducibility, and non-ideal potentiometric responses [73] [22].
Table 1: Quantitative Impact of Fouling on Electrode Performance
| Fouling Mechanism | Experimental Agent | Observed Impact on Reference Electrode | Key Metric Change |
|---|---|---|---|
| Chemical Fouling | Sulfide Ions (S²⁻) | Decreased Open Circuit Potential (OCP) | Peak voltage shifts in FSCV signals [72] |
| Biofouling | BSA Solution (40 g L⁻¹) | Accumulation of biomolecules on surface | Increased sulfide ion concentration post-implantation (EDS data) [72] |
| Chemical Fouling | Dopamine (1 mM) / Serotonin (25 µM) | Generation of oxidative by-products | Not directly measured for RE, but a known issue for WEs [72] |
Material and Design Strategies for Stable, Fouling-Resistant Electrodes
Advanced Materials for Solid-Contact Reference Electrodes
The transition to all-solid-state designs is pivotal for miniaturization. These electrodes eliminate the liquid junction, thereby overcoming issues of electrolyte leakage and evaporation [73].
- Polymeric Ion Exchangers: Recent research demonstrates that synthetic polymeric ion exchangers embedded in a carbon-paste matrix can create stable, liquid-junction-free S-REs. These polymers are selected for their low solubility, high ion-exchange capacity, and robust mechanical and pH stability, which minimize leakage and extend electrode lifetime [73].
- Nanocomposite Solid Contacts: Nanomaterials are increasingly used as ion-to-electron transducers in solid-contact ISEs (SC-ISEs) due to their high surface area and excellent conductivity. Nanocomposites, such as MoS₂ nanoflowers filled with Fe₃O₄ or tubular gold nanoparticles with tetrathiafulvalene (Au-TTF), provide high electrical capacitance and synergetic effects that enhance potential stability and reduce drift [22].
- Conductive Polymers: Polymers like poly(3,4-ethylenedioxythiophene) doped with poly(styrene-sulfonate) (PEDOT:PSS) are widely used as solid-contact layers. They facilitate the ion-to-electron transduction and can be engineered into ultrathin, flexible platforms suitable for wearable and implantable sensors [74] [51].
Innovative Device Architectures
Novel device configurations can physically isolate critical components from fouling environments or redefine potentiometric operation.
- The Potentiometric Organic Electrochemical Transistor (pOECT): This configuration decouples the sensing gate (GS) from the current-carrying gating gate (GG). The GS is maintained at open-circuit potential (OCP), the ideal condition for potentiometric sensing, while the GG applies the doping voltage to the transistor channel. This setup allows for RE-free operation, intrinsic signal amplification, and high accuracy without subjecting the sensing interface to damaging currents [51].
- Floating Gate Systems: In OECTs, the channel can be kept in an isolated electrolyte, with only the gate exposed to the sample. This protects the sensitive channel material from the complex and potentially fouling sample matrix, enhancing long-term stability [51].
- 3D-Printed Designs: Additive manufacturing allows for the customizable fabrication of electrode housings, solid contacts, and integrated microfluidic systems. Techniques like fused deposition modeling (FDM) and stereolithography (SLA) enable the rapid prototyping of optimized, miniaturized sensor geometries that were previously difficult to produce [24] [22].
pOECT Configuration Isolates Sensing
Surface Modifications and Antifouling Coatings
Applying specific coatings to the electrode surface is a direct strategy to mitigate fouling.
- Biomimetic Coatings: Coatings such as phosphorylcholine functionalized ethylene-dioxythiophene (PEDOT-PC) create a cell-membrane-mimic surface that significantly reduces the adsorption of proteins and other biomacromolecules, as demonstrated in implanted rat brain studies [72].
- Hydrophilic Polymers and Gels: Using zwitterionic materials or hydrogel layers at the junction of reference electrodes can create a physical and energetic barrier to the adsorption of foulants, thereby improving performance in complex biological fluids [71] [74].
Experimental Protocols for Electrode Evaluation
To ensure the reliability of new reference electrode designs, standardized testing protocols are essential. The following methodologies provide a framework for evaluating stability and fouling resistance.
Protocol for Assessing Solid-Contact Stability
This protocol evaluates the potential drift of a solid-contact reference electrode (S-RE) under controlled conditions [73].
- Objective: To determine the long-term potential stability and signal drift of a newly fabricated S-RE.
- Materials:
- Fabricated S-RE and a traditional double-junction Ag/AgCl reference electrode.
- A high-impedance potentiometer/data acquisition system.
- Standard solutions (e.g., 0.1 M KCl, 0.1 M NaCl).
- Procedure:
- Place the S-RE and the traditional reference electrode in a gently stirred 0.1 M KCl solution.
- Connect both electrodes to the potentiometer and begin recording the potential difference (EMF) between them.
- Record the EMF every 10 seconds for a minimum of 24 hours.
- Maintain a constant temperature (±0.5 °C) throughout the experiment.
- Data Analysis:
- Plot the recorded EMF versus time.
- Calculate the average potential over the final hour and the standard deviation.
- Determine the drift rate (mV/hour) by performing a linear regression on the data from the stable period of the measurement. High-performance S-REs should exhibit drift rates of < 0.1 mV/h [73].
Protocol for Quantifying Sulfide Ion Fouling
This method tests the susceptibility of Ag/AgCl-based reference electrodes to chemical fouling by sulfide ions, a common interferent [72].
- Objective: To evaluate the impact of sulfide ions on the open circuit potential (OCP) of a reference electrode.
- Materials:
- Ag/AgCl reference electrode under test.
- Stable, non-polarizable counter electrode (e.g., Pt wire).
- Potentiostat or high-impedance voltmeter.
- Tris buffer (15 mM, pH 7.4).
- Sodium sulfide nonahydrate (Na₂S·9H₂O) stock solution (1 M in Tris buffer).
- Procedure:
- Set up a two-electrode cell with the Ag/AgCl RE as the working electrode and the Pt wire as the counter/reference in 50 mL of Tris buffer.
- Measure and record the initial OCP for 10 minutes to establish a stable baseline.
- Add an aliquot of the Na₂S stock solution to the buffer to achieve a final concentration of 1-10 mM.
- Continuously monitor and record the OCP for at least 2 hours post-addition.
- (Optional) Post-experiment, analyze the electrode surface using Energy-Dispersive X-ray Spectroscopy (EDS) to confirm sulfide deposition [72].
- Data Analysis:
- Plot OCP versus time.
- Report the maximum negative shift in OCP (in mV) after sulfide addition. A significant drop (e.g., tens of mV) indicates susceptibility to sulfide fouling.
Table 2: Key Reagents for Fouling and Stability Experiments
| Reagent/Material | Function in Experiment | Example Application |
|---|---|---|
| Sodium Sulfide Nonahydrate (Na₂S·9H₂O) | Introduces sulfide ions for chemical fouling tests | Evaluating Ag/AgCl electrode stability [72] |
| Bovine Serum Albumin (BSA) | Simulates biofouling by proteins | Testing biomolecule adsorption on electrodes [72] |
| Tetradodecylammonium Chloride (TDAC) | Lipophilic salt in polymer membranes | Forming cation-exchange sites in S-REs [73] |
| Sodium Tetraphenylborate (TPB) | Anion-exchanger in polymer membranes | Forming anion-exchange sites in S-REs [73] |
| Poly(3,4-ethylenedioxythiophene) (PEDOT) | Conductive polymer for solid-contact layers | Ion-to-electron transduction in SC-ISEs and OECTs [74] [51] |
Workflow for Fouling Resistance Testing
The path to robust and reliable miniaturized potentiometric sensors is intrinsically linked to solving the dual challenges of reference electrode stability and fouling. While miniaturization introduces significant hurdles, the convergence of innovative materials—such as polymeric ion exchangers and nanocomposites—with novel device architectures like the pOECT and 3D-printing, provides a powerful toolkit for researchers. The experimental protocols outlined herein offer a standardized approach for benchmarking new designs. As the field progresses, the integration of these advanced strategies will be crucial for developing the next generation of point-of-care diagnostic tools, wearable monitors, and implantable sensors, ultimately bridging the gap between laboratory research and real-world clinical and environmental applications.
Potentiometry, the measurement of an electrochemical cell's potential under static conditions, is a fundamental quantitative method of analysis. The accuracy of this technique hinges on the precise determination of equilibrium constants, primarily through the analysis of data obtained via potentiometry [75]. The reliability of these constants—critical for defining the distribution of chemical species in multicomponent systems—is not merely a function of experimental execution but is profoundly dependent on the subsequent data processing and computational optimization [76]. Within the context of advanced research on potentiometric cell setup and components, understanding the limitations of data processing software and the impact of systematic experimental errors is paramount. This guide synthesizes current knowledge to provide researchers and drug development professionals with a robust framework for ensuring the reliability of their potentiometric analysis, from data acquisition to the final refinement of parameters.
Critical Evaluation of Potentiometric Data Processing Software
The selection of software for optimizing formation constants from potentiometric data is a critical step that can significantly influence research outcomes. A recent survey conducted within the NECTAR COST Action – Network for Equilibria and Chemical Thermodynamics Advanced Research critically evaluated the most commonly used software for this purpose [76]. The study processed a simulated titration dataset for a hypothetical hexaprotic acid using five different software packages to compare and discuss the optimized protonation constants.
A key finding was that the differences in the protonation constants estimated by the various tested software were not statistically significant [76]. This suggests that the core algorithms for constant optimization across established software are generally sound. However, the study also revealed that many of the commonly used software tools suffer from significant limitations, highlighting an urgent need for new, dedicated, and modern computational tools in the field [76]. This is particularly relevant for drug development professionals working with complex, multi-component biological systems, where software limitations could obscure critical thermodynamic information.
Software Performance and Limitations
The comparative analysis demonstrated that while software choice may not drastically alter the final constants under ideal conditions, the practical usability, ability to handle complex error structures, and flexibility for modern analytical needs vary substantially. Researchers must be aware that the software itself can be a source of limitation, and conclusions drawn from data analysis should be confirmed through multiple methods whenever possible [77]. The reliance on outdated software with limited capacity to account for complex real-world scenarios, such as varying ionic strength or specific systematic errors, represents a significant vulnerability in the data processing pipeline.
Managing Systematic Errors in Potentiometric Analysis
While software differences might be negligible under controlled conditions, the presence of systematic errors during titration experiments can profoundly affect the refined protonation constants [76]. The reliability of your analysis therefore depends more on identifying and mitigating these errors than on the choice of software itself. The following table summarizes the key sources of systematic error and their potential impact, based on controlled studies.
Table 1: Impact of Systematic Errors on Optimized Protonation Constants
| Source of Systematic Error | Description of Impact | Effect on Refined Parameters |
|---|---|---|
| Incorrect Calibration Parameters | Errors in calibration parameters (e.g., electrode standard potential, slope) directly propagate into the measured potential values. | Significant distortion of the optimized protonation constants [76]. |
| Variations in Ionic Strength | Changes in ionic strength during titration alter the activity coefficients of ions, violating the constant-medium assumption of many models. | Leads to inaccuracies in the calculated equilibrium constants [76]. |
| Inaccurate Analytical Concentrations | Errors in the known total concentrations of reagents (titrant or titrand) introduce a fundamental bias in the mass-balance equations. | Causes significant deviations in the refined constants [76]. |
The Primacy of Activity vs. Concentration
A fundamental principle often overlooked in practice is the necessity of using activities, not concentrations, in the Nernst equation for potentiometric calculations [75]. The equilibrium position of a reaction is a function of the activities of the reactants and products. While concentrations are easier to calculate and are sufficient for calculating redox titration curves to determine an end point, they are insufficient for accurate potentiometric analysis where the measured potential is directly used to calculate equilibrium constants [75]. The error introduced by assuming concentration and activity are identical is significant in potentiometry. A well-designed potentiometric method must either account for activity coefficients or be structured such that the difference between activity and concentration is minimized, for instance, by using a high and constant ionic background electrolyte [75].
Experimental Protocol for Reliable Potentiometric Titration
To ensure the collection of high-quality data, a detailed and rigorous experimental protocol must be followed. The following workflow outlines the key stages, from initial setup to data collection, which are crucial for minimizing both random and systematic errors.
Diagram 1: Potentiometric Titration Experimental Workflow
Detailed Methodological Steps
- Equipment Preparation and Calibration: Assemble the potentiometric cell, ensuring the reference electrode has a stable and known potential, and the indicator electrode (e.g., glass pH electrode, ion-selective electrode) is properly conditioned. Calibrate the electrode system using standard buffer solutions of known activity. The accuracy of calibration parameters is critical, as errors here are a key source of systematic error [76].
- Solution Preparation with Ionic Strength Control: Precisely prepare the analyte and titrant solutions using gravimetric or volumetric methods with high-precision equipment. To control the impact of ionic strength, use an inert background electrolyte (e.g., KNO₃, NaClO₄) at a concentration high enough to ensure that the ionic strength remains relatively constant throughout the titration [76] [75]. This simplifies the data analysis by minimizing changes in activity coefficients.
- Titration Execution and Data Collection: Perform the titration in a thermostatted cell to maintain a constant temperature. Add the titrant in small, precise increments, allowing the system to reach equilibrium after each addition before recording the potential (mV) and volume. The "static" condition of potentiometry—where no current, or only negligible current, flows—must be maintained to keep the system's composition unchanged [75].
- Data Quality Assessment: Before proceeding to computational analysis, perform a preliminary check on the data. Plot the titration curve and look for signs of instability, such as excessive noise or irregular potential jumps not corresponding to titrant additions. If data quality is poor, re-evaluate the experimental setup, starting with re-calibration of the electrodes.
A Scientist's Toolkit: Essential Research Reagent Solutions
The following table details key reagents and materials essential for conducting a reliable potentiometric titration, particularly for studies involving protonation equilibria.
Table 2: Essential Reagents and Materials for Potentiometric Titration
| Reagent/Material | Function and Importance | Specification & Best Practices |
|---|---|---|
| Inert Background Electrolyte (e.g., KNO₃, NaClO₄) | Swamps the ionic strength of the solution, keeping activity coefficients relatively constant and simplifying data analysis by making concentration a good approximation for activity [75]. | Use high-purity grade. Concentration should be significantly higher than that of all reacting species. |
| Standard Buffer Solutions | Used for the precise calibration of the potentiometric electrode (e.g., pH electrode). Critical for establishing the relationship between measured potential and activity. | Use certified commercial buffers or prepare accurately from primary standards. |
| High-Purity Titrant (e.g., KOH, HCl, CO₂-free) | The reagent added to provoke the equilibrium change. Its concentration must be known with high accuracy. | Standardize against primary standards. Protect from atmospheric CO₂ if appropriate. |
| Inert Atmosphere (e.g., N₂ or Ar gas) | Excludes interfering gases from the titration vessel, most commonly O₂ (for redox titrations) and CO₂ (for acid-base titrations). | Bubble gas through the solution for a sufficient time before and during the titration. |
Data Processing and Computational Optimization Workflow
Once high-quality experimental data is acquired, the process of optimizing the formation constants begins. This involves an iterative cycle of model selection, parameter refinement, and validation. The logical flow of this computational process is outlined below.
Diagram 2: Data Processing and Optimization Logic
Stages of Computational Analysis
- Model Definition: Postulate a chemical model that includes all the likely species in solution (e.g., protonated forms of a ligand, metal complexes). This model is based on chemical intuition and the nature of the system under study.
- Parameter Refinement: Input the experimental data (volume, potential, known concentrations) into the chosen software. The software then performs a non-linear least-squares optimization, adjusting the provisional formation constants (logK values) to find the set that gives the best fit between the calculated and experimental titration curve [76].
- Model Validation and Error Testing: Critically assess the quality of the fit using statistical measures and residual analysis. A poor or biased fit often indicates an incorrect chemical model or the presence of unaccounted-for systematic errors [76]. If the model is unsatisfactory, the researcher must test for the influence of systematic errors, such as those listed in Table 1, or re-evaluate the proposed chemical model itself.
Guidelines for Data Acquisition and Treatment
Based on the critical evaluation of software and error analysis, the following integrated guidelines are recommended for ensuring reliable data generation and treatment [76]:
- Prioritize Calibration and Concentration Accuracy: Meticulous calibration of the electrode system and precise determination of all analytical concentrations are the most effective steps for minimizing systematic error.
- Control Ionic Strength: Always use a sufficiently high concentration of an inert background electrolyte to maintain a constant ionic medium. This simplifies the data model and improves the accuracy of the refined constants.
- Employ Robust Computational Practices. Do not accept software output uncritically. Use multiple software packages if possible to verify results. Be aware of the limitations of your chosen software and actively test for the influence of different systematic error sources on your refined parameters.
- Adopt a Holistic View. The entire process, from experimental design and solution preparation to computational model selection, is interconnected. A failure at any stage compromises the final result. Therefore, a rigorous, methodical approach and thorough documentation at every step are indispensable for producing reliable, publication-quality potentiometric data.
Assessing Analytical Performance and Strategic Fit
The evaluation of potentiometric sensors is a critical process in electroanalytical chemistry, underpinning their reliability for applications ranging from clinical diagnostics to environmental monitoring. The performance and practical utility of these sensors are quantitatively assessed through a set of key analytical parameters: sensitivity, detection limit, linear range, and response time. These metrics are not independent; they are intrinsically linked to the physical and chemical properties of the sensor's components, such as the ion-selective membrane, transducer layer, and electrode architecture [24]. A rigorous understanding of these parameters allows researchers to optimize sensor design, validate analytical methods, and ensure data quality. This guide provides an in-depth examination of these core parameters, supported by experimental data and methodologies, to serve as a foundational resource for scientific research and development.
Core Analytical Parameters and Performance Data
The following table summarizes the typical performance metrics for potentiometric sensors targeting different ions, as reported in recent scientific literature. These values illustrate the capabilities of modern sensor designs.
Table 1: Key Analytical Parameters for Recent Potentiometric Sensors
| Target Ion | Sensitivity (Slope, mV/decade) | Detection Limit | Linear Range (M) | Response Time (s) | Sensor Type / Key Material | Citation |
|---|---|---|---|---|---|---|
| Sodium (Na⁺) | 57.1 | 2.4 µM | 2.4 x 10⁻⁴ – 2.5 x 10⁻¹ | ~20 µV/h (drift) | Fully 3D-printed SC-ISE | [78] |
| Copper (Cu²⁺) | 29.6 ± 0.8 | 50 nM | 1 x 10⁻⁷ – 1 x 10⁻¹ | ~15 | Graphite CPE / Schiff base | [79] |
| Calcium (Ca²⁺) | 20 ± 0.3 | - | 1 x 10⁻⁴ – 1 x 10⁻³ | - | Conductive polymer / BAPTA | [12] |
| Lanthanum (La³⁺) | 19.5 – 21.0 | 1.0 µM | 1.0 x 10⁻⁶ – 1.0 x 10⁻² | 9 – 13 | CPE & SPE / β-diketone | [80] |
| Lead (Pb²⁺) | ~28 – 31 | As low as 10⁻¹⁰ M | 10⁻¹⁰ – 10⁻² | - | Various SC-ISEs | [81] |
Parameter Definitions and Experimental Determination
Sensitivity Sensitivity, often called the slope, is the cornerstone of a sensor's quantitative response. It is measured in millivolts per decade (mV/decade) of ion activity and represents the change in electrode potential for a tenfold change in the target ion's concentration [24]. The theoretical ideal, or Nernstian slope, is approximately 59.16 mV/decade for a monovalent ion and 29.58 mV/decade for a divalent ion at 25 °C. Experimentally, sensitivity is determined as the slope of the linear portion of the calibration curve, which is a plot of the measured potential (E) versus the logarithm of the ion activity (log a) [24]. Values close to the theoretical Nernstian limit indicate a well-functioning, reversible electrode process.
Detection Limit The detection limit (LOD) defines the lowest ion activity that can be reliably distinguished from the background signal or noise. It is a critical parameter for trace analysis. According to IUPAC recommendations, the LOD is determined from the calibration curve by finding the intersection of the two extrapolated linear segments: the super-Nernstian response region at very low concentrations and the linear Nernstian response region [80]. In practice, for sensors with a well-defined linear range, the limit of quantification (LOQ) is also calculated, representing the lowest concentration that can be quantified with acceptable accuracy and precision, often taken as 1.65 x 10⁻⁷ M in the case of the Cu(II) sensor [79].
Linear Range The linear range, or dynamic range, is the concentration interval over which the sensor's response (potential) is directly proportional to the logarithm of the ion activity, adhering to the Nernst equation [24]. This range is bounded at the lower end by the detection limit and at the upper end by a saturation effect where the slope deviates from linearity. A broad linear range, such as the 6-order-of-magnitude range demonstrated by the Cu(II) sensor [79], is highly desirable as it allows for the analysis of samples with widely varying concentrations without requiring dilution or pre-concentration.
Response Time Response time is a measure of how quickly a sensor reaches a stable potential after a change in the sample solution's ion activity. It is a crucial parameter for applications requiring real-time or high-throughput monitoring. The response time is typically reported as the time required for the electrode to achieve a stable potential (e.g., within ±0.1 mV of the final value) after immersion in a sample or after a known concentration change [79]. Fast response times, on the order of seconds as seen with the La(III) and Cu(II) sensors [79] [80], indicate favorable ion-exchange kinetics at the membrane-sample interface.
Experimental Protocols for Parameter Evaluation
A standardized experimental workflow is essential for the consistent and accurate characterization of potentiometric sensors. The following protocols detail the key methodologies.
Sensor Calibration and Data Plotting
The primary experiment for determining sensitivity, linear range, and detection limit is the construction of a calibration curve.
- Solution Preparation: Prepare a series of standard solutions of the primary ion, spanning a concentration range that covers the expected detection limit to beyond the point of saturation (e.g., from 1 x 10⁻⁷ M to 1 x 10⁻¹ M). Use a constant, appropriate ionic strength background adjusted with an electrolyte like NaCl or KNO₃.
- Potential Measurement: Immerse the potentiometric sensor (working electrode) and a stable reference electrode (e.g., Ag/AgCl) in each standard solution under stirring. Measure the equilibrium potential (EMF) for each concentration using a high-impedance voltmeter.
- Data Analysis: Plot the measured EMF (mV) against the negative logarithm of the primary ion activity (-log a_I). The activity can be approximated by concentration for initial characterization. The linear section of this plot is fitted using linear regression. The slope of this line is the sensitivity, and the concentration range over which this linear fit holds is the linear range.
- Determining LOD: On the calibration curve, identify the point of intersection between the extrapolated linear segment and the extrapolated low-concentration non-linear segment. The concentration corresponding to this intersection point is the experimental detection limit [80].
Selectivity Coefficient Determination
Selectivity is arguably the most critical property of an ion-selective electrode after sensitivity, as it defines the sensor's ability to function in complex samples. The selectivity coefficient ((K_{IJ}^{pot})) can be determined using several standardized methods:
- Separate Solution Method (SSM): Measure the EMF of the sensor in separate solutions of the primary ion (I) and an interfering ion (J), both at the same activity (e.g., 0.001 M). The selectivity coefficient is then calculated using a modified Nicolsky-Eisenman equation [79] [12].
- Fixed Interference Method (FIM): Measure the EMF of the sensor in a series of solutions where the activity of the primary ion varies, but the background concentration of a specific interfering ion (J) is held constant. The detection limit for the primary ion in the presence of this interferent is used to calculate (K_{IJ}^{pot}) [79].
Response Time Measurement
The experimental protocol for measuring response time involves making a step-change in concentration and monitoring the potential.
- Setup: The sensor and reference electrode are placed in a continuously stirred solution of a specific concentration.
- Step Change: A small volume of a highly concentrated standard is swiftly added to the solution to achieve a known, higher concentration (e.g., a tenfold increase).
- Recording: The potential is recorded at a high sampling rate (e.g., one measurement per second) from the moment of addition.
- Analysis: The response time is typically reported as the time taken for the potential to reach 90% or 95% of the total steady-state potential change, or for the potential drift to fall below a specific threshold, such as 20 µV/h as used for stability assessment [78].
Workflow for Potentiometric Sensor Testing
The following diagram illustrates the logical sequence and relationships between the key experimental procedures described in the protocols.
Research Reagent Solutions for Potentiometric Sensors
The performance parameters discussed are directly governed by the materials used in sensor construction. The table below details key reagents and their functions in a typical ion-selective electrode.
Table 2: Essential Materials and Their Functions in Potentiometric Sensors
| Reagent Category | Example Compounds | Primary Function | Impact on Analytical Parameters |
|---|---|---|---|
| Ionophore | Valinomycin (K⁺), BAPTA (Ca²⁺), Schiff bases (Cu²⁺), β-diketones (La³⁺) [12] [80] | Selective recognition and binding of the target ion. | Primarily determines selectivity. Chemical structure influences complexation strength and kinetics, affecting linear range and response time. |
| Polymer Matrix | Poly(vinyl chloride) - PVC, Polyurethane, Acrylics [53] | Serves as the structural backbone of the sensing membrane, hosting other components. | Influences diffusion coefficients and component leaching, directly impacting long-term stability, response time, and potential drift. |
| Plasticizer | o-Nitrophenyl octyl ether (o-NPOE), Dioctyl sebacate (DOS), Tricresyl phosphate (TCP) [79] [80] | Imparts flexibility and modulates the membrane's dielectric constant and viscosity. | Critical for achieving Nernstian sensitivity and fast response time. Can influence ionophore selectivity and detection limit. |
| Ion Exchanger | Salt tetraphenylborate derivatives, Lipophilic salts | Provides initial ionic sites in the membrane, ensuring permselectivity and electroneutrality during ion exchange. | Prevents analyte extraction and ensures correct sensitivity (slope). Its concentration can affect the detection limit. |
| Transducer Material | Carbon-infused PLA, Polythiophenes, Poly(3,4-ethylenedioxythiophene) (PEDOT) [78] [12] [51] | Converts an ionic signal from the membrane into an electronic signal for measurement. | A high-capacity, hydrophobic transducer minimizes potential drift and water layer formation, crucial for stable detection limits and long-term performance [78]. |
| Solvent | Tetrahydrofuran (THF), Cyclohexanone [80] | Dissolves membrane components to create a homogeneous cocktail for membrane casting. | Affects membrane morphology during solvent evaporation, thereby influencing uniformity and response time. "Green" alternatives are being explored for biocompatibility [53]. |
The rigorous evaluation of sensitivity, detection limit, linear range, and response time provides a comprehensive picture of a potentiometric sensor's analytical performance. As demonstrated by recent advancements in solid-contact electrodes and novel ionophores, the optimization of these parameters is a multi-faceted endeavor that hinges on the careful selection and integration of sensor materials. The experimental protocols and foundational knowledge outlined in this guide provide a standardized framework for researchers to characterize and validate new sensor designs. By systematically applying these evaluation criteria, scientists can continue to push the boundaries of sensitivity, selectivity, and robustness, enabling the development of next-generation potentiometric sensors for demanding applications in healthcare, environmental science, and industrial process control.
The performance of ion-selective electrodes (ISEs) is fundamentally governed by their ability to distinguish the target ion from other interfering ions in a sample solution. This characteristic, known as selectivity, is quantitatively expressed through the potentiometric selectivity coefficient ((K{A,B}^{pot})) [82]. This coefficient defines the ability of an ion-selective electrode to distinguish a particular ion (the primary ion, A) from others (interfering ions, B) [82]. The selectivity coefficient is a critical parameter in validating potentiometric methods for pharmaceutical analysis, environmental monitoring, and clinical diagnostics, as it directly impacts the accuracy and reliability of measurements in complex matrices such as biological fluids and drug formulations. A smaller value of (K{A,B}^{pot}) indicates a greater preference of the electrode for the principal ion A over the interfering ion B, which is essential for achieving accurate measurements in real-world samples where multiple ions are present [82].
The theoretical foundation for describing the response of an ISE in the presence of interfering ions is the Nikolsky-Eisenman equation, an extension of the Nernst equation [83]: [ E = const. + \frac{RT}{ziF} \ln\left( ai + \sum{j \neq i}{K{i,j}^{pot}aj^{zi/zj}} \right) ] where (E) is the measured potential, (const.) is a constant potential term, (R) is the gas constant, (T) is the absolute temperature, (F) is the Faraday constant, (zi) and (zj) are the charges of the primary ion (I) and interfering ion (J), respectively, (ai) and (aj) are their activities, and (K{i,j}^{pot}) is the selectivity coefficient [83]. This equation forms the basis for understanding and quantifying the potentiometric response in mixed ion solutions.
IUPAC-Recommended Methods for Determining Selectivity Coefficients
The International Union of Pure and Applied Chemistry (IUPAC) provides standardized methods for determining selectivity coefficients to ensure consistency and comparability of data reported in the literature. IUPAC recommends the Fixed Interference Method (FIM) as the preferred procedure, while the Separate Solution Method (SSM) is also recognized but considered less desirable [82]. It is crucial to note that the activities of the primary ion, A, and the interfering ion, B, at which (K_{A,B}^{pot}) is determined must always be specified, as the value can be concentration-dependent [82].
Fixed Interference Method (FIM)
The Fixed Interference Method involves measuring the potential of the ISE in a series of solutions where the activity of the primary ion, A, is varied, while the background of the interfering ion, B, is maintained at a constant, fixed activity [82]. The resulting potential values are plotted against the logarithm of the primary ion activity. The plot typically shows a linear Nernstian region at higher primary ion activities and a non-linear region at lower activities where the interference effect becomes significant. The lower limit of detection is defined as the point where the deviation from the linear Nernstian response is (17.8/z_i) mV [84]. The selectivity coefficient is then determined from the intersection of the extrapolated linear portions of the graph, and its value is calculated using the Nikolsky-Eisenman equation. This method is considered more relevant for practical applications because it simulates real sample conditions where an interfering ion is present at a relatively constant background level.
Separate Solution Method (SSM)
In the Separate Solution Method, the potential of the ISE is measured separately in two different solutions: one containing only the primary ion, A, at a specified activity, and another containing only the interfering ion, B, at an identical activity [82] [83]. The potential values recorded in these single-ion solutions are used to calculate the selectivity coefficient using a modified form of the Nernst equation. While this method is experimentally simpler, it has notable drawbacks. It assumes that the electrode exhibits a Nernstian response to both the primary and the interfering ions, an assumption that may not hold true for all ion pairs [83]. Consequently, the SSM may yield selectivity coefficients that differ from those obtained in mixed solutions, potentially leading to inaccurate estimates of interference in real samples. IUPAC, therefore, considers SSM less desirable than FIM [82].
Table 1: Comparison of IUPAC-Recommended Methods for Determining Selectivity Coefficients
| Method | Principle | Procedure | Advantages | Limitations |
|---|---|---|---|---|
| Fixed Interference Method (FIM) | Measures response to primary ion in a fixed background of interferent. | Primary ion activity is varied while interferent activity is kept constant. Potential vs. log(a_A) is plotted. | Simulates real-sample conditions; Recommended by IUPAC [82]. | More experimentally complex. |
| Separate Solution Method (SSM) | Compares electrode response in separate solutions of primary and interfering ions. | Measures potential in solution of primary ion only, then in solution of interfering ion only, both at same activity. | Experimentally simple; Provides a quick estimate. | Can yield unrealistic selectivity values; Less desirable per IUPAC [82] [83]. |
The Matched Potential Method (MPM) and Alternative Approaches
Due to challenges in applying the traditional Nikolsky-Eisenman equation to ions of different charge numbers, the Matched Potential Method (MPM) was proposed. This method is considered an alternative approach for reporting selectivity coefficients, particularly when the primary and interfering ions have unequal charges [83]. The MPM determines the selectivity coefficient by finding the activity of an interfering ion, J, required to produce the same potential change as a known change in the activity of the primary ion, I.
However, practical studies have revealed significant limitations of the MPM. Research on magnesium-selective membrane electrodes found the MPM to be "inaccurate, inconsistent, and not practical" [83]. A major issue is the method's sensitivity to whether concentrations or activities are used in the calculation; using concentrations can lead to uninterpretable results, as shown by downward-bending curves for highly discriminated ions [83]. Other methods developed to address the shortcomings of SSM and FIM include the Varying Interference Method (VIM) and the Specific Application Method (SAM), which uses an iterative least-squares process to fit experimental data [83].
Experimental Protocols and Practical Considerations
Detailed Protocol for the Fixed Interference Method
The following protocol outlines the steps for determining a selectivity coefficient using the IUPAC-recommended FIM, based on studies with ion-selective electrodes [83].
Preparation of Solutions:
- Prepare a primary ion stock solution of known concentration and activity.
- Prepare an interfering ion stock solution of known concentration and activity.
- Create a series of calibration solutions. In each solution, maintain the activity of the interfering ion (B) at a constant, fixed level (e.g., 0.01 M). Vary the activity of the primary ion (A) across a range, typically from low (e.g., 10⁻⁷ M) to high (e.g., 10⁻² M) values. Ensure all solutions have a constant ionic strength using an inert electrolyte like NaCl or KNO₃.
Potential Measurement:
- Immerse the ion-selective electrode and an appropriate reference electrode (e.g., Ag/AgCl) in each solution.
- Measure the equilibrium potential of the cell for each solution in the series. Ensure that the measurement is taken under static conditions with negligible current flow [6]. The response time should be sufficient to reach a stable potential, often defined as a drift of less than 0.1 mV per minute.
Data Analysis and Calculation:
- Plot the measured potential (E) versus the logarithm of the primary ion activity (log a_A).
- Identify the linear (Nernstian) portion of the curve at higher primary ion activities and the limiting potential region at lower activities where the interferent dominates.
- The selectivity coefficient, (K{A,B}^{pot}), is determined from the activity of the primary ion, aA, at the intersection point of the extrapolated linear regions of the plot. For a primary ion and an interfering ion with the same charge, (z), the coefficient is calculated as: [ K{A,B}^{pot} = \frac{aA}{aB} ] where aB is the fixed activity of the interfering ion.
Critical Factors Influencing Selectivity Measurements
Several factors must be carefully controlled to obtain reliable and reproducible selectivity coefficients:
- Ion Activity vs. Concentration: Potentiometric sensors respond to ion activity, not concentration [84]. Using concentrations instead of activities can lead to significant errors and inconsistent results [83]. Activity coefficients should be calculated, and a constant ionic strength must be maintained across all test solutions using an inert background electrolyte.
- Membrane Composition and Thermodynamic Equilibrium: The selectivity is intrinsically linked to the membrane's composition, including the ionophore, ion-exchanger, polymer matrix, and plasticizer [53] [83]. The definition of the selectivity coefficient assumes a thermodynamic equilibrium between the sample solution and the membrane. However, non-equilibrium conditions, such as ion fluxes or the formation of diffusion potentials within the membrane, can lead to EMF drift and affect the measured coefficient [83].
- Charge of Ions: The Nikolsky-Eisenman equation requires knowing the charges of both the primary and interfering ions (zi and zj). The selectivity coefficients for ions with different charges cannot be directly compared or exchanged [83]. This is a primary reason why alternative methods like the MPM were developed, though they come with their own limitations.
The Scientist's Toolkit: Essential Materials and Reagents
The development and evaluation of ion-selective electrodes rely on a specific set of materials and reagents. The table below details key components used in the construction of polymeric membrane ISEs and the measurement of their selectivity, as referenced in the studies [53] [83] [12].
Table 2: Key Research Reagent Solutions and Materials for Potentiometric Sensor Development
| Component | Function | Common Examples |
|---|---|---|
| Ionophore | Key sensing component; selectively binds to the target ion, imparting selectivity to the membrane. | Valinomycin (for K⁺), ETHT 5506 (for Mg²⁺), BAPTA-based monomers (for Ca²⁺) [53] [83] [12]. |
| Ion-Exchanger | Provides ionic sites within the membrane to maintain electroneutrality and govern the extraction of ions. | Potassium tetrakis(4-chlorophenyl)borate (KTpClPB) [83]. |
| Polymer Matrix | Forms the bulk of the sensing membrane, housing the ionophore and ion-exchanger. | Poly(vinyl chloride) (PVC), polyurethanes, methacrylate-based copolymers [53] [12]. |
| Plasticizer | Imparts flexibility and viscosity to the polymer membrane; can influence dielectric constant and ion extraction. | Bis(2-ethylhexyl sebacate) (DOS), 2-nitrophenyl octyl ether (o-NPOE) [53]. |
| Membrane Solvent | Dissolves membrane components for casting. Toxicity is a concern for biocompatibility. | Tetrahydrofuran (THF), "green" solvents (e.g., cyclohexanone) [53] [83]. |
| Inert Electrolyte | Used in sample solutions to maintain a constant ionic strength, ensuring constant activity coefficients. | Sodium chloride (NaCl), potassium nitrate (KNO₃). |
Visualization of Method Workflows
The following diagram illustrates the logical sequence and key decision points in the process of determining a potentiometric selectivity coefficient, incorporating the IUPAC-recommended methods and critical considerations.
The accurate determination of the potentiometric selectivity coefficient is a cornerstone in the development and application of reliable ion-selective electrodes for research and analysis. The IUPAC-provided framework, with its clear recommendation for the Fixed Interference Method, offers a standardized path for obtaining meaningful and comparable data. While alternative methods like the Separate Solution and Matched Potential Methods exist, awareness of their specific limitations and appropriate contexts for use is crucial for the practicing scientist. A thorough understanding of the underlying principles of the Nikolsky-Eisenman equation, coupled with meticulous control of experimental conditions—particularly the use of ion activities and a constant ionic background—ensures that the reported selectivity coefficients truly reflect the sensor's performance. This rigorous approach is indispensable for advancing the use of potentiometric sensors in challenging fields such as trace-level analysis, continuous monitoring in biological systems, and quality control in pharmaceutical drug development.
The selection of an appropriate analytical technique is a critical decision in chemical research and development, with profound implications for data quality, operational efficiency, and methodological relevance. While inductively coupled plasma mass spectrometry (ICP-MS), atomic absorption spectrometry (AAS), and anodic stripping voltammetry (ASV) represent established "gold standard" methods for elemental analysis, significant advancements in potentiometric sensors have positioned them as compelling alternatives for specific applications. This technical guide provides an in-depth comparison of these techniques, focusing on their fundamental principles, analytical performance, and suitability for various research contexts, particularly within pharmaceutical development and biomedical research.
The resurgence of interest in potentiometric sensors stems from revolutionary improvements in their design and capabilities. Modern potentiometric sensors have transcended traditional limitations, achieving true trace-level analysis at sub-nanomolar concentrations (low parts per trillion) [84]. Furthermore, the integration of innovative manufacturing approaches like 3D printing has enabled customizable, low-cost, and rapid prototyping of analytical devices, while the development of wearable sensors opens new possibilities for continuous monitoring in clinical and athletic performance settings [22] [24] [85]. This evolution demands a fresh benchmarking against established techniques to guide researchers in selecting the most appropriate methodology for their specific analytical challenges.
Fundamental Principles and Measurable Quantities
A critical differentiator between these techniques lies in the specific chemical quantity each method measures, which directly influences data interpretation and applicability.
Table 1: Fundamental Comparison of Analytical Techniques
| Technique | Measured Quantity | Key Principle | Sample Form |
|---|---|---|---|
| Potentiometry | Activity of free, uncomplexed ions [84] | Potential difference between electrodes under zero-current conditions [22] | Liquid (including colored/turbid) [22] |
| AAS/ICP-MS | Total elemental concentration [84] | Atomization and atom detection (absorption/emission or mass spectrometry) | Liquid (typically clear solutions after digestion) [86] [87] |
| Anodic Stripping Voltammetry (ASV) | Concentration of chemically available (labile) analytes [84] | Electrolytic preconcentration followed by anodic dissolution | Liquid |
| Titration | Total concentration of reactive species | Quantitative reaction with titrant | Liquid |
The distinction between ion activity (potentiometry), labile concentration (ASV), and total concentration (AAS/ICP-MS) is not merely academic but has profound practical implications. For instance, in bioavailability or toxicity studies, the free ion activity measured by potentiometry often provides a more accurate predictor of biological response than the total concentration measured by spectrometric techniques [84]. Similarly, ASV detects electroactive species that are chemically available, providing complementary information about metal speciation and complexation.
This fundamental difference in measured quantities means that the choice of analytical technique must be guided by the specific research question. For regulatory compliance monitoring where total metal content is regulated, ICP-MS or AAS may be mandatory. However, for understanding physiological responses or environmental bioavailability, potentiometry or ASV may provide more relevant data [84].
Analytical Performance Comparison
Limits of Detection and Quantification
Modern potentiometric sensors have achieved remarkable detection capabilities that are competitive with established techniques for many analytes.
Table 2: Comparison of Detection Capabilities for Selected Analytes
| Analyte | Technique | Reported LOD/LOQ | Notes |
|---|---|---|---|
| Mercury (Hg) | ICP-MS | Method LOQ: 1.9 μg/kg [86] | Requires sample treatment |
| CV-ICP-OES | Method LOQ: 165 μg/kg [86] | Limited for low-level samples | |
| TDA AAS | Method LOQ: 0.35 μg/kg [86] | Direct sampling, no pretreatment | |
| Potentiometry | LOD in μM range [22] | For Hg²⁺ ions | |
| Lead (Pb²⁺) | Potentiometry | 8 × 10⁻¹¹ M [84] | With optimized membranes |
| Copper (Cu²⁺) | Potentiometry | 10⁻⁹ M [84] | Solid-state, rotating electrode |
| Cadmium (Cd²⁺) | Potentiometry | 10⁻¹⁰ M [84] | With NTA in inner solution |
| Gold (Au) | ICP-MS | Varies with pretreatment [87] | Requires digestion/enrichment |
| Potentiometry | Limited data | Not commonly reported for Au |
A crucial consideration when comparing these values is the unique definition of Limit of Detection (LOD) in potentiometry. According to IUPAC recommendations, the potentiometric LOD is defined as the cross-section of the two linear parts of the response function, which corresponds to a deviation of 17.8/zᵢ mV from the final potential value [84]. If calculated according to the conventional definition used for other techniques (three times the standard deviation of the noise), potentiometric LODs would be approximately two orders of magnitude lower [84]. This definitional difference must be considered when making direct comparisons between techniques.
Key Analytical Parameters
Table 3: Comprehensive Comparison of Analytical Performance Characteristics
| Parameter | Potentiometry | ICP-MS | AAS | Anodic Stripping Voltammetry |
|---|---|---|---|---|
| Sensitivity | ~59 mV/decade (Nernstian) [24] | Very high (ppt-ppq) | High (ppb-ppm) | Extremely high for electroactive metals |
| Selectivity | High with optimized ionophores [22] | Excellent (mass resolution) | Good | Moderate to good |
| Multi-element | Limited (arrays possible) | Excellent | Limited | Moderate (sequential) |
| Sample Volume | μL to mL [22] | mL (after digestion) | mL | mL |
| Analysis Time | Seconds to minutes [22] | Minutes per sample | Minutes per sample | Minutes (includes deposition) |
| Portability | Excellent (wearable formats) [85] | Laboratory-bound | Laboratory-bound | Moderate (portable systems available) |
| Cost | Low | Very high | Moderate | Low to moderate |
The performance characteristics highlight the complementary strengths of each technique. ICP-MS provides unparalleled sensitivity and multi-element capability but requires significant infrastructure investment and operational expertise. Potentiometry offers unique advantages in portability, cost-effectiveness, and capability for continuous monitoring, particularly with the advent of solid-contact ion-selective electrodes (SC-ISEs) that eliminate the need for liquid inner contacts [22] [85].
Experimental Protocols and Methodologies
Potentiometric Sensor Fabrication and Measurement
Protocol 1: Fabrication of Solid-Contact Ion-Selective Electrodes
- Electrode Preparation: Clean the conductive substrate (glassy carbon, gold, or printed electrode) thoroughly.
- Solid-Contact Layer Application:
- Option A (Conducting Polymers): Electropolymerize PEDOT or polypyrrole onto the substrate, or drop-cast a solution of the polymer [85].
- Option B (Carbon-based): Deposit carbon nanotubes, graphene, or other nanostructured carbon materials to create a high double-layer capacitance interface [22] [85].
- Ion-Selective Membrane Preparation: Prepare membrane cocktail containing:
- Membrane Deposition: Apply the membrane cocktail over the solid-contact layer by drop-casting or spin-coating, and allow solvent evaporation (typically 24-48 hours).
Protocol 2: Potentiometric Measurement Procedure
- Calibration: Measure potential in series of standard solutions with known activities, starting from low to high concentration.
- Sample Measurement: Immerse the working and reference electrodes in the sample solution under zero-current conditions.
- Potential Recording: Use a high-impedance voltmeter (>10¹² Ω) to record the equilibrium potential [24].
- Data Analysis: Construct calibration curve of EMF vs. log(aᵢ) and determine sample concentration from the regression equation.
Reference Technique Protocols
Protocol 3: ICP-MS Analysis for Trace Metals (e.g., Hg in Sediments) [86]
- Sample Digestion: Use microwave digestion with HNO₃/HCl for complete dissolution.
- Instrument Optimization: Tune ICP-MS with setup solution containing Be, Ce, Fe, In, Li, Mg, Pb, U.
- Interference Management: Employ collision/reaction cell technology or mathematical corrections for polyatomic interferences.
- Quantification: Use external calibration with internal standards (e.g., ¹¹⁵In, ¹⁸⁷Re) to correct for matrix effects and instrumental drift.
Protocol 4: TDA AAS for Direct Mercury Analysis [86]
- Sample Introduction: Weigh solid sample directly into sample boat (no digestion required).
- Thermal Decomposition: Heat sample through temperature program (drying, decomposition, combustion).
- Amalgamation: Collect released Hg on gold amalgamator.
- Measurement: Heat amalgamator to release atomic Hg for AAS detection at 253.7 nm.
The Scientist's Toolkit: Key Research Reagent Solutions
Table 4: Essential Materials for Potentiometric Sensor Development
| Component | Function | Examples | Considerations |
|---|---|---|---|
| Ionophores | Selective target ion recognition [53] | Valinomycin (K⁺), calcimycin (Ca²⁺), synthetic carriers | Toxicity concerns for biomedical applications [53] |
| Polymer Matrices | Membrane structural support [53] | PVC, polyurethane, silicone rubber | Biocompatibility, leaching potential [53] |
| Plasticizers | Membrane flexibility and viscosity control [53] | DOS, oNPOE, BEN | Potential toxicity; alternatives like CITROFOL for biocompatible sensors [53] |
| Solid-Contact Materials | Ion-to-electron transduction [85] | PEDOT, polypyrrole, carbon nanotubes, graphene | Hydrophobicity, capacitance, long-term stability [22] [85] |
| Lipophilic Additives | Anionic sites for cation exchangers [53] | NaTFPB, KTpCIPB | Membrane resistance and selectivity optimization |
Application-Specific Considerations
Pharmaceutical and Biomedical Applications
In pharmaceutical development, compliance with regulatory guidelines such as ICH Q2(R2) and ICH Q14 for analytical method validation is paramount [88]. The choice of technique must consider validated parameters including accuracy, precision, specificity, linearity, range, LOD, LOQ, and robustness.
Potentiometric sensors offer distinct advantages for therapeutic drug monitoring (TDM), particularly for pharmaceuticals with narrow therapeutic indices [22]. Their ability to directly measure ion activities in complex biological matrices like sweat, saliva, and blood makes them ideal for point-of-care testing and continuous monitoring [22] [85]. The emergence of wearable potentiometric sensors enables real-time monitoring of electrolytes (Na⁺, K⁺, Ca²⁺, Cl⁻) and selected pharmaceuticals, facilitating personalized medicine approaches [22].
For biocompatibility requirements in wearable or implantable sensors, traditional membrane components (plasticizers, ionophores) raise concerns about leaching and toxicity [53]. Research efforts are focusing on covalent bonding of membrane components and using green materials to improve sensor safety and stability for biomedical applications [53].
Environmental and Industrial Applications
For environmental monitoring, the speciation capabilities of potentiometry provide significant advantages. Studies have successfully employed potentiometric sensors for speciation of lead and copper ions in drinking water, measurement of free copper in seawater, and investigation of cadmium ion uptake by plant roots as a function of speciation [84].
The integration of 3D printing technologies has revolutionized sensor fabrication, enabling rapid prototyping of customized electrode housings, solid contacts, reference electrodes, and microfluidic systems [22] [24]. Techniques like fused deposition modeling (FDM) and stereolithography (SLA) offer improved flexibility and precision in manufacturing ion-selective electrodes while decreasing development time [22].
The benchmarking analysis reveals that potentiometric sensors represent a mature analytical technology that competes favorably with established techniques across numerous applications. While ICP-MS remains unsurpassed for ultra-trace multi-element analysis and AAS provides robust, cost-effective quantitative analysis, potentiometry offers unique capabilities for direct activity measurements, miniaturization, portability, and continuous monitoring.
The dramatic improvements in detection limits, selectivity, and reliability of potentiometric sensors, coupled with innovative manufacturing approaches like 3D printing and the development of wearable platforms, have positioned this technology as a compelling choice for modern analytical challenges. Researchers should consider the fundamental differences in measured quantities—ion activity versus total concentration—when selecting the most appropriate technique for their specific application.
For pharmaceutical and biomedical applications particularly, potentiometric sensors offer unprecedented opportunities for therapeutic drug monitoring, point-of-care diagnostics, and continuous health monitoring through wearable devices. As research continues to address challenges in biocompatibility and long-term stability, the integration of potentiometric sensors into mainstream analytical practice is expected to accelerate, providing researchers with powerful tools to address complex analytical problems.
Within the advancing field of potentiometric cell research, the transition of sensors from controlled laboratory settings to real-world applications necessitates rigorous validation in complex matrices. For potentiometric sensors intended for biomedical or environmental monitoring, demonstrating reliable performance in fluids such as blood, plasma, urine, or environmental samples is a critical milestone [53]. This process establishes that the sensor maintains its analytical performance—including selectivity, sensitivity, and stability—when faced with challenging, non-ideal conditions. Such validation is a cornerstone for the development of credible point-of-need, wearable, and implantable diagnostic devices [53]. This guide provides an in-depth technical framework for validating the performance of potentiometric sensors within complex biological and environmental matrices, contextualized within broader potentiometric cell setup and components research.
Core Principles of Potentiometric Sensor Validation
Validation confirms that an analytical method is suitable for its intended purpose. For potentiometric sensors in complex matrices, this involves assessing key performance parameters to ensure that the sensor's output (the potential) accurately reflects the activity of the target ion, even in the presence of numerous interfering substances.
The core parameters required for a comprehensive validation are summarized in the table below.
Table 1: Key Performance Parameters for Potentiometric Sensor Validation
| Validation Parameter | Definition & Target | Experimental Approach |
|---|---|---|
| Selectivity | Sensor's ability to respond to the primary ion in the presence of interfering ions. Target: Log KpotA,B << 0 (highly negative) for key interferents. | Separate Solution Method (SSM) or Fixed Interference Method (FIM) [53]. |
| Sensitivity (Slope) | Change in electrode potential per decade change in ion activity. Target: Close to Nernstian slope (e.g., ~59.2 mV/decade for monovalent ions at 25°C). | Calibration curve in standard solutions and complex matrix. |
| Limit of Detection (LOD) | Lowest ion activity detectable by the sensor. | Calculated from the intersection of the two linear segments of the calibration curve. |
| Accuracy & Recovery | Closeness of the measured value to the true value. | Spike-and-recovery experiments in the complex matrix; target: 85-115% recovery [89]. |
| Working Range | The activity range over which the sensor exhibits a linear Nernstian response. | Determined from the linear portion of the calibration curve. |
| Response Time | Time required to reach a stable potential (e.g., 95% of final value) after a step change in activity. | Measured after successive dilutions or standard additions. |
| Stability & Drift | Change in sensor output over time under constant conditions. | Monitor potential of a standard solution over hours/days. |
Critical Considerations for Biocompatible Sensor Design
The validation of sensors for biological fluids (e.g., for wearable or implantable devices) introduces the mandatory requirement of biocompatibility. This encompasses not only the sensor's analytical performance but also its safety and non-toxicity when in contact with living tissues [53].
Mitigating Leaching and Toxicity
Classical potentiometric sensor membranes comprise a polymer (e.g., PVC), a plasticizer, an ionophore, and an ion exchanger. Long-term contact with biological samples can cause these components to leach out, compromising both sensor function and biological safety [53].
- Ionophores: While valinomycin is a highly successful ionophore for potassium, its inherent biological toxicity is a significant concern [53]. Strategies to mitigate this include covalently binding the ionophore to the polymer matrix to prevent leaching [53].
- Plasticizers: Common plasticizers like bis(2-ethylhexyl sebacate) (DOS) and 2-nitrophenyl octyl ether (oNPOE) can constitute over 60% of the membrane mass and are prone to leaching [53]. Research into alternative, non-leaching plasticizers or plasticizer-free membranes is ongoing.
- Polymers and Solvents: Green chemistry principles advocate for replacing toxic solvents (e.g., Tetrahydrofuran) used in membrane fabrication with less toxic or bio-based alternatives [53].
The Reference Electrode Challenge
A stable reference electrode is crucial for accurate potentiometry. In complex matrices, the reference electrode must also be robust. Biocompatibility is a key concern, as common Ag/AgCl reference elements can be toxic, and commercial inks may contain a high silver load [53]. The development of fully biocompatible and stable reference electrodes for in-vivo applications remains an active area of research [53].
Experimental Protocols for Validation
This section outlines detailed methodologies for key experiments in the validation workflow.
Protocol for Selectivity Coefficient Determination
The Separate Solution Method (SSM) is a common technique for determining the selectivity coefficient (Log KpotA,B).
- Preparation: Prepare separate solutions of the primary ion (A) and the interfering ion (B). The concentration should be identical (e.g., 0.01 M).
- Measurement: Measure the electrode potential in each solution, denoted as EA and EB.
- Calculation: For ions of the same charge (zA = zB), calculate the selectivity coefficient using the following formula, where S is the empirical slope of the calibration curve:
Log K<sup>pot</sup><sub>A,B</sub> = (E<sub>B</sub> - E<sub>A</sub>) / S
Protocol for Spike-and-Recovery in Biological Fluids
This protocol assesses accuracy and the effect of the sample matrix, as demonstrated in the determination of norfloxacin in plasma [89].
- Sample Preparation: Obtain biological fluid (e.g., plasma, urine). Deproteinize the sample, for instance, by mixing 1 mL of plasma with 6 mL of acetonitrile and centrifuging at 3500 rpm for 10 minutes [89].
- Spiking: Take several aliquots of the prepared sample. Spike them with known concentrations of the target analyte (e.g., 1, 2, and 3 µg/mL).
- Analysis: Analyze the spiked samples using the potentiometric sensor and record the measured potential. Convert the potential to concentration/activity using a pre-established calibration curve.
- Recovery Calculation: Calculate the percentage recovery for each spike level using:
% Recovery = (Measured Concentration / Spiked Concentration) * 100Recoveries between 85% and 115% are generally considered acceptable, as evidenced by a study that achieved recoveries of 98.74-103.43% for norfloxacin in spiked human plasma [89].
Protocol for Evaluating Sensor Stability and Drift
- Setup: Immerse the sensor in a standard solution of known, fixed activity (e.g., 0.01 M).
- Monitoring: Continuously measure and record the potential output over an extended period (e.g., 24-72 hours).
- Analysis: Plot potential versus time. The drift is typically expressed as the change in potential per unit time (e.g., mV/hour). Low drift is critical for long-term monitoring applications.
The Scientist's Toolkit: Essential Research Reagents & Materials
The following table details key materials and reagents essential for developing and validating potentiometric sensors for complex matrices.
Table 2: Key Research Reagent Solutions for Potentiometric Sensor Development
| Material/Reagent | Function in Potentiometric Sensors | Biocompatibility & Selection Notes |
|---|---|---|
| Ionophores (e.g., Valinomycin) | Selective molecular recognition element for the target ion [53]. | Inherently toxic; consider covalent immobilization to the polymer matrix to prevent leaching [53]. |
| Polymeric Matrices (e.g., PVC, Polyurethane) | Provides the bulk phase for the ion-selective membrane; determines mechanical stability [53]. | Biocompatible polymers like polyurethane or silicone are preferred for in-vivo applications over PVC [53]. |
| Plasticizers (e.g., DOS, oNPOE) | Imparts flexibility to the polymer membrane and dissolves membrane components [53]. | A major source of leaching; research focuses on non-leaching alternatives or green plasticizers [53]. |
| Ion Exchangers (e.g., KTpClPB) | Imparts ionic conductivity to the membrane and ensures permselectivity. | Limited data on cytotoxicity; some studies indicate low toxicity [53]. |
| Solid-Contact Materials (e.g., PEDOT, Carbon nanotubes) | Transduces the ion signal from the membrane to an electronic signal in the conductor; prevents formation of an unstable water layer [53]. | Typically isolated from the sample by the ISM; biocompatibility is managed through this isolation. |
| Biocompatible Coatings (e.g., Poly(ethylene oxide)) | Applied to the sensor surface to improve hemocompatibility and reduce biofouling [53]. | Critical for implantable sensors to prevent thrombogenic responses and ensure long-term function [53]. |
Workflow and Signaling Pathways
The following diagram illustrates the logical workflow for the complete validation of a potentiometric sensor, from initial design to final application in a complex matrix.
Sensor Validation Workflow
Data Presentation and Analysis
Effective presentation of validation data is crucial for clear communication. Quantitative results should be synthesized into clearly structured tables for easy comparison and interpretation [90] [91].
Table 3: Example Data from a Hypothetical Calcium Ion-Selective Electrode Validation in Serum
| Parameter | Standard Buffer | Spiked Serum Matrix | Acceptance Criteria |
|---|---|---|---|
| Slope (mV/decade) | -29.5 ± 0.3 | -28.8 ± 0.7 | -29.6 ± 2.0 |
| LOD (M) | 2.5 x 10⁻⁶ | 5.1 x 10⁻⁶ | < 1 x 10⁻⁵ |
| Working Range (M) | 10-5 to 10-1 | 10-5 to 10-1 | 10-5 to 10-1 |
| Log KpotCa, Mg} | -4.2 | -3.9 | > -3.0 |
| Recovery at 1 mM (%) | — | 98.5 | 85-115% |
| Response Time (s) | < 10 | < 15 | < 30 |
| Drift (mV/hour) | 0.2 | 0.5 | < 1.0 |
The accurate and rapid detection of lead ions (Pb²⁺) is a critical requirement in environmental monitoring and public health protection due to the element's persistent toxicity and bioaccumulative nature [92]. Conventional analytical methods for lead determination, including atomic absorption spectrometry (AAS) and inductively coupled plasma mass spectrometry (ICP-MS), offer high sensitivity but often require complex instrumentation, skilled personnel, and extensive sample preparation, limiting their use in field settings [92]. Potentiometric sensors, particularly ion-selective electrodes (ISEs), have emerged as practical alternatives owing to their simplicity, portability, low power requirements, and high selectivity [92].
This case study provides an in-depth performance analysis of a state-of-the-art lead ISE fabricated using a castor oil-based polyurethane membrane with 1,10-phenanthroline as the active agent [93]. The research is framed within a broader thesis on potentiometric cell setup and component research, with particular emphasis on how material innovations in membrane composition and electrode architecture enhance analytical performance. The electrode design discussed represents significant advances in the field of potentiometric lead sensing, which has seen a marked acceleration in development since 2015 [92].
Background and Technological Context
The Toxicity and Environmental Significance of Lead
Lead contamination presents severe risks to both ecosystem integrity and human health. As a heavy metal, lead exhibits significant neurological toxicity, particularly in children, where exposure has been linked to brain dysfunction and behavioral disorders [92]. The mechanisms of Pb²⁺ neurotoxicity involve interference with calcium homeostasis, where Pb²⁺ can enter voltage-gated Ca²⁺ channels and substitute for calcium ions, thereby disrupting neurotransmitter release and synaptic communication [92]. Additionally, Pb²⁺ exposure increases oxidative stress by generating reactive oxygen species and weakening antioxidant defenses, leading to neuronal injury [92].
Environmental lead pollution originates from both natural processes and extensive anthropogenic activities including mining, battery production, fertilization, and wastewater discharge [92]. The persistence of lead in water ecosystems and soil, coupled with its bioaccumulative properties, makes it a long-term threat requiring continuous monitoring [92]. These environmental and health concerns underscore the necessity for reliable, cost-effective detection methods capable of routine deployment.
Principles of Potentiometric Sensing
Potentiometry operates on the fundamental principle of measuring the electromotive force (EMF) of an electrochemical cell under zero-current conditions [92]. The determination of ionic species is based on the relationship between the electric potential of an indicator electrode and the activity of target ions in the sample solution, relative to a reference electrode with a stable, known potential [92].
For ion-selective electrodes, the Nikolsky-Eisenman equation describes the electrode's response to both primary and interfering ions:
[E = E^0 ± \frac{2.303RT}{zF} \log(aI + \sum{I≠J} K{IJ}aJ^{\frac{zI}{zJ}} + a_0)]
Where (E) represents the measured potential of the ISE cell, (E^0) is the standard electrode potential, (R) is the ideal gas constant, (T) is temperature, (zI) and (zJ) are the charges of the primary and interfering ions, (aI) and (aJ) are their activities, (F) is Faraday's constant, and (K_{IJ}) is the selectivity coefficient [92].
Innovations in ISE architecture have evolved from conventional liquid-contact designs to modern solid-contact electrodes incorporating nanomaterials, conducting polymers, and ionic liquids, significantly enhancing sensitivity, stability, and practical applicability [92].
Experimental Design and Methodologies
Electrode Fabrication Protocol
The state-of-the-art Pb²⁺ ISE was constructed using a systematic fabrication approach [93]:
Membrane Matrix Preparation: The polyurethane membrane matrix was synthesized by adding 1.75 g toluene diisocyanate (TDI) into 3.5 g castor oil (Ricinus communis L.) in a glass beaker, followed by stirring for 3 minutes.
Active Agent Incorporation: 1,10-phenanthroline was added to the mixture with weight variations of 0, 1, 3, 5, 7, and 19 mg, followed by stirring until homogeneous and heating for 15 minutes at 45°C.
Solution Processing: The mixture was sonicated while adding 4 g of acetone to achieve proper consistency.
Membrane Casting: The solution was cast on a glass plate and oven-dried at 40°C for 24 hours to form the complete membrane.
Electrode Assembly: The prepared membrane was cut into a round shape (diameter = 0.57 mm) and attached to an electrode body surface using adhesive.
Internal Solution Addition: The electrode was filled with an internal solution containing 0.1 M KCl and 0.3 M Pb(NO₃)₂.
Electrode Conditioning: The assembled ISE was conditioned by soaking in a 0.1 M Pb(NO₃)₂ solution for 24 hours before analysis.
Reference Electrode Preparation
An Ag/AgCl reference electrode was prepared through electrolysis employing two Ag wires (d = 0.57 mm) in a 0.1 M KCl solution for 30 seconds [93]. The formation of a black color on the wire surface indicated successful Ag/AgCl deposition, providing a stable reference potential for measurements.
Measurement and Optimization Procedures
The measurement and optimization of the electrode were performed using Pb(NO₃)₂ standard solutions across a concentration range of 10⁻¹⁰–10⁻¹ M [93]. The optimization process included:
- Active Agent Composition: Determining the optimum 1,10-phenanthroline weight based on sensitivity values and linear range.
- pH Stability Assessment: Evaluating electrode response stability across different pH environments.
- Selectivity Testing: Employing the mixed solution method to determine selectivity coefficients against interfering ions.
- Response Time Characterization: Measuring the time required for the system to reach stability after measurement initiation.
- Lifetime Evaluation: Monitoring electrode performance over a 15-day period to assess operational longevity.
Results and Performance Analysis
Comprehensive Performance Metrics
The fabricated Pb²⁺ ISE demonstrated exceptional analytical performance, with detailed quantitative metrics summarized in the table below.
Table 1: Performance Characteristics of the Pb²⁺ Ion-Selective Electrode
| Performance Parameter | Value | Contextual Comparison |
|---|---|---|
| Sensitivity | 27.25 mV/decade | Near-Nernstian (Theoretical: 29.58 mV/decade) |
| Linear Range | 10⁻¹⁰ – 10⁻⁵ M | Broader than many reported designs [93] |
| Detection Limit | 10⁻¹⁰ M | Matches most advanced reported sensors [92] |
| Response Time | 25 seconds | Rapid response for practical applications |
| Optimal pH Range | 7 – 8 | Suitable for most environmental water samples |
| Lifetime | 15 days | Acceptable operational longevity |
| Repeatability (SD) | 0.0079 | Excellent measurement consistency |
| Reproducibility (SD) | 0.065 | Good manufacturing consistency |
| Coefficient of Determination (R²) | 0.959 | Strong correlation in calibration |
The sensitivity of 27.25 mV/decade approaches the theoretical Nernstian value of 29.58 mV/decade for divalent ions, indicating efficient ion-to-electron transduction [93]. The exceptionally broad linear range spanning five orders of magnitude, combined with a detection limit of 10⁻¹⁰ M, places this electrode among the most sensitive potentiometric sensors reported in recent literature [92]. These performance characteristics are particularly notable given the electrode's solid-contact design and polymeric membrane composition.
Interference and Selectivity Profile
The selectivity of the Pb²⁺ ISE was rigorously evaluated using the mixed solution method, with results demonstrating excellent discrimination against potentially interfering ions [93]. The selectivity order was determined as follows:
Ag²⁺ > Ca²⁺ > K⁺ > Mg²⁺ > Cu²⁺ > Fe³⁺ > Cr³⁺ > Zn²⁺ > Cd²⁺
All recorded log Kᵢⱼ values were less than 1, indicating favorable selectivity characteristics for practical applications in complex matrices [93]. The highest interference was observed from Ag²⁺ ions, which is consistent with the known behavior of heavy metal-selective electrodes. The relatively low interference from Cd²⁺ is particularly advantageous for environmental monitoring where these metals often coexist.
Material Characterization Insights
Comprehensive material characterization provided critical insights into the structural and chemical properties underlying the electrode's performance:
FT-IR Analysis: Fourier transform infrared spectroscopy confirmed that 1,10-phenanthroline was responsible for the formation of Pb²⁺ ion entrapment via complexation, validating the intended mechanism of action [93].
Structural Integrity: Additional characterization of crystallinity, micro-surface morphology, and mechanical strength suggested some degradation of the membrane structure integrity after application, indicating an area for potential future improvement [93].
Hydrophobic Properties: The polyurethane membrane demonstrated beneficial hydrophobic properties that help maintain membrane stability by preventing swelling and leaching of the active agent in aqueous media [93].
The Scientist's Toolkit: Essential Research Reagents and Materials
The development and implementation of high-performance lead ISEs requires carefully selected materials and reagents, each serving specific functions in the sensing system.
Table 2: Essential Materials for Pb²⁺ ISE Fabrication and Analysis
| Material/Reagent | Function | Specifications/Notes |
|---|---|---|
| Castor Oil | Polyurethane membrane matrix | Source: Ricinus communis L.; provides carbonyl/amine groups for negative surface charge [93] |
| 1,10-Phenanthroline | Ionophore (active agent) | Forms complexation sites for Pb²⁺ entrapment; optimum weight variation: 1-19 mg [93] |
| Toluene Diisocyanate (TDI) | Polyurethane crosslinker | Reacts with castor oil to form polymer matrix; used at 1.75g per 3.5g castor oil [93] |
| Acetone | Solvent | Processing medium for membrane solution; 4g used in sonication step [93] |
| Pb(NO₃)₂ | Primary ion source | Standard solutions for calibration (10⁻¹⁰–10⁻¹ M); component of internal solution [93] |
| KCl | Electrolyte | Internal solution component (0.1 M); used in reference electrode preparation [93] |
| Ag Wire | Electrode conductor | Base material for reference electrode; diameter = 0.57 mm [93] |
| Interfering Ion Salts | Selectivity assessment | Includes FeCl₃, NaNO₃, Cr(NO₃)₃, CuSO₄, ZnSO₄, Cd(NO₃)₂, etc. [93] |
Conceptual Framework and Experimental Workflow
The operational principles and experimental procedures for the Pb²⁺ ISE can be visualized through the following conceptual diagrams, created using Graphviz DOT language with adherence to the specified color palette and contrast requirements.
Pb²⁺ ISE Sensing Mechanism
Diagram 1: ISE Sensing Mechanism
Electrode Fabrication Workflow
Diagram 2: Electrode Fabrication Workflow
Comparative Analysis with Existing Technologies
When contextualized within the broader field of potentiometric sensing, the analyzed Pb²⁺ ISE demonstrates competitive advantages over both traditional analytical methods and conventional ISE designs.
Table 3: Comparative Analysis of Lead Detection Methods
| Analytical Method | Detection Limit | Analysis Time | Cost | Portability | Skill Requirement |
|---|---|---|---|---|---|
| Pb²⁺ ISE (This Study) | 10⁻¹⁰ M | Minutes | Low | High | Low |
| Atomic Absorption Spectrometry | ~10⁻⁹ M [93] | Hours | High | Low | High |
| ICP-MS | ~10⁻¹² M [92] | Hours | Very High | Low | Very High |
| Anodic Stripping Voltammetry | ~10⁻¹⁰ M [92] | 10-30 minutes | Medium | Medium | Medium |
| Conventional Liquid-Contact ISE | ~10⁻⁷ M [92] | Minutes | Low | Medium | Low |
The castor oil-based ISE achieves detection limits comparable to more complex techniques like anodic stripping voltammetry while maintaining the operational simplicity characteristic of potentiometric methods [93] [92]. The solid-contact design eliminates the need for internal solution maintenance, enhancing portability and field-deployment capability compared to conventional liquid-contact ISEs.
Recent innovations in solid-contact electrodes modified with nanomaterials, ionic liquids, and conducting polymers have driven significant improvements in sensitivity, with reported detection limits down to 10⁻¹⁰ M, near-Nernstian slopes of 28-31 mV per decade, and broad linear ranges extending from 10⁻¹⁰ to 10⁻² M [92]. The electrode analyzed in this case study aligns with these advanced performance metrics while utilizing a novel bio-based polymer matrix.
Validation and Practical Application
The practical applicability of the Pb²⁺ ISE was validated through comparative analysis with established reference methods. Analysis of lead levels in both artificial and wastewater samples showed no significant difference between results obtained with the Pb²⁺ ISE and atomic absorption spectroscopy (AAS) measurements [93]. This successful validation demonstrates the electrode's reliability for real-world environmental monitoring applications.
The electrode's performance characteristics make it particularly suitable for:
Environmental Water Monitoring: Detection of lead contamination in wastewater, groundwater, and industrial discharge, with the pH stability range (7-8) aligned with typical water samples.
Field Deployment Scenarios: The solid-contact design, combined with rapid response time (25 seconds) and portability, enables on-site analysis without complex instrumentation.
Routine Screening Applications: Low cost and operational simplicity facilitate frequent monitoring programs for regulatory compliance and pollution tracking.
The research findings contribute to the evolving trend of transitioning potentiometric sensors from laboratory tools to robust, field-deployable devices for environmental surveillance [92].
This performance analysis demonstrates that the castor oil-based polyurethane ISE with 1,10-phenanthroline as an active agent represents a viable, high-performance sensing platform for lead detection. The electrode achieves an optimal balance of sensitivity (27.25 mV/decade), detection limit (10⁻¹⁰ M), broad linear range (10⁻¹⁰–10⁻⁵ M), and practical usability with a 15-day lifetime.
Despite these advancements, challenges remain in further improving long-term stability, reducing calibration frequency, and enhancing selectivity against specific interfering ions such as Ag²⁺ [93]. Future research directions should focus on:
Material Innovations: Exploring novel nanocomposites and conducting polymers to enhance signal transduction and stability.
Miniaturization Strategies: Developing micro- and nanoscale electrodes for spatially resolved analysis and integration with portable devices.
Multiplexed Sensing Platforms: Incorporating Pb²⁺ detection into multi-analyte sensor arrays for comprehensive environmental monitoring.
Advanced Membrane Formulations: Optimizing polymer compositions and plasticizers to extend operational lifetime and temperature stability.
The continued development of high-performance potentiometric sensors for toxic metals like lead remains crucial for protecting public health and ensuring environmental safety through cost-effective, rapid, and reliable monitoring technologies.
Potentiometry, an electrochemical method measuring potential at zero current, presents significant strategic advantages for deployment in modern laboratories and industrial settings, particularly in pharmaceutical and biomedical research. This technical guide explores the core principles of potentiometry, focusing on its inherent power and cost efficiency compared to traditional analytical techniques. The discussion is framed within ongoing research on potentiometric cell setup and components, highlighting how innovations in solid-contact electrodes and ion-selective membranes enhance these advantages. For researchers and drug development professionals, potentiometry offers a compelling combination of technical simplicity, real-time monitoring capabilities, and reduced operational costs, making it particularly suitable for routine analysis, continuous monitoring, and resource-limited environments.
Potentiometry is a static electrochemical method that measures the electrical potential between two electrodes—a working electrode and a reference electrode—under conditions of zero current flow [94] [95]. This fundamental principle avoids changes in solution composition during analysis, making it a powerful quantitative method for determining ion activities and concentrations. The measured potential follows the Nernst equation, which relates the cell potential to the activity of the target ion [96] [95]:
E = E⁰ + (RT/nF)ln(aᵢ)
Where E is the measured potential, E⁰ is the standard potential, R is the universal gas constant, T is temperature, n is the charge of the ion, F is the Faraday constant, and aᵢ is the activity of the ion [95].
The most significant application of potentiometry is determining the concentration of an analyte in solution, with most potentiometric electrodes being selective toward the free, uncomplexed form of the analyte [96]. This selectivity provides a key advantage over other quantitative methods when determining free ion concentrations, as in the case of measuring free vs. protein-bound calcium in biological samples [96]. For drug development professionals, this specificity is crucial for understanding bioavailability and metabolic processes.
Strategic Advantages: Power and Cost Efficiency
Instrumentation and Operational Efficiency
Potentiometric systems offer substantial advantages in power requirements and operational efficiency compared to conventional analytical instrumentation. The technical simplicity of potentiometric sensors translates directly into reduced energy consumption and simplified operational protocols [95].
Table 1: Power and Operational Characteristics of Potentiometry
| Feature | Advantage | Research Implication |
|---|---|---|
| Power Requirements | Minimal space and energy demands [95] | Suitable for portable and point-of-care devices |
| Technical Complexity | Simple instrumentation and operation [95] | Reduced training requirements and error potential |
| Measurement Principle | Zero-current potential measurement [95] | Non-destructive analysis preserving sample integrity |
| Signal Transduction | Direct ionic-to-electronic signal conversion [12] | Simplified circuitry and reduced power consumption |
The minimal space and energy demands of potentiometric systems make them uniquely suitable for creating miniaturized versions that maintain satisfactory analytical performance [95]. This advantage is particularly valuable for field applications, point-of-care testing, and implantable sensors where power resources are limited.
Cost Analysis and Economic Advantages
The economic benefits of potentiometry extend across the entire instrument lifecycle, from initial acquisition through routine operation and maintenance. When compared to traditional analytical techniques like titration or chromatographic methods, potentiometry demonstrates superior cost-efficiency, especially for high-volume applications.
Table 2: Cost Comparison: Potentiometry vs. Titration
| Cost Factor | Potentiometry | Titration |
|---|---|---|
| Initial Instrument Cost | $500-$2,000 (benchtop meter) [97] | $200-$500 (manual); $5,000-$25,000 (automated) [97] |
| Consumables & Reagents | Electrodes ($100-$500); calibration standards [97] | Titrants, indicators, specialized solvents [97] |
| Labor Requirements | Minimal sample preparation; rapid measurements [97] | Labor-intensive; requires skilled analysts [97] |
| Cost per Analysis | Significantly lower for high-volume applications [97] | Higher due to reagents and labor intensity [97] |
| Automation Potential | Easily integrated into continuous monitoring systems [97] | Requires specialized automated titrators [97] |
For research laboratories and drug development facilities conducting routine pH analysis or ion concentration measurements, potentiometry offers better cost-efficiency for high-volume and continuous monitoring applications [97]. The lower per-sample cost, reduced labor requirements, and minimal reagent consumption make it particularly advantageous for quality control processes and long-term studies.
Experimental Protocols and Methodologies
Standard Potentiometric Measurement Protocol
The following detailed methodology outlines a standard protocol for direct potentiometric measurements using ion-selective electrodes (ISEs), based on established practices in analytical chemistry [96]:
Electrode Selection and Preparation: Select an appropriate ion-selective electrode based on the target analyte. For calcium detection, for example, this might involve an electrode with a membrane containing an ion carrier such as ETH 1001 [95]. Condition the electrode by soaking in a standard solution containing the ion of interest for a minimum of 30 minutes before first use.
Calibration Standards Preparation: Prepare a series of standard solutions covering the expected concentration range of the sample. These standards should have an identical matrix to the samples to maintain constant ionic strength and activity coefficients [96]. For biological samples like serum, add sodium chloride to calibration solutions to adjust ionic strength to approximately 160 mmol kg⁻¹ [95].
Instrument Calibration: Measure the potential of each standard solution in order of increasing concentration. Rinse the electrode with deionized water between measurements and blot dry gently. Plot the measured potential (mV) versus the logarithm of the ion activity (log aᵢ) to obtain a calibration curve. The slope should be close to the theoretical Nernstian value (approximately 59.16/z mV per decade at 25°C, where z is the ion charge) [96].
Sample Measurement: Measure the potential of unknown samples using the same conditions as calibration. For pH-sensitive measurements like free calcium in serum, process samples anaerobically and measure within minutes to prevent pH shifts that affect ion binding [95].
Data Analysis: Determine sample concentration from the calibration curve. For samples requiring reporting at standard pH (e.g., serum calcium at pH 7.4), apply appropriate algorithmic corrections based on empirical relationships between pH and ion binding [95].
Advanced Sensor Fabrication Protocol
Recent research has developed sophisticated potentiometric sensors with enhanced performance characteristics. The following protocol details the fabrication of a BAPTA-based potentiometric polymer sensor for calcium detection, representing cutting-edge advancements in the field [12]:
Polymer Synthesis: Synthesize the conductive copolymer by electrochemical polymerization of 2,2'-bithiophene (BT) and 1,2-bis(o-aminophenoxy)ethane-N,N,N',N'-tetraacetic acid (BAPTA) monomers. BAPTA provides highly selective calcium chelating properties integrated directly into the polymer matrix [12].
Electrode Modification: Deposit the copolymer onto a solid electrode substrate (e.g., gold or carbon) using electrochemical polymerization techniques such as cyclic voltammetry or potentiostatic deposition. This creates a sensitive conductive polymer layer that effectively detects calcium ions [12].
Sensor Characterization: Validate sensor performance by measuring the potential response across a range of calcium concentrations (e.g., 0.1 mM to 1 mM). The sensor should demonstrate Nernstian behavior with a slope of approximately 20 ± 0.3 mV per decade for calcium ions [12].
Selectivity Assessment: Determine selectivity coefficients against interfering ions (e.g., Mg²⁺) using the separate solution method (SSM) and calculate values using the Nicolsky-Eisenmann equation. Well-designed sensors show selectivity coefficients around -0.4 for Ca²⁺ over Mg²⁺ [12].
Stability Testing: Evaluate potential stability over time, assessing the impact of water penetration and ionophore leakage. Advanced sensors with covalently bound ion-recognition sites demonstrate improved longevity compared to traditional plasticized PVC membranes [12].
The experimental workflow for potentiometric sensor development and application can be visualized as follows:
Diagram 1: Experimental Workflow for Potentiometric Research
The Scientist's Toolkit: Research Reagent Solutions
Successful implementation of potentiometric methods requires specific materials and reagents optimized for particular applications. The following table details essential components for potentiometric research, with a focus on modern sensor fabrication and routine analysis.
Table 3: Essential Research Reagents and Materials for Potentiometry
| Component | Function & Strategic Importance | Application Example |
|---|---|---|
| Ionophores (e.g., ETH 1001, BAPTA) | Selective ion recognition elements that determine sensor specificity [95] [12] | Calcium ion detection in biomedical research |
| Polymer Matrices (e.g., PVC, PEDOT-PSS) | Provide structural support for ion-selective membranes; enable ion-to-electron transduction [12] | Solid-contact ion-selective electrodes |
| Plasticizers | Adjust membrane permeability and influence dielectric constant [12] | Traditional PVC-based ion-selective membranes |
| Conductive Polymers (e.g., polythiophenes) | Serve as ion-to-electron transducers in solid-state ISEs; enable miniaturization [12] | Implantable sensors for continuous monitoring |
| Electrode Materials (e.g., gold, carbon) | Provide solid contact for modern sensor designs; enable electrochemical polymerization [12] | BAPTA-based copolymer sensors for inflammation detection |
The strategic selection of research reagents directly impacts the power and cost efficiency of potentiometric methods. Covalently binding ion-recognition sites to conducting polymer backbones, for example, enables the integration of ion-recognition sites and ion-to-electron transducers within the same macromolecule, potentially extending sensor lifetime and reducing maintenance requirements [12].
Applications in Research and Drug Development
The power and cost efficiency of potentiometry enables diverse applications across pharmaceutical and biomedical research. These applications leverage the technique's unique advantages for specific analytical challenges.
Real-time Monitoring in Biological Systems
Potentiometry provides continuous, real-time monitoring capabilities that are particularly valuable for dynamic biological systems. Unlike endpoint-focused methods like titration, potentiometric electrodes can provide continuous pH or ion concentration readings throughout an experiment [97]. This advantage is crucial for:
- Fermentation Process Monitoring: Tracking pH changes during microbial fermentation in pharmaceutical production [97]
- Extracellular Ion Dynamics: Monitoring calcium flux during inflammatory responses or cellular signaling events [12]
- Drug Release Studies: Real-time assessment of pH changes during drug dissolution from formulations
Implantable Sensors for Biomedical Research
Miniaturization potential and low power requirements make potentiometry ideal for implantable sensor development. Recent research has demonstrated innovative applications in this area:
- Inflammation Detection: BAPTA-based potentiometric sensors detect elevated calcium concentrations in interstitial fluid as early markers of inflammation or infection around implants [12]
- Continuous Health Monitoring: Solid-contact ion-selective electrodes with biocompatible membranes for long-term ion monitoring in vivo [12]
- Point-of-Care Diagnostics: Miniaturized potentiometric systems for rapid assessment of critical biomarkers in resource-limited settings [95]
The relationship between sensor design characteristics and research applications can be visualized as follows:
Diagram 2: Sensor Design Characteristics to Applications
Potentiometry offers researchers and drug development professionals significant strategic advantages through its unique combination of power efficiency, cost-effectiveness, and technical capabilities. The method's minimal space and energy demands [95], coupled with lower operational costs compared to alternative techniques like titration [97], make it particularly suitable for resource-conscious research environments. Ongoing advancements in sensor design, including solid-contact electrodes [12] and novel polymer matrices, continue to enhance these advantages while expanding application possibilities. For the scientific community, potentiometry represents not just an analytical tool but a strategic platform enabling research that might otherwise be constrained by technical complexity, power requirements, or budgetary limitations. As research in potentiometric cell setup and components progresses, these advantages are likely to become even more pronounced, further establishing potentiometry as a cornerstone technique in efficient scientific investigation.
Conclusion
The field of potentiometric sensing has evolved far beyond traditional glass electrodes, offering sophisticated, miniaturized, and highly adaptable tools for biomedical research and drug development. The transition to solid-contact architectures using advanced transducers like conducting polymers and nanomaterials has enabled the creation of stable, portable, and wearable sensors suitable for continuous monitoring of critical biomarkers, electrolytes, and pharmaceuticals. Innovations such as 3D printing and pOECT configurations are pushing the boundaries of fabrication and sensing accuracy. For researchers, mastering the setup, components, and optimization strategies is key to leveraging these sensors for applications ranging from point-of-care diagnostics to therapeutic drug monitoring, particularly for drugs with a narrow therapeutic index. Future directions will likely focus on enhancing the biocompatibility and long-term stability of implantable sensors, developing multi-analyte sensing platforms, and further integrating these systems with digital health technologies for real-time data analytics and personalized medicine, solidifying the role of potentiometry in the future of healthcare and pharmaceutical sciences.
References
- 1. Potentiometry | PPTX [https://www.slideshare.net/slideshow/potentiometry-105700710/105700710]
- 2. 11.2: Potentiometric Methods [https://chem.libretexts.org/Courses/BethuneCookman_University/B-CU%3A_CH-345_Quantitative_Analysis/Book%3A_Analytical_Chemistry_2.1_(Harvey)/11%3A_Electrochemical_Methods/11.02%3A_Potentiometric_Methods]
- 3. Mastering Potentiometry in Instrumental Analysis [https://www.numberanalytics.com/blog/mastering-potentiometry-in-instrumental-analysis]
- 4. 23.1: Reference Electrodes [https://chem.libretexts.org/Bookshelves/Analytical_Chemistry/Instrumental_Analysis_(LibreTexts)/23%3A_Potentiometry/23.01%3A_Reference_Electrodes]
- 5. Checking and validating reference electrodes ... [https://www.biologic.net/topics/checking-and-validating-reference-electrodes/]
- 6. 2.2: Potentiometric Methods [https://chem.libretexts.org/Bookshelves/Analytical_Chemistry/Analytical_Chemistry_Volume_II_(Harvey)/02%3A_Electrochemical_Methods/2.02%3A_Potentiometric_Methods]
- 7. Reference Electrodes for Precise Electrochemical Control [https://www.sciencegears.com.au/reference-electrodes]
- 8. Ion-Selective Electrodes [https://chem.libretexts.org/Bookshelves/Analytical_Chemistry/Supplemental_Modules_(Analytical_Chemistry)/Analytical_Sciences_Digital_Library/Courseware/Analytical_Electrochemistry%3A_Potentiometry/03_Potentiometric_Theory/03_Ion-Selective_Electrodes]
- 9. sciencedirect.com/topics/chemistry/ ion - selective - electrode [https://www.sciencedirect.com/topics/chemistry/ion-selective-electrode]
- 10. Ion-selective electrode [https://en.wikipedia.org/wiki/Ion-selective_electrode]
- 11. Understanding Ion Selective Electrodes (ISEs) and Their ... [https://sensorex.com/ion-selective-electrodes/?srsltid=AfmBOop7rR2zeD5-6QP4ZmRg4OQjMfIHoNBw9REtxcx-hBjeRneJkEv7]
- 12. BAPTA-based potentiometric polymer sensor - RSC Publishing [https://pubs.rsc.org/en/content/articlehtml/2025/tb/d4tb02586e]
- 13. Plastic reference electrodes and plastic potentiometric cells ... [https://www.sciencedirect.com/science/article/abs/pii/S1567539406001265]
- 14. Printed potentiometric sensors [https://www.sciencedirect.com/science/article/abs/pii/S0165993625002882]
- 15. 11.2: Potentiometric Methods - Chemistry LibreTexts [https://chem.libretexts.org/Bookshelves/Analytical_Chemistry/Analytical_Chemistry_2.1_(Harvey)/11:_Electrochemical_Methods/11.02:_Potentiometric_Methods]
- 16. Solid-contact ion-selective electrode for the determination ... [https://pmc.ncbi.nlm.nih.gov/articles/PMC12180174/]
- 17. A Novel Potentiometric Method for the Determination of ... [https://www.abechem.com/article_723272.html]
- 18. Revision Notes - Nernst Equation | Applications of ... [https://www.sparkl.me/learn/collegeboard-ap/chemistry/nernst-equation/revision-notes/1265]
- 19. 23.2: Metallic Indicator Electrodes [https://chem.libretexts.org/Bookshelves/Analytical_Chemistry/Instrumental_Analysis_(LibreTexts)/23%3A_Potentiometry/23.02%3A_Metallic_Indicator_Electrodes]
- 20. 11.2: Potentiometric Methods - Chemistry LibreTexts [https://chem.libretexts.org/Courses/Northeastern_University/CHEM_1000%3A_General_Chemistry/11%3A_Electrochemical_Methods/11.2%3A_Potentiometric_Methods]
- 21. Electrode Response - an overview [https://www.sciencedirect.com/topics/engineering/electrode-response]
- 22. New trends in potentiometric sensors: From design to ... [https://www.sciencedirect.com/science/article/abs/pii/S0039914025001092]
- 23. Recent Developments and Challenges in Solid-Contact Ion ... [https://www.mdpi.com/1424-8220/24/13/4289]
- 24. 3D Printing in the Design of Potentiometric Sensors [https://www.mdpi.com/1424-8220/25/16/4986]
- 25. Comparative Study of Potassium Ion-Selective Electrodes ... [https://pmc.ncbi.nlm.nih.gov/articles/PMC11643548/]
- 26. Highly reproducible solid contact ion selective electrodes: ... [https://www.sciencedirect.com/science/article/abs/pii/S0003267021001306]
- 27. Emerging trends of ion-selective electrodes in ... [https://www.sciencedirect.com/science/article/abs/pii/S0013468624004468]
- 28. Recent Developments and Challenges in Solid-Contact Ion ... [https://pmc.ncbi.nlm.nih.gov/articles/PMC11244314/]
- 29. A comparative study of green solid contact ion selective ... [https://www.nature.com/articles/s41598-023-47240-3]
- 30. A Review of the Carbon-Based Solid Transducing Layer for ... [https://pmc.ncbi.nlm.nih.gov/articles/PMC10384130/]
- 31. ion-selective electrodes and optodes - RSC Publishing [https://pubs.rsc.org/en/content/articlehtml/2024/ra/d4ra02615b]
- 32. A rational study of transduction mechanisms of different ... [https://www.nature.com/articles/s41598-024-55729-8]
- 33. Innovative sensors with selectivity enhancement by ... [https://pubs.rsc.org/en/content/articlehtml/2025/ra/d5ra02850g]
- 34. Solid-state reference electrodes based on carbon ... [https://pmc.ncbi.nlm.nih.gov/articles/PMC3057007/]
- 35. Development of two ion-selective sensors for determining ... [https://bmcchem.biomedcentral.com/articles/10.1186/s13065-025-01625-9]
- 36. Graphene-cobalt hexacyanoferrate modified sensor doped ... [https://www.nature.com/articles/s41598-025-16259-z]
- 37. Study of Ion-to-Electron Transducing Layers for the ... [https://www.mdpi.com/1424-8220/24/18/5994]
- 38. 3D Printing in the Design of Potentiometric Sensors [https://pmc.ncbi.nlm.nih.gov/articles/PMC12390291/]
- 39. - 3 Transducers for Solid Contact D Ion... Printed Potentiometric [https://pmc.ncbi.nlm.nih.gov/articles/PMC11447669/]
- 40. 3D Printed Integrated Sensors: From Fabrication to ... [https://pmc.ncbi.nlm.nih.gov/articles/PMC10745374/]
- 41. Advances in 3D printed electromechanical sensors [https://www.sciencedirect.com/science/article/pii/S2214860425001630]
- 42. - 3 : Emerging Strategies and D Printed Sensors Materials [https://www.plasticsengineering.org/2025/08/3d-printed-sensors-emerging-strategies-and-materials-009418/]
- 43. Integration of 3 Mg2+ D into... printed potentiometric sensors [https://pubs.rsc.org/en/content/articlelanding/2024/lc/d4lc00407h]
- 44. Innovation in potentiometry: 3 - D polylactic acid-based... printed [https://link.springer.com/article/10.1007/s10800-022-01706-w]
- 45. Thread-based potentiometric ion sensing [https://otd.harvard.edu/explore-innovation/technologies/thread-based-potentiometric-ion-sensing/]
- 46. Rapid Microfluidic Ion-Exchange Optode System for Point-of ... [https://pmc.ncbi.nlm.nih.gov/articles/PMC11853684/]
- 47. Machine learning in point-of-care testing: innovations, ... [https://www.nature.com/articles/s41467-025-58527-6]
- 48. Overview of Therapeutic Drug Monitoring - PMC [https://pmc.ncbi.nlm.nih.gov/articles/PMC2687654/]
- 49. Therapeutic Drug Monitoring: MedlinePlus Medical Test [https://medlineplus.gov/lab-tests/therapeutic-drug-monitoring/]
- 50. Therapeutic Drug Monitoring | Thermo Fisher Scientific - US [https://www.thermofisher.com/us/en/home/clinical/diagnostic-testing/clinical-chemistry-drug-toxicology-testing/therapeutic-drug-monitoring.html]
- 51. Reconfiguration of organic electrochemical transistors for ... [https://www.nature.com/articles/s41467-024-50792-1]
- 52. Organic Electrochemical Transistors as Versatile Analytical ... [https://pmc.ncbi.nlm.nih.gov/articles/PMC6882742/]
- 53. Towards biocompatible potentiometric sensors [https://www.sciencedirect.com/science/article/abs/pii/S2451910325001206]
- 54. Junction potentials in electrochemical cells with transference [https://www.sciencedirect.com/science/article/pii/S0013468625014471]
- 55. Stability and reproducibility study for the development of ... [https://www.sciencedirect.com/science/article/pii/S2666831925001572]
- 56. Stability indicating potentiometric method for the ... [https://www.nature.com/articles/s41598-022-17349-y]
- 57. Solid-contact ion-selective electrode for the determination of ... [https://bmcchem.biomedcentral.com/articles/10.1186/s13065-025-01546-7]
- 58. Anomalous potentiometric response of solid-contact ion- ... [https://www.sciencedirect.com/science/article/pii/S0925400522000582]
- 59. Backside Calibration Potentiometry: Ion Activity ... [https://pmc.ncbi.nlm.nih.gov/articles/PMC2883721/]
- 60. A highly stable and flexible ion-selective patch sensor for real ... [https://mnsl-journal.springeropen.com/articles/10.1186/s40486-025-00235-3]
- 61. Resolution increase of ion-selective electrodes response ... [https://www.sciencedirect.com/science/article/pii/S0013468622010453]
- 62. Designing new sulfate ionophores for potentiometric ... [https://www.sciencedirect.com/science/article/abs/pii/S0925400524013935]
- 63. Ionophore-based ion-selective electrodes: signal ... [https://www.sciencedirect.com/org/science/article/pii/S2635099823000821]
- 64. Natural Polyether Ionophores and Their Pharmacological ... [https://pmc.ncbi.nlm.nih.gov/articles/PMC9144361/]
- 65. Recent developments in ionophore-based potentiometric ... [https://pubs.rsc.org/en/content/articlehtml/2024/sd/d3sd00232b]
- 66. High Capacity Nanocomposite Layers Based on ... [https://www.mdpi.com/1996-1944/14/5/1308]
- 67. Recent progress in ZIF–polymer composites for advanced ... [https://pubs.rsc.org/en/content/articlehtml/2025/tb/d5tb00147a]
- 68. Using microfluidics to manufacture hydrophobic drugs [https://engineering.purdue.edu/ME/News/2023/using-microfluidics-to-manufacture-hydrophobic-drugs]
- 69. Advanced microfluidic techniques for the preparation of solid ... [https://pmc.ncbi.nlm.nih.gov/articles/PMC12494845/]
- 70. Development of a flexible 3D printed TPU-PVC microfluidic ... [https://www.nature.com/articles/s41598-025-90470-w]
- 71. Challenges and opportunities in the development of planar ... [https://www.sciencedirect.com/science/article/abs/pii/S0165993624004850]
- 72. Understanding the different effects of fouling mechanisms ... [https://pmc.ncbi.nlm.nih.gov/articles/PMC11648937/]
- 73. Innovative polymer-based, miniaturized solid-state ... [https://www.sciencedirect.com/science/article/abs/pii/S0378775325007815]
- 74. Materials strategy and device fabrication for stable closed ... [https://www.nature.com/articles/s44328-025-00045-y]
- 75. 11.2: Potentiometric Methods [https://chem.libretexts.org/Bookshelves/Analytical_Chemistry/Analytical_Chemistry_2.1_(Harvey)/11%3A_Electrochemical_Methods/11.02%3A_Potentiometric_Methods]
- 76. A tutorial on potentiometric data processing. Analysis of ... [https://www.sciencedirect.com/science/article/pii/S0003267024002770]
- 77. Processing and analysis of potentiometric data - PMC [https://pmc.ncbi.nlm.nih.gov/articles/PMC1329515/]
- 78. Fully 3D-printed solid-contact potentiometric sensor for ... [https://www.sciencedirect.com/science/article/pii/S0956566325007420]
- 79. Characterization of a simple potentiometric graphite based ... [https://pmc.ncbi.nlm.nih.gov/articles/PMC12627583/]
- 80. Lanthanum(III) potentiometric sensors based on ethyl benzoyl ... [https://arabjchem.org/lanthanumiii-potentiometric-sensors-based-on-ethyl-benzoyl-acetate/]
- 81. Tracking Lead: Potentiometric Tools and Technologies for a ... [https://pmc.ncbi.nlm.nih.gov/articles/PMC12430502/]
- 82. potentiometric selectivity coefficient (P04791) [https://goldbook.iupac.org/terms/view/P04791]
- 83. Comparison of different methods for determining the ... [https://www.sciencedirect.com/science/article/abs/pii/S0003267098005388]
- 84. Potentiometric sensors for trace-level analysis - PMC [https://pmc.ncbi.nlm.nih.gov/articles/PMC1482835/]
- 85. Next-Generation Potentiometric Sensors: A Review of ... [https://www.mdpi.com/2079-6374/15/1/51]
- 86. Comparison of the Performance of ICP-MS, CV-ICP-OES, and ... [https://pmc.ncbi.nlm.nih.gov/articles/PMC11656208/]
- 87. Gold determination in soil by ICP-MS: comparison of sample ... [https://jast-journal.springeropen.com/articles/10.1186/s40543-020-00245-3]
- 88. ICH and FDA Guidelines for Analytical Method Validation [https://www.labmanager.com/ich-and-fda-guidelines-for-analytical-method-validation-34252]
- 89. Development and validation of simple colorimetric methods ... [https://pmc.ncbi.nlm.nih.gov/articles/PMC11978087/]
- 90. Scientific Data Presentation: a Picture Is Worth a Thousand ... [https://www.aje.com/arc/scientific-data-presentation-picture-worth-thousand-words]
- 91. Presenting the Results of Quantitative Analysis [https://pressbooks.ric.edu/socialdataanalysis/chapter/writing-about-quantitative-data/]
- 92. Tracking Lead: Potentiometric Tools and Technologies for ... [https://www.mdpi.com/1420-3049/30/17/3492]
- 93. Optimization of Castor Oil-Based Ion Selective Electrode ... [https://www.mdpi.com/2077-0375/12/10/987]
- 94. 10.2: Potentiometric Methods [https://chem.libretexts.org/Courses/Montana_State_University/MSU%3A_CHMY311_Fundamental_Analytical_Chemistry/10%3A_Electrochemical_Methods/10.02%3A_Potentiometric_Methods]
- 95. Potentiometry - an overview | ScienceDirect Topics [https://www.sciencedirect.com/topics/chemistry/potentiometry]
- 96. 23.6: Quantitative Potentiometry [https://chem.libretexts.org/Bookshelves/Analytical_Chemistry/Instrumental_Analysis_(LibreTexts)/23%3A_Potentiometry/23.06%3A_Direct_Potentiometric_Measurements]
- 97. Titration vs. Potentiometry: Which Method is Better for pH ... [https://www.labmanager.com/titration-vs-potentiometry-which-method-is-better-for-ph-analysis-33658]