In Vivo Redox Probes: A Comprehensive Guide to Measuring Oxidative Stress in Living Systems for Biomedical Research
This article provides a comprehensive resource for researchers and drug development professionals on the current state of in vivo redox probes for oxidative stress measurement.
In Vivo Redox Probes: A Comprehensive Guide to Measuring Oxidative Stress in Living Systems for Biomedical Research
Abstract
This article provides a comprehensive resource for researchers and drug development professionals on the current state of in vivo redox probes for oxidative stress measurement. It covers the foundational principles of redox signaling and oxidative stress, explores the specific chemistries and applications of a wide array of chemical and genetically encoded probes, and addresses critical methodological challenges and optimization strategies. A dedicated section on validation and comparative analysis offers guidance for selecting the appropriate probe based on the research question, the specific reactive oxygen species (ROS) of interest, and the required spatial and temporal resolution. The content synthesizes the latest advances in the field, including EPR spectroscopy, compartment-targeted sensors, and single-cell resolution techniques, to empower robust and reliable experimental design in complex biological systems.
Understanding the Redox Landscape: From Basic Chemistry to Physiological Signaling
Redox homeostasis represents a fundamental biological state where the production of reactive oxygen and nitrogen species (RONS) is precisely balanced by antioxidant defense systems [1] [2]. This dynamic equilibrium enables RONS to function as crucial signaling molecules while preventing the oxidative damage that occurs when these species accumulate beyond physiological levels [3] [4]. The disruption of this balance, termed oxidative stress, has been implicated in a wide spectrum of pathological conditions including neurodegenerative diseases, cancer, cardiovascular disorders, and aging [5] [2].
Within aerobic organisms, reactive oxygen species (ROS) and reactive nitrogen species (RNS) constitute the primary reactive molecules governing redox signaling pathways [4] [6]. ROS encompass both free radicals, characterized by unpaired electrons (e.g., superoxide anion [O₂•⁻] and hydroxyl radical [•OH]), and non-radical oxidizing agents (e.g., hydrogen peroxide [H₂O₂]) [5] [7]. Similarly, RNS include nitric oxide (NO•) and its derivatives such as peroxynitrite (ONOO⁻) [3] [6]. Understanding the dual nature of these species—as both essential signaling mediators and potential damaging agents—forms the cornerstone of redox biology and its applications in therapeutic development [1] [2].
Defining the Key Players: ROS and RNS
Reactive Oxygen Species (ROS)
ROS are oxygen-containing chemically reactive molecules generated through both endogenous metabolic processes and exposure to exogenous stressors [3] [7]. The major ROS players in cellular physiology and pathology include:
Superoxide anion (O₂•⁻) serves as the primary ROS from which many others are derived, predominantly produced by electron leakage from the mitochondrial electron transport chain (particularly at Complexes I and III) and through enzymatic activity of NADPH oxidases (NOX) [3] [5]. Although its reactivity is somewhat selective, O₂•⁻ primarily functions as a signaling molecule that can activate various pathways, including the MAPK cascade [7]. Its limited membrane permeability restricts its signaling range unless transported through specific channels like VDAC (voltage-dependent anion channel) [7].
Hydrogen peroxide (H₂O₂) is generated through the dismutation of O₂•⁻, catalyzed by superoxide dismutase (SOD) enzymes [1]. As an uncharged and relatively stable molecule, H₂O₂ can diffuse across membranes through aquaporins, making it an ideal redox signaling messenger [1] [7]. At physiological concentrations (typically 1-100 nM), H₂O₂ modulates cell proliferation, differentiation, and survival through specific oxidative modifications of target proteins [1]. Its ability to reversibly oxidize cysteine residues in proteins constitutes a fundamental mechanism in redox signaling [8].
Hydroxyl radical (•OH) represents the most reactive and damaging ROS species, generated primarily through Fenton chemistry where H₂O₂ reacts with transition metals like Fe²⁺ or Cu⁺ [5]. With an extremely short half-life, •OH reacts indiscriminately with virtually all biomolecules, inducing lipid peroxidation, protein damage, and DNA strand breaks [4] [5]. Unlike O₂•⁻ and H₂O₂, •OH has no recognized signaling functions and is primarily associated with oxidative damage [4].
Table 1: Major Reactive Oxygen Species (ROS) and Their Characteristics
| ROS Species | Chemical Nature | Primary Sources | Reactivity & Specificity | Primary Biological Role |
|---|---|---|---|---|
| Superoxide (O₂•⁻) | Free radical | Mitochondrial ETC, NOX enzymes | Moderate, somewhat selective | Signaling precursor, activates pathways like MAPK |
| Hydrogen Peroxide (H₂O₂) | Non-radical | SOD-mediated dismutation of O₂•⁻ | Controlled, specific targets | Key redox signaling messenger |
| Hydroxyl Radical (•OH) | Free radical | Fenton reaction | Extreme, non-specific | Oxidative damage |
Reactive Nitrogen Species (RNS)
RNS are nitrogen-containing reactive molecules derived primarily from nitric oxide (NO•) and its secondary reactions [3] [6]. The key RNS players include:
Nitric oxide (NO•) is a gaseous free radical produced by nitric oxide synthase (NOS) enzymes through the conversion of L-arginine to L-citrulline [3]. At low concentrations, NO• functions as a vital signaling molecule regulating vascular tone, neuronal communication, and immune responses [3] [6]. Its signaling occurs primarily through activation of guanylyl cyclase and protein S-nitrosylation [6].
Peroxynitrite (ONOO⁻) forms through the rapid diffusion-limited reaction between NO• and O₂•⁻ [3] [5]. This potent oxidant can modify tyrosine residues in proteins (forming nitrotyrosine), oxidize lipids, and damage DNA [5]. Peroxynitrite generation represents a significant convergence point between ROS and RNS pathways, particularly under conditions of inflammation and neurodegeneration [5].
The biological effects of NO• are concentration-dependent, demonstrating the dual nature characteristic of reactive species. At low physiological levels, NO• acts as an antioxidant and signaling molecule, while excessive production leads to RNS-mediated damage through intermediates like peroxynitrite [3].
Table 2: Major Reactive Nitrogen Species (RNS) and Their Characteristics
| RNS Species | Chemical Nature | Primary Sources | Reactivity & Specificity | Primary Biological Role |
|---|---|---|---|---|
| Nitric Oxide (NO•) | Free radical | NOS enzymes | Moderate, selective | Vasodilation, neurotransmission, signaling |
| Peroxynitrite (ONOO⁻) | Non-radical | NO• + O₂•⁻ reaction | High, moderately selective | Protein nitration, oxidative damage |
The Concept of Redox Homeostasis
Principles of Redox Balance
Redox homeostasis represents a dynamic equilibrium between the generation of RONS and their elimination by antioxidant systems [1] [2]. This balance is not static but rather a carefully regulated homeodynamic process that allows for controlled fluctuations in RONS levels necessary for physiological signaling while preventing accumulation to damaging concentrations [1]. The "Redox Code" conceptualizes how organisms organize this complex interplay across different biological levels, from metabolism to protein structure and signaling networks [1] [2].
Central to this concept is the role of hydrogen peroxide as a key redox signaling metabolite [1]. At physiological concentrations (1-100 nM), H₂O₂ mediates specific oxidative modifications of cysteine residues in proteins, particularly in phosphatases, kinases, and transcription factors, thereby regulating their activity and downstream signaling cascades [1] [8]. This compartmentalized, spatiotemporally controlled oxidation represents a fundamental mechanism of redox signaling [8].
Antioxidant Defense Systems
To maintain redox homeostasis, organisms have evolved multilayered antioxidant defense systems that can be categorized as enzymatic and non-enzymatic components:
Enzymatic antioxidants provide the first line of defense and include:
- Superoxide dismutase (SOD) catalyzes the dismutation of O₂•⁻ to H₂O₂ [3] [5]. The three mammalian SOD isoforms display distinct subcellular localizations: SOD1 (Cu/Zn-SOD) in the cytoplasm and mitochondrial intermembrane space, SOD2 (Mn-SOD) in the mitochondrial matrix, and SOD3 (extracellular SOD) [5].
- Catalase (CAT) primarily localized in peroxisomes, catalyzes the conversion of H₂O₂ to water and oxygen [3] [5].
- Glutathione peroxidase (GPx) and peroxiredoxins (Prx) utilize reducing equivalents from glutathione and thioredoxin, respectively, to reduce H₂O₂ and lipid hydroperoxides [3] [1].
Non-enzymatic antioxidants include small molecules such as:
- Glutathione (GSH) as the most abundant cellular thiol, serves as a crucial redox buffer and cofactor for glutathione peroxidases [3].
- Ascorbic acid (Vitamin C) and α-tocopherol (Vitamin E) function as direct radical scavengers in aqueous and lipid environments, respectively [3].
- Reactive sulfur species (RSS) including hydrogen sulfide (H₂S) and persulfides have emerged as important components of the antioxidant network [3].
These antioxidant systems operate in a coordinated, compartmentalized manner to maintain RONS within physiological ranges, allowing for redox signaling while preventing oxidative damage [5] [8].
Experimental Protocols for Redox Assessment
Protocol: Detection and Quantification of Superoxide Using Fluorescent Probes
Principle: Cell-permeable fluorescent probes selectively react with specific ROS, yielding fluorescent products that can be detected by microscopy, flow cytometry, or microplate readers [8] [9].
Reagents and Equipment:
- MitoSOX Red or MitoSOX Green (mitochondrial superoxide indicator)
- Hanks' Balanced Salt Solution (HBSS) or appropriate buffer
- Dimethyl sulfoxide (DMSO, anhydrous)
- Fluorescence microscope, flow cytometer, or microplate reader with appropriate filters
- Cell culture reagents and equipment
Procedure:
- Probe Preparation: Prepare a 5 mM stock solution of MitoSOX reagent in anhydrous DMSO. Aliquot and store at -20°C protected from light.
- Cell Loading: Culture cells in appropriate medium on sterile coverslips, multiwell plates, or culture dishes. For adherent cells, achieve 60-80% confluence.
- Staining: Replace culture medium with prewarmed HBSS containing 2-5 μM MitoSOX reagent. Incubate cells for 10-30 minutes at 37°C protected from light.
- Washing: Gently wash cells 2-3 times with warm HBSS to remove excess probe.
- Imaging/Analysis: For live-cell imaging, maintain cells in HBSS during image acquisition. Use excitation/emission wavelengths of 510/580 nm for MitoSOX Red or 488/510 nm for MitoSOX Green [9].
- Controls: Include appropriate controls:
- Untreated cells (autofluorescence control)
- Cells treated with superoxide generator (e.g., antimycin A, 1-10 μM) as positive control
- Cells pretreated with SOD mimic (e.g., TEMPOL, 1-5 mM) to confirm specificity
Data Interpretation: Fluorescence intensity correlates with mitochondrial superoxide production. Normalize data to cell number or protein content. For quantitative comparisons, include standard curves where possible.
Technical Notes:
- MitoSOX Red exhibits two excitation peaks (396 nm and 510 nm); use 396 nm excitation for more selective detection of mitochondrial superoxide [9].
- Avoid prolonged incubation or high probe concentrations to prevent artifacts.
- For multiplexing with other probes, verify spectral compatibility and potential interactions.
Protocol: Assessment of Lipid Peroxidation Using BODIPY 581/591 C11
Principle: The oxidation-sensitive BODIPY 581/591 C11 probe undergoes a spectral shift upon oxidation by peroxides, changing fluorescence from red to green, enabling ratiometric measurement of lipid peroxidation [9].
Reagents and Equipment:
- Image-iT Lipid Peroxidation Kit or BODIPY 581/591 C11 reagent
- HBSS or appropriate buffer
- Anhydrous DMSO
- Oxidizing agent (e.g., cumene hydroperoxide) for positive control
- Antioxidant (e.g., Trolox) for negative control
- Fluorescence microscope with FITC and Texas Red filter sets
Procedure:
- Probe Preparation: Prepare 10 mM stock solution of BODIPY 581/591 C11 in DMSO. Protect from light and store at -20°C.
- Cell Loading: Seed cells in appropriate culture vessels. At desired confluence, replace medium with serum-free medium containing 1-10 μM BODIPY 581/591 C11.
- Incubation: Incubate cells for 30 minutes at 37°C protected from light.
- Washing: Wash cells 2-3 times with warm HBSS to remove excess probe.
- Treatment: Apply experimental treatments in HBSS or appropriate buffer.
- Imaging: Acquire images using both FITC (485/520 nm ex/em) and Texas Red (581/591 nm ex/em) filter sets [9].
- Analysis: Calculate ratio of green (oxidized) to red (reduced) fluorescence intensity.
Data Interpretation: Increased green/red fluorescence ratio indicates enhanced lipid peroxidation. Express results as fold-change relative to control conditions.
Technical Notes:
- The probe is compatible with live cells but not fixable.
- Minimize light exposure throughout the procedure to prevent photooxidation.
- Include controls with oxidizing agents and antioxidants to validate assay performance.
Signaling Pathways in Redox Biology
The following diagram illustrates the core signaling pathways that maintain redox homeostasis and the points where dysregulation leads to oxidative stress:
Diagram 1: Redox Homeostasis Signaling Network. This diagram illustrates the major sources of ROS/RNS, antioxidant defense systems, and the balance between physiological signaling and pathological damage that defines redox homeostasis.
The Scientist's Toolkit: Essential Research Reagents
Table 3: Essential Research Reagents for Redox Biology Studies
| Reagent Category | Specific Examples | Primary Application | Key Features & Considerations |
|---|---|---|---|
| General ROS Detection | CellROX Green/Orange/Deep Red, H2DCFDA | Detection of general cellular ROS levels | CellROX reagents are fixable and show low fluorescence until oxidized; H2DCFDA is more sensitive but can produce artifacts [9] |
| Superoxide-Specific Probes | MitoSOX Red/Green, Dihydroethidium (DHE) | Selective detection of superoxide, particularly mitochondrial | MitoSOX targeted to mitochondria; use 396 nm excitation for MitoSOX Red for optimal specificity; DHE requires HPLC validation for specific products [9] |
| Hydrogen Peroxide Probes | roGFP-based probes, Premo H2O2 Sensor | Specific detection of H₂O₂ dynamics | roGFP enables rationetric measurements; genetically encodable for subcellular targeting; provides quantitative readouts of H₂O₂ levels [9] |
| Nitric Oxide Detection | DAF-FM DA | Detection of intracellular nitric oxide | Fluorescence increases with NO accumulation; requires careful calibration and proper controls for specificity [9] |
| Lipid Peroxidation Reporters | BODIPY 581/591 C11, Image-iT Lipid Peroxidation Kit | Measurement of lipid peroxidation in live cells | Rationetric measurement (red-to-green shift upon oxidation); compatible with live-cell imaging [9] |
| Glutathione Status Probes | ThiolTracker Violet, Monochlorobimane (mBCI) | Assessment of glutathione levels and redox state | ThiolTracker Violet is fixable and suitable for subcellular localization; mBCI requires enzymatic conversion by glutathione S-transferase [9] |
| Antioxidant Enzymes | Recombinant SOD, Catalase, PEG-conjugated enzymes | Experimental modulation of antioxidant capacity | Used to scavenge specific ROS in extracellular milieu or when loaded into cells; PEG conjugation enhances cellular uptake and stability [3] [5] |
| ROS Generators | Antimycin A, Rotenone, Menadione, DMNQ | Inducing controlled ROS production in experimental systems | Antimycin A and rotenone inhibit mitochondrial ETC; DMNQ generates superoxide through redox cycling; menadione produces various ROS [7] |
The precise balance between ROS/RNS generation and antioxidant defenses—redox homeostasis—represents a fundamental biological principle with far-reaching implications for health and disease [1] [2]. Understanding the dual nature of reactive species as both essential signaling molecules and potential damaging agents provides critical insights for developing targeted therapeutic strategies [5] [2].
The experimental approaches and research tools outlined in this application note provide researchers with robust methodologies for investigating redox processes in physiological and pathological contexts. As the field advances, the development of more specific probes, improved spatial and temporal resolution in detection methods, and sophisticated computational models will further enhance our understanding of redox biology and its applications in drug development and precision medicine [8] [2]. The continuing elucidation of the "Redox Code" promises to reveal novel therapeutic targets for conditions ranging from neurodegenerative diseases to cancer, where redox dysregulation plays a central role [1] [2].
Redox species, particularly reactive oxygen species (ROS), embody a fundamental paradox in cellular biology. They are indispensable for normal physiological signaling yet, when dysregulated, become potent agents of molecular damage [10] [11]. This dualism is governed by the precise equilibrium between ROS generation and elimination—the redox homeostasis [10] [12]. Under physiological conditions, ROS generated by the mitochondrial oxidative respiratory chain, endoplasmic reticulum, and NADPH oxidases (NOX) are balanced by antioxidant responses, maintaining cellular function [10]. Disruption of this equilibrium leads to oxidative stress, a state implicated in a wide spectrum of diseases, from cancer and neurodegeneration to cardiovascular conditions [10] [12] [13]. This Application Note delineates the mechanisms of redox signaling and damage, and provides detailed protocols for measuring redox states in vivo, a core focus in the development of redox probes for oxidative stress measurement.
The Signaling Role of Redox Species
Redox signaling involves the specific, reversible modification of cellular components by ROS, orchestrating a range of physiological processes.
Molecular Mechanisms of Signaling
The chemistry of redox signaling predominantly involves the modification of specific protein cysteine thiols [14]. Key principles ensure specificity:
- Kinetics and Specificity: The reaction rate is determined by the rate constant and the concentrations of the target cysteine and the electrophilic ROS [14]. Specific cysteines are rendered reactive by ionization to the thiolate form (-S⁻), a potent nucleophile.
- Location: Steep concentration gradients of ROS exist in vivo; therefore, redox targets must be proximate to the ROS source to compete with cellular antioxidant defenses [14].
- Reversibility: Similar to other second messengers like calcium, physiological ROS production is transient. Enzymes like glutathione peroxidases and peroxiredoxins reverse cysteine modifications, ensuring transient signaling [14].
Key Signaling Pathways and Outcomes
- Cysteine Modification: ROS, particularly H₂O₂, can oxidize cysteine thiols to sulfenic acid (SOH), which can form disulfide bonds (S-S) or undergo S-glutathionylation (SSG). These reversible modifications directly alter protein structure, localization, and activity [10].
- NRF2 Activation: The transcription factor NRF2 is a master regulator of antioxidant responses. Under oxidative stress, NRF2 activates the transcription of genes encoding antioxidants like superoxide dismutase (SOD), catalase, and glutathione peroxidase (GPx) [10].
- Cell Fate Decisions: Redox signaling profoundly influences processes such as cell proliferation, differentiation, and programmed cell death. The localized redox state, rather than a global cellular measure, is critical in determining cell fate [11].
The following diagram illustrates the core signaling mechanism centered on cysteine modification.
The Damaging Role of Redox Species
When the antioxidant capacity of a cell is overwhelmed, the same ROS that function as messengers cause irreversible oxidative damage to crucial biomolecules, leading to loss of function and cell death [10] [12].
1. Lipid Peroxidation: ROS attack polyunsaturated fatty acids in cell membranes, generating lipid hydroperoxides. These decompose into reactive aldehydes like malondialdehyde (MDA) and 4-hydroxy-2-nonenal (4-HNE), which are themselves damaging and can form protein adducts [12] [15].
2. Protein Damage: ROS oxidize amino acid side chains and protein backbones, leading to the formation of protein carbonyls and advanced oxidation protein products (AOPP). This causes protein misfolding, loss of enzymatic activity, and aggregation [12].
3. DNA/RNA Damage: ROS, particularly the hydroxyl radical (•OH), cause oxidative lesions in nucleic acids, such as base modifications (e.g., 8-oxo-7,8-dihydro-2'-deoxyguanosine, 8OHdG) and single- or double-strand breaks. This results in genomic instability, mutations, and disrupted transcription/translation [10] [15].
Advanced Methods for Measuring Redox StateIn Vivo
Accurately measuring the dynamic and compartmentalized redox state in vivo is a central challenge. The table below summarizes key quantitative parameters for leading imaging modalities.
Table 1: Quantitative Data for In Vivo Redox State Measurement Techniques
| Measurement Technique | Key Measurable Parameters | Spatial Resolution / Application Context | Reported Signal Changes & Kinetics |
|---|---|---|---|
| EPR Spectroscopy with Nitroxide Probes [16] | Redox balance based on nitroxide radical (paramagnetic) to hydroxylamine (diamagnetic) conversion. | Tissue homogenates; validated in mouse brain, liver, lung, kidney, skeletal muscle. | Blood half-life: Multi-spin RS probe showed longer circulation than mito-TEMPO. Signal decay rate indicates reducing capacity. |
| PET Imaging [13] | Tracer retention reflecting superoxide, H₂O₂, or reductive environment (e.g., NADH). | Whole-body, non-invasive imaging in preclinical and clinical models (e.g., neurodegenerative diseases, cancer). | Tracers like [¹⁸F]ROStrace show enhanced retention in areas of high oxidative stress (e.g., neuroinflammation). |
| ¹⁹F-MRI with Nanoprobe PIBAM–FSeN [17] | Signal ratio SOx/(SOx + SRed) from reversible selenide/selenoxide switch. | Deep tissue tumor imaging in mouse models. | Reversible signal shift between -64.2 ppm (reduced) and -58.7 ppm (oxidized). >10-fold signal ratio change upon H₂O₂/Na₂S exposure; stable over 10 redox cycles. |
| Fluorescent Probes (e.g., DCFDA, DHE) [12] [15] | Fluorescence intensity for H₂O₂/ROO• (DCFDA) or superoxide (DHE). | Primarily in vitro and superficial tissues due to light penetration limits. | Intensity proportional to ROS levels. Kinetics are probe and cell-type dependent. |
Protocol: Redox Imaging Using a Reversible ¹⁹F-MRI Nanoprobe
This protocol details the use of PIBAM–FSeN nanoprobes for non-invasive, reversible monitoring of the redox state in vivo [17].
1. Principle: Trifluoromethyl-grafted selenide-containing nanoprobes undergo a reversible conformational shift between reduced (PIBAM–FSeN) and oxidized (PIBAM–FSeON) states. This shift causes a change in the ¹⁹F-NMR chemical shift, which can be quantified as the signal ratio SOx/(SOx + SRed) to report the local redox status.
2. Research Reagent Solutions: Table 2: Essential Materials for ¹⁹F-MRI Redox Imaging
| Item | Function / Description | Example / Note |
|---|---|---|
| PIBAM–FSeN Nanoprobe | Core reagent; self-assembled nanoparticle with high fluorine content (~16 wt%) for ¹⁹F-MRI signal. | Synthesized as described [17]. |
| Oxidizing Agent (e.g., H₂O₂) | To test probe response and calibrate the oxidized state signal. | Used for in vitro validation. |
| Reducing Agent (e.g., Na₂S) | To test probe response and calibrate the reduced state signal. | Used for in vitro validation. |
| Phosphate Buffered Saline (PBS), 20 mM, pH 7.4 | Preparation buffer for nanoprobes and tissue homogenates. | Ensures physiological pH. |
| 7-Tesla MRI Scanner | Instrumentation for ¹⁹F-MRI data acquisition. | Equipped with ¹⁹F/¹H radiofrequency coils. |
| Software for ¹⁹F-MRI Analysis | For image processing and quantification of SOx and SRed signals. | Custom or commercial packages. |
3. Experimental Workflow: The step-by-step procedure for using the nanoprobe is outlined below.
4. Procedure:
Step 1: Probe Preparation and Characterization
- Synthesize PIBAM–FSeN nanoprobes and form nanoparticles via ultrasonic emulsification [17].
- Characterize the nanoparticles for size (using Dynamic Light Scattering), stability, and fluorine content. Confirm the ¹⁹F-NMR peaks: -64.2 ppm (reduced, SRed) and -58.7 ppm (oxidized, SOx).
Step 2: In Vitro Calibration and Validation
- Treat a solution of PIBAM–FSeN NPs (10 mg/mL in water or PBS) with varying equivalents of H₂O₂ (oxidant) or Na₂S (reductant).
- Acquire ¹⁹F-NMR spectra after each treatment.
- Plot the ratio AOx/(AOx + ARed) (from NMR) or SOx/(SOx + SRed) (from MRI phantoms) against the concentration of the added analyte to generate a standard curve.
- Validate reversibility by subjecting the probe to at least 3 cycles of alternating H₂O₂ and Na₂S exposure.
Step 3: In Vivo Administration and Imaging
- Administer the PIBAM–FSeN nanoprobes intravenously to an anesthetized mouse (e.g., at 10 µmol per 25 g mouse) [16] [17].
- Place the animal in the MRI scanner. For tumor models, image when the probe has accumulated at the target site.
- Acquire ¹⁹F-MRI data using a Refocused Echo (RARE) sequence. Set the RF excitation frequencies to the center of the reduced (-64.2 ppm, "blue channel") and oxidized (-58.7 ppm, "red channel") peaks.
Step 4: Data Analysis
- Quantify the ¹⁹F-MRI signal intensity in the region of interest (ROI) for both the SOx and SRed channels.
- Calculate the redox ratio: SOx / (SOx + SRed).
- Compare the ratio in the target tissue (e.g., tumor) to that in control tissues or to the baseline.
5. Data Interpretation:
- A high redox ratio indicates a more oxidizing environment.
- A low redox ratio indicates a more reducing environment.
- The dynamic, reversible nature of the probe allows for monitoring changes in redox state over time, for instance, in response to a therapeutic intervention.
Protocol: Assessing Oxidative Damage Biomarkers
This protocol describes the measurement of common biomarkers of oxidative damage to lipids and proteins, which is crucial for confirming oxidative stress [12].
1. Measurement of Lipid Peroxidation via TBARS Assay
- Principle: Malondialdehyde (MDA), a product of lipid peroxidation, reacts with thiobarbituric acid (TBA) to form a pink, fluorescent adduct.
- Procedure:
- Prepare tissue homogenates or plasma/serum samples in a cold buffer.
- Add TBA reagent in an acidic medium and heat the mixture at 100°C for 15-45 minutes.
- Cool the samples and extract the pink product with n-butanol.
- Measure the fluorescence (λex = 515 nm, λem = 555 nm) or absorbance (at 520-535 nm) of the organic layer.
- Data Analysis: Quantify MDA concentration using a standard curve prepared with known MDA solutions (e.g., tetramethoxypropane). Express results as nmol MDA per mg protein.
2. Measurement of Protein Carbonyls via DNPH Method
- Principle: Reactive oxygen species oxidize protein side chains to form carbonyl groups, which react with 2,4-dinitrophenylhydrazine (DNPH) to form dinitrophenylhydrazone.
- Procedure:
- Split the protein sample (from tissue homogenate or plasma) into two aliquots.
- Treat one aliquot with 2 M HCl (blank) and the other with an equal volume of 10 mM DNPH in 2 M HCl.
- Incubate in the dark for 1 hour, with vortexing every 15 minutes.
- Precipitate the proteins with trichloroacetic acid (e.g., 20% final concentration), wash the pellet multiple times with an ethanol:ethyl acetate mixture to remove free DNPH.
- Dissolve the final pellet in a known volume of guanidine hydrochloride solution.
- Data Analysis: Measure the absorbance of the DNPH-treated sample against the HCl-treated blank at 375 nm. Calculate the carbonyl content using the molar absorptivity of 22,000 M⁻¹cm⁻¹. Express results as nmol carbonyl per mg protein.
The dual nature of redox species as both signaling molecules and damaging agents is a cornerstone of modern pathophysiology. The shift in research focus from "oxidative stress" as purely detrimental to "redox signaling" as a sophisticated regulatory mechanism underscores the need for precise, dynamic, and compartment-specific measurement tools [11]. The protocols detailed herein, particularly the emerging capabilities of reversible molecular probes for in vivo imaging with ¹⁹F-MRI and EPR, provide a powerful toolkit for researchers and drug developers. These technologies enable the non-invasive interrogation of redox biology in deep tissues, paving the way for a deeper understanding of disease mechanisms and the development of targeted redox-based therapeutics.
Reactive oxygen species (ROS) are highly reactive oxygen-derived molecules, including both radical and non-radical species, that play a dual role in cellular physiology and pathology [18]. At physiological levels, ROS function as crucial signaling molecules in processes such as cellular proliferation, immune response, and metabolic adaptation [19] [5]. However, when overproduced or inadequately neutralized by antioxidant systems, ROS induce oxidative stress, leading to damage to DNA, proteins, and lipids, and contributing to the pathogenesis of numerous chronic diseases [19] [20]. The major intracellular sources of ROS include mitochondrial electron transport, NADPH oxidase (NOX) enzymes, and several other enzymatic systems [18] [21]. Understanding the precise mechanisms, locations, and regulation of these ROS sources is fundamental for developing targeted therapeutic interventions in redox-related diseases and for advancing research on in vivo oxidative stress measurement.
Mitochondrial ROS Production
Mitochondria represent the primary source of ROS in most mammalian cells, generating these species mainly as byproducts of aerobic ATP synthesis [18] [22]. The electron transport chain (ETC) within the mitochondrial inner membrane is the dominant site for mitochondrial ROS (mtROS) generation, primarily at Complex I (CI) and Complex III (CIII) [23] [22].
Forward Electron Transfer (FET): During normal respiration with substrates like glutamate/malate or pyruvate/malate, electrons from NADH enter the ETC at CI, flow through ubiquinone (CoQ) to CIII, and then to cytochrome c and Complex IV (CIV), which reduces oxygen to water. During this process, electron leakage primarily at CI and the outer ubiquinone-binding site of CIII (CIIIo) can reduce molecular oxygen (O₂) to form superoxide anion (O₂•⁻) [22]. This basal ROS production remains relatively low under coupled respiration conditions where ATP is being synthesized [23] [22].
Reverse Electron Transfer (RET): When succinate serves as the primary electron donor (via Complex II), the ubiquinone pool becomes highly reduced. Under conditions of high mitochondrial membrane potential (ΔΨm) – such as when ATP synthesis is limited – electrons can flow backwards from ubiquinol through CI, reducing NAD⁺ to NADH and generating substantial superoxide at the flavin site of CI [22]. RET represents the most potent mechanism for mtROS production, yielding levels far exceeding those of FET [22]. This process is physiologically relevant in signaling and pathologically relevant in conditions like ischemia-reperfusion injury [22].
The production of mtROS is governed by several key factors: the protonmotive force (Δp), the NADH/NAD⁺ ratio, the reduction state of the CoQ pool, and the local oxygen concentration [23]. Mitochondria possess their own antioxidant defense, primarily manganese superoxide dismutase (MnSOD/SOD2), which rapidly converts superoxide to hydrogen peroxide (H₂O₂) in the matrix [23] [5].
NADPH Oxidase (NOX) Enzyme Family
The NADPH oxidase (NOX) family represents specialized enzymes dedicated to controlled ROS generation for specific physiological functions [19] [24]. Unlike mitochondrial ROS production, which occurs as a byproduct of metabolism, NOX enzymes catalytically produce superoxide or hydrogen peroxide in response to various stimuli [24]. The NOX family comprises seven members: NOX1, NOX2, NOX3, NOX4, NOX5, DUOX1, and DUOX2, each with distinct tissue distributions, activation mechanisms, and biological roles [24].
The prototypical NOX2 (originally identified in phagocytes) is a multi-component complex crucial for innate immunity. Upon activation, cytosolic subunits (p47phox, p67phox, p40phox, and Rac GTPase) translocate to and associate with the transmembrane cytochrome b558 (comprising NOX2 and p22phox), leading to electron transfer from NADPH to oxygen and generating superoxide into phagosomal or extracellular spaces [19] [24]. This "oxidative burst" produces massive ROS quantities for microbial killing [19].
Other NOX isoforms generate ROS for diverse functions: NOX1 in colon epithelium and vascular smooth muscle; NOX3 primarily in inner ear for vestibular function; NOX4 which constitutively produces H₂O₂ in kidneys and blood vessels; NOX5 in reproductive and vascular tissues; and DUOX1/2 in thyroid for hormone synthesis and in epithelial for mucosal defense [19] [24]. NOX-derived ROS serve as important signaling molecules in cell growth, differentiation, and gene expression, but their overactivity contributes to chronic diseases including atherosclerosis, hypertension, diabetic nephropathy, and neurodegenerative disorders [19] [5].
Beyond mitochondria and NOX enzymes, several other cellular systems contribute to the ROS landscape:
Endoplasmic Reticulum (ER): ROS production occurs during protein folding through electron transfer reactions involving cytochrome P450 systems [18] [5]. Under conditions of ER stress, this ROS production can increase significantly.
Peroxisomes: These organelles generate H₂O₂ as a byproduct of fatty acid β-oxidation and other metabolic reactions, which is normally degraded by local catalase [5].
Xanthine Oxidase: This enzyme, involved in purine metabolism, produces superoxide and H₂O₂ during its catalytic cycle and is a significant contributor to ischemia-reperfusion injury [5].
Uncoupled Nitric Oxide Synthase (NOS): Under conditions of substrate (L-arginine) or cofactor (tetrahydrobiopterin) deficiency, NOS enzymes become uncoupled and produce superoxide instead of nitric oxide [18].
Table 1: Major Cellular ROS Sources and Their Characteristics
| ROS Source | Primary ROS Produced | Subcellular Localization | Main Physiological Functions |
|---|---|---|---|
| Mitochondrial ETC | O₂•⁻, H₂O₂ | Mitochondrial matrix, inner membrane | Metabolic signaling, hypoxia adaptation |
| NOX Enzymes | O₂•⁻ (NOX1-3,5), H₂O₂ (NOX4, DUOX) | Plasma membrane, various intracellular membranes | Host defense, cellular signaling, hormone synthesis |
| ER Cytochrome P450 | O₂•⁻, H₂O₂ | Endoplasmic reticulum | Detoxification, steroid synthesis |
| Xanthine Oxidase | O₂•⁻, H₂O₂ | Cytoplasm | Purine metabolism |
| Peroxisomes | H₂O₂ | Peroxisomal matrix | Fatty acid oxidation |
Quantitative Comparison of ROS Production
The quantitative assessment of ROS production from different sources presents significant technical challenges due to the reactivity and short half-life of many ROS species, compartmentalized production, and overlapping contributions from multiple sources [23] [25]. However, understanding relative production rates and conditions that favor ROS generation is crucial for experimental design and data interpretation.
Table 2: Quantitative Aspects of Major ROS Sources
| ROS Source | Production Rate | Key Regulatory Factors | Major Experimental Inhibitors |
|---|---|---|---|
| Mitochondria (FET) | Low under physiological conditions | ΔΨm, NADH/NAD⁺ ratio, [O₂] | Rotenone (CI), Myxothiazol (CIII) |
| Mitochondria (RET) | High (up to 10x FET) | High ΔΨm, reduced CoQ pool, succinate availability | Rotenone, DPI, FCCP (uncoupler) |
| NOX2 (Phagocytic) | Very high during oxidative burst | Cytosolic subunit translocation, Rac activation | DPI, AEBSF, gp91ds-tat |
| NOX4 | Constitutive low-moderate | Expression level, oxygen availability | GKT137831 (specific inhibitor) |
| Xanthine Oxidase | Variable | Hypoxia, substrate accumulation | Allopurinol, Febuxostat |
Mitochondrial ROS production demonstrates a complex dependence on oxygen concentration. While ROS generation generally increases with [O₂] above atmospheric levels, some studies indicate that H₂O₂ production rates may remain constant as [O₂] decreases from ~200 μM to ~5 μM, only declining below approximately 5 μM [23]. This has important implications for physiological ROS signaling, as mitochondrial [O₂] in vivo is estimated to range between 3-30 μM, significantly lower than in air-saturated buffer (~200 μM) [23]. Consequently, extrapolating ROS production rates from isolated mitochondria to in vivo conditions can be misleading [23].
For NOX enzymes, production rates vary tremendously by isoform and cellular context. Phagocytic NOX2 can generate micromolar to millimolar concentrations of superoxide in phagosomes within minutes during the oxidative burst [19]. In contrast, NOX4 produces H₂O₂ at a constitutive, lower rate that appears to be regulated primarily by its expression level rather than acute activation mechanisms [24].
Protocol: Measuring Mitochondrial ROS Production in Isolated Mitochondria
Principle: This protocol utilizes fluorescent probes to detect H₂O₂ release from isolated mitochondria under various substrate conditions to probe different ROS production mechanisms [23] [22].
Materials:
- Isolation buffer (e.g., Mannitol/Sucrose/HEPES/EGTA)
- Substrates: Glutamate/Malate (for FET), Succinate (for RET)
- Inhibitors: Rotenone (CI), Antimycin A (CIII), Myxothiazol (CIIIo)
- Uncoupler: FCCP
- H₂O₂ detection system: Amplex Red/Horseradish Peroxidase or other fluorescent probe
- Fluorometer with temperature control and stirring
Procedure:
- Isolate mitochondria from target tissue (e.g., liver, heart) using differential centrifugation.
- Resuspend mitochondria in assay buffer containing appropriate detection reagents.
- For FET measurement: Add glutamate (5 mM) and malate (2.5 mM) to initiate respiration. Monitor basal H₂O₂ production.
- For RET measurement: Add succinate (5-10 mM) in the absence of ADP to induce high membrane potential and RET. The addition of rotenone (1-2 μM) should suppress this ROS production.
- Inhibitor studies:
- Add rotenone (1-2 μM) to inhibit CI and distinguish CI-derived ROS.
- Add antimycin A (2-5 μM) to inhibit CIIIi and enhance CIIIo-derived ROS.
- Add myxothiazol (1-2 μM) to inhibit CIIIo and suppress CIIIo-derived ROS.
- Uncoupler control: Add FCCP (0.5-1 μM) to dissipate ΔΨm and suppress RET-dependent ROS.
- Normalize ROS production rates to mitochondrial protein content.
Interpretation: RET typically produces significantly higher ROS rates than FET. Sensitivity to rotenone and FCCP confirms RET involvement, while response to specific CIII inhibitors helps distinguish CI vs. CIII contributions [22].
Protocol: Assessing NOX Activity in Cell Systems
Principle: This protocol measures superoxide production in intact cells or cell membranes in response to specific NOX activators, using chemiluminescent or fluorescent detection [19] [24].
Materials:
- Luminol- or lucigenin-based chemiluminescence reagents
- Cell permeant fluorescent probes (e.g., DHE for O₂•⁻)
- NOX activators: PMA (for NOX2), specific cytokines or agonists for other isoforms
- NOX inhibitors: DPI, specific isoform inhibitors
- NADPH (for cell-free systems)
Procedure:
- Cell preparation: Culture appropriate cell type (e.g., neutrophils for NOX2, vascular smooth muscle for NOX1).
- Stimulation: Add specific activator (e.g., PMA 100 ng/mL for NOX2) to stimulate NOX assembly and activation.
- Detection:
- For chemiluminescence: Add luminol/lucigenin and measure light emission over time.
- For fluorescence: Add cell-permeant probe and measure fluorescence increase.
- Inhibition: Pre-treat with NOX inhibitors (e.g., DPI 10 μM) to confirm NOX-specific signal.
- Cell-free system: Isolate membrane fractions containing NOX complex and cytosol containing regulatory subunits. Add NADPH (100-200 μM) as electron donor and measure ROS production.
Interpretation: PMA-stimulated, DPI-inhibitable ROS production indicates NOX2 activity in phagocytes. Specific siRNA knockdown of individual NOX isoforms helps identify contributions in cells expressing multiple isoforms.
Emerging Protocol: In Vivo ROS Measurement with Ingestible Sensors
Principle: Recent advances in miniaturized sensors allow direct measurement of redox potential in inaccessible environments like the gastrointestinal tract [26].
Materials:
- Miniaturized ingestible sensor with oxidation-reduction potential (ORP) sensor, reference electrode, pH and temperature sensors
- Wireless data receiver
- Calibration solutions
Procedure:
- Calibrate the sensor in standard ORP solutions before administration.
- The subject ingests the capsule, which transmits data wirelessly to an external receiver.
- Record ORP, pH, and temperature at high temporal resolution (e.g., every 20 seconds) throughout GI transit.
- Correlate redox dynamics with anatomical location using pH transitions as landmarks.
Interpretation: The GI tract demonstrates a consistent redox gradient from oxidative in the stomach to strongly reducing in the large intestine [26]. Deviations from this profile may indicate pathological oxidative stress.
The Scientist's Toolkit: Essential Research Reagents
Table 3: Key Reagents for ROS Source Research
| Reagent Category | Specific Examples | Primary Application | Key Considerations |
|---|---|---|---|
| Mitochondrial Inhibitors | Rotenone, Antimycin A, Myxothiazol, FCCP | Mapping ETC ROS production sites | Concentration-dependent effects; FCCP uncouples respiration |
| NOX Inhibitors | DPI, Apocynin, GKT137831 | Distinguishing NOX from mitochondrial ROS | DPI inhibits flavoproteins including mitochondrial CI |
| Fluorescent Probes | Amplex Red (H₂O₂), MitoSOX (mtO₂•⁻), DHE (O₂•⁻) | Detecting specific ROS in cells/subcellular compartments | Specificity limitations; compartmentalization important |
| Genetic Tools | siRNA/shRNA for NOX isoforms, NRF2 knockout cells | Defining specific source contributions | Off-target effects require proper controls |
| Activity Assays | Lucigenin CL, Amplex Red/HRP, Cytochrome c reduction | Quantitative ROS production measurement | Artifact potential (e.g., lucigenin redox cycling) |
ROS Signaling Pathways and Experimental Workflows
The following diagram illustrates the major cellular ROS sources, their regulatory relationships, and the resulting biological effects that can be measured in experimental settings.
Diagram 1: Major Cellular ROS Sources, Regulation, and Experimental Assessment. This diagram illustrates the primary cellular ROS sources (mitochondrial ETC, NOX enzymes, and other sources), key regulatory factors, the ROS species produced, and their downstream effects on oxidative stress and redox signaling. Dashed lines indicate experimental approaches for investigating these pathways.
Understanding the major sources of cellular ROS – particularly mitochondria and NOX enzymes – provides a critical foundation for research on oxidative stress in health and disease. Mitochondria generate ROS primarily as metabolic byproducts, with production rates highly dependent on respiratory state and substrate availability, while NOX enzymes produce ROS in a highly regulated manner for specific physiological functions. The experimental approaches outlined here, from isolated organelle studies to emerging in vivo measurement technologies, provide powerful tools for dissecting the contributions of these different sources. As redox biology continues to evolve, the development of more specific probes, inhibitors, and measurement technologies will further enhance our ability to precisely quantify and manipulate ROS from specific sources, advancing both basic understanding and therapeutic applications in redox-related diseases.
Cysteine residues occupy a unique position in the proteome due to their thiolate side chains that combine high nucleophilicity with redox sensitivity, making them prime targets for a diverse and ever-expanding array of post-translational modifications (PTMs) [27]. These oxidative PTMs (oxiPTMs) represent a crucial mechanism for cellular redox signaling and regulation, fine-tuning protein functions in response to reactive oxygen species (ROS), reactive nitrogen species (RNS), and reactive sulfur species (RSS) [28]. The major cysteine oxiPTMs include S-sulfenylation (RSOH), S-nitrosylation (RSNO), and S-glutathionylation (RSSG), which function as molecular switches that regulate protein activity, stability, conformational changes, interactions, and subcellular localization [29] [28].
These modifications are particularly relevant in the context of oxidative stress measurement, as they serve as durable molecular footprints of redox imbalance. Unlike short-lived reactive species, oxiPTMs create stable modifications that can be quantified to assess oxidative stress levels in biological systems [30] [31]. The reversibility of most thiol-based oxiPTMs provides a regulatory mechanism for rapid response to changing redox conditions, while also presenting challenges for accurate measurement due to their labile nature [27] [29]. Advanced analytical approaches have emerged to capture these dynamic modifications, enabling researchers to map redox landscapes in complex biological systems and link specific chemical modifications to functional outcomes in health and disease [27] [13].
Comparative Analysis of Key Cysteine OxiPTMs
Table 1: Characteristics of Major Cysteine Oxidative Post-Translational Modifications
| Modification Type | Chemical Formula | Inducing Species | Stability | Biological Functions | Detection Challenges |
|---|---|---|---|---|---|
| S-Sulfenylation | Cys-SOH → Cys-SH + H₂O | H₂O₂, ROS [28] | Intermediate (transient) | Redox sensing, signaling intermediate [29] | Transient nature, requires trapping [27] |
| S-Nitrosylation | Cys-SNO | NO·, RNS [28] | Moderate | Vasodilation, synaptic plasticity [32] | Light-sensitive, labile during sample processing [27] |
| S-Glutathionylation | Cys-SSG | ROS, GSH/GSSG imbalance [32] | High (stable) | Cyto-protection, redox regulation [28] [32] | Requires specific enzymatic reversal [32] |
Table 2: Quantitative Dynamics of Cysteine OxiPTMs in Pathophysiological Contexts
| Modification | Normal Physiological Role | Pathological Alterations | Associated Diseases |
|---|---|---|---|
| S-Sulfenylation | H₂O₂ sensing, signal transduction [29] [28] | Age-dependent increases, aberrant signaling [27] | Neurodegenerative diseases [27] |
| S-Nitrosylation | Regulation of synaptic function, metabolism [32] | Aberrant modification of key neuronal proteins [27] | Alzheimer's, Parkinson's, Huntington's [27] |
| S-Glutathionylation | Protection from irreversible oxidation [28] [32] | Persistent accumulation, dysregulated cell death [32] | Cardiovascular, pulmonary, malignant diseases [32] |
Experimental Protocols for Detection and Quantification
Protocol: Chemoselective Profiling of S-Sulfenylation Using DYn-2 Probes
Principle: This protocol utilizes DYn-2 (1-(pent-4-yn-1-yl)-1H-benzo[c][1,2]thiazin-4(3H)-one 2,2-dioxide), a chemoselective probe that specifically labels sulfenylated proteins in intact cells through nucleophilic addition to cysteine sulfenic acids [28].
Workflow:
- Cell Preparation and Labeling:
- Grow cells under experimental conditions (normal vs. oxidative stress)
- Incubate with DYn-2 probe (50-100 μM) for 2-4 hours at 37°C
- Wash cells with cold PBS to remove excess probe
Protein Extraction and Processing:
- Lyse cells using non-reducing RIPA buffer supplemented with protease inhibitors
- Centrifuge at 14,000 × g for 15 minutes at 4°C to collect supernatant
- Determine protein concentration using BCA assay
Biotin Conjugation via Click Chemistry:
- Prepare click reaction mixture: 100 μM azide-biotin, 1 mM CuSO₄, 1 mM TBTA ligand, 2 mM sodium ascorbate in PBS
- Incubate with labeled proteins for 2 hours at room temperature with gentle rotation
- Precipitate proteins using cold acetone to remove excess reagents
Affinity Purification and Analysis:
- Resuspend proteins in PBS with 1% SDS
- Incubate with streptavidin-agarose beads overnight at 4°C
- Wash beads sequentially with: PBS + 1% SDS, PBS + 1M NaCl, and PBS
- Elute bound proteins using Laemmli buffer with 50 mM DTT or by photocleavage
- Analyze by western blot or mass spectrometry
Validation: The identified sulfenylation sites should be validated using site-directed mutagenesis followed by functional assays to determine the biological impact of the modification [28].
Protocol: Biotin-Switch Technique for S-Nitrosylation Detection
Principle: The biotin-switch technique selectively converts S-nitrosylated cysteines to biotinylated tags through a series of chemical substitutions, allowing affinity enrichment and detection [27].
Procedure:
- Block Free Thiols:
- Lyse tissues or cells in HEN buffer (250 mM HEPES pH 7.7, 1 mM EDTA, 0.1 mM neocuproine) with 2.5% SDS
- Add methyl methanethiosulfonate (MMTS) to 20 mM final concentration
- Incubate at 50°C for 20 minutes with frequent vortexing
- Precipitate proteins with acetone, wash twice, and resuspend in HENS buffer
Selective Reduction of S-Nitrosothiols:
- Treat proteins with ascorbate (100 mM final concentration) for 1 hour at room temperature
- Include negative controls without ascorbate to assess specificity
Biotin Labeling and Capture:
- Add HPDP-biotin (4 mM in DMSO) to 1 mM final concentration
- Incubate for 1 hour at room temperature
- Precipitate proteins and resuspend in neutralization buffer
- Incubate with streptavidin-agarose beads for 1 hour at room temperature
- Wash beads extensively and elute with Laemmli buffer containing β-mercaptoethanol
Critical Considerations: All steps must be performed with minimal light exposure to prevent photolytic decomposition of S-nitrosothiols. Freshly prepared ascorbate is essential for consistent results [27].
Protocol: Quantitative Redox Proteomics for S-Glutathionylation
Principle: This protocol combines selective enrichment of glutathionylated proteins with stable isotope labeling for quantitative assessment of modification dynamics under different physiological conditions [32].
Methodology:
- Sample Preparation under Non-Reducing Conditions:
- Lyse tissues or cells in nitrogen-purged buffer containing 50 mM N-ethylmaleimide (NEM) to block free thiols
- Use sonication for efficient lysis while maintaining anaerobic conditions
- Remove excess NEM by acetone precipitation
Selective Reduction and Labeling:
- Reduce protein-glutathione mixed disulfides with glutaredoxin (GRX) enzymatically or using specific chemical reductants
- Immediately label newly exposed thiols with isotope-coded affinity tags (ICAT) or TMT reagents
- For multiplexed quantification, use different isotopic forms for experimental conditions
Proteomic Analysis:
- Digest proteins with trypsin after affinity purification
- Analyze peptides by LC-MS/MS with collision-induced dissociation
- Identify and quantify modification sites using database searching and specialized software
Applications: This approach enables monitoring dynamic changes in S-glutathionylation during oxidative stress, inflammatory responses, and drug treatments, providing insights into redox regulation mechanisms [32].
Visualization of OxiPTM Pathways and Detection Workflows
Cysteine OxiPTM Formation and Detection Pathways
General Workflow for OxiPTM Detection
The Scientist's Toolkit: Essential Research Reagents and Materials
Table 3: Key Research Reagents for Cysteine OxiPTM Studies
| Reagent Category | Specific Examples | Function/Application | Considerations |
|---|---|---|---|
| Chemoselective Probes | DYn-2, BTD-based probes [28] | Selective labeling of sulfenic acids in intact cells | Superior reactivity of BTD vs DYn-2 for comprehensive profiling |
| Thiol-Blocking Reagents | N-ethylmaleimide (NEM), iodoacetamide (IAM) [32] | Alkylation of free thiols to prevent artifactual oxidation | Must use fresh preparations, optimize concentration |
| Enzymatic Reduction Systems | Glutaredoxin (GRX1, GRX2), Thioredoxin [32] | Specific reversal of S-glutathionylation | GRX1 (cytoplasmic), GRX2 (mitochondrial/nuclear) have compartment-specific roles |
| Affinity Tags | HPDP-biotin, Azide-biotin conjugates [27] [28] | Tagging reduced thiols for enrichment and detection | Compatibility with click chemistry conditions |
| Capture Resins | Streptavidin-agarose, NeutrAvidin beads [28] | Affinity purification of biotinylated proteins | Varying binding capacities, non-specific binding must be controlled |
| Mass Spectrometry Standards | TMT, iTRAQ, ICAT reagents [32] | Multiplexed quantification of modification changes | Isotope purity, labeling efficiency critical for accuracy |
Applications in Redox Probe Development and Validation
The study of cysteine oxiPTMs provides critical validation tools for developing novel redox probes for in vivo oxidative stress measurement. Several advanced technologies have emerged from understanding these molecular modifications:
Ingestible Redox Sensors: Recent innovations include miniaturized ingestible sensors equipped with oxidation-reduction potential (ORP) sensors that can directly measure redox balance along the gastrointestinal tract [26]. These wireless capsules (21mm × 7.5mm) contain platinum working electrodes, custom reference electrodes, and pH/temperature sensors, providing high-temporal-resolution data (every 20 seconds) from an oxidative environment in the stomach to a strongly reducing environment in the large intestine [26]. This technology demonstrates how fundamental understanding of redox biology translates to clinical measurement tools.
PET Tracers for Oxidative Stress: Molecular imaging strategies have led to the development of positron emission tomography (PET) radiotracers capable of selectively imaging reactive oxygen and nitrogen species in vivo [13]. Key developments include:
- [¹⁸F]ROStrace and [¹⁸F]FDHM: Dihydroethidium-based tracers for superoxide detection
- [¹⁸F]4FN: Targets NADPH oxidase (NOX2)-mediated oxidative bursts
- [¹⁸F]FEDV: Based on edaravone scaffold with specificity for peroxynitrite and lipid peroxidation products
These tracers engage distinct biochemical pathways, from hydrogen peroxide and redox homeostasis to hypoxia and immune-associated ROS, offering complementary insights into redox pathophysiology [13].
Iridium-Based Redox Capacity Assays: The iridium-reducing capacity assay (Ir-RCA) represents a global measurement approach for oxidative stress that detects stable molecular features in biological samples [31]. This method offers several advantages, including simple optical/electrochemical measurements, high sensitivity compared to alternative antioxidant assays, and "movable" measurements that can track dynamic responses to external stressors or interventions [31].
The integration of cysteine oxiPTM analysis with these advanced measurement technologies creates a powerful framework for validating redox probes and establishing their biological relevance in model systems and clinical applications.
Maintaining redox homeostasis is a critical biological process for cell survival, function, and signaling. The antioxidant defense network is an intricately coordinated system of enzymes and signaling pathways that collectively neutralize reactive oxygen species (ROS) and prevent oxidative damage. At the core of this network are the enzymatic antioxidants superoxide dismutase (SOD), catalase (CAT), and the glutathione (GSH) system, all of which are centrally regulated by the transcription factor NRF2 (Nuclear factor erythroid 2-related factor 2) [10]. Under physiological conditions, ROS generated by mitochondrial respiration, NADPH oxidases, and other sources are efficiently balanced by these antioxidant mechanisms [10]. This application note delineates the components, functions, and regulatory mechanisms of this network, providing detailed experimental protocols for investigating its function within the context of advanced in vivo oxidative stress measurement research. A profound understanding of these interconnected systems is essential for developing novel therapeutic strategies for oxidative stress-related diseases, including neurodegenerative disorders, cardiovascular conditions, and cancer [33] [34] [10].
Core Components of the Antioxidant Defense Network
Superoxide Dismutase (SOD): The First Line of Defense
SODs constitute the primary defense against superoxide radicals (O₂•⁻), catalyzing their dismutation into hydrogen peroxide (H₂O₂) and oxygen (O₂) [33] [35]. This reaction occurs at an exceptionally high rate, accelerated by a factor of approximately 10,000 compared to the spontaneous non-enzymatic reaction [33]. In humans, three distinct isoforms exist, each with unique localization and metal cofactors [33] [35].
Table 1: Human Superoxide Dismutase (SOD) Isoforms
| Isoform | Symbol | Cellular Localization | Metal Cofactor | Primary Function |
|---|---|---|---|---|
| Copper/Zinc SOD | SOD1 | Cytoplasm, nucleus, mitochondrial intermembrane space | Cu²⁺ (catalytic), Zn²⁺ (structural) | Primary intracellular SOD; scavenges cytosolic O₂•⁻ [33] [35] |
| Manganese SOD | SOD2 | Mitochondrial matrix | Mn³⁺ (catalytic) | Protects mitochondria from O₂•⁻ produced by the electron transport chain [33] [35] |
| Extracellular SOD | SOD3 | Extracellular matrix, blood vessels, lymph | Cu²⁺ (catalytic), Zn²⁺ (structural) | Binds to cell surfaces and extracellular matrix; protects extracellular spaces [33] [35] |
The enzymatic mechanism of Cu/Zn-SOD involves the alternate reduction and oxidation of the copper ion at the active site, effectively dismutating superoxide [35]. The rate of this reaction is enhanced by electrostatic guidance, which directs the negatively charged superoxide radical toward the enzyme's active site [33].
Catalase: The Hydrogen Peroxide Neutralizer
Catalase is a heme-containing enzyme primarily located in peroxisomes that efficiently decomposes hydrogen peroxide (H₂O₂) into water and molecular oxygen [34] [36]. It serves as a crucial follow-up defense to SOD, preventing the accumulation of H₂O₂, which can otherwise participate in Fenton chemistry to generate highly toxic hydroxyl radicals (·OH) [36]. The reaction mechanism is a two-step process:
- H₂O₂ + Fe(III)-E → H₂O + O=Fe(IV)-E (Compound I)
- H₂O₂ + O=Fe(IV)-E → H₂O + Fe(III)-E + O₂ Here, Fe(III)-E represents the native iron enzyme, and Compound I is a covalent oxyferryl species [36]. Catalase is particularly important in tissues with high peroxisomal fatty acid oxidation rates and has demonstrated therapeutic potential in mitigating oxidative stress in neurodegenerative and cardiovascular diseases [34].
The Glutathione System: A Versatile Redox Buffer
Glutathione (GSH, γ-L-glutamyl-L-cysteinyl-glycine) is the most abundant low-molecular-weight thiol in cells and acts as a central redox buffer and detoxifying agent [37]. The GSH system encompasses both non-enzymatic and enzymatic actions.
GSH Synthesis and Homeostasis: GSH is synthesized in the cytoplasm in two ATP-dependent steps catalyzed by glutamate-cysteine ligase (GCL, the rate-limiting enzyme) and glutathione synthase (GS) [37]. Its homeostasis is tightly regulated, with the majority present in the reduced form (GSH) and a small fraction in the oxidized disulfide form (GSSG). The ratio of GSH to GSSG is a key indicator of cellular redox status [37].
Enzymatic Functions: Glutathione peroxidase (GPx) uses GSH to reduce H₂O₂ and lipid hydroperoxides to water and corresponding alcohols, producing GSSG. Glutathione reductase (GR) then regenerates GSH from GSSG using NADPH as an electron donor [37] [10].
Post-Translational Regulation: Beyond its antioxidant role, GSH is involved in the post-translational modification known as S-glutathionylation, where it forms a mixed disulfide with protein cysteine residues. This reversible process can regulate the activity of various signaling proteins and is critical for redox signaling [37].
The NRF2 Signaling Pathway: The Master Regulator
NRF2 is a cap'n'collar (CNC) basic region leucine zipper (bZIP) transcription factor that serves as the master regulator of the cellular antioxidant response [38] [10]. Under basal (non-stressed) conditions, NRF2 is constantly ubiquitinated and targeted for proteasomal degradation in the cytoplasm by its negative regulator, KEAP1 (Kelch-like ECH-associated protein 1) [38]. KEAP1 acts as a cysteine-rich sensor for ROS and electrophiles.
Upon exposure to oxidative stress or electrophilic compounds, critical cysteine residues in KEAP1 are modified. This inactivates the KEAP1-CUL3 E3 ubiquitin ligase complex, leading to NRF2 stabilization. NRF2 then translocates to the nucleus, heterodimerizes with small MAF proteins, and binds to the Antioxidant Response Element (ARE) in the promoter regions of its target genes [38] [10]. This orchestrates the transcriptional activation of a vast network of over 200 genes, including:
- Antioxidant Enzymes: SOD1, Catalase, GPx, Peroxiredoxins, and the enzymes for GSH synthesis (GCL, GS) [10].
- Detoxification Enzymes: NAD(P)H quinone dehydrogenase 1 (NQO1), glutathione S-transferases (GSTs) [10].
- GSH Synthesis and Regeneration: Both subunits of GCL and GR [10].
The following diagram illustrates the core NRF2-KEAP1 signaling pathway:
Integrated Network and Quantitative Profiling
The antioxidant defense system functions as an integrated, coordinated network. SOD first converts O₂•⁻ to H₂O₂, which then serves as a substrate for both catalase and the glutathione peroxidase system. The NRF2 pathway ensures the coordinated expression of these components, including SOD, catalase, and all enzymes for GSH synthesis and regeneration, in response to redox challenges [10]. The interactions between key proteins in this network, including their involvement in pathways like longevity regulation, can be analyzed using protein-protein interaction databases such as STRING [36].
Table 2: Key Quantitative Parameters of Core Antioxidant Components
| Component | Typical Cellular Concentration / Activity | Key Kinetic Parameters | Primary Localization |
|---|---|---|---|
| SOD | Varies by isoform and tissue | k~cat~ ~10⁹ M⁻¹s⁻¹ (diffusion-limited) [33] | Cytosol (SOD1), Mitochondria (SOD2), Extracellular (SOD3) [35] |
| Catalase | High in liver, peroxisomes | One of the highest turnover rates: ~10⁶ molecules H₂O₂/min/molecule [36] | Peroxisomes [34] |
| Glutathione (GSH) | 1-10 mM (most abundant cellular thiol) [37] | GSH/GSSG ratio >10:1 (physiological); <10:1 (oxidative stress) [37] | Cytoplasm (90%), Mitochondria, Nucleus [37] |
| NRF2 | Low (basal), rapidly induced | Half-life: ~20 min (basal); increases upon stress [10] | Cytoplasm (basal), Nucleus (active) [38] |
Experimental Protocols
Protocol 1: Assessing NRF2 Pathway Activation in Cultured Cells
Objective: To evaluate NRF2 activation by measuring its nuclear translocation and target gene expression in BV-2 microglial cells treated with an inducer.
Background: This protocol is adapted from studies investigating the antioxidant and anti-inflammatory effects of compounds like metformin, which activates NRF2 to suppress oxidative stress in LPS-activated microglia [39].
Materials:
- Cell Line: BV-2 microglial cells or other relevant cell type (e.g., HEK293, HepG2).
- Treatments: Test compound (e.g., Metformin, sulforaphane), LPS (for inflammation model), vehicle control.
- Antibodies: Anti-NRF2 antibody, anti-Lamin B1 (nuclear marker), anti-β-Actin (cytosolic marker).
- Kits: Nuclear extraction kit, cDNA synthesis kit, SYBR Green qPCR master mix.
- Primers: For NRF2 target genes (e.g., HMOX1, NQO1, GCLM) and housekeeping genes (e.g., GAPDH, ACTB).
Procedure:
- Cell Culture and Treatment: Seed BV-2 cells in appropriate plates. At ~70-80% confluency, pre-treat cells with your test compound (e.g., 1-4 mM Metformin [39]) for a suitable period (e.g., 2-4 hours), followed by co-treatment with or without LPS (1 μg/mL [39]) for 6-24 hours.
- Nuclear and Cytosolic Fractionation: a. Harvest cells and pellet by centrifugation. b. Using a commercial nuclear extraction kit, lyse cells in a hypotonic buffer to obtain the cytosolic fraction. c. Pellet the nuclei and lyse them in a high-salt buffer to obtain the nuclear fraction.
- Western Blot Analysis: a. Determine protein concentration of fractions. b. Separate proteins (20-40 μg) by SDS-PAGE and transfer to a PVDF membrane. c. Block membrane and incubate with primary antibodies (anti-NRF2, anti-Lamin B1, anti-β-Actin) overnight at 4°C. d. Incubate with HRP-conjugated secondary antibodies. e. Develop using enhanced chemiluminescence (ECL) and image. Increased NRF2 signal in the nuclear fraction, normalized to Lamin B1, indicates activation.
- Quantitative Real-Time PCR (qRT-PCR): a. Extract total RNA from treated cells using a commercial kit. b. Synthesize cDNA from 1 μg of RNA. c. Perform qPCR with SYBR Green master mix and gene-specific primers for NRF2 target genes (e.g., HMOX1, NQO1). d. Calculate fold-change in gene expression using the 2^–ΔΔCt^ method, normalized to a housekeeping gene.
Protocol 2: Measuring Antioxidant Enzyme Activities
Objective: To determine the specific activity of SOD and Catalase in tissue homogenates or cell lysates.
Materials:
- Samples: Tissue homogenates (e.g., liver, brain) or cell lysates in cold buffer.
- Reagents:
- SOD Assay: Xanthine, Xanthine Oxidase, Cytochrome c, Nitro Blue Tetrazolium (NBT).
- Catalase Assay: Hydrogen peroxide (H₂O₂), Phosphate buffer (pH 7.0).
- Equipment: Spectrophotometer, microplate reader.
Procedure: A. Superoxide Dismutase (SOD) Activity (Cytochrome c Reduction Assay)
- Prepare a reaction mixture containing xanthine, xanthine oxidase (which generates O₂•⁻), and cytochrome c (which is reduced by O₂•⁻, causing an increase in absorbance at 550 nm).
- Add your sample to the reaction mixture. The SOD in the sample will scavenge O₂•⁻, thereby inhibiting the reduction of cytochrome c.
- Monitor the absorbance at 550 nm over time. One unit of SOD activity is defined as the amount of enzyme that causes 50% inhibition of the reduction rate of cytochrome c under specified conditions.
B. Catalase Activity (UV Spectrophotometry)
- Prepare a 10-50 mM solution of H₂O₂ in phosphate buffer (pH 7.0).
- Add a diluted sample to the H₂O₂ solution and mix rapidly.
- Immediately monitor the decrease in absorbance at 240 nm (where H₂O₂ absorbs) for 30-60 seconds.
- Calculate catalase activity using the molar extinction coefficient of H₂O₂ (ε = 43.6 M⁻¹cm⁻¹). Activity is expressed as µmoles of H₂O₂ decomposed per minute per mg of protein.
Protocol 3: Profiling the Glutathione Redox State
Objective: To quantify the levels of reduced (GSH) and oxidized (GSSG) glutathione to assess cellular redox status.
Materials:
- Samples: Deproteinized cell lysates or tissue homogenates (using metaphosphoric acid or similar).
- Reagents: Glutathione reductase (GR), NADPH, 5,5'-Dithio-bis-(2-nitrobenzoic acid) (DTNB, Ellman's reagent).
- Equipment: Spectrophotometer or plate reader.
Procedure (Enzymatic Recycling Assay):
- Total Glutathione (GSH + GSSG) Measurement: a. Prepare a reaction mix containing DTNB, NADPH, and GR. b. Add the sample. GR reduces GSSG to GSH, and the newly formed GSH then reacts with DTNB to produce 2-nitro-5-thiobenzoic acid (TNB), which is yellow. c. The rate of TNB formation, measured at 412 nm, is proportional to the total glutathione concentration.
- GSSG-Specific Measurement: a. To a separate aliquot of the sample, first derivatize GSH by adding 2-vinylpyridine to mask it. b. Perform the same recycling assay as above. Now, the signal is generated only from GSSG.
- Calculation: a. Determine concentrations from standard curves of GSH and GSSG. b. Calculate GSH concentration by subtracting the GSSG-equivalent from the total glutathione. c. Determine the GSH/GSSG ratio, a critical indicator of oxidative stress.
The Scientist's Toolkit: Research Reagent Solutions
Table 3: Essential Reagents and Tools for Antioxidant Defense Research
| Reagent / Tool | Function / Application | Example Use-Case |
|---|---|---|
| NRF2 Activators (e.g., Sulforaphane, CDDO-Me) | Induce NRF2 pathway; positive control for experiments [10] | Validate NRF2-dependent gene expression in a new cell model. |
| KEAP1-NRF2 Protein-Protein Interaction Inhibitors | Disrupt KEAP1-NRF2 binding to stabilize NRF2 [10] | Mechanistic studies on NRF2 activation. |
| siRNA/shRNA for NRF2, KEAP1, SOD, CAT | Gene knockdown to study component function [10] | Determine the necessity of NRF2 for a compound's antioxidant effect. |
| ARE-Luciferase Reporter Constructs | Measure NRF2/ARE transcriptional activity [38] | High-throughput screening of NRF2 activators. |
| Activity Assay Kits (SOD, Catalase, GSH/GSSG) | Standardized, quantitative measurement of enzyme activity/levels. | Profiling antioxidant capacity in patient-derived samples. |
| Oxidative Stress Probes (DHE, H2DCFDA) | Detect general ROS/RNS levels in cells. | Initial assessment of cellular oxidative stress levels. |
| Advanced Redox Probes (e.g., [¹⁸F]ROStrace, [¹⁸F]FEDV) | Enable in vivo PET imaging of specific ROS/oxidative damage [13] | Non-invasive mapping of oxidative stress in animal disease models. |
Integration with Redox Probes forIn VivoMeasurement
Understanding the antioxidant defense network is fundamental to interpreting data from advanced redox probes. These probes target specific nodes within this network:
- Superoxide-Targeting Probes: Probes like [¹⁸F]ROStrace are structurally derived from dihydroethidium (DHE) and are selectively oxidized by O₂•⁻, the primary substrate of SOD. Their signal is thus inversely related to SOD activity in that compartment [13].
- Hydrogen Peroxide-Targeting Probes: Probes like PC-[¹⁸F]FLT contain a boronate moiety that is oxidized by H₂O₂. Their signal can report on the flux of H₂O₂ that escapes clearance by catalase and GPx [13].
- Lipid Peroxidation/Damage Probes: Probes like [¹⁸F]FEDV, based on the radical scavenger edaravone, accumulate in areas with high levels of peroxynitrite and lipid peroxidation products, indicating downstream oxidative damage [13].
The following diagram conceptualizes how these probes interact with the antioxidant network:
Concluding Remarks
The antioxidant defense network, comprising SOD, catalase, glutathione, and the NRF2 pathway, forms a sophisticated, multi-layered system essential for maintaining redox homeostasis. Its components function in a coordinated, interdependent manner, with NRF2 acting as the central orchestrator of the transcriptional response. The protocols and tools outlined herein provide a framework for systematically investigating this network. The integration of classical biochemical assays with modern genetic approaches and, crucially, with non-invasive in vivo imaging using advanced redox probes, represents the cutting edge of oxidative stress research. This multi-faceted approach will significantly enhance our ability to diagnose, monitor, and treat a wide spectrum of human diseases rooted in redox imbalance.
A Toolkit for Discovery: Selecting and Applying Probes for Specific In Vivo Applications
Reactive oxygen species (ROS), including superoxide (O₂•⁻) and hydrogen peroxide (H₂O₂), play dual roles in physiological signaling and pathological oxidative stress [40] [41]. Accurate measurement of these transient molecules in vivo requires probes that rapidly react with ROS to form stable, detectable products while competing effectively with cellular antioxidants and minimizing system perturbation [42] [43]. This application note details the principles, protocols, and critical considerations for four essential small-molecule fluorescent probes—DHE, MitoSOX, DCF-DA, and Amplex Red—providing a structured framework for their application in oxidative stress research and drug development.
Table 1: Core Characteristics of Small-Molecule Fluorescent Probes for ROS Detection
| Probe Name | Primary ROS Target | Detection Method | Key Advantage | Major Limitation |
|---|---|---|---|---|
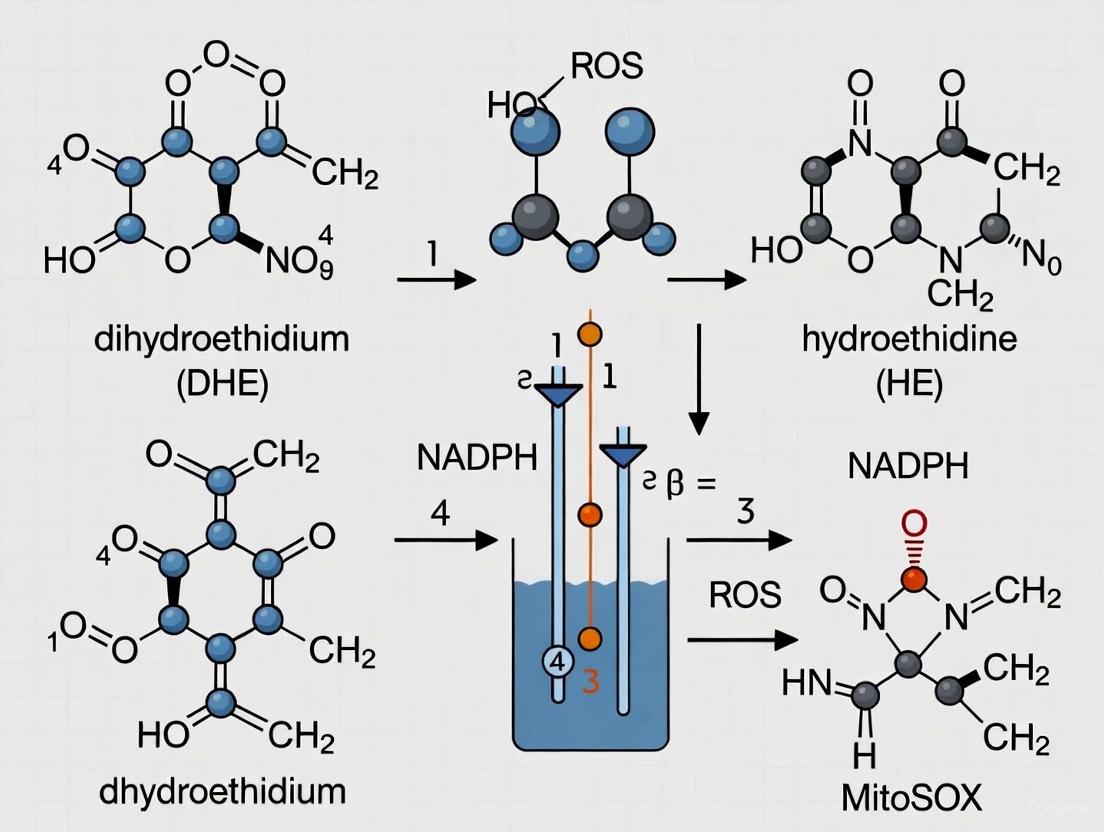
| Dihydroethidium (DHE) | Superoxide (O₂•⁻) | Fluorescence (Ex/Em ~518/605 nm) [44] | Forms a specific product (2-OH-E+) with O₂•⁻ [42] | Non-specific oxidation produces ethidium, requiring HPLC for specificity [42] |
| MitoSOX Red | Mitochondrial Superoxide | Fluorescence (Ex/Em ~400/590 nm) [45] | Targeted to mitochondria via triphenylphosphonium cation [40] [45] | High concentrations can impair mitochondrial function [44] |
| DCF-DA | Various Oxidants (not specific to H₂O₂) | Fluorescence (Ex/Em ~488/530 nm) [12] | Simple, widespread protocol for general oxidative activity | Highly non-specific; prone to artifact and redox cycling [42] [41] |
| Amplex Red | Hydrogen Peroxide (H₂O₂) | Fluorescence (Ex/Em ~530/590 nm) [42] | Highly specific and sensitive for extracellular H₂O₂ [42] [40] | Detects only released H₂O₂; susceptible to interference from O₂•⁻ [42] |
Probe-Specific Application Notes and Protocols
Dihydroethidium (DHE) for Cellular Superoxide Detection
Principle and Specificity: Dihydroethidium (DHE) is a cell-permeable probe that reacts selectively with superoxide (O₂•⁻) to form a hydroxylated product, 2-hydroxyethidium (2-OH-E+) [42] [40]. This product intercalates with DNA, exhibiting a distinct red fluorescence (Ex/Em ~518/605 nm) [44]. A key challenge is that other cellular oxidants can also oxidize DHE to ethidium, a different red-fluorescent product, which complicates specific O₂•⁻ detection [42] [44]. For precise quantification, HPLC separation of 2-OH-E+ from ethidium is recommended [42]. Fluorescence microscopy using an excitation wavelength of 396 nm can provide better selectivity for 2-OH-E+ over ethidium [44].
Detailed Protocol for Imaging in Adherent Cells (e.g., BAECs, hiPSC-CMs) [40]:
- Cell Preparation: Culture cells (e.g., Bovine Aortic Endothelial Cells - BAECs) to approximately 70% confluence on glass-bottom dishes or multi-well plates.
- Probe Loading: Remove growth media and wash cells with phosphate-buffered saline (PBS). Incubate with 10 µM DHE in serum-free media for 30 minutes at 37°C, protected from light.
- Control Preparation:
- Positive Control: Treat a separate group of cells with 25 µM menadione for 15 minutes at 37°C prior to DHE loading to induce superoxide production [40].
- Negative Control/Specificity Test: Pre-treat cells with a cell-permeable SOD mimetic such as MnTBAP (e.g., 50 µM for 1 hour) to scavenge O₂•⁻ and reduce the specific signal.
- Image Acquisition: Remove the DHE solution and replace with fresh, pre-warmed growth media. Image the cells immediately using a fluorescent microscope with appropriate filters for red fluorescence (Ex/Em ~480/580 nm for the ethidium channel; ~518/605 nm or Ex 396 nm for the more specific 2-OH-E+ detection) [40] [44].
- Data Analysis: Quantify fluorescence intensity per cell or per field of view. Compare experimental groups to positive and negative controls to validate that the signal is related to superoxide production.
MitoSOX Red for Mitochondrial Superoxide
Principle and Specificity: MitoSOX Red is a cationic derivative of DHE conjugated to a triphenylphosphonium group, which drives its accumulation several-hundredfold within the mitochondrial matrix, facilitated by the negative membrane potential [40] [45]. Within mitochondria, it is selectively oxidized by O₂•⁻ to form a hydroxylated product that binds to mitochondrial DNA, resulting in bright fluorescence. Excitation at 400 nm with emission detection at ~590 nm provides optimal discrimination for the superoxide-specific product [45] [44].
Detailed Protocol for Live-Cell Imaging:
- Cell Preparation: Plate cells and culture to the desired density.
- Probe Loading: Prepare a 5 µM MitoSOX Red working solution in pre-warmed, serum-free media. Replace cell culture media with the probe solution and incubate for 10-15 minutes at 37°C, protected from light [40] [45].
- Washing and Imaging: After incubation, gently wash the cells 2-3 times with warm PBS or buffer. Cover the cells with fresh media or imaging buffer. Acquire images using a fluorescence microscope or confocal system. The red fluorescence can be visualized using standard TRITC/Cy3 filters, but excitation at ~400 nm (if available) is preferred for specificity.
- Critical Validation: Include controls as described for DHE (menadione for positive, MnTBAP for negative). To confirm mitochondrial localization, co-stain with a green-fluorescent mitochondrial marker (e.g., MitoTracker Green). Note that high concentrations of MitoSOX (>5 µM) or prolonged incubation can be toxic and alter mitochondrial function, so parameters should be carefully optimized [44].
Dichlorodihydrofluorescein Diacetate (DCF-DA) for General Oxidant Detection
Principle and Specificity: DCF-DA is a cell-permeable dye that is hydrolyzed by intracellular esterases to non-fluorescent DCFH, which is trapped inside the cell. Subsequent oxidation by various oxidants converts DCFH to highly fluorescent DCF [12]. It is critical to note that DCFH is oxidized by a wide range of ROS (e.g., hydroxyl radical, peroxynitrite) and other cellular oxidants, and its oxidation is often catalyzed by heme proteins or metal ions [42]. Furthermore, the DCF radical intermediate can react with oxygen to generate superoxide and hydrogen peroxide, leading to artifactual signal amplification through redox cycling [42] [41]. Therefore, DCF-DA is best regarded as a general indicator of overall oxidative activity rather than a specific detector of H₂O₂.
Detailed Protocol (with caveats):
- Cell Preparation: Culture cells as needed.
- Probe Loading: Load cells with 1-20 µM DCF-DA in serum-free media or buffer for 30 minutes at 37°C.
- Washing and Incubation: Wash cells thoroughly with PBS and add fresh medium. It is often recommended to allow a 15-30 minute stabilization period for the complete hydrolysis of the diacetate ester to DCFH before taking measurements.
- Measurement: Monitor the increase in green fluorescence (Ex/Em ~488/530 nm) over time using a fluorescence plate reader, microscope, or flow cytometer. Interpret results with caution, as the signal is not specific. Protect the probe from light at all times to minimize photo-oxidation.
Amplex Red for Extracellular Hydrogen Peroxide
Principle and Specificity: The Amplex Red assay is a highly sensitive and specific method for detecting extracellular H₂O₂ [42] [40]. The mechanism involves horseradish peroxidase (HRP)-catalyzed oxidation of non-fluorescent Amplex Red by H₂O₂, producing resorufin, a strongly fluorescent product (Ex/Em ~530/590 nm) [42]. This assay is ideal for measuring H₂O₂ released from cells, isolated organelles (e.g., mitochondria), or enzyme systems into the surrounding medium [42].
Detailed Protocol for Isolated Mitochondria or Cultured Cells:
- Reaction Setup: Prepare a working solution containing 5-50 µM Amplex Red and 0.1-1 U/mL HRP in a suitable oxygenated buffer (e.g., Krebs buffer, pH 7.4) [42].
- Sample Addition: Add the sample of interest (e.g., isolated mitochondria, suspended cells, or tissue supernatant) to the working solution.
- Measurement: Incubate the reaction mixture at 37°C and monitor the increase in resorufin fluorescence over time (30-60 minutes) using a fluorescence microplate reader or fluorometer.
- Critical Controls and Considerations:
- Generate a standard curve with known concentrations of H₂O₂ for quantification.
- Include a no-HRP control to assess non-enzymatic oxidation.
- Add exogenous superoxide dismutase (SOD, e.g., 50 U/mL) to the assay to convert any superoxide released by the sample into H₂O₂. This prevents the direct interaction of O₂•⁻ with HRP, which can form compound III and alter the stoichiometry of the assay, thereby ensuring that the measured signal accurately reflects total H₂O₂ [42].
Visualizing ROS Detection Mechanisms
The following diagrams illustrate the core detection mechanisms and experimental workflows for the featured probes, providing a visual guide to their application in redox biology.
The Scientist's Toolkit: Essential Reagents and Materials
Table 2: Key Research Reagent Solutions for ROS Detection Assays
| Reagent / Material | Core Function | Example Application |
|---|---|---|
| DHE (Dihydroethidium) | Detection of intracellular superoxide via 2-OH-E+ formation. | Quantifying NADPH oxidase activity or general cellular O₂•⁻ production [40]. |
| MitoSOX Red | Selective detection of superoxide within the mitochondrial matrix. | Investigating electron transport chain leak and mitochondrial dysfunction [45]. |
| DCF-DA | General sensor of overall intracellular oxidative activity. | Initial, non-specific screening for elevated cellular oxidant levels [12]. |
| Amplex Red / HRP Kit | Highly sensitive and specific detection of released H₂O₂. | Measuring H₂O₂ release from cell cultures, isolated enzymes, or mitochondria [42] [40]. |
| Menadione | Redox-cycling compound used as a positive control to induce superoxide production. | Validating DHE and MitoSOX assay functionality [40]. |
| MnTBAP | Cell-permeable superoxide dismutase (SOD) mimetic. | Negative control to confirm the specificity of the O₂•⁻ signal in DHE/MitoSOX assays [40]. |
| Exogenous SOD | Enzyme that converts O₂•⁻ to H₂O₂. | Added to Amplex Red assays to prevent O₂•⁻ interference and ensure H₂O₂ measurement specificity [42]. |
The selection and application of small-molecule fluorescent probes are foundational to advancing our understanding of redox biology in vivo. As detailed in these application notes, each probe—DHE, MitoSOX, DCF-DA, and Amplex Red—offers distinct advantages and carries specific limitations. Success in measuring oxidative stress relies on rigorous experimental design, including appropriate controls and a clear understanding of probe chemistry. By adhering to these standardized protocols and critically interpreting data within the context of each probe's characteristics, researchers and drug development professionals can generate reliable, reproducible insights into the roles of ROS in health and disease.
Genetically encoded sensors represent a transformative advancement in redox biology, enabling real-time, compartment-specific monitoring of oxidative stress parameters in living systems. This application note focuses on two principal sensor families: Grx1-roGFP2 for monitoring the glutathione redox potential (EGSH) and the HyPer family for detecting hydrogen peroxide (H2O2). We detail the molecular mechanisms, provide validated experimental protocols for implementation in mammalian cell systems, and summarize their quantitative performance characteristics. Framed within the context of redox probes for in vivo oxidative stress measurement research, this document serves as a practical guide for researchers and drug development professionals seeking to implement these tools for high-standard toxicological evaluation and mechanistic exploration of redox signaling.
Reactive oxygen and nitrogen species (RONS) are central players in cellular signaling and pathophysiology. Traditional methods for measuring RONS, such as chemical fluorescent dyes, often lack specificity, are prone to artifactual oxidation during cell disruption, and cannot be targeted to specific subcellular compartments [46] [47]. Genetically encoded sensors overcome these limitations. They are fully genetically encoded, allowing for precise targeting to organelles and specific cell types, and provide ratimetric readouts that are insensitive to probe concentration, photobleaching, and variation in illumination intensity [47] [48]. The integration of these sensors with live-cell imaging facilitates the dynamic observation of redox processes with high spatio-temporal resolution, which is indispensable for understanding complex biological systems [48].
Sensor Mechanisms and Characteristics
The Grx1-roGFP2 Biosensor for Glutathione Redox Potential
The Grx1-roGFP2 sensor is a fusion protein consisting of redox-sensitive Green Fluorescent Protein 2 (roGFP2) and human glutaredoxin 1 (Grx1) [46].
- Mechanism of Action: The roGFP2 moiety contains a pair of surface-exposed cysteine residues that form a disulfide bond upon oxidation, inducing a conformational change that alters its fluorescence properties. Fusing roGFP2 to Grx1 couples the sensor's redox state directly and rapidly to the glutathione (GSH/GSSG) redox couple, the major cellular redox buffer. Grx1 catalyzes the reduction of disulfide bonds in target proteins using GSH as a cofactor, thus equilibrating the sensor with the glutathione pool [46] [47].
- Spectral Properties: roGFP2 is a dual-excitation sensor. The reduced form excites more efficiently at ~488 nm, while the oxidized form excites more efficiently at ~405 nm. The emission peak is at ~510 nm for both states. The ratio of fluorescence (405 nm/488 nm excitation) provides a quantitative, ratiometric measure of the glutathione redox potential, which is not affected by the sensor's expression level or the cell thickness [47] [48].
- Key Applications: Monitoring perturbations in the GSH/GSSG equilibrium induced by toxicological insults, metabolic shifts, or pharmaceutical interventions [46] [48].
The HyPer Biosensor for Hydrogen Peroxide
The HyPer sensor is based on a circularly permuted yellow fluorescent protein (cpYFP) inserted into the regulatory domain of the bacterial H2O2-sensing protein, OxyR [47].
- Mechanism of Action: Upon H2O2 exposure, specific cysteine residues in the OxyR domain form a disulfide bond, causing a conformational change that alters the fluorescence intensity of the cpYFP module [47].
- Spectral Properties: Similar to roGFP2, HyPer is a ratiometric probe. Its excitation spectrum shifts upon H2O2 binding, with peaks at ~420 nm and ~500 nm, and emission at ~516 nm. The ratio (500 nm/420 nm) is used to quantify H2O2 levels [48].
- Key Applications: Direct and specific detection of subcellular changes in H2O2 concentration, a key redox signaling molecule [47].
The following diagram illustrates the fundamental working principles of both biosensors.
Quantitative Performance Comparison
The table below summarizes the key characteristics of Grx1-roGFP2 and HyPer sensors for easy comparison and experimental selection.
Table 1: Performance Characteristics of Grx1-roGFP2 and HyPer Biosensors
| Parameter | Grx1-roGFP2 | HyPer3 (Cytosolic) | HyPer (Mito/Nuclear) |
|---|---|---|---|
| Target Analyte | Glutathione Redox Potential (EGSH) [47] | Hydrogen Peroxide (H2O2) [48] | Hydrogen Peroxide (H2O2) [48] |
| Dynamic Range | Linear range of 6–200 mg/mL MOx exposure [46] | Responsive to µM additions of H2O2 [48] | Responsive to µM additions of H2O2 [48] |
| Response Time | ≤ 30 minutes [46] | Rapid response (seconds-minutes) [48] | Rapid response (seconds-minutes) [48] |
| Sensitivity Duration | Sustained over 24 hours [46] | N/A | N/A |
| Key Controls | DTT (reduction), H2O2 (oxidation) [48] | DTT (reduction), H2O2 (oxidation) [48] | DTT (reduction), H2O2 (oxidation) [48] |
| pH Sensitivity | roGFP2 is pH-insensitive in physiological range [47] | Yes, requires careful pH control [47] [48] | Yes, requires careful pH control [48] |
Experimental Protocols
Protocol: Implementing Grx1-roGFP2 for Nanotoxicological Assessment in MDCK Cells
This protocol outlines the methodology for using a Grx1-roGFP2 sensor to assess metal oxide (MOx) nanoparticle-induced oxidative stress, as described in the literature [46].
A. Sensor Expression via Lentiviral Transduction
- Vector Construction: Clone the Grx1-roGFP2 gene coding sequence into a pLV-puro lentiviral vector using restriction sites Mlu I and Not I. Include a Kozak sequence to enhance expression [46].
- Lentivirus Production: Transfect HEK293T cells with the constructed pLV-Grx1-roGFP2 plasmid along with packaging plasmids (psPAX2, pMD2.G). Collect the virus-containing supernatant 48 hours post-transfection [46].
- Cell Line Transduction: Infect Madin-Darby Canine Kidney (MDCK) cells with the lentiviral suspension. After 24 hours, select stable expressing cells using puromycin (e.g., 2 µg/mL). Validate sensor expression via real-time PCR and functional assays [46].
B. Live-Cell Imaging and Redox Measurement
- Cell Culture and Exposure: Culture Grx1-roGFP2-expressing MDCK cells in Dulbecco's Modified Eagle Medium (DMEM) supplemented with 10% FBS at 37°C in a 5% CO2 atmosphere. Seed cells into imaging-compatible plates (e.g., 96-well black-walled plates) [46].
- Treatment: Expose cells to the test stressor (e.g., MOx nanoparticles at 6–200 mg/mL) [46].
- Ratiometric Imaging: Using a high-content cell imaging system or confocal microscope, acquire images with dual excitations (~405 nm and ~488 nm) and collect emission at ~510 nm. Perform imaging at defined intervals post-exposure (e.g., from 30 minutes up to 24 hours) [46].
- Data Analysis: For each cell and time point, calculate the 405/488 nm excitation ratio. Normalize the data as (R - Rmin)/(Rmax - Rmin), where Rmin and Rmax are the minimum (fully reduced with DTT) and maximum (fully oxidized with H2O2) ratios, respectively. The slope, amplitude, and integral of the ratio-over-time curve can characterize the oxidative stress pattern [46].
Protocol: Monitoring H2O2in Skeletal Muscle Fibers Using HyPer
This protocol is adapted from studies in isolated skeletal muscle fibers and C2C12 myotubes, highlighting critical controls for pH sensitivity [48].
- Sensor Expression: Express the appropriate HyPer variant (e.g., HyPer3 for cytosol, HyPer-mito for mitochondria) in mature skeletal muscle fibers or C2C12 myoblasts using adenoviral or lentiviral transduction.
- Environmental Control: Maintain cells at 37°C in a 5% CO2 atmosphere throughout the experiment. Even brief disruptions of CO2 can cause intracellular pH shifts that significantly alter HyPer fluorescence, creating artifacts [48].
- Ratiometric Imaging: Acquire images using dual excitations (420 nm and 500 nm) and an emission of 516 nm. The fluorescence rate is calculated as F500/F420 [48].
- Validation and Controls:
- Oxidation Control: Apply a bolus of H2O2 (e.g., 100 µM) to the medium to elicit a positive response.
- Reduction Control: Apply Dithiothreitol (DTT, e.g., 1-10 mM) at the experiment's end to fully reduce the sensor and confirm reversibility.
- pH Control: Where possible, use a pH-insensitive reference sensor (e.g., SypHer) to dissect the H2O2 signal from pH effects [47] [48].
The workflow for a typical experiment, from sensor expression to data analysis, is outlined below.
The Scientist's Toolkit: Essential Research Reagent Solutions
Table 2: Key Reagents for Redox Biosensor Experiments
| Reagent / Material | Function / Application | Example Use Case & Notes |
|---|---|---|
| pLV-Grx1-roGFP2 Vector | Lentiviral plasmid for stable sensor expression. | Generation of stable cell lines (e.g., MDCK) for toxicology studies [46]. |
| HyPer Variants (e.g., HyPer3, HyPer-mito) | Plasmid or viral vector for H2O2 detection in specific compartments. | Targeted monitoring of cytosolic, mitochondrial, or nuclear H2O2 fluxes [48]. |
| Dithiothreitol (DTT) | Strong reducing agent; negative control. | Fully reduces sensors (e.g., 1-10 mM) to establish Rmin [48]. |
| Hydrogen Peroxide (H2O2) | Oxidizing agent; positive control. | Fully oxidizes sensors (e.g., 100-500 µM) to establish Rmax [46] [48]. |
| Puromycin | Antibiotic for selection of transduced cells. | Selection of cells expressing lentivirus-encoded sensors post-transduction [46]. |
| Screen-Printed Electrodes | Electrochemical measurement of redox capacity. | Can be used with alternative redox probing methods (e.g., Ir-reducing assay) [49]. |
Grx1-roGFP2 and HyPer biosensors provide robust, specific, and compartment-specific tools for quantifying dynamic redox changes in living cells. Their genetically encoded nature allows for precise targeting and long-term monitoring, offering a significant advantage over traditional chemical probes. By following the detailed protocols and considerations outlined in this document, researchers can reliably apply these sensors to investigate oxidative stress in diverse contexts, from nanotoxicology to muscle pathophysiology, thereby advancing the development of therapeutic interventions targeting redox dysregulation.
Electron Paramagnetic Resonance (EPR) spectroscopy has emerged as a powerful, non-invasive technique for directly detecting and quantifying reactive oxygen species (ROS) and assessing redox status in living systems. The application of EPR for in vivo oxidative stress measurement relies primarily on two classes of paramagnetic probes: spin traps and nitroxide radicals. These probes enable researchers to monitor the complex redox dynamics within pathological environments, providing crucial insights for drug development and understanding disease mechanisms. Spin traps, such as DMPO, are diamagnetic compounds that react with short-lived radicals to form stable, EPR-detectable adducts. In contrast, nitroxide probes like mitoTEMPO and 3-Carbamoyl-PROXYL (3CP) are stable radicals whose EPR signal decay kinetics reflect the local redox environment and specific ROS production within cellular compartments. This application note provides detailed protocols and foundational knowledge for employing these probes in redox research, framed within the context of advanced oxidative stress measurement.
Nitroxide Probes: Redox Status Reporters
Properties and Redox Chemistry
Nitroxides are stable radicals that can report on the cellular redox environment by undergoing reversible, one-electron redox reactions [16] [50]. The paramagnetic nitroxide radical (R₂NO•) can be reduced to a diamagnetic hydroxylamine (R₂NHOH) or oxidized to an oxoammonium cation (R₂N⁺=O). In vivo, the dominant reaction is typically reduction to the hydroxylamine, leading to a loss of the EPR signal [50]. This reduction can occur via several pathways, including enzymatic processes involving NAD(P)H-dependent oxidoreductases or glutathione (GSH)-mediated enzymes, as well as direct chemical reduction [51] [52]. Critically, superoxide (O₂•⁻) can oxidize hydroxylamines back to the nitroxide form or participate in a cycle that ultimately leads to nitroxide reduction [51]. The rate of nitroxide signal decay therefore provides a complex readout of the local balance between oxidizing and reducing species.
Probe Selection: mitoTEMPO vs. 3CP
The choice of nitroxide probe is crucial for compartment-specific ROS detection. The table below compares the properties of two commonly used nitroxides.
Table 1: Key Characteristics of mitoTEMPO and 3CP Nitroxide Probes
| Property | mitoTEMPO | 3-Carbamoyl-PROXYL (3CP) |
|---|---|---|
| Chemical Class | Piperidine nitroxide conjugated to triphenylphosphonium (TPP) | Pyrrolidine nitroxide |
| Targeting | Mitochondria (due to TPP lipophilic cation) | Non-targeted; distributes throughout intra- and extracellular compartments [51] |
| Primary Application | Detection of mitochondrial ROS (mtROS) [51] [53] | Detection of global, cytosolic, and extracellular ROS [51] [54] |
| Key Finding | Decay rate increased specifically with Antimycin A (mitochondrial stress) but not L-BSO (cytosolic stress) [51] [53] | Decay rate increased with L-BSO (cytosolic GSH depletion) but not Antimycin A [51] [53] |
| Evidence Level | Validated in 4T1 tumor models in vitro and in vivo [51] | Validated in 4T1 tumor models in vitro and in vivo [51] |
Protocol: Dual-Probe EPR for Site-Specific ROS Detection
This protocol describes how to simultaneously discriminate between mitochondrial and cytosolic/extracellular ROS production in solid tumor models in vivo using mitoTEMPO and 3CP [51] [53].
I. Materials and Reagents
- Nitroxide Probes: mitoTEMPO and 3-Carbamoyl-PROXYL (3CP). Prepare stock solutions in sterile PBS or saline.
- Animal Model: 4T1 breast tumor-bearing mice (or other relevant models).
- Modulators (for validation):
- L-Buthionine Sulfoximine (L-BSO): Glutathione synthesis inhibitor to induce cytosolic oxidative stress.
- Antimycin A: Complex III inhibitor to induce mitochondrial superoxide production.
- EPR Spectrometer: L-band (1 GHz) for in vivo measurements; X-band (9 GHz) for in vitro studies.
II. Experimental Procedure
Probe Administration:
- Inject mice intravenously with a mixture of mitoTEMPO and 3CP. The typical dose for mitoTEMPO is 10 µmol per mouse [16], while 3CP is used at a comparable concentration normalized for nitroxide content.
In Vivo EPR Measurement:
- Anesthetize the animal and position the tumor tissue within the resonator of an L-band EPR spectrometer.
- Acquire EPR spectra repeatedly over time (e.g., every 2-5 minutes for 30-60 minutes) to monitor the signal intensity decay of each nitroxide. The distinct spectral signatures of mitoTEMPO and 3CP allow for simultaneous tracking.
Data Analysis:
- Plot the normalized EPR signal intensity versus time for each probe.
- Fit the data to a first-order exponential decay or other suitable kinetic model:
I(t) = I₀ * e^(-kt) - Calculate the decay rate constant (k) for each probe under different experimental conditions (control vs. treated).
- Interpretation: A significant increase in the decay rate of 3CP, but not mitoTEMPO, upon L-BSO treatment indicates cytosolic oxidative stress. Conversely, a specific increase in the decay rate of mitoTEMPO after Antimycin A treatment points to mitochondrial ROS production [51] [53].
III. Workflow Visualization
Spin Trapping Probes: Direct Radical Detection
Properties and Trapping Chemistry
Spin trapping involves the use of diamagnetic compounds (spin traps) that react with highly unstable, short-lived radicals to form more stable, EPR-detectable radical adducts (spin adducts) [55] [52]. This technique allows for the direct detection and identification of specific radical species. The most common spin traps are cyclic nitrones, such as DMPO and BMPO. The reaction involves the addition of the transient radical across the double bond of the nitrone, generating a nitroxide adduct with a unique EPR spectrum that serves as a fingerprint for the trapped radical [55].
Probe Selection: DMPO vs. BMPO
While DMPO is a widely used classic spin trap, BMPO offers advantages for certain applications, particularly in superoxide detection.
Table 2: Comparison of DMPO and BMPO Spin Traps
| Property | DMPO (5,5-dimethyl-1-pyrroline N-oxide) | BMPO (5-tert-butoxycarbonyl-5-methyl-1-pyrroline N-oxide) |
|---|---|---|
| Primary Radicals Detected | •OH (hydroxyl), alkoxy radicals [55] [56] | O₂•⁻ (superoxide), •OOH (hydroperoxyl), •OH [55] [56] |
| Key Advantage | Well-established, suitable for short-lived species like •OH [55] | Superior stability of superoxide adduct (BMPO-OOH) compared to DMPO-OOH, which rapidly decomposes [55] [56] |
| Key Application Finding | - | Enabled first direct quantification of GSH-mediated conversion of O₂•⁻ to •OH in UVA-irradiated skin tissue [55] [56] |
| Critical Consideration | Prone to artifacts; can form DMPO-OH via non-radical pathways with quinones or metal ions [57] | Improved specificity for superoxide in complex biological systems [55] |
Protocol: EPR Spin Trapping in Ex Vivo Skin Tissue
This protocol details the use of BMPO for detecting UVA-induced radical shifts in skin tissue, highlighting its enhanced stability for superoxide detection [55] [56].
I. Materials and Reagents
- Spin Trap: BMPO stock solution. Note: BMPO is preferred over DMPO for its more stable superoxide adduct.
- Tissue Sample: Excised skin tissue (e.g., mouse or human skin model).
- UVA Source: Standardized UVA irradiation system.
- EPR Spectrometer: X-band (9 GHz) for ex vivo measurements.
- Glass Capillaries: For loading the tissue homogenate samples.
II. Experimental Procedure
Sample Preparation:
- Slice the excised skin tissue into uniform pieces.
- Incubate tissue samples with BMPO solution (e.g., 50-100 mM) to allow penetration.
UVA Irradiation:
- Irradiate samples with a controlled UVA dose (e.g., 10-50 J/cm²). Include non-irradiated controls incubated with BMPO.
Sample Processing and EPR Measurement:
- Immediately after irradiation, homogenize the tissue in cold buffer.
- Transfer the homogenate to a glass capillary and seal it.
- Insert the capillary into the EPR resonator and acquire the spectrum using the following typical parameters [55]:
- Microwave Frequency: 9.4 GHz
- Microwave Power: 10-20 mW
- Modulation Amplitude: 0.1-0.2 mT
- Scan Time: 60-120 s
Data Analysis:
- Identify the characteristic spectrum of the BMPO adducts (e.g., BMPO-OOH for superoxide).
- Quantify the relative radical levels by measuring the peak-to-peak amplitude of the first derivative EPR signal.
- Interpretation: A shift from short-lived ROS (like •OH) to more stable lipid oxygen species (LOS) can be observed with increasing UVA exposure [55].
Critical Consideration: Artifact Control
A major challenge in spin trapping is the potential for artifactual adduct formation. For example, the DMPO-OH adduct can form via non-radical pathways in the presence of quinones or reducing agents, independent of genuine •OH production [57]. To mitigate false positives:
- Use BMPO for more specific superoxide detection.
- Include rigorous controls, such as heat-inactivated tissue samples or specific radical scavengers (e.g., superoxide dismutase for O₂•⁻).
- For •OH detection, validate findings with alcohol-scavenging experiments; •OH will generate characteristic carbon-centered radical adducts in the presence of ethanol or methanol [57].
The Scientist's Toolkit: Essential Research Reagents
Table 3: Key Research Reagents for EPR-Based Redox Probing
| Reagent / Tool | Function / Purpose | Key Context from Research |
|---|---|---|
| mitoTEMPO | Mitochondria-targeted nitroxide probe for detecting mtROS. | Enabled discrimination of mitochondrial from cytosolic ROS in 4T1 tumors; decay rate specific to Antimycin A [51]. |
| 3-Carbamoyl-PROXYL (3CP) | Non-targeted hydrophilic nitroxide for global ROS sensing. | Used as a counterpart to mitoTEMPO; decay rate specific to cytosolic stress induced by L-BSO [51] [54]. |
| BMPO Spin Trap | Nitrone spin trap for superoxide and hydroxyl radicals. | Provided superior stability for direct O₂•⁻ detection and revealed GSH-mediated •OH formation in skin [55] [56]. |
| Potassium Ferricyanide | Oxidizing agent for ex vivo validation. | Converts hydroxylamines back to nitroxides, allowing quantification of total (nitroxide + hydroxylamine) probe in tissues [16] [51]. |
| L-Buthionine Sulfoximine (L-BSO) | Glutathione synthesis inhibitor. | Tool to induce cytosolic oxidative stress by depleting GSH, validating cytosolic probes like 3CP [51] [53]. |
| Antimycin A | Inhibitor of mitochondrial Electron Transport Chain Complex III. | Tool to specifically induce mitochondrial superoxide production, validating mitochondrial probes like mitoTEMPO [51] [53]. |
The following table consolidates key quantitative findings from recent research utilizing these EPR probes, providing a reference for expected outcomes and experimental design.
Table 4: Summary of Quantitative EPR Probe Data from Key Studies
| Probe / Experiment | Key Quantitative Result | Experimental Context |
|---|---|---|
| Multi-spin Redox Sensor (RS) | Circulated longer in the bloodstream than mito-TEMPO. Both probes underwent reduction in the blood [16]. | Intravenous injection in mice; blood EPR measurement over 2 hours. |
| Dual Nitroxide (mitoTEMPO vs 3CP) | L-BSO treatment increased relative decay rate for 3CP, but not mitoTEMPO. Antimycin A treatment increased decay for mitoTEMPO, but not 3CP [51] [53]. | In vivo EPR in 4T1 breast tumor-bearing mice. |
| BMPO vs DMPO | BMPO provided greater stability for superoxide (O₂•⁻) and hydroperoxyl (•OOH) radical adducts compared to DMPO [55] [56]. | Ex vivo UVA irradiation of excised skin tissue. |
| Artifact Control (DMPO) | DMPO-OH adduct formed from direct reaction with Benzoquinone (BQ), independent of hydroperoxides or free •OH [57]. | In vitro chemical system highlighting risk of false positives. |
Reactive oxygen species (ROS) are unstable oxygen-containing molecules with significant roles in redox cell signaling and physiological regulation at low concentrations. Excessive ROS production causes oxidative stress, leading to cellular damage and disease pathogenesis. The major ROS include superoxide anion, hydrogen peroxide, and hydroxyl radicals, each with distinct chemical reactivity, biological functions, and detection challenges. This application note provides researchers with current methodologies and protocols for selectively detecting and quantifying these specific ROS using advanced probe technologies, with emphasis on proper experimental design and interpretation within redox biology research and drug development contexts.
ROS Fundamentals and Detection Challenges
Chemical Properties of Key ROS
Table 1: Fundamental Properties of Primary Reactive Oxygen Species
| ROS Species | Chemical Formula | Reactivity & Half-Life | Primary Biological Sources |
|---|---|---|---|
| Superoxide anion | O₂•⁻ | Selective reactivity; does not attack most biomolecules directly; can damage Fe-S cluster enzymes | Mitochondrial electron transport chain, NADPH oxidases |
| Hydrogen peroxide | H₂O₂ | Unreactive with most biomolecules; reacts with specific protein cysteine residues; membrane-permeable | Superoxide dismutation, oxidase enzymes |
| Hydroxyl radical | •OH | Extremely reactive; nonspecific attacks on adjacent biomolecules at diffusion-controlled rates | Fenton reaction, decomposition of peroxynitrite |
ROS exist in a dynamic equilibrium within biological systems, where their individual concentrations and spatial localization determine physiological signaling outcomes or pathological damage [58] [59]. The superoxide anion serves as a primary ROS, functioning as a precursor to most other reactive species while exhibiting relatively selective reactivity. Hydrogen peroxide demonstrates greater stability and serves as a key signaling molecule due to its ability to selectively oxidize protein cysteine residues. The hydroxyl radical represents the most reactive oxygen species, causing indiscriminate damage to lipids, proteins, and DNA through near-diffusion-controlled reaction rates [58].
Key Detection Considerations
Accurate ROS measurement requires understanding critical methodological considerations. Specificity remains paramount since most probes react with multiple oxidants, and many biological samples contain complex mixtures of ROS. Sensitivity must be sufficient to detect physiological concentrations, which for H₂O₂ range from nanomolar to micromolar levels [60]. Compartmentalization affects probe selection, as ROS generation and signaling are often localized to specific organelles. Redox status of the cellular environment can influence probe performance, with both oxidative stress (OS) and reductive stress (RS) potentially altering measurements [59].
Probes for Superoxide Anion Detection
Detection Approaches and Probe Selection
Table 2: Superoxide Anion Detection Methods
| Method | Probe Examples | Detection Limit | Specificity Assessment | Key Applications |
|---|---|---|---|---|
| EPR with hydroxylamines | CMH, MitoTEMPO-H | High (nM range) | Specific for O₂•⁻ over •OH in controlled systems | Cell lysates, stimulated macrophages |
| EPR with spin traps | DIPPMPO | Moderate | Distinguishes O₂•⁻ and •OH adducts by spectrum | Isolated mitochondria, enzyme systems |
| EPR with paramagnetic scavengers | CT-03 (Trityl) | Lower sensitivity | Specific for O₂•⁻ | Extracellular superoxide detection |
| Fluorescence with HPLC | Dihydroethidium (HE) | Requires HPLC separation | Specific only with HPLC | Cell culture, tissue sections |
| Bioluminescence | Apoaequorin/Coelenterazine | ~8×10⁵ RLU/s cutoff | Highly specific for O₂•⁻ | Seminal fluid, clinical samples |
Superoxide anion detection presents particular challenges due to its moderate reactivity and rapid dismutation. Electron paramagnetic resonance (EPR) methodologies provide the most reliable approaches, with cyclic hydroxylamines like CMH (1-hydroxy-3-methoxycarbonyl-2,2,5,5-tetramethylpyrrolidine) demonstrating superior sensitivity and specificity in biological media [61]. Fluorescence-based methods using dihydroethidium require HPLC separation for specific superoxide detection, as multiple oxidation products contribute to total fluorescence [61]. A novel bioluminescence approach utilizing the aequorin-coelenterazine system provides exceptional specificity with a demonstrated cut-off value of 8×10⁵ RLU/s for discriminating normal and pathological superoxide levels in clinical samples [62].
Experimental Protocol: EPR with CMH for Cellular Superoxide
Sample Preparation
- Prepare RAW264.7 macrophages or other relevant cell type in DMEM with 10% FBS
- Culture cells to 70-80% confluence in appropriate culture vessels
- Stimulate superoxide production using phorbol 12-myristate 13-acetate (PMA) at 100-200 nM
- Harvest cells gently using non-enzymatic dissociation methods
Reagent Preparation
- Prepare CMH probe solution at 10 mM concentration in DMSO
- Create phosphate-buffered saline (PBS) with diethylenetriaminepentaacetic acid (DTPA) at 25 µM to chelate metal ions
- Prepare superoxide dismutase (SOD) control solution at 500 U/mL in PBS
Measurement Procedure
- Resuspend cell pellets in PBS-DTPA buffer at 1×10⁶ cells/mL
- Add CMH probe to sample at final concentration of 500 µM
- Divide sample into two aliquots; add PEG-SOD (50 U/mL) to one aliquot as negative control
- Immediately transfer samples to glass capillary tubes
- Record EPR spectra using the following parameters:
- Center field: 3350 G
- Scan range: 100 G
- Microwave power: 20 mW
- Modulation amplitude: 2 G
- Time constant: 0.1 s
Data Analysis
- Measure signal intensity of the low-field component of the nitroxide spectrum
- Subtract SOD-inhibitable signal from total signal
- Quantify superoxide concentration using standard curve prepared with xanthine/xanthine oxidase system
Probes for Hydrogen Peroxide Detection
Fluorescent Probe Strategies
Table 3: Hydrogen Peroxide Fluorescent Probes
| Probe Name | Reaction Mechanism | Excitation/Emission | Detection Limit | Dynamic Range | Key Applications |
|---|---|---|---|---|---|
| CMB | Boronate oxidation | 405/450 nm | 0.13 µM | 0-50 µM | Living cells, zebrafish |
| Boric acid-based probes | Boric acid deprotection | Varies by fluorophore | Low µM range | ~25-fold enhancement | Cancer cells, deep tissue |
| MitoB/MitoP | Triphenylphosphonium-targeted | HPLC-MS required | nM range | Quantitative | Mitochondrial H₂O₂ in vivo |
| Ratiometric probes | Payne/Dakin reaction | Dual-wavelength | Sub-µM | Self-calibrating | Quantitative tissue imaging |
Hydrogen peroxide probes primarily utilize boronate oxidation chemistry, where H₂O₂ reacts with aryl boronate or boronic ester groups to release fluorescent products [63] [60]. The coumarin-based CMB probe demonstrates approximately 25-fold fluorescence enhancement after H₂O₂ addition, with excellent selectivity over other ROS and a detection limit of 0.13 µM [63]. This sensitivity enables detection of physiological H₂O₂ fluctuations, which typically range from 10⁻⁹ M to 10⁻⁴ M in biological systems [60]. Recent advances include near-infrared (NIR) probes for deep-tissue imaging and ratiometric probes that provide internal calibration for quantitative measurements.
Experimental Protocol: Live-Cell H₂O₂ Imaging with CMB
Cell Culture and Probe Loading
- Culture MCF-7 or other adherent cells on glass-bottom dishes in complete medium
- At 60-70% confluence, wash cells twice with warm PBS
- Prepare working solution of CMB probe (5 µM) in serum-free medium
- Incubate cells with CMB solution for 30 minutes at 37°C in the dark
- Replace probe solution with fresh serum-free medium
Exogenous H₂O₂ Stimulation and Imaging
- Prepare H₂O₂ dilutions in serum-free medium (0-50 µM concentration range)
- Acquire baseline fluorescence images using 405 nm excitation and 450 nm emission
- Add H₂O₂ solutions to cells and image at 5-minute intervals for 60 minutes
- Maintain temperature at 37°C using stage-top incubator
Endogenous H₂O₂ Production
- For glucose oxidase-induced H₂O₂: Add glucose oxidase (5 mU/mL) to cells
- For inhibition studies: Pre-treat cells with catalase-polyethylene glycol (100 U/mL)
- For mitochondrial H₂O₂: Stimulate with rotenone (1 µM) for 30 minutes
Image Analysis and Quantification
- Measure fluorescence intensity in regions of interest corresponding to individual cells
- Normalize signals to baseline fluorescence (F/F₀)
- Generate calibration curve using known H₂O₂ concentrations
- Express results as mean fluorescence intensity ± SEM from at least 3 independent experiments
Probes for Hydroxyl Radical Detection
Specific Detection Methods
Hydroxyl radical detection requires highly specific approaches due to their extreme reactivity and non-selective attack on biomolecules. The aminophenyl fluorescein (APF) probe demonstrates superior specificity and sensitivity for •OH detection compared to alternatives like DCFH and amplex ultrared [64]. APF becomes highly fluorescent after reaction with hydroxyl radicals or peroxynitrite, but not with other ROS unless horseradish peroxidase is present. A novel turn-on fluorescent probe BIJ-H recently developed exhibits emission at 625 nm with excitation at 550 nm, achieving a detection limit of 0.14 µM and successful application in drug-induced liver injury models [65].
Experimental Protocol: Hydroxyl Radical Detection with APF
Solution Preparation
- Prepare APF stock solution (5 mM) in high-quality DMSO
- Create phosphate buffer (10 mM, pH 7.4) with DTPA (25 µM) to chelate metal ions
- Prepare Fenton reaction reagents: FeSO₄ (100 µM) and H₂O₂ (1 mM) in chelex-treated water
Hydroxyl Radical Generation and Detection
- Add APF (5 µM final concentration) to phosphate buffer in quartz cuvette
- Initiate •OH generation by adding FeSO₄ followed by H₂O₂
- For specificity control, include sodium formate (10 mM) as •OH scavenger
- Monitor fluorescence continuously using spectrofluorometer:
- Excitation wavelength: 490 nm
- Emission wavelength: 515 nm
- Temperature: 25°C
- Time course: 10-30 minutes
Cell-Based •OH Detection
- Culture HepG2 cells in DMEM with 10% FBS on glass coverslips
- Load cells with APF (5 µM) for 30 minutes at 37°C
- Induce •OH generation using acetaminophen (10 mM) for drug-induced liver injury model
- Acquire fluorescence images using standard FITC filter sets
- Quantify fluorescence intensity using ImageJ software
Data Interpretation
- Calculate •OH concentration from fluorescence standard curve
- Confirm •OH-specific signal through scavenger inhibition
- Express results as normalized fluorescence units per µg protein
The Scientist's Toolkit: Essential Research Reagents
Table 4: Key Research Reagents for ROS Detection
| Reagent Category | Specific Examples | Function & Application | Key Considerations |
|---|---|---|---|
| EPR Probes | CMH, DIPPMPO, CT-03 | Superoxide detection in biological systems | CMH offers best sensitivity; DIPPMPO allows radical identification |
| Fluorescent Probes | CMB, APF, BIJ-H | Spatial localization of H₂O₂ and •OH in live cells | Check cell permeability and subcellular localization |
| Spin Traps | DMPO, DIPPMPO | Stabilization of radical adducts for EPR detection | Short half-life of adducts requires rapid measurement |
| Enzymes | PEG-SOD, PEG-Catalase | Specific ROS modulation and control experiments | PEG-conjugated forms have better cellular retention |
| ROS Generators | Xanthine/Xanthine oxidase, PMA | Controlled ROS production for calibration | Use physiologically relevant concentrations |
| Chelators | DTPA, Desferrioxamine | Metal ion control for Fenton reaction prevention | Select based on specific metal binding requirements |
Targeting specific ROS requires understanding their distinct chemical properties and selecting appropriate detection methodologies. EPR with cyclic hydroxylamines provides sensitive superoxide detection, boronate-based fluorescent probes enable specific hydrogen peroxide imaging in live cells, and APF offers reliable hydroxyl radical quantification. Researchers must employ careful controls including enzyme inhibitors, specific scavengers, and proper calibration to ensure accurate ROS measurement. These protocols provide a foundation for investigating ROS roles in physiological signaling and pathological processes, supporting drug development efforts targeting redox regulation in human disease.
The spatial distribution of reactive oxygen species (ROS) and redox status across subcellular compartments controls specific signaling pathways and their (patho)physiological consequences [51]. The precise site of ROS production is pivotal for the transmission of cellular information, making it crucial to develop tools that enable site-specific detection of ROS in complex systems, including in vivo [51]. Genetically encoded fluorescent sensors and chemical probes targeted to specific organelles have revolutionized our understanding of compartmentalized redox dynamics, revealing that oxidative stress is not a uniform cellular state but exhibits remarkable subcellular heterogeneity.
This application note provides a comprehensive technical resource for researchers investigating oxidative stress at subcellular resolution. We detail the current methodologies for measuring redox status in the cytosol, mitochondria, and peroxisomes—organelles with interconnected yet distinct redox functions. The protocols and data presented herein enable precise assessment of compartment-specific redox environments, which is essential for understanding redox signaling in physiological processes and drug development for oxidative stress-related pathologies.
Sensor Technologies and Targeting Strategies
Genetically Encoded Fluorescent Sensors
Redox-sensitive green fluorescent protein (roGFP) variants represent a major advancement in spatially resolved redox sensing. These molecular probes contain engineered cysteine residues that form disulfide bonds in the presence of oxidants, causing reciprocal changes in emission intensity when excited at two different wavelengths [66]. The roGFP framework can be targeted to specific organelles through genetic fusion with localization sequences.
Grx1-roGFP2, developed by Gutscher et al., is a particularly elegant design that couples roGFP2 to human glutaredoxin-1, enabling quantitative assessment of the glutathione redox potential (EGSSG/GSH) [67]. This sensor has been successfully targeted to multiple subcellular compartments through the addition of specific targeting sequences:
- Cytosolic sensors: Basic roGFP constructs without additional targeting sequences primarily reflect the cytosolic redox environment.
- Organelle-targeted sensors: Specific targeting peptides direct roGFP localization to mitochondria, peroxisomes, endoplasmic reticulum, and Golgi apparatus [67] [66].
- Membrane-associated sensors: Palm-Grx1-roGFP2 incorporates a palmitoylation sequence for attachment to cytosolic surfaces of biological membranes [67].
Chemical and Electron Paramagnetic Resonance (EPR) Probes
For non-genetic approaches and in vivo applications, chemical probes provide complementary strategies for redox assessment:
Small molecule fluorescent dyes including dichlorodihydrofluorescein diacetate (DCFH-DA), hydroethidine (HE), and mitoSOX have been widely used, though they often lack specificity regarding the ROS species detected [51].
EPR nitroxide sensors enable noninvasive discrimination of ROS production sites in vivo [51]. The dual-probe approach using:
- 3-Carbamoyl Proxyl (3CP): A hydrophilic nitroxide distributing throughout extra- and intra-cellular compartments for global ROS detection.
- mitoTEMPO: A mitochondria-targeted nitroxide accumulating specifically in mitochondria.
Table 1: Comparison of Major Redox Sensor Technologies
| Sensor Type | Spatial Resolution | Key Measurable | Advantages | Limitations |
|---|---|---|---|---|
| roGFP-based [67] [66] | Organelle-specific | Glutathione redox potential (EGSSG/GSH) | Genetically targetable, rationetric quantification | Requires genetic manipulation |
| EPR nitroxides [51] | Mitochondrial vs. global | ROS production sites | Suitable for in vivo use, non-invasive | Limited sub-organellar resolution |
| Chemical fluorescent dyes [51] | Cellular and organellar | General oxidative activity | Easy implementation, no genetic manipulation | Lack ROS specificity, potential artifacts |
Organelle-Specific Redox Environments
Cytosolic Redox Landscape
The cytosol maintains a highly reduced redox equilibrium of glutathione, though significant cell-to-cell deviation can be observed [67]. Using roGFP-based sensors, the basal cytosolic redox status has been established as a reference point for comparing other compartments [66]. Interestingly, the cytosol does not maintain a completely uniform redox balance, with local variations observed near organelle membranes and cytoskeletal structures [67].
Key features of the cytosolic redox environment:
- Highly reduced glutathione pool under basal conditions
- Significant oxidation in response to hydrogen peroxide challenge
- Reduction recoverable with dithiothreitol (DTT) treatment
- Local heterogeneity near organelle interfaces
Mitochondrial Redox Compartments
Mitochondria are major producers of ROS in cells, with the electron transport chain serving as a primary source [51]. roGFP probes targeted to different mitochondrial subcompartments (outer membrane, intermembrane space, matrix) reveal distinct redox environments and dynamics [66].
Experimental evidence for mitochondrial redox modulation:
- Complex III inhibition with Antimycin A significantly increases mitochondrial ROS production [51]
- Mitochondrial-targeted EPR probes (mitoTEMPO) show distinct decay kinetics compared to cytosolic probes
- Overexpression of mitochondrial superoxide dismutase 2 (SOD2) modulates redox responses
Peroxisomal Redox Functions
Peroxisomes are so named for their ability to both generate and degrade hydrogen peroxide via enzymes contained in their matrix [68]. These organelles contribute to β-oxidation of very-long chain fatty acids (VLCFAs), biosynthesis of ether phospholipids, and metabolism of reactive oxygen species (ROS) [68].
Unique peroxisomal redox characteristics:
- Compartmentalization of H2O2-producing and degrading enzymes
- Role in inflammatory responses and innate immunity
- Involvement in neuroinflammatory diseases when dysfunctional
Table 2: Quantitative Redox Parameters Across Subcellular Compartments
| Compartment | Sensor Used | Basal Redox State | Response to H2O2 | Response to DTT | Key Modulators |
|---|---|---|---|---|---|
| Cytosol | Grx1-roGFP2 [67] | Highly reduced | Rapid oxidation | Rapid reduction | Glutathione synthesis |
| Mitochondria | mito-roGFP [66] | Variable oxidation | Further oxidation | Partial reduction | Antimycin A, SOD2 expression [51] |
| Peroxisomes | Peroxisome-targeted roGFP [67] | Moderately oxidized | Further oxidation | Moderate reduction | PEX gene expression [68] |
| Golgi lumen | Golgi-targeted roGFP [67] | Oxidized | Further oxidation | Limited reduction | Unknown |
Experimental Protocols
Protocol 1: Redox Measurement Using roGFP Probes in Cultured Cells
This protocol details the procedure for measuring compartment-specific redox changes using targeted roGFP probes in HeLa cells, adaptable to other cell types [67] [66].
Materials and Equipment:
- Plasmid DNA encoding organelle-targeted roGFP probes
- HeLa cells (or other relevant cell types)
- Dulbecco's Minimal Essential Medium (DMEM) supplemented with 10% FBS
- Collagen-coated 35-mm FluoroDishes
- Lipofectamine 3000 transfection reagent
- Confocal microscope with 405nm and 488nm excitation capabilities
- Hydrogen peroxide (H2O2) and dithiothreitol (DTT) solutions
- N-ethylmaleimide (NEM) and paraformaldehyde (PFA) for fixation
Procedure:
Cell Culture and Transfection:
- Culture HeLa cells in DMEM supplemented with 10% FBS, penicillin, and streptomycin.
- Plate cells on collagen-coated 35-mm FluoroDishes until reaching sub-confluent stage.
- Transfect with 2 μg of plasmid DNA encoding organelle-targeted roGFP using Lipofectamine 3000 according to manufacturer's instructions.
- Replenish culture medium 24 hours post-transfection and perform assays typically 48 hours after transfection.
Live-Cell Imaging and Redox Analysis:
- Image live cells directly using a confocal microscope with GaAsP PMT detector.
- Acquire two-channel images using 405nm and 488nm excitation wavelengths with emission detection at 540-560nm.
- Calculate the ratio of intensities (RI405/I488) as a measure of sensor oxidation.
- For fixed-cell analysis, treat cells with 10mM NEM for 10 minutes at room temperature prior to PFA fixation to preserve redox status.
Sensor Validation and Challenge Assays:
- Test sensor reactivity by adding hydrogen peroxide (typical range 100-500μM) to forcibly oxidize cellular glutathione.
- Monitor reversal of oxidation by adding the cell-permeable reductant DTT (typical range 1-5mM).
- Record changes in redox status using time-lapse confocal microscopy.
Data Analysis:
- Process images using ImageJ software with Fiji package.
- Calculate oxidation ratios from intensity measurements.
- Generate time-course data for dynamic experiments.
Protocol 2: EPR-Based Redox Assessment Using Nitroxide Probes
This protocol describes the use of EPR spectroscopy with compartment-specific nitroxide probes for noninvasive redox assessment in vitro and in vivo [51].
Materials and Equipment:
- 3-Carbamoyl-PROXYL (3CP) and mitoTEMPO nitroxides
- EPR spectrometers (9 GHz for in vitro, 1 GHz for in vivo)
- 4T1 breast tumor cells or other relevant models
- l-Buthionine Sulfoximine (L-BSO) for glutathione depletion
- Antimycin A for mitochondrial complex III inhibition
- Xanthine/Xanthine Oxidase system for superoxide production
Procedure:
In Vitro EPR Measurements:
- Prepare tumor cells (e.g., 4T1) according to standard cell culture protocols.
- Modulate cytosolic ROS by treating with L-BSO (glutathione synthesis inhibitor) or mitochondrial ROS with Antimycin A (complex III inhibitor).
- Incubate cells with 20μM 3CP or mitoTEMPO for probe distribution.
- Transfer cell suspensions to sealed capillary tubes for EPR measurement.
- Record EPR signal decay over time using 9 GHz spectrometer.
In Vivo EPR Measurements:
- Establish tumor models (e.g., 4T1 breast tumors in mice).
- Administer redox modulators: L-BSO for cytosolic ROS induction or Antimycin A for mitochondrial ROS.
- Inject nitroxide probes (3CP or mitoTEMPO) via tail vein or other appropriate route.
- Acquire EPR spectra over time using 1 GHz spectrometer optimized for in vivo measurement.
- Monitor signal decay rates as an indicator of redox-mediated reduction.
Data Interpretation:
- Compare decay rates between 3CP (global) and mitoTEMPO (mitochondrial) probes.
- Faster decay indicates higher ROS production in the specific compartment.
- Validate specificity using genetic modifications (e.g., SOD2 overexpression).
The Scientist's Toolkit: Essential Research Reagents
Table 3: Key Research Reagent Solutions for Redox Sensing
| Reagent/Resource | Source/Identifier | Function and Application |
|---|---|---|
| pEIGW/Grx1-roGFP2 plasmid | Addgene #64990 [67] | Base construct for cytosolic glutathione redox potential measurement |
| Organelle-targeted roGFP variants | Custom construction [67] | Specific targeting to mitochondria, peroxisomes, Golgi, and ER |
| VQAd CMV mito-roGFP | ViraQuest #122909 [66] | Adenoviral vector for mitochondrial-targeted roGFP expression |
| 3-Carbamoyl-PROXYL (3CP) | Sigma-Aldrich #4399-80-8 [51] | Hydrophilic nitroxide for global intracellular/extracellular ROS detection |
| mitoTEMPO | Bio-Connect #1334850-99-5 [51] | Mitochondria-targeted nitroxide for specific mtROS detection |
| L-Buthionine Sulfoximine (L-BSO) | Commercial sources [51] | Glutathione synthesis inhibitor for cytosolic redox modulation |
| Antimycin A | Commercial sources [51] | Mitochondrial complex III inhibitor for mtROS induction |
| Screen-printed electrodes | DropSens, etc. [49] | Electrochemical detection of redox status |
Signaling Pathways and Workflows
Diagram 1: Experimental Workflow for Compartment-Specific Redox Sensing
Diagram 2: Compartment-Specific ROS Signaling and Detection
The development of spatially resolved redox sensors has transformed our ability to monitor compartment-specific oxidative processes in living cells and organisms. The protocols and reagents detailed in this application note provide researchers with robust methodologies for investigating cytosolic, mitochondrial, and peroxisomal redox environments. As these technologies continue to evolve, we anticipate further refinement in sensor specificity, temporal resolution, and applicability to in vivo models.
The emerging evidence of redox compartmentalization highlights the importance of moving beyond whole-cell oxidative stress assessments to understand the nuanced spatial regulation of redox signaling. These advanced sensing approaches will undoubtedly play a crucial role in future drug development efforts targeting oxidative stress in cancer, neurodegenerative diseases, and other pathologies linked to redox dysregulation.
Application Note: Redox Profiling in Tumor Models
The malignant reprogramming of cancer cells creates a unique redox paradox, where elevated reactive oxygen species (ROS) function as pro-tumorigenic signaling molecules while simultaneously creating a vulnerability to further oxidative stress [69]. Cancer cells maintain a hyperactive antioxidant shield orchestrated by the Nrf2, glutathione (GSH), and thioredoxin (Trx) systems to survive under chronic oxidative stress [69]. This application note details methodologies for investigating this redox balance in tumor models using advanced probing technologies.
Key Signaling Pathways in Cancer Redox Biology
The diagram below illustrates the core redox signaling pathways and therapeutic targets in cancer cells.
Quantitative Redox Parameters in Tumor Models
Table 1: Key Redox Parameters Measurable in Tumor Models
| Parameter | Detection Method | Typical Findings in Cancer | Significance |
|---|---|---|---|
| H₂O₂ Levels | Genetically encoded fluorescent biosensors [25] | Elevated in tumor microenvironment [69] | Promotes proliferation, angiogenesis via oxidative inactivation of tumor suppressors [69] |
| NADPH/NADP+ Ratio | Fluorescent indicators (e.g., iATPSnFRs) [70] | Maintained steady-state under oxidative stress [71] | Supports antioxidant defense; critical for redox balance [71] |
| Glutathione Status | Low-input redoxomics [72] | GSH system hyperactive [69] | Maintains redox homeostasis; target for ferroptosis induction [69] |
| Nrf2 Activation | SN-ROP mass cytometry [73] | Constitutively active in many cancers [69] | Master regulator of antioxidant response; therapeutic target [69] |
| Protein Cysteine Oxidation | TMT-based redoxomics [72] | Increased SOH, SSG, SNO modifications with aging/stress [72] | Disruption of redox signaling networks; oxidative damage marker [72] |
Protocol: 19F-MRI for Monitoring Tumor Redox State Using Selenide Polymer Nanoprobes
Principle
Trifluoromethyl-grafted selenide polymer nanoprobes enable reversible redox sensing through 19F-nuclear magnetic resonance (NMR) peak shifts between oxidation (-58.7 ppm) and reduction (-64.2 ppm) states [17].
Materials
- PIBAM-FSeN nanoprobes (16 wt% fluorine content) [17]
- Tumor-bearing mouse model
- 19F-MRI instrument (e.g., 7T MRI)
- Image processing software
Procedure
- Nanoprobe Administration: Inject PIBAM-FSeN nanoprobes intravenously (10 mg/mL in sterile saline) [17].
- Image Acquisition: Acquire 19F-MRI images at predetermined time points post-injection using a refocused echo (RARE) sequence with the following parameters [17]:
- Center frequency for oxidized form: -58.7 ppm (red channel)
- Center frequency for reduced form: -64.2 ppm (blue channel)
- T₁ relaxation: ~0.96 s (PIBAM-FSeN), ~1.01 s (PIBAM-FSeON)
- T₂ relaxation: ~0.59 s (PIBAM-FSeN), ~0.45 s (PIBAM-FSeON)
- Data Analysis: Calculate the 19F-MRI signal ratio SOx/(SOx + SRed) where SOx represents the signal intensity at -58.7 ppm and SRed at -64.2 ppm [17].
- Validation: Compare redox ratios between tumor tissue and adjacent normal tissue.
Expected Results
Tumor tissues typically exhibit more oxidized environments, demonstrated by higher SOx/(SOx + SRed) ratios compared to normal tissues [17]. The ratio shows 10.5-fold increase after exposure to 0.8 eq. of H₂O₂ and 12.5-fold decrease after exposure to 0.8 eq. of Na₂S [17].
Application Note: Redox Dynamics in Neurodegeneration
The brain's high metabolic rate and abundance of polyunsaturated fatty acids make it particularly vulnerable to oxidative stress [5]. Neurons are postmitotic with limited regenerative capacity, making redox balance critical for neuronal survival [5]. This application note details approaches for measuring redox dynamics in neurodegenerative models.
Protocol: Single-Cell Redox Network Profiling in Neurodegenerative Models
Principle
Signaling Network under Redox Stress Profiling (SN-ROP) uses mass cytometry to simultaneously quantify ROS transporters, scavenging enzymes, oxidative stress products, and associated signaling pathways at single-cell resolution [73].
Materials
- Antibody panel targeting 33+ ROS-related proteins (Supplementary Table 2 from [73])
- Cell barcoding kit (e.g., Pd-102, Pd-104, Pd-105, Pd-106 isotopes)
- Mass cytometer
- Single-cell analysis software (e.g., Citrus, UMAP)
Procedure
- Sample Preparation: Expose neuronal cells or brain tissue sections to varying concentrations of H₂O₂ (0-500 μM) for different durations (0-24 hours) [73].
- Cell Barcoding: Label different experimental conditions with distinct palladium isotopes to enable multiplexed analysis [73].
- Antibody Staining: Incubate with primary antibody panel targeting:
- ROS transporters (aquaporins)
- Antioxidant enzymes (SOD, catalase, GPX)
- Oxidative damage markers (protein sulfonic oxidation)
- Signaling molecules (pNFκB, pAKT, pERK, pS6)
- Phenotypic markers (cell type-specific) [73]
- Data Acquisition: Analyze samples using mass cytometry, collecting a minimum of 50,000 cells per condition.
- Data Analysis:
- Calculate CytoScore (cytoplasmic redox markers) and MitoScore (mitochondrial redox markers) [73]
- Perform dimensionality reduction (UMAP) based on redox features
- Use machine learning algorithms to classify cell states based on redox profiles
Expected Results
SN-ROP reveals cell-type-specific redox patterns and can achieve >95% prediction accuracy for immune cell subsets based solely on redox features [73]. In neurodegenerative models, expect to observe reduced ATP/ADP ratios, increased oxidative damage markers, and altered NRF2 and pNFκB signaling [70] [73].
Research Reagent Solutions for Neurodegeneration Studies
Table 2: Essential Research Reagents for Redox Studies in Neurodegeneration
| Reagent Category | Specific Examples | Function/Application | Key Features |
|---|---|---|---|
| Genetically Encoded ATP Biosensors | ATeam1.03YEMK [70] | FRET-based ATP monitoring in neuronal compartments | Kd ≈ 7.4 μM; 150% dynamic range; optimal for physiological ATP levels |
| iATPSnFRs [70] | Single-wavelength ATP sensing at synaptic terminals | EC50 ≈ 50-120 μM; 2-fold dynamic range; suitable for surface ATP detection | |
| MaLions (MaLionR/G/B) [70] | Intensity-based ATP measurements in multiple compartments | Kd: 0.34-1.1 mM; 90-390% dynamic range; spectrally diverse | |
| PercevalHR [70] | ATP/ADP ratio sensing | KR ≈ 3.5; 5-fold greater dynamic range than Perceval | |
| Mitochondria-Targeted Antioxidants | MitoQ [5] | Targeted mitochondrial ROS scavenging | Accumulates in mitochondria; protects against oxidative damage |
| SS-31 [5] | Mitochondria-targeting peptide | Reduces mitochondrial ROS; improves neuronal function | |
| Nrf2 Activators | Dimethyl fumarate [5] | Nrf2 pathway activation | Clinically approved; induces antioxidant gene expression |
| Sulforaphane [5] | Natural Nrf2 activator | Dietary compound; boosts glutathione synthesis |
Application Note: Metabolic Reprogramming Under Redox Stress
Under oxidative stress, cells rapidly reprogram metabolic flux from glycolysis to the pentose phosphate pathway (PPP) to maintain NADPH steady-state levels, which is crucial for antioxidant defense [71]. This application note details methods for investigating metabolic adaptations to redox stress.
Experimental Workflow for Metabolic Redox Studies
The diagram below outlines the integrated workflow for studying metabolic responses to redox stress.
Protocol: Monitoring Real-Time Metabolic Adaptations to Oxidative Stress
Principle
Genetically encoded fluorescent indicators enable monitoring of glucose, NADPH, fructose 1,6-bisphosphate, and pyruvate in single cells with high temporal resolution during oxidative stress [71].
Materials
- Panel of genetically encoded fluorescent indicators:
- Glucose sensors (e.g., Fluorescent Glucose Transporters)
- NADPH sensors (e.g., iNAP sensors)
- Fructose 1,6-bisphosphate sensors
- Pyruvate sensors
- Live-cell imaging system with environmental control
- H₂O₂ treatment solutions (50-500 μM)
Procedure
- Cell Preparation: Culture cells in appropriate media and transfect with metabolic biosensors targeting specific compartments (cytosol, mitochondria) [70].
- Baseline Recording: Acquire baseline fluorescence measurements for 10-15 minutes to establish metabolic steady-state.
- Oxidative Stress Induction: Add H₂O₂ (100-500 μM final concentration) while maintaining continuous imaging [71].
- Inhibitor Studies: To validate pathway involvement:
- Inhibit PPP gateway enzyme G6PD with pharmacological inhibitors
- Inhibit transketolase to block non-oxidative PPP [71]
- Image Analysis:
- Quantify fluorescence intensity changes over time
- Calculate transport/consumption rates from tracer kinetics
- Correlate metabolic changes with redox status
Expected Results
Acute H₂O₂ exposure rapidly activates glucose transport and consumption rates, enabling cells to preserve NADPH steady-state levels during early oxidative stress [71]. This response precedes NADPH depletion and involves diversion of glucose-derived carbon flux to the PPP [71].
Advanced Redox Sensing Technologies
Table 3: Advanced Probes for In Vivo Redox Measurement
| Technology Platform | Key Components | Measurement Principle | Applications & Advantages |
|---|---|---|---|
| Multi-Spin Redox Sensor (RS) [16] | Quantum dot core, cyclodextrin shell, TEMPO nitroxides, triphenylphosphonium | EPR signal decay rate reflects reducing capacity; longer circulation vs mito-TEMPO | In vivo redox imaging; higher MRI contrast; penetrates blood-brain barrier |
| Reversible 19F-MRI Nanoprobes [17] | Selenide polymer with trifluoromethyl tags | Chemical shift between -58.7 ppm (oxidized) and -64.2 ppm (reduced) | Reversible sensing; deep tissue imaging; zero background; quantitative SOx/(SOx+SRed) ratio |
| Low-Input Redoxomics [72] | TMT labeling, biotin probe labeling | Simultaneous profiling of 5 cysteine states: SH, Sto, SOH, SNO, SSG | Proteome-wide redox signaling; requires only 60 μg total peptides; regional resolution in tissues |
| SN-ROP Mass Cytometry [73] | 33+ antibody panel, cell barcoding | Single-cell quantification of ROS network components | High-dimensional redox profiling; identifies rare cell populations; correlates with clinical outcomes |
Navigating Pitfalls and Enhancing Accuracy in Redox Measurements
Common Artifacts and Limitations of Widely Used Probes
Within the field of redox biology, the accurate measurement of oxidative stress and redox signaling in vivo is paramount for understanding their roles in physiological and pathological processes, from cell signaling to neurodegenerative diseases. This application note critically examines the common artifacts and limitations of widely used chemical and genetic redox probes. Aimed at researchers and drug development professionals, this document provides detailed methodologies and structured data to guide the selection, application, and interpretation of these essential tools, thereby supporting the development of more reliable redox biology research and therapeutic interventions.
Critical Analysis of Major Redox Probe Classes
Small-Molecule Fluorescent Probes
Small-molecule fluorescent probes are widely used for detecting reactive oxygen and nitrogen species (ROS/RNS) in live cells due to their ease of use and flexibility. However, significant challenges regarding their selectivity and interpretation persist.
A primary issue is the lack of absolute specificity. A probe initially developed for one analyte often cross-reacts with other biologically relevant species. For instance, boronate-based probes, commonly used for hydrogen peroxide (H2O2), react with peroxynitrite (ONOO⁻) at a rate over a million times faster than with H2O2 at physiological pH [74]. Similarly, dichlorodihydrofluorescein (DCFH), one of the earliest and most used "ROS" probes, is oxidized by a multitude of species, including oxidized glutathione (GSSG), nitric oxide (NO•), and oxygen, making its signal an indicator of the overall cellular redox state rather than a specific oxidant [74]. This underscores the necessity of using the term "selective" rather than "specific" when describing these tools.
The kinetics of the sensing reaction must also be carefully considered. The physiological concentration of H2O2 is typically in the nanomolar range (1–100 nM). When a probe is applied at a common staining concentration of 10 µM, a second-order rate constant of at least 278 M⁻¹·s⁻¹ is required for the reaction to proceed efficiently, assuming a constant analyte concentration [74]. Many probes may not meet this kinetic requirement, leading to false negatives or an underestimation of the true ROS levels.
Furthermore, many small-molecule probes operate through an irreversible reaction mechanism. This irreversibility prevents them from tracking dynamic decreases in analyte concentration, limiting their utility for monitoring real-time fluctuations in redox signaling [74].
Electrochemical Redox Probes
In electrochemical sensor characterization, redox probes such as hexacyanoferrate ([Fe(CN)₆]³⁻/⁴⁻) and hexaammineruthenium ([Ru(NH₃)₆]³⁺/²⁺) are routinely used, yet their application is fraught with potential for misinterpretation [75].
A widespread artifact is the use of these probes to estimate the electrochemically active surface area (ECSA), often called the "real area." For rough or porous electrodes, techniques like cyclic voltammetry and chronoamperometry are unable to detect surface roughness much smaller than the diffusion layer thickness (approximately 100 µm in a standard experiment). Consequently, the calculated area is often a poor representation of the true ECSA [75]. This practice can fail even with planar electrodes when using [Fe(CN)₆]³⁻/⁴⁻ due to its surface-sensitive nature and quasi-reversible kinetics on carbon surfaces [75].
Another common error is the interpretation of charge transfer resistance (Rct) obtained from electrochemical impedance spectroscopy (EIS). Increasing the working electrode's physical area will always decrease the measured Rct. This should not be automatically interpreted as an improved electron transfer rate, as it is a direct consequence of the increased surface area [75].
Perhaps most critically for biosensing, redox probes can interfere with protein detection in molecularly imprinted polymer (MIP) sensors. Studies show that redox probes like hexacyanoferrate can adsorb onto the polymeric matrix and alter protein conformation, thereby reducing the specific interaction between the target protein and the imprinted cavities. This leads to inflated or non-specific signals, undermining the sensor's accuracy. Detection in a simple phosphate-buffered saline (PBS) solution, without added probes, can sometimes enhance the binding affinity between the analyte and the imprints [76].
Genetically Encoded Probes
Genetically encoded probes, such as redox-sensitive green fluorescent protein (roGFP) fused to glutaredoxin (Grx1) or Orp1, offer a targeted approach to measuring the redox state of specific cellular pools, such as glutathione (GSH/GSSG) or H₂O₂ [77]. Their principal advantage is the ability to be genetically targeted to subcellular locations, providing spatial resolution unattainable with most small-molecule probes.
A key strength of certain roGFP probes is their reversibility, which allows for ratiometric measurements. By calculating the ratio of fluorescence upon excitation at two different wavelengths, researchers can obtain a quantitative readout that is independent of probe concentration, mitigating artifacts related to variations in expression levels or cell thickness [74] [9].
However, these probes are not without limitations. Their relatively large size may sterically hinder interactions or alter the native environment they are designed to measure. Their expression and proper folding are also dependent on the cellular machinery, which can be a constraint in some experimental systems. Lastly, the response time of protein-based probes may be slower than that of small-molecules, potentially missing very rapid redox transients [74].
Table 1: Summary of Common Redox Probe Artifacts and Limitations
| Probe Class | Common Examples | Key Artifacts & Limitations |
|---|---|---|
| Small-Molecule Fluorescent | DCFH, Boronate-based probes, MitoSOX Red | - Lack of specificity; cross-reactivity with multiple ROS/RNS.- Slow reaction kinetics relative to physiological analyte concentrations.- Irreversible reactions prevent tracking of decreasing concentrations. |
| Electrochemical | [Fe(CN)₆]³⁻/⁴⁻, [Ru(NH₃)₆]³⁺/²⁺ | - Inaccurate estimation of electrochemically active surface area on rough electrodes.Misinterpretation of charge transfer resistance (Rct) as electron transfer rate.- Non-specific adsorption on sensor surfaces, interfering with protein analysis. |
| Genetically Encoded | roGFP, roGFP-Grx1, roGFP-Orp1 | - Large size may cause steric interference and alter native biology.- Reliance on cellular machinery for expression and folding.- Potentially slower response times compared to small molecules. |
Experimental Protocols for Probe Validation
Protocol: Assessing Selectivity of Small-Molecule Probes
Purpose: To determine the selectivity of a novel or commercially available small-molecule fluorescent probe (e.g., for H₂O₂) against a panel of biologically relevant interfering species.
Materials:
- Probe stock solution
- Analyte of interest stock solution (e.g., H₂O₂)
- Interferent stock solutions (e.g., OCl⁻, ONOO⁻, •NO, GSH, Cys)
- Suitable buffer (e.g., PBS, pH 7.4)
- Fluorescence spectrometer or plate reader
Procedure:
- Prepare a working solution of the probe in buffer at a standard staining concentration (e.g., 10 µM).
- Aliquot the probe solution into multiple cuvettes or wells of a microplate.
- To separate aliquots, add a single potential interferent at a physiologically relevant concentration. Include a positive control (the target analyte) and a negative control (buffer only).
- Incubate the reactions for a predetermined time at 37°C.
- Measure the fluorescence signal for each sample using the appropriate excitation/emission wavelengths.
- Data Analysis: Compare the fluorescence intensity generated by the interferent to that generated by the target analyte. A significant response from an interferent indicates a lack of selectivity, and results obtained with the probe in complex biological systems should be interpreted with caution [74].
Protocol: Gel-Based Assay for Intracellular Selectivity
Purpose: To validate that a thiol-reactive small-molecule probe selectively binds to its intended low-molecular-weight target (e.g., glutathione) over protein thiols within the complex cellular environment.
Materials:
- Thiol-reactive probe (e.g., RealThiol)
- Cell culture
- Trichloroacetic Acid (TCA)
- Gel Permeation Chromatography (GPC) system with fluorescence detection
Procedure:
- Treat live cells with the probe under standard staining conditions.
- Lyse the cells directly in Trichloroacetic Acid (TCA) to precipitate proteins and "freeze" the binding state of the probe.
- Separate the lysate using Gel Permeation Chromatography (GPC). This will resolve high-molecular-weight (protein-bound) fractions from low-molecular-weight (e.g., GSH-bound) fractions.
- Monitor the fluorescence signal of the eluent to determine which fraction contains the majority of the reacted probe.
- Data Analysis: If the probe is selective for GSH, >90% of the fluorescence should elute in the low-molecular-weight fraction. This protocol provides definitive evidence of intracellular selectivity, which is difficult to obtain with other methods [74].
Protocol: Electrochemical Sensor Characterization
Purpose: To properly characterize an electrochemical sensor using redox probes while avoiding common misinterpretations related to surface area and charge transfer resistance.
Materials:
- Fabricated electrochemical sensor
- Redox probe solutions (e.g., 1-5 mM [Ru(NH₃)₆]Cl₃ or K₃[Fe(CN)₆] in supporting electrolyte)
- Potentiostat/Galvanostat
- Electrochemical cell
Procedure:
- Cyclic Voltammetry (CV) for Kinetics:
- Record CVs of the sensor in both [Ru(NH₃)₆]³⁺/²⁺ and [Fe(CN)₆]³⁻/⁴⁻ solutions at multiple scan rates.
- Compare the peak separation (ΔEp). A larger ΔEp for [Fe(CN)₆]³⁻/⁴⁻ on carbon electrodes indicates quasi-reversible kinetics, which is a property of the probe and should not be automatically interpreted as a "flaw" in the sensor [75].
- Electrochemical Impedance Spectroscopy (EIS) for Rct:
- Perform EIS in a redox probe solution to obtain the charge transfer resistance (Rct).
- Critical Interpretation: Recognize that Rct is inversely proportional to the electrode area. A lower Rct on a larger electrode does not necessarily mean a faster electron transfer rate constant [75].
- Area Estimation:
- Use chronoamperometry with the Cottrell equation or CV with the Randles–Ševčík equation to estimate the geometric area. This is only reliable for flat, planar electrodes and will underestimate the true ECSA for rough or nanostructured surfaces [75].
Visualization of Redox Signaling and Probe Mechanisms
The following diagrams illustrate the core concepts of redox signaling and the operational mechanisms of different probe classes, highlighting potential points of artifact generation.
Cellular Redox Signaling Pathway - This diagram outlines the fundamental pathway from ROS generation to biological outcomes, showing the dual nature of ROS as signaling molecules and agents of damage.
Common Probe Artifact Mechanisms - This workflow visualizes how artifacts arise from non-specific oxidation of small-molecule probes and the miscalculation of electrode surface area.
The Scientist's Toolkit: Key Research Reagents
Table 2: Essential Reagents for Redox Biology Research
| Reagent / Kit Name | Primary Target | Key Features & Common Artifacts |
|---|---|---|
| H₂DCFDA / DCFH | Broad ROS | General oxidative stress indicator. Major Artifact: Highly non-specific; cross-reacts with numerous ROS, RNS, and cellular oxidants. Signal reflects general redox state, not a specific species [74] [9]. |
| MitoSOX Red | Mitochondrial O₂•⁻ | Cell-permeant, cationic, targeted to mitochondria. Artifact: Can be excited at 396 nm (specific) or ~510 nm (can excite non-specific oxidation products); use of 396 nm is recommended for selective detection [9]. |
| Boronate-based Probes | H₂O₂ | Multiple variants available (e.g., Peroxyfluor-6). Artifact: Reacts extremely rapidly with peroxynitrite (ONOO⁻), which can dominate the signal in systems where ONOO⁻ is present [74]. |
| CellROX Reagents | Broad ROS | Cell-permeant, fluorogenic upon oxidation. Available in multiple colors (Green, Orange, Deep Red) for multiplexing. Note: Varying fixability and detergent resistance between dyes [9]. |
| roGFP-based Probes | Glutathione redox potential (roGFP-Grx1) or H₂O₂ (roGFP-Orp1) | Genetically encoded, rationetric, and reversible. Allows subcellular targeting. Limitation: Response can be slow relative to physiological changes; requires genetic manipulation [77] [9]. |
| Image-iT Lipid Peroxidation Kit | Lipid Peroxidation | Ratiometric probe (BODIPY 581/591 C11) shifts fluorescence from red to green upon oxidation. Application: Live-cell compatible, suitable for imaging and flow cytometry [9]. |
| ThiolTracker Violet | Glutathione (GSH) | Violet-excitable dye for detecting reduced glutathione. Application: Can be used in fixed cells and is antibody-multiplexable, allowing for co-localization studies [9]. |
| [Fe(CN)₆]³⁻/⁴⁻ & [Ru(NH₃)₆]³⁺/²⁺ | Electrochemical Sensor Characterization | Common redox probes for CV and EIS. Major Artifacts: [Fe(CN)₆]³⁻/⁴⁻ is surface-sensitive and can give quasi-reversible kinetics on carbon. Both can adsorb to polymer matrices, interfering with protein detection in MIP sensors [75] [76]. |
The Critical Importance of Probe Specificity and Kinetic Validation
Accurate measurement of oxidative stress in vivo is paramount for understanding its role in aging, cancer, neurodegenerative diseases, and other pathologies characterized by redox imbalance. The central thesis of this work posits that without rigorous probe specificity and kinetic validation, experimental data on reactive oxygen species (ROS) can be misleading, ultimately hindering diagnostic and therapeutic development. The redox state is defined as the balance between oxidized and reduced forms of redox couples in biological objects; disruption of this balance leads to impaired redox signaling and oxidative stress [16]. This article provides detailed application notes and protocols to empower researchers in the field of redox biology and drug development to overcome two principal challenges: achieving precise sub-cellular localization of measurements and obtaining accurate, kinetically validated data in complex living systems.
Application Notes: Advancing In Vivo Redox Sensing
Achieving Sub-Cellular Specificity with Targeted Redox Probes
A significant advancement in the field involves engineering probes that localize to specific cellular compartments, as the biological consequences of ROS production are highly dependent on their site of generation [53].
Multi-Spin Redox Sensor (RS) for Enhanced Circulation and Contrast: We have developed and characterized a novel multi-spin redox sensor (RS) composed of a quantum dot (QD) core functionalized with a cyclodextrin shell. This structure is conjugated with multiple nitroxide radicals (TEMPO) and one to two triphenylphosphonium (TTP) groups to facilitate intracellular delivery, particularly to mitochondria [16]. This design offers distinct advantages over conventional spin probes like mito-TEMPO (mito-T), which contains only a single TEMPO radical and one TTP group. When normalized to the concentration of nitroxide residues, the RS probe demonstrates a significantly longer circulation time in the bloodstream compared to mito-T, enhancing its utility for in vivo imaging. While both probes exhibit identical EPR contrast, the RS provides a higher T1-weighted MRI contrast, making it a superior candidate for multi-modal imaging applications [16].
Dual-Probe Strategy for Discriminating Sites of ROS Production: To address the critical need for identifying the sub-cellular origin of ROS, we have validated a protocol using dual nitroxide sensors. This strategy employs mitoTEMPO to probe the mitochondrial compartment and 3-Carbamoyl-proxyl (3CP) to monitor the intracellular/extracellular space [53]. Proof-of-concept studies on 4T1 breast tumor models, both in vitro and in vivo, have demonstrated the protocol's efficacy. Treatment with Antimycin A (an inhibitor of mitochondrial complex III) specifically increased the decay rate of mitoTEMPO, whereas treatment with L-Buthionine Sulfoximine (L-BSO, a glutathione synthesis inhibitor) increased the decay rate of 3CP. This clear discrimination confirms the protocol's ability to noninvasively pinpoint the site of ROS production in vivo [53].
The Critical Need for Kinetic Validation in Complex Environments
The translation of redox probes from controlled in vitro systems to complex in vivo environments introduces numerous variables that can alter probe kinetics and generate misleading results.
Understanding the Nitroxide-Hydroxylamine Redox Cycle: Cyclic nitroxides, such as TEMPO derivatives, are attractive redox-sensitive probes due to their stability and detectability by EPR and MRI. Their utility stems from a redox cycle involving three forms: the paramagnetic nitroxide radical, the diamagnetic hydroxylamine (reduced form), and the oxoammonium cation (oxidized form) [16]. In vivo, the nitroxide radical and hydroxylamine are the dominant species. The EPR signal intensity is directly governed by the local redox environment: rapid signal decay indicates a highly reducing capacity, while slow decay or signal persistence suggests high oxidative capacity, often linked to superoxide overproduction [16]. Interpreting EPR data requires an understanding of whether signal loss is due to chemical reduction or physical washout.
Validation Using Ferricyanide Re-oxidation: A key methodological step for kinetic validation is the chemical re-oxidation of hydroxylamines back to the EPR-detectable nitroxide form. As per the protocol by Hyodo et al., treating tissue homogenates or blood samples with potassium ferricyanide (2 mM) quantitatively converts the hydroxylamine back to the nitroxide radical [16]. This step allows researchers to distinguish between the proportion of the probe that has been chemically reduced in vivo and the total amount of probe present. This is crucial for accurate quantification of the redox state and for confirming that signal loss is not an artifact of probe clearance or distribution.
Challenges in Electrochemical Sensor Characterization: Beyond EPR probes, similar principles of validation apply to electrochemical sensors. Common redox probes like [Fe(CN)6]3−/4− and [Ru(NH3)6]3+/2+ are frequently used to characterize electrode performance. However, it is a common error to directly equate changes in charge transfer resistance (Rct) with improved electron transfer rate, as Rct is highly dependent on working electrode area. A decrease in Rct may simply reflect a larger electrode surface rather than enhanced kinetic properties [75]. These considerations highlight a universal theme: meticulous validation of the measured signal is essential for correct biological interpretation.
Table 1: Key Characteristics of Featured Redox Probes
| Probe Name | Chemical Structure | Target Specificity | Key Pharmacokinetic Finding | Validation Method |
|---|---|---|---|---|
| Multi-Spin Redox Sensor (RS) | QD core with cyclodextrin shell, multiple TEMPO, 1-2 TTP groups [16] | Intracellular (Mitochondria) | Longer bloodstream circulation vs. mito-T [16] | EPR signal analysis pre/post ferricyanide treatment [16] |
| mito-TEMPO (mito-T) | Single TEMPO radical conjugated to one TTP group [16] | Mitochondria | Standard pharmacokinetic profile | EPR signal analysis pre/post ferricyanide treatment [16] |
| 3-Carbamoyl-proxyl (3CP) | Cyclic nitroxide radical [53] | Intracellular/Extracellular Compartment | N/A | Selective decay rate increase with cytosolic ROS induction (L-BSO) [53] |
Table 2: Summary of In Vivo EPR Findings from Dual-Probe Experiments
| Experimental Condition | Observed Effect on mitoTEMPO Decay (Mitochondrial ROS) | Observed Effect on 3CP Decay (Cytosolic/Global ROS) | Biological Interpretation |
|---|---|---|---|
| L-BSO Treatment (GSH depletion) | No significant change [53] | Significant increase in decay rate [53] | ROS production is primarily elevated in the cytosolic compartment. |
| Antimycin A Treatment (ETC inhibition) | Significant increase in decay rate [53] | No significant change [53] | ROS production is specifically elevated in the mitochondria. |
| Control (No treatment) | Baseline decay rate | Baseline decay rate | Homeostatic redox balance is maintained. |
Detailed Experimental Protocols
Protocol: In Vivo Discrimination of Mitochondrial vs. Global ROS Using EPR
Principle: This protocol utilizes the differential localization and kinetic behavior of mitoTEMPO and 3CP to discriminate the site of ROS production in live animal tumor models [53].
Materials:
- Nitroxide Probes: mitoTEMPO and 3-Carbamoyl-proxyl (3CP).
- Animal Model: Mice bearing 4T1 breast tumors (or other relevant models).
- Modulators: L-Buthionine Sulfoximine (L-BSO, 10 mM in saline), Antimycin A (appropriate vehicle).
- EPR Spectrometer: 1 GHz for in vivo measurements; 9 GHz for in vitro and ex vivo analysis.
- Chemical Reagent: Potassium ferricyanide (K~3~[Fe(CN)~6~]), 100 mM stock in PBS.
Procedure:
- Animal Preparation: Anesthetize tumor-bearing mice using 1.5% isoflurane. Maintain body temperature at 36±1°C.
- Probe Administration: Administer a single intravenous injection of the nitroxide probe (mitoTEMPO or 3CP, 10 µmol per mouse) via a cannulated tail vein.
- ROS Modulation:
- For cytosolic ROS induction, treat animals with L-BSO (intraperitoneal injection) 1-2 days prior to EPR measurement.
- For mitochondrial ROS induction, treat animals with Antimycin A (intravenous injection) shortly before or concurrently with the nitroxide probe.
- In Vivo EPR Measurement: Place the animal in the EPR resonator and acquire sequential EPR spectra over a period of 60-120 minutes. The typical settings for a 1 GHz in vivo spectrometer include: microwave power 2.0 mW, modulation amplitude 0.063 mT, and time constant 0.01 s.
- Ex Vivo Validation: a. Euthanize the animal post-measurement and excise the tumor and other organs of interest. b. Prepare tissue homogenates in cold PBS (pH 7.4) using an electric homogenizer. Adjust all homogenates to an equal protein concentration. c. Divide each homogenate sample into two aliquots. d. To one aliquot, add potassium ferricyanide to a final concentration of 2 mM and incubate for 15 minutes. This converts any hydroxylamine back to the nitroxide. e. Measure the EPR signal intensity of both treated and untreated homogenate aliquots.
- Data Analysis: Calculate the decay rate of the nitroxide signal in vivo. Compare the relative decay rates between experimental and control groups. The percentage of probe reduced in vivo can be calculated as:
(1 - (Signal~untreated~ / Signal~ferricyanide-treated~)) * 100%.
Protocol: Pharmacokinetics and Tissue Distribution of Redox Probes
Principle: This protocol assesses the circulation time, tissue distribution, and reduction profile of novel redox probes in mice [16].
Materials:
- Redox Probe: Multi-spin redox sensor (RS) or control probe (e.g., mito-TEMPO).
- Animals: C57Bl/6 mice (6-8 weeks old).
- Equipment: X-band EPR spectrometer, glass capillaries, electric homogenizer.
Procedure:
- Probe Administration: Anesthetize mice and inject the redox probe intravenously (10 µmol per mouse).
- Blood Kinetics: Collect blood samples (~250 µl) from the tail vein at 15, 30, 60, and 120 minutes post-injection. Immediately transfer each sample to a glass capillary for EPR analysis.
- Tissue Distribution: Two hours post-injection, euthanize the mice. Isolate organs (e.g., brain, liver, lung, kidney, skeletal muscle), wash with cold PBS, and prepare homogenates.
- EPR Analysis of Tissues: Measure the EPR signal of each tissue homogenate before and after ferricyanide treatment, as described in Protocol 4.1.
- Data Analysis: Plot the nitroxide signal intensity in blood over time to determine pharmacokinetic half-life. Compare the final EPR signal (and the percentage of reduced probe) across different organs to assess tissue-specific redox states.
Visual Workflows and Pathways
Diagram 1: In Vivo Redox Probing Workflow
Diagram 2: Nitroxide Redox Cycle & EPR Detection
The Scientist's Toolkit: Essential Research Reagents
Table 3: Key Reagents for Redox Probing Experiments
| Reagent / Material | Function / Role | Example & Notes |
|---|---|---|
| Targeted Nitroxide Probes | Serve as the primary redox sensor, localized to specific cellular compartments. | mito-TEMPO: Targets mitochondria via TTP [16] [53]. Multi-Spin RS: Nanoparticle-based probe for enhanced circulation and contrast [16]. 3-Carbamoyl-proxyl (3CP): Reports on intracellular/extracellular redox state [53]. |
| ROS Modulators | Tools to experimentally induce or inhibit ROS production in specific locations. | Antimycin A: Induces mitochondrial ROS by inhibiting Complex III [53]. L-Buthionine Sulfoximine (L-BSO): Induces cytosolic oxidative stress by inhibiting glutathione synthesis [53]. |
| Chemical Re-oxidant | A critical validation reagent to distinguish chemical reduction from physical probe loss. | Potassium Ferricyanide (K~3~[Fe(CN)~6~]): Used at 2 mM concentration to convert hydroxylamines back to nitroxides for quantitative EPR analysis [16]. |
| EPR Spectrometer | The primary instrument for non-invasive, direct detection of paramagnetic nitroxide radicals. | Required frequencies: 1 GHz for in vivo studies on live animals; 9 GHz (X-band) for in vitro studies and analysis of ex vivo samples (blood, tissue homogenates) [16] [53]. |
| Model Systems | Biologically relevant contexts for validating probe specificity and kinetics. | 4T1 Breast Tumor Model (in mice): Used for proof-of-concept in vivo studies [53]. C57Bl/6 Mice: Standard animal model for pharmacokinetic and tissue distribution studies [16]. |
Challenges of Compartment-Specific Delivery and Signal Calibration
Within the framework of research on redox probes for in vivo oxidative stress measurement, a central challenge is the accurate quantification of reactive oxygen species (ROS) within specific biological compartments. ROS, such as superoxide (O₂•⁻) and hydrogen peroxide (H₂O₂), are not uniformly distributed; their generation and function are highly regulated within signaling microdomains [8] [78]. Consequently, the physiological and pathological outcomes of ROS are exquisitely dependent on their subcellular location. This application note details the primary challenges associated with achieving compartment-specific delivery of redox probes and calibrating the resulting signals, providing structured data and detailed protocols to aid researchers in navigating these complexities.
The Core Challenges in Compartment-Specific Redox Sensing
Challenge 1: Achieving Compartment-Specific Delivery and Activity
The fundamental obstacle in compartment-specific redox sensing is the disparity between systemic administration and localized measurement. The spatiotemporal regulation of ROS generation by sources like mitochondria and NADPH oxidase (NOX) enzymes is crucial for their signaling functions [8]. However, systemically administered probes or antioxidants often fail to reach the intended subcellular compartment at effective concentrations, leading to inaccurate readings and off-target effects [79] [80].
This problem is compounded by the physical barriers of organelles and the chemical environment of different compartments (e.g., varying pH), which can alter probe reactivity and signal output. Furthermore, many current probes lack intrinsic targeting motifs, resulting in a diffuse cellular distribution that averages signals from multiple compartments and obscures localized ROS fluctuations.
Challenge 2: Signal Calibration and Quantitative Interpretation
Accurately calibrating signals from redox probes is fraught with difficulties. The evanescent nature and short half-life of most ROS make them poor candidates for direct quantification in complex biological systems [78]. Instead, researchers often rely on measuring stable by-products or using chemical probes that react with ROS to generate a detectable signal.
However, several factors confound calibration:
- Probe Reactivity and Specificity: Many probes lack absolute specificity for a single ROS and can be oxidized by multiple species, necessitating careful control experiments with specific scavengers like superoxide dismutase (SOD) or catalase [8].
- Artifacts during Sample Preparation: The measurement of oxidative biomarkers, such as 8-oxo-7,8-dihydroguanine in DNA or lipid peroxidation products, is highly susceptible to ex vivo oxidation artifacts during sample processing, which can grossly overestimate true in vivo levels [81].
- Functional vs. Silent Modifications: A critical consideration is that many oxidative modifications are "functionally silent." The most valuable biomarkers and signals are those linked to a functional consequence, such as the S-sulfenylation of protein tyrosine phosphatase 1B (PTP1B) that inhibits its activity and amplifies growth-factor signaling [8] [78].
Table 1: Key Characteristics and Challenges of Common ROS Detection Methods
| Method / Probe | Target ROS | Key Advantages | Primary Calibration/Interpretation Challenges |
|---|---|---|---|
| DMPO (EPR Spin Trap) | O₂•⁻, •OH | Direct detection of radical adducts; applicable in various cell types. | Short half-life of adducts (~45 s); susceptibility to reductive degradation; slow reaction rate [8]. |
| CPH/CMH (Cyclic Hydroxylamines) | O₂•⁻ | Fast reaction rate; stable radical product formation. | Can be oxidized by multiple ROS; requires scavenger controls; reaction rate still slower than spontaneous O₂•⁻ dismutation [8]. |
| APEX2 Proximity Labeling | H₂O₂ (as a catalyst) | Enables snapshots of proteome with high spatial (<20 nm) and temporal (seconds) resolution in living cells [82]. | Requires genetic engineering; efficiency depends on H₂O₂ and biotin-phenol delivery; data analysis is complex. |
| Isoprostanes (F2-IsoPs) | Lipid peroxidation | Stable biomarker; quantifiable in plasma and urine; independent of renal/hepatic function [78]. | Gold-standard GC/MS is cumbersome; commercial immunoassays can have variable performance and poor correlation with MS [78]. |
| Electrochemical Sensors | H₂O₂, other redox-active species | Miniaturization, portability, and real-time sensing potential [75]. | Signal depends on electrode area and material; [Fe(CN)₆]³⁻/⁴⁻ is surface-sensitive and behaves quasi-reversibly, complicating area estimation [75]. |
Experimental Protocols
Protocol 1: Compartment-Specific Proteomic Mapping Using APEX2 Proximity Labeling
This protocol outlines a method for capturing the proteomic landscape of a specific cell type and subcellular compartment in the mouse brain, enabling the study of localization and oxidative stress responses [82].
1. Principle: A genetically targeted, engineered peroxidase (APEX2) is directed to a subcellular compartment (e.g., nucleus, cytosol, membrane). Upon addition of the substrate biotin-phenol (BP) and H₂O₂, APEX2 catalyzes the generation of biotin-phenoxyl radicals that covalently tag nearby endogenous proteins within seconds, enabling their isolation and identification.
2. Reagents and Materials:
- Animals: Transgenic mice (e.g., Drd1-Cre for striatal neurons).
- Viral Vectors: Cre-dependent AAVs encoding APEX2 fused to a localization signal (e.g., H2B for nucleus, NES for cytosol, LCK for membrane) and a P2A-EGFP reporter.
- Key Reagents: Biotin-phenol (BP), Hydrogen peroxide (H₂O₂), "Quenching Solution" (containing Trolox, sodium ascorbate, and sodium azide), Streptavidin-conjugated beads.
- Buffers: Artificial Cerebrospinal Fluid (ACSF), RIPA Lysis Buffer.
3. Procedure:
- Stereotactic Injection: Inject the Cre-dependent APEX2 AAV into the target brain region (e.g., striatum) of neonatal or adult mice. Allow 4-6 weeks for viral expression.
- Acute Slice Preparation and Biotinylation:
- Prepare 250 µm acute brain slices in ice-cold, carbogenated (95% O₂/5% CO₂) ACSF.
- Incubate slices in ACSF supplemented with 500 µM BP for 60 minutes to allow substrate penetration.
- Induce biotinylation by transferring slices to ACSF with 0.03% H₂O₂ for 60 seconds.
- Immediately quench the reaction by immersing slices in the "Quenching Solution".
- Tissue Dissection and Protein Processing:
- Dissect the EGFP-positive region under a fluorescence microscope.
- Homogenize the tissue in RIPA lysis buffer.
- Isulate biotinylated proteins using streptavidin-coated beads.
- Proteomic Analysis:
- On-bead tryptic digestion of captured proteins.
- Analyze resulting peptides by liquid chromatography-tandem mass spectrometry (LC-MS/MS).
- Identify and quantify proteins using standard bioinformatic pipelines.
4. Critical Notes:
- APEX2 expression and activity must be validated by immunohistochemistry and western blotting before proteomic analysis.
- The concentration of H₂O₂ and the labeling time are critical to minimize cellular damage while ensuring efficient labeling.
- Always include control samples from animals not expressing APEX2 or not treated with H₂O₂ to account for non-specific biotin binding.
Protocol 2: Evaluating Redox Probes for Electrochemical Sensor Characterization
This protocol provides guidelines for characterizing the electrochemical performance of sensors, a critical step for ensuring reliable quantification of redox-active species, while avoiding common pitfalls [75].
1. Principle: The redox probes [Ru(NH₃)₆]³⁺/²⁺ and [Fe(CN)₆]³⁻/⁴⁻ are used in cyclic voltammetry (CV) and electrochemical impedance spectroscopy (EIS) to assess the electron transfer kinetics and apparent electrode area of a sensor.
2. Reagents and Materials:
- Redox Probes: Hexaammineruthenium(III) chloride (
[Ru(NH₃)₆]³⁺) and Potassium ferricyanide ([Fe(CN)₆]³⁻). - Supporting Electrolyte: High-purity KCl.
- Equipment: Potentiostat, Three-electrode system (working electrode, counter electrode, reference electrode).
3. Procedure:
- Solution Preparation: Prepare solutions of the redox probe (e.g., 1-5 mM) in a supporting electrolyte (e.g., 0.1 M KCl). Use ASTM Type I ultrapure water.
- Cyclic Voltammetry (CV) for Kinetics:
- Record CV scans for both
[Ru(NH₃)₆]³⁺and[Fe(CN)₆]³⁻at multiple scan rates (e.g., 10-500 mV/s). - Analyze the peak separation (ΔEp). A larger ΔEp indicates slower electron transfer kinetics.
- Key Interpretation:
[Ru(NH₃)₆]³⁺behaves as a near-ideal outer-sphere probe and is better for evaluating intrinsic electron transfer rates.[Fe(CN)₆]³⁻is surface-sensitive and its quasi-reversible behavior should not be automatically interpreted as a sensor flaw [75].
- Record CV scans for both
- Electrode Area Estimation:
- Use chronoamperometry or the Randles–Ševčík equation with CV data.
- Key Interpretation: These methods estimate a geometric area for flat electrodes but are inadequate for determining the electrochemically active surface area ("real area") of rough or nanostructured electrodes, as they cannot detect roughness much smaller than the diffusion layer (~100 µm) [75].
- Electrochemical Impedance Spectroscopy (EIS):
- Perform EIS in the presence of the redox probe at its formal potential.
- Fit the Nyquist plot to a Randles circuit to extract the charge transfer resistance (Rct).
- Key Interpretation: Rct is inversely proportional to electrode area. A decrease in Rct with a larger electrode area should not be misinterpreted as an "improved" electron transfer rate [75].
4. Critical Notes:
- Do not use
[Fe(CN)₆]³⁻/⁴⁻as the sole probe for sensor characterization due to its surface-sensitive nature. - Understand that increasing electrode roughness does not always enhance sensitivity, especially for outer-sphere electron transfers.
The Scientist's Toolkit: Essential Research Reagents
Table 2: Key Research Reagent Solutions for Compartment-Specific Redox Biology
| Reagent / Tool | Function / Application | Key Considerations |
|---|---|---|
| APEX2 (Engineered Peroxidase) | Genetically encoded tool for proximity-dependent biotinylation of proteins in live cells. Enables mapping of subcellular proteomes with high spatiotemporal resolution [82]. | Requires viral transduction or stable transfection; labeling efficiency depends on substrate (biotin-phenol) and H₂O₂ delivery. |
| DMPO (Spin Trap) | Forms stable adducts with short-lived radicals (e.g., O₂•⁻) for detection by Electron Paramagnetic Resonance (EPR) spectroscopy [8]. | Adducts have a short half-life (~45 s) and can undergo reductive degradation, leading to potential false negatives. |
| CPH/CMH (Cyclic Hydroxylamines) | EPR probes for superoxide detection with faster reaction rates and more stable nitroxide products compared to DMPO [8]. | Lack absolute specificity; can be oxidized by other ROS and is prone to auto-oxidation. Scavenger controls are essential. |
| F2-Isoprostanes | Stable gold-standard biomarker of lipid peroxidation in vivo; measurable in plasma and urine by GC/MS or LC/MS [78] [81]. | Commercial ELISA kits may lack specificity and correlate poorly with MS-based methods. |
[Ru(NH₃)₆]³⁺/²⁺ Redox Probe |
Near-ideal outer-sphere redox probe for characterizing heterogeneous electron transfer kinetics on electrochemical sensors [75]. | More expensive than [Fe(CN)₆]³⁻/⁴⁻ but provides a more reliable assessment of electron transfer rates. |
Visualizing the Experimental Workflow
The following diagram illustrates the integrated workflow for addressing compartment-specific delivery and signal calibration challenges, from probe design to data validation.
Integrated Workflow for Redox Probe Research
Successfully navigating the challenges of compartment-specific delivery and signal calibration is paramount for advancing our understanding of redox biology. The integration of innovative tools like APEX2 proximity labeling for spatial proteomics with rigorous electrochemical characterization and the critical use of well-validated biomarkers provides a powerful, multi-faceted approach. By adhering to detailed protocols, understanding the limitations of each method, and implementing robust calibration and control strategies, researchers can generate more reliable and physiologically relevant data on oxidative stress, ultimately accelerating therapeutic development in this complex field.
Best Practices for Data Interpretation and Avoiding False Positives
In the field of in vivo oxidative stress measurement research, accurate data interpretation is paramount. The transient nature of reactive oxygen species (ROS), their compartmentalized production, and low steady-state concentrations make this field particularly susceptible to false positives (incorrectly concluding an effect exists) and false negatives (overlooking a real effect) [15]. These errors can misdirect therapeutic development and invalidate research conclusions. Adhering to rigorous statistical and experimental practices is essential to mitigate these risks and ensure the reliability of findings related to redox probes and hypoxia.
Foundational Statistical Concepts and Error Types
Understanding the types of errors is the first step toward preventing them.
- False Positives (Type I Errors): Occur when analysis indicates a significant difference or effect, such as a change in ROS levels, when one does not actually exist. This is often influenced by factors like small sample sizes, multiple comparisons, and p-hacking [83].
- False Negatives (Type II Errors): Occur when a real effect, like a true redox imbalance, is missed because the study lacks the power to detect it. This is frequently due to high variability, tiny effect sizes, or inadequate sample sizes [83].
The relationship between these errors and statistical power is critical. Power is the probability that a test will correctly reject a false null hypothesis. An underpowered study is susceptible to both Type I and Type II errors [83].
Statistical Best Practices to Minimize Errors
Conducting A Priori Power Analysis
Power analysis is a critical planning tool that determines the sample size needed to detect an effect of a given size with a certain degree of confidence [83].
- Purpose: To ensure a study is adequately powered to detect true effects, thereby reducing false negatives, and to provide a statistical justification for the sample size, guarding against false positives from underpowered experiments.
- Key Input Parameters:
- Effect Size: The magnitude of the difference or change you expect to observe. Larger effects are easier to detect.
- Significance Level (α): The probability of rejecting a true null hypothesis (False Positive Rate). Commonly set at 0.05 or 0.01.
- Statistical Power (1-β): The probability of correctly rejecting a false null hypothesis. A benchmark of 80% is commonly used [83].
- Implementation: Use statistical tools like G*Power, R packages (
pwr,BFDA), or integrated platforms like Statsig to perform these calculations before data collection begins [83].
Additional Protective Statistical Practices
Several other research practices can counter the inflation of false-positive rates [84]:
- Formulating Explicit A Priori Hypotheses: Pre-registering study designs and analysis plans prevents the exploration of spurious, post-hoc correlations.
- Including Multiple Internal Replications: Incorporating replication studies within a single research paper substantially diminishes the likelihood that findings are due to chance.
- Prudent Use of Data-Dependent Stopping: While collecting additional data based on interim results can be valid, it requires careful statistical consideration to avoid inflating false-positive rates.
Experimental Design and Redox-Specific Methodologies
The unique challenges of redox biology demand meticulous experimental design to avoid misinterpretation.
Selection and Use of Redox Probes
Choosing the appropriate redox probe is critical, as each has distinct properties and limitations [75].
Table 1: Common Redox Probes and Characterization Considerations
| Redox Probe | Behavior & Specificity | Key Considerations and Common Pitfalls |
|---|---|---|
| [Ru(NH₃)₆]³⁺/²⁺ | Near-ideal outer-sphere redox probe; valuable for assessing electron transfer rates [75]. | High cost can be prohibitive. Its behavior is largely insensitive to electrode surface roughness [75]. |
| [Fe(CN)₆]³⁻/⁴⁻ | Inexpensive; does not behave as an ideal outer-sphere probe and is surface-sensitive, especially on carbon electrodes [75]. | Voltammetric parameters often deviate from ideal reversibility; this should not be automatically interpreted as a sensor flaw. Charge transfer resistance (Rct) is highly dependent on electrode area, not just electron transfer rate [75]. |
| Dihydroethidium (DHE) | Commonly used for detecting superoxide (O₂•⁻) [15]. | The fluorescent product can be ambiguous; specific detection requires HPLC validation. |
| BODIPY-based probes | Used for detecting lipid peroxidation and other ROS [15]. | Specificity and potential artifacts require careful control experiments. |
Accurate Electrochemical Sensor Characterization
Misinterpreting sensor characterization data is a significant source of error.
- Electrochemically Active Surface Area: Avoid using redox probes with cyclic voltammetry or chronoamperometry to estimate the "real" surface area of rough working electrodes, as the diffusion layer thickness (~100 µm) is often much larger than surface roughness features [75].
- Interpreting Charge Transfer Resistance (Rct): A decrease in Rct from Electrochemical Impedance Spectroscopy (EIS) when using
[Fe(CN)₆]^(3−/4−)can simply result from an increased electrode area and should not be misinterpreted as an improved intrinsic electron transfer rate [75].
Controlling for Hypoxia and Artefacts
In in vivo oxidative stress research, the dynamic interplay with hypoxia adds complexity [15].
- Contextualized Measurement: ROS levels and their effects are highly dependent on oxygen availability. Use techniques that can provide oxygen-contextualized measurement (e.g., live biosensors).
- Avoid Reoxygenation Artefacts: Sample collection and preparation can inadvertently introduce oxygen, altering the redox landscape and leading to false conclusions about steady-state conditions [15].
- Probe Specificity and Compartmentalization: Employ probes with known subcellular localization and specificity for particular ROS. Converging evidence from multiple techniques is ideal to confirm findings [15].
The Scientist's Toolkit: Research Reagent Solutions
Table 2: Essential Reagents and Materials for Redox Probing Experiments
| Item / Reagent | Function / Application |
|---|---|
| Hexaammineruthenium(III) chloride ([Ru(NH₃)₆]³⁺) | Outer-sphere redox probe for characterizing electron transfer kinetics on electrode surfaces [75]. |
| Potassium Ferricyanide ([Fe(CN)₆]³⁻) | Low-cost redox probe for general electrochemical characterization; requires careful interpretation due to surface-sensitive behavior [75]. |
| Dihydroethidium (DHE) | Fluorescent chemical probe for superoxide (O₂•⁻) detection in cellular systems [15]. |
| BODIPY-based fluorescent dyes | A class of fluorescent probes used for detecting various ROS, including those involved in lipid peroxidation [15]. |
| NADPH Oxidase (NOX) Inhibitors | Pharmacological tools to inhibit specific enzymatic sources of ROS, helping to delineate the origin of a signal [15]. |
| N-acetylcysteine (NAC) | A thiol-containing antioxidant that supports intracellular antioxidant capacity by modulating glutathione levels; used to test the functional role of ROS [15]. |
| Superoxide Dismutase (SOD) | Enzyme that catalyzes the dismutation of superoxide (O₂•⁻); used as a control to confirm the identity of superoxide-dependent signals [15]. |
Experimental Protocols for Robust Redox Measurement
Protocol 1: Power Analysis and Sample Size Determination for a Redox Study
Objective: To determine the minimum number of biological replicates (e.g., animals, cell culture plates) required to detect a significant difference in ROS levels between a control and a treatment group.
- Define the Primary Outcome Measure: Identify the key quantitative variable (e.g., mean fluorescence intensity from a BODIPY probe, peak current from a redox probe).
- Estimate the Effect Size: Use pilot data, previous literature, or a pre-defined minimum biologically relevant difference (e.g., a 25% increase in ROS).
- Set Significance and Power Levels: Typically, α = 0.05 and Power (1-β) = 0.80.
- Perform the Calculation: Input these values into a statistical software tool (e.g., G*Power) using the appropriate test (e.g., two-independent-samples t-test). The output is the required sample size per group.
- Document and Justify: Record all parameters and the resulting sample size in the study protocol.
Protocol 2: Characterizing an Electrochemical Sensor with Redox Probes
Objective: To properly characterize the performance and active area of a newly fabricated sensor, such as a 3D-printed electrode, while avoiding common misinterpretations [75].
- Sensor Preparation: Clean and prepare the working electrode according to fabrication protocols.
- Solution Preparation: Prepare a solution containing a known concentration (e.g., 5 mM) of
[Ru(NH₃)₆]Cl₃orK₃[Fe(CN)₆]in a supporting electrolyte (e.g., 0.1 M KCl). - Cyclic Voltammetry (CV) Acquisition: Run CV at multiple scan rates (e.g., 10-500 mV/s) in the redox probe solution.
- Data Analysis - Electron Transfer:
- For
[Ru(NH₃)₆]³⁺/²⁺, assess the peak separation (ΔEp) to evaluate electron transfer kinetics. A near-reversible system should have a ΔEp close to 59 mV. - For
[Fe(CN)₆]³⁻/⁴⁻, note that deviations from ideality are common and not necessarily indicative of a flawed sensor [75].
- For
- Data Analysis - Geometric Area Estimation (for planar electrodes only):
- Plot the peak current (ip) against the square root of the scan rate (v^(1/2)).
- Use the Randles-Ševčík equation for a reversible system to estimate the geometric area. Note: This method is invalid for rough electrodes [75].
Visualizing Workflows and Relationships
Redox Exp Workflow
ROS Hypoxia Pathway
Error Control Methods
Guidelines for Probe Storage, Handling, and In Vivo Administration
The fidelity of in vivo oxidative stress measurement is critically dependent on the rigorous storage, handling, and administration of redox-sensitive probes. In the context of redox biology research, where reactive oxygen species (ROS) are not only markers of damage but also key signaling molecules, improper probe management can lead to experimental artifacts, false positives, or underestimated results [41]. Adherence to these guidelines ensures that the data generated accurately reflects the biological reality of redox processes within living systems, thereby supporting the validity of conclusions drawn in thesis research and drug development programs.
The fundamental challenge lies in the reactive nature of the species being measured and the sensitivity of the probes themselves. Probes designed to detect hydrogen peroxide (H~2~O~2~), superoxide (O~2~^•−^), or other ROS must be maintained in a stable state until the moment of application and must be delivered to the correct subcellular location without perturbing the native redox balance [41] [8]. This document provides a standardized framework for researchers and scientists to maintain probe integrity from the storage shelf to the final in vivo readout, with a focus on genetically encoded fluorescent proteins and chemical probes commonly used in redox signaling studies.
Probe Storage Guidelines
Proper storage is the first and most crucial step in preserving the functionality and specificity of redox probes. Storage conditions must be tailored to the specific chemical and physical properties of each probe to prevent degradation, oxidation, or loss of targeting capability.
Table 1: Storage Guidelines for Common Redox Probes and Sensors
| Probe/Sensor Type | Storage Condition | Storage Medium | Key Considerations |
|---|---|---|---|
| Optical DO Sensors (e.g., YSI) [85] | Medium-to-long term | Wet (submerged in water) | Calibration cup should be filled with water and tightened to minimize evaporation. Store instrument upright. |
| Polarographic/Galvanic DO Sensors [85] | Long-term (>30 days) | Dry | Membrane cap should be removed; sensor cleaned, dried, and a new, dry membrane cap installed. |
| pH/ORP Sensors [85] | Medium-to-long term | Wet in pH 4 solution | Store upright in original container. Periodically check solution level to prevent drying. |
| Ion Selective Electrodes (ISEs) [85] | Medium-to-long term | Wet in plain tap water | Do not store in conductivity standard, pH buffer, or saltwater. Upright storage in original container is essential. |
| Genetically Encoded Sensors (e.g., HyPerRed, roGFP2) [86] [87] | Purified protein: -80°C; DNA plasmids: -20°C | Glycerol stocks (protein); TE buffer (plasmids) | Avoid repeated freeze-thaw cycles. For purified proteins, aliquoting is recommended. |
| Small-Molecule Dyes (e.g., MitoSOX Red, DCFH-DA) [45] [88] | Desiccated, -20°C, protected from light | Anhydrous DMSO | Ensure containers are airtight to prevent absorption of moisture. |
General Instrument and Sensor Storage Protocol
The following protocol provides a universal starting point for preparing instrumentation and attached sensors for storage [85]:
- Battery Removal: Remove all batteries from the instrument or handheld unit.
- O-ring Inspection: Check battery compartment O-rings for nicks, dry rot, or pitting. Replace if damaged, applying a small amount of Krytox lubricant.
- Corrosion Check: Inspect the battery compartment for corrosion. Clean any corrosion and assess for damage. If damage is found, seek professional repair before further use.
- Cleaning: Clean the instrument thoroughly according to the manufacturer's manual, ensuring all communication ports and empty sensor ports are capped or plugged.
- Drying: After cleaning, remove the sensors and allow the instrument body to dry completely.
- Final Inspection: Check all connector pins for signs of damage or wear before final storage.
Probe Handling and Reconstitution
Proper handling upon reconstitution or use is essential to maintain probe stability and prevent pre-experimental oxidation or degradation.
Handling of Genetically Encoded Redox Probes
Genetically encoded probes like HyPerRed and roGFP2 offer the advantage of subcellular targeting but require careful handling of DNA plasmids and purified proteins [86] [87].
- Plasmid Transformation and Expression: Follow standard molecular biology protocols for transforming plasmids into appropriate expression hosts (e.g., E. coli). For mammalian cell expression, use high-quality transfection reagents and confirm expression before experimentation.
- Protein Purification and Storage: When working with purified sensors like HyPerRed, keep the protein reduced during extraction by including 2 mM 2-mercaptoethanol in the buffer. Post-purification, remove reducing agents and imidazole via gel filtration. For long-term storage, aliquot the protein and store at -80°C in a buffered solution to prevent freeze-thaw damage [86].
- pH Sensitivity Awareness: Be cognizant that the fluorescence of many protein-based probes, including HyPerRed, is pH-dependent. The pK~a~ of HyPerRed is approximately 8.5, so experiments should be conducted within a physiologically relevant pH range to avoid artifacts [86].
Reconstitution of Small-Molecule Probes
- Solvent Choice: Reconstitute lyophilized dyes in high-quality, anhydrous dimethyl sulfoxide (DMSO) to create a concentrated stock solution [88].
- Aliquoting: Aliquot the stock solution into single-use volumes to minimize freeze-thaw cycles and repeated exposure to oxygen and moisture.
- Protection from Light: Store aliquots in light-proof containers, as most fluorescent dyes are photosensitive.
- Preparation for Administration: Dilute the DMSO stock into an appropriate physiological buffer (e.g., PBS, saline) immediately before use. The final DMSO concentration in vivo should be kept as low as possible (typically <1%) to avoid cellular toxicity.
In Vivo Administration and Experimental Protocols
The administration of probes into living systems requires careful consideration of dosage, route, and validation to ensure specific and meaningful results.
Administration of Chemical Probes and Spin Traps
Protocol: In Vivo EPR Spectroscopy with Nitroxide Probes [51]
This protocol describes the use of nitroxide probes like mitoTEMPO (mitochondria-targeted) and 3-Carbamoyl-Proxyl (3CP, non-targeted) to discriminate the site of ROS production in tumor models in vivo.
- Objective: To noninvasively discriminate between mitochondrial and cytosolic ROS production in a live animal model.
- Probes: mitoTEMPO and 3-Carbamoyl-Proxyl (3CP).
- Modulators: l-Buthionine Sulfoximine (L-BSO) to deplete glutathione (cytosolic oxidative stress) or Antimycin A to inhibit mitochondrial Complex III (mitochondrial oxidative stress).
- Animal Model: 4T1 breast tumor-bearing mice.
Workflow Diagram: In Vivo EPR Redox Sensing
Step-by-Step Procedure:
Redox Modulation:
- Cytosolic ROS Induction Group: Administer L-BSO (e.g., intraperitoneally) daily for 1-2 days to inhibit glutathione synthesis.
- Mitochondrial ROS Induction Group: Administer Antimycin A (e.g., intratumorally or via an appropriate systemic route) to inhibit electron transport chain Complex III.
- Include appropriate vehicle control groups.
Probe Administration:
- Dissolve the nitroxide probe (mitoTEMPO or 3CP) in saline or PBS.
- Inject the probe intravenously into the tail vein of the mouse. A typical dose for mitoTEMPO or 3CP is 100-200 mg/kg [51].
EPR Measurement:
- Anesthetize the animal and position the tumor within the resonator of a low-frequency (e.g., 1 GHz) EPR spectrometer.
- Acquire the EPR signal continuously or at frequent intervals for up to 60 minutes post-injection to monitor the signal decay kinetics.
Data Analysis:
- Plot the normalized EPR signal intensity over time.
- Calculate the relative decay rate of the nitroxide signal. A faster decay rate in a specific treatment group indicates higher local ROS production in the compartment targeted by the probe (mitoTEMPO for mitochondria, 3CP for cytosolic/extracellular space) [51].
Validation:
- Confirm the specific contribution of superoxide by using genetically modified cells that overexpress mitochondrial superoxide dismutase (SOD2).
- Use ferricyanide to re-oxidize hydroxylamines in excised tumors post-mortem to confirm that signal decay is due to redox chemistry and not probe washout [51].
Administration of Genetically Encoded Probes
Protocol: Measuring RBC Redox Status with roGFP2 Transgenic Mice [87]
This protocol utilizes transgenic mice expressing the redox-sensitive green fluorescent protein roGFP2 specifically in red blood cells (RBCs) to monitor thiol redox status in vivo and over the course of RBC aging.
- Objective: To measure the redox potential of erythrocytes in living mice and during aging.
- Model: Transgenic mice expressing roGFP2 under a β-globin promoter.
Workflow Diagram: In Vivo Redox Monitoring with roGFP2
Step-by-Step Procedure:
Animal Model:
- Utilize a stable transgenic mouse line where roGFP2 is expressed in erythroid cells. Confirm that roGFP2 expression does not alter normal RBC indices or survival [87].
In Vivo Aging and Sampling:
- To track redox changes with age, intravenously inject mice with sulfo-NHS-Biotin to label all circulating RBCs in vivo.
- Collect small blood samples (e.g., 5 μL) at various time points (e.g., days 1, 7, 14, 28) post-labeling.
Flow Cytometry Analysis:
- Wash RBCs from collected blood in FACS buffer (PBS, 0.2% BSA, 2 mM EDTA).
- Analyze cells immediately on a flow cytometer equipped with 405 nm and 488 nm lasers.
- Measure the fluorescence emission at approximately 520 nm for both excitation wavelengths.
Data Processing and Calculation:
- Ratioing: For each cell, calculate the ratio (R) of fluorescence intensity from excitation at 405 nm to that at 488 nm.
- Calibration: In parallel, treat an aliquot of RBCs in vitro with 10 mM DTT (full reduction) and 100 μM t-butyl hydroperoxide (full oxidation) to define the minimum and maximum R values [87].
- Fractional Oxidation: Calculate the degree of oxidation (OxD~roGFP2~) using the formula: *OxD~roGFP2~ = (R - R~red~) / (R~ox~ - R~red~) *
- Redox Potential: Calculate the redox potential (E~roGFP2~) in millivolts (mV) using the Nernst equation: E~roGFP2~ = E'~roGFP2~ - (RT/zF) * ln( (1 - OxD~roGFP2~) / OxD~roGFP2~ ) Where E'~roGFP2~ is the midpoint potential of roGFP2 (-280 mV), R is the gas constant, T is temperature, z is 2 (electrons), and F is Faraday's constant [87].
Table 2: Key Parameters for In Vivo Redox Probe Administration
| Probe Type | Example Dosage/Expression | Administration Route | Key Readout |
|---|---|---|---|
| Nitroxides (e.g., 3CP) [51] | 100-200 mg/kg | Intravenous (IV) injection | EPR signal decay rate over time |
| Mitochondria-targeted Nitroxides (e.g., mitoTEMPO) [51] | 100-200 mg/kg | Intravenous (IV) injection | EPR signal decay rate over time |
| roGFP2 (Transgenic) [87] | Stable expression in target cells (e.g., RBCs) | Genetically encoded | Flow cytometry ratio (405 nm/488 nm excitation) |
| MitoSOX Red [45] | 1-5 μM (final in vitro); in vivo dose as optimized | IV or intraperitoneal (IP) injection | Fluorescence shift (ex ~400 nm, em ~590 nm) |
| HyPer Family [86] | Plasmid transfection/transduction; AAV for in vivo | Genetically encoded | Ratiometric fluorescence (500 nm ex for reduced, 420 nm for oxidized) |
The Scientist's Toolkit: Essential Research Reagents
Table 3: Key Research Reagent Solutions for Redox Probe Studies
| Reagent / Material | Function / Application | Key Considerations |
|---|---|---|
| MitoTEMPO [51] | Mitochondria-targeted nitroxide for EPR-based mtROS detection. | Accumulates in mitochondria due to triphenylphosphonium (TPP+) moiety; used as both a sensor and a scavenger. |
| 3-Carbamoyl-PROXYL (3CP) [51] | Hydrophilic nitroxide for global intracellular/extracellular ROS detection via EPR. | Distributes throughout intra- and extracellular compartments; reports on general redox status. |
| roGFP2 [87] | Genetically encoded redox sensor for glutathione redox potential. | Ratiometric; can be targeted to specific organelles; equilibrates with glutathione pool via glutaredoxins. |
| HyPerRed [86] | First red fluorescent genetically encoded sensor for H~2~O~2~. | Ratiometric and reversible; excitation peak at 575 nm, emission at 605 nm; allows multiplexing. |
| Dihydroethidium (Hydroethidine) [45] [8] | Chemical probe for superoxide detection. | Oxidation by O~2~^•−^ yields 2-hydroxyethidium, detectable by HPLC or fluorescence (ex ~400 nm). |
| MitoSOX Red [45] | Mitochondria-targeted derivative of dihydroethidium. | Cationic TPP+ group drives accumulation in mitochondria; more specific for mitochondrial superoxide. |
| L-Buthionine Sulfoximine (L-BSO) [51] | Inhibitor of glutathione synthesis. | Used to induce cytosolic oxidative stress by depleting the major cellular antioxidant, glutathione. |
| Antimycin A [51] | Inhibitor of mitochondrial electron transport chain Complex III. | Used to induce mitochondrial superoxide production. |
| Xanthine/Xanthine Oxidase [45] [51] | Enzymatic superoxide-generating system. | Used for in vitro validation and calibration of superoxide-sensitive probes. |
Quality Control and Data Validation
Robust validation is non-negotiable in redox research due to the potential for artifact and the lack of absolute specificity of many probes.
- Specificity Controls: Always use specific scavengers and inhibitors to validate the signal. For example, the use of superoxide dismutase (SOD) mimetics or catalase can confirm the involvement of superoxide or hydrogen peroxide, respectively [41] [8]. Genetic approaches, such as overexpression of SOD2, provide powerful confirmation for mitochondrial superoxide involvement [51].
- Artifact Avoidance: Be aware that many low-molecular-weight "antioxidants" like N-acetylcysteine (NAC) have pleiotropic effects and are poor scavengers of H~2~O~2~. Their use to implicate a specific ROS should be supported by other, more specific methods [41].
- Calibration and Reversibility: For genetically encoded sensors like roGFP2 and HyPer, demonstrate the reversibility of the signal in situ by applying oxidants (e.g., H~2~O~2~, tBOOH) followed by strong reductants (e.g., DTT) [86] [87]. This confirms the probe is functioning correctly within the biological environment.
- Proper Nomenclature: As emphasized in consensus guidelines, avoid referring to "ROS" as a single entity. Precisely state the specific species implicated (e.g., H~2~O~2~, O~2~^•−^) based on the specificity of the probe and validation controls used [41].
Benchmarking Performance: A Critical Comparison of Redox Probe Technologies
The accurate measurement of oxidative stress in vivo is paramount for understanding its role in a vast spectrum of physiological and pathological processes, including neurodegeneration, cancer, and inflammation. The dynamic and spatially heterogeneous nature of reactive oxygen and nitrogen species (RONS) presents a significant challenge for their quantification in living systems. This application note provides a detailed comparative analysis of the major imaging platforms used in redox biology, evaluating their sensitivity, specificity, and temporal resolution. Framed within the broader context of a thesis on redox probes, this document serves as a practical guide for researchers and drug development professionals in selecting the appropriate methodological platform for their specific experimental needs. We summarize quantitative performance data in structured tables, provide detailed protocols for key experiments, and visualize critical workflows to facilitate the implementation of these advanced techniques.
Platform Performance Comparison
The selection of an imaging platform involves critical trade-offs between key performance metrics. The following table provides a quantitative comparison of the major technologies used for in vivo redox sensing.
Table 1: Comparative Analysis of Redox Imaging Platforms
| Platform | Typical Sensitivity | Spatial Resolution | Temporal Resolution | Key Specificity Mechanisms | Primary Applications |
|---|---|---|---|---|---|
| PET Imaging | pico- to nanomolar [13] | 1-2 mm [13] | Minutes to hours [13] | Probe structural engineering (e.g., [¹⁸F]FEDV for peroxynitrite, [¹⁸F]4FN for NOX2) [13] [89] | Whole-body imaging, longitudinal studies in neurodegeneration & cancer [13] [89] |
| Fluorescence Imaging (roGFP) | High (single-cell) [66] | ~200-300 nm (diffraction-limited) [90] | Seconds [66] | Genetic targeting to subcellular compartments (e.g., mitochondria, cytosol) [66] | Real-time subcellular redox dynamics in live cells [66] |
| Super-Resolution SIM Fluorescence | High [90] | ~100 nm [90] | Seconds to minutes [90] | Small-molecule probes with organelle-targeting units (e.g., TPP for mitochondria) [90] | Nanoscale visualization of organelle structure and function [90] |
| EPR/EPRI | Nanomolar [91] | 0.1-1 mm (EPRI) [92] | Minutes [91] [92] | Spin probe reactivity (e.g., cyclic hydroxylamines for O₂•⁻) [91] | Non-invasive mapping of tumor redox status [92] |
Detailed Experimental Protocols
This protocol details the use of genetically encoded redox-sensitive green fluorescent protein (roGFP) probes for real-time measurement of reactive oxygen species (ROS) in specific subcellular compartments.
3.1.1 Research Reagent Solutions
Table 2: Essential Reagents for roGFP-based Redox Imaging
| Reagent / Solution | Function / Explanation |
|---|---|
| roGFP Adenovirus Vectors (e.g., VQAd CMV mito-roGFP) | Genetically encoded probe for specific subcellular compartments; forms a disulfide bond upon oxidation, altering fluorescence excitation. [66] |
| Modified 0 Ca²⁺ Tyrode's Solution | Used for tissue dissection and slicing to maintain tissue viability and minimize cellular stress. [66] |
| Enzymatic Digestion Solution (Collagenase II, Trypsin, Elastase) | Enzymatic cocktail for gentle tissue dissociation to prepare viable slices for imaging. [66] |
| Culture Medium (DMEM/F-12 with supplements) | Supports health and viability of the carotid body slices during ex vivo culture and experimentation. [66] |
| Recording Solution (HEPES-buffered) | Maintains physiological pH and ion concentrations during the live imaging process. [66] |
| Dithiothreitol (DTT) & Hydrogen Peroxide (H₂O₂) | Used for calibration and establishing the dynamic range (fully reduced vs. fully oxidized state) of the roGFP probe. [66] |
3.1.2 Step-by-Step Workflow
- Preparation of roGFP Probes: Aliquot roGFP-containing adenovirus vectors on ice and store at -80°C. Avoid repeated freeze-thaw cycles to maintain transduction efficiency. [66]
- Carotid Body (CB) Dissection and Slicing:
- Anesthetize the mouse and rapidly dissect the CB.
- Embed the CB in low-melting-point agarose.
- Use a calibrated vibratome to generate 100-150 μm thick slices, maximizing the number of viable cells on the slice surface. [66]
- Viral Transduction: Incubate CB slices with the roGFP adenovirus vector in culture medium for 24-48 hours to allow for probe expression and proper targeting to organelles. [66]
- Microscopy Setup:
- Use an inverted or upright microscope equipped with a high-sensitivity CCD camera and a monochromator for rapid wavelength switching.
- Employ a 60x high-numerical-aperture (NA) water-immersion objective.
- Set up excitation filters for 400 nm and 490 nm (the excitation peaks for oxidized and reduced roGFP, respectively) and an emission band-pass filter around 520/35 nm. [66]
- Ratiometric Imaging and Data Acquisition:
- Place the transduced CB slice in a recording chamber with continuous perfusion of pre-warmed (37°C) recording solution.
- Acquire sequential images at 400 nm and 490 nm excitation.
- Calculate the 400/490 nm excitation ratio for each pixel or region of interest (ROI). This ratio is independent of probe concentration and reflects the redox state.
- For calibration, apply 1-5 mM DTT (reducing agent) followed by 1-5 mM H₂O₂ (oxidizing agent) at the end of the experiment to define the minimum (Rred) and maximum (Rox) ratio values. [66]
- Data Analysis: The degree of oxidation (OxD) can be calculated using the formula: OxD = (R - Rred) / (Rox - Rred), where R is the measured ratio.
This protocol outlines the procedure for using the novel PET tracer [¹⁸F]fluoroedaravone ([¹⁸F]FEDV) to quantify RONS in live animal models of disease.
3.2.1 Research Reagent Solutions
Table 3: Essential Reagents for [¹⁸F]FEDV PET Imaging
| Reagent / Solution | Function / Explanation |
|---|---|
| [[¹⁸F]FEDV Tracer | The positron-emitting radiopharmaceutical derived from edaravone; reacts with a broad spectrum of RONS including peroxynitrite and lipid peroxyl radicals. [89] |
| Precursor (1) (boc-protected diazo trimethylammonium triflate salt) | Essential starting material for the efficient radiosynthesis of [¹⁸F]FEDV. [89] |
| Animal Disease Model (e.g., P301S tauopathy mouse, MCA stroke model) | A physiologically relevant in vivo system for validating tracer uptake in response to pathological oxidative stress. [89] |
| Radioligand Competitor (unlabeled Edaravone) | Used in blocking studies to confirm the specificity of tracer uptake via competition with the native compound. [89] |
3.2.2 Step-by-Step Workflow
- Radiosynthesis of [¹⁸F]FEDV:
- Perform a nucleophilic aromatic substitution on precursor (1) with [¹⁸F]fluoride to produce an intermediate (2).
- Transfer (2) to a new vial containing zinc dust.
- Add ethyl acetoacetate and HCl, and heat to concurrently deprotect and condense the molecule, generating [¹⁸F]FEDV.
- Purify the final product via HPLC to achieve >99% radiochemical purity. The entire process takes approximately 60 minutes with an activity yield of ~12%. [89]
- Animal Preparation: Anesthetize the animal (e.g., a PS19 tauopathy model mouse or a stroke model mouse) and place it on a heated bed to maintain body temperature throughout the imaging session. [89]
- Tracer Injection: Intravenously inject a bolus of [¹⁸F]FEDV (typical activity 3.7-7.4 MBq) via a tail vein or catheter. [89]
- Dynamic PET Acquisition:
- Position the animal in the microPET scanner.
- Initiate a dynamic PET scan concurrently with tracer injection. Acquire data in list mode for 60-90 minutes to capture tracer uptake and retention kinetics.
- For parametric mapping, acquire data in high temporal resolution (e.g., frame sequences: 6x10s, 4x30s, 5x60s, 5x120s, 4x300s). [89]
- Image Reconstruction and Analysis:
- Reconstruct dynamic PET images using an ordered-subset expectation maximization (OSEM) algorithm. Correct for attenuation and scatter.
- Co-register PET images with a corresponding anatomical MRI or CT scan for precise anatomical localization.
- Draw regions of interest (ROIs) over target tissues (e.g., brain regions in a neurodegeneration model) and generate time-activity curves (TACs).
- For enhanced sensitivity, perform parametric mapping to generate voxel-wise maps of tracer retention parameters, such as the standardized uptake value (SUV) or distribution volume. [89]
- Validation: Confirm specificity by pre-injecting unlabeled edaravone in a control group to block specific tracer retention, or by correlating PET signals with ex vivo biomarkers of oxidative damage (e.g., lipid peroxidation, protein carbonylation). [89]
Discussion and Technical Considerations
The choice of platform is dictated by the specific research question. The high specificity and quantitative nature of PET imaging, as demonstrated by tracers like [¹⁸F]FEDV, make it unparalleled for translational research and whole-body assessment of oxidative stress in disease models [13] [89]. However, its limited temporal and spatial resolution restricts the observation of rapid, subcellular events. Conversely, fluorescence-based methods, particularly with genetically encoded probes like roGFP, offer unmatched temporal resolution and subcellular specificity for dissecting real-time redox signaling dynamics within organelles [66]. The emergence of super-resolution techniques like SIM pushes this further, allowing for the nanoscale visualization of organellar structure and function, albeit often with increased technical complexity and potential phototoxicity [90].
A critical challenge across all platforms is achieving absolute specificity for a single RONS due to their similar reactivities and short lifetimes. While probes like [¹⁸F]FEDV are engineered for a broad spectrum (encompassing peroxynitrite and peroxyl radicals) [89], and others like [¹⁸F]FDMT are designed for superoxide specificity [13], careful validation with pharmacological inhibitors and ex vivo biochemical assays remains essential. Furthermore, researchers must consider practical aspects such as cost, infrastructure, and expertise. PET requires a cyclotron, radiochemistry facilities, and expensive scanners, whereas fluorescence microscopy is more accessible but may lack the depth for whole-organ imaging. EPR spectroscopy provides unique information on paramagnetic centers but has lower spatial resolution and requires the administration of exogenous spin probes [91] [92].
The landscape of in vivo redox imaging offers a powerful and diverse toolkit. From the whole-body, translational context provided by PET to the exquisite subcellular detail revealed by super-resolution fluorescence, each platform delivers unique insights. This comparative analysis underscores that there is no single "best" technology; rather, the optimal approach is question-driven. The ongoing development of more specific, sensitive, and stable probes, coupled with advancements in multimodal imaging and computational analysis, promises to further illuminate the intricate roles of oxidative stress in health and disease, ultimately accelerating therapeutic development.
The accurate measurement of reactive oxygen species (ROS) and oxidative stress in vivo is fundamental to understanding their dual roles in redox signaling and disease pathogenesis. The cellular redox state is a dynamic, compartmentalized system where ROS function as critical signaling molecules at physiological levels but cause molecular damage when dysregulated [41] [93]. This technical review examines three principal methodologies—fluorescence spectroscopy, electron paramagnetic resonance (EPR) spectroscopy, and chemiluminescence detection—providing a structured framework for selecting appropriate tools based on specific biological questions in oxidative stress research. Each technique offers distinct advantages and limitations in sensitivity, specificity, spatial resolution, and applicability to living systems [94] [95] [96]. For researchers investigating ROS in drug development and pathological studies, matching the detection method to the experimental context is paramount for generating biologically relevant data. Misapplication of these tools can yield misleading results, particularly given the transient nature, diverse reactivity, and compartmentalized generation of ROS in biological systems [41] [97]. We present a comprehensive comparison of these technologies, detailed experimental protocols, and decision frameworks to guide appropriate method selection for in vivo oxidative stress assessment.
Technology Comparison: Operational Principles and Technical Specifications
The three major techniques for ROS detection operate on fundamentally different physical principles for capturing oxidative events, each with unique implementation requirements and performance characteristics suited to particular experimental scenarios.
Fluorescence spectroscopy utilizes molecular probes that become highly fluorescent upon oxidation by specific ROS, allowing visualization and quantification in cells and tissues [94]. These probes offer high spatial and temporal resolution, enabling real-time monitoring of ROS dynamics in living cells. However, challenges include potential photobleaching, interference from autofluorescence, and varying specificity among different fluorescent probes [94] [98].
Electron paramagnetic resonance (EPR) spectroscopy, also known as electron spin resonance (ESR), directly detects species with unpaired electrons using microwave radiation under a magnetic field [95] [50]. For short-lived radicals, spin traps react with ROS to form more stable adducts with characteristic spectra, while nitroxide probes undergo reversible reduction/oxidation reporting on redox status [50]. EPR provides high specificity for radical identification but typically requires specialized equipment and probe administration for in vivo applications [95].
Chemiluminescence detection measures photon emission from excited-state molecules formed during oxidative reactions, particularly lipid peroxidation [96] [99]. This method offers high sensitivity with low background due to the absence of exciting radiation, but may require enhancers for adequate signal and provides limited molecular specificity without complementary techniques [96].
Table 1: Technical Comparison of Fluorescence, EPR, and Chemiluminescence Detection Methods
| Parameter | Fluorescence Spectroscopy | EPR Spectroscopy | Chemiluminescence Detection |
|---|---|---|---|
| Detection Principle | Light emission from excited fluorophores after ROS-specific oxidation [94] | Microwave absorption by unpaired electrons in paramagnetic species [95] | Photon emission from excited-state molecules formed during oxidative reactions [96] |
| Primary Applications | Intracellular ROS imaging, real-time kinetics, subcellular localization [94] | Free radical identification, redox status mapping, oxidative stress quantification [95] [50] | Lipid peroxidation monitoring, phagocyte activity, antioxidant testing [96] [99] |
| Spatial Resolution | Excellent (subcellular) [94] | Moderate to good (tissue level) [50] | Poor to moderate (whole organism to tissue) [96] |
| Temporal Resolution | Excellent (seconds to minutes) [94] | Moderate (minutes to hours) [50] | Good (minutes) [99] |
| Key Limitations | Photobleaching, autofluorescence, probe specificity issues [94] | Specialized equipment, limited commercial probes, sensitivity constraints at biological frequencies [50] | Low specificity, signal enhancers often required, limited structural information [96] |
Experimental Protocols forIn VivoApplications
Protocol 1: Intracellular Superoxide Mapping with Fluorescence Probes
This protocol describes the use of hydroethidine-based probes for specific detection of superoxide radicals in live cells and tissues, with particular relevance to mitochondrial superoxide generation [41] [94].
Reagents Required:
- Hydroethidine (HE) or Mito-HE (2-5 mM stock in DMSO)
- Hanks' Balanced Salt Solution (HBSS) or appropriate cell culture medium
- Antioxidant controls (e.g., PEG-SOD, Tempol)
- Pro-oxidant controls (e.g., paraquat, antimycin A)
Procedure:
- Cell Preparation: Seed cells in glass-bottom culture dishes or load into fluorescence-compatible cuvettes at 70-80% confluence.
- Probe Loading: Incubate cells with 5-10 µM HE (or Mito-HE for mitochondrial targeting) in serum-free medium for 30-45 minutes at 37°C protected from light.
- Washing: Remove excess probe by washing twice with warm HBSS buffer.
- Experimental Treatment: Apply experimental manipulations (e.g., cytokine stimulation, inhibitor addition) while maintaining appropriate controls.
- Fluorescence Measurement: Monitor fluorescence using appropriate filter sets:
- excitation/emission = 510/595 nm for superoxide-specific oxidation product
- excitation/emission = 480/567 nm for non-specific oxidation products
- Image Acquisition: Capture images using confocal or fluorescence microscopy with constant exposure settings across conditions.
- Data Analysis: Quantify fluorescence intensity per cell or cellular region of interest, normalizing to baseline or control conditions.
Technical Notes: Include specificity controls using SOD mimetics or knockdown approaches. Avoid serum during loading as it contains esterases that may cleave the probe. Calibrate using superoxide-generating systems (xanthine/xanthine oxidase) when quantitative results are required [41] [94].
Protocol 2: Whole-Animal Redox Status Assessment with EPR Spectroscopy
This protocol utilizes nitroxide radicals for non-invasive assessment of systemic redox status in live rodents, applicable to disease models and therapeutic intervention studies [95] [50].
Reagents Required:
- Cyclic nitroxide probes (e.g., 3-carbamoyl-PROXYL, TEMPOL, or cyclic hydroxylamines)
- Phosphate-buffered saline (PBS), sterile
- Anesthesia appropriate for animal model (e.g., isoflurane)
Procedure:
- Probe Preparation: Dissolve nitroxide probe in sterile PBS to 50-100 mM stock solution. Filter sterilize (0.22 µm) if administering to live animals.
- Animal Preparation: Anesthetize animals and place in EPR spectrometer cavity with temperature maintenance.
- Baseline Measurement: Acquire baseline EPR spectrum before probe administration.
- Probe Administration: Inject probe intravenously via tail vein at 50-100 mg/kg (or intraperitoneally if IV access is limited).
- Kinetic Measurement: Acquire sequential EPR spectra using the following parameters:
- Microwave power: 2-20 mW
- Modulation amplitude: 0.5-2 G
- Scan time: 10-60 seconds
- Time constant: 0.03-0.3 seconds
- Data Collection: Continue measurements for 30-90 minutes depending on probe metabolism rate.
- Spectral Analysis: Measure signal intensity of the central line of the nitroxide triplet spectrum.
Technical Notes: Use L-band (1-2 GHz) EPR for deep tissue penetration in whole animals. For redox mapping, administer cyclic hydroxylamines which are oxidized to EPR-detectable nitroxides in the presence of ROS. The rate of signal increase reflects oxidative stress intensity [50].
Protocol 3: Cutaneous Oxidative Stress Monitoring with Chemiluminescence
This protocol describes the detection of UVA-induced oxidative stress in human skin in vivo using chemiluminescence, adaptable for assessing topical antioxidant efficacy [99].
Reagents Required:
- L-012 (8-amino-5-chloro-7-phenylpyrido[3,4-d]pyridazine-1,4(2H,3H)dione) chemiluminescence probe
- Phosphate buffer (50 mM, pH 7.4)
- Topical antioxidants (e.g., vitamin C, vitamin E)
- UVA irradiation source
Procedure:
- Probe Preparation: Prepare 100-500 µM L-012 in phosphate buffer, protected from light.
- Skin Preparation: Mark test areas (2×2 cm) on volar forearm with minimal sun exposure.
- Antioxidant Pretreatment: For intervention studies, apply 50 µL of antioxidant formulation 30 minutes before irradiation.
- UVA Exposure: Irradiate skin with UVA (10-20 J/cm²) at controlled fluence rate.
- Probe Application: Immediately after irradiation, apply 100 µL L-012 solution to skin surface.
- Signal Detection: Place photomultiplier tube (PMT) detector in gentle contact with skin surface and record photon counts:
- Integration time: 1-5 seconds
- Measurement duration: 5-30 minutes post-irradiation
- Data Analysis: Calculate peak intensity and area under the curve for chemiluminescence decay kinetics.
Technical Notes: For stratum corneum contribution assessment, perform tape-stripping before measurements. Use oxygen manipulation (pressure cuff) to differentiate superficial vs. deep oxidative events. Include unexposed skin areas as controls [99].
Decision Framework: Matching Technology to Biological Questions
The appropriate selection of detection methodology depends on the specific research question, required resolution, and biological context. The following diagram illustrates the decision pathway for method selection based on key experimental parameters.
This decision pathway addresses the most common methodological selection criteria, but additional considerations include:
- Temporal Dynamics: Fluorescence methods excel for rapid kinetic measurements (seconds to minutes), while EPR better captures redox state changes over longer periods (minutes to hours) [94] [50].
- Quantitative Accuracy: EPR provides more absolute quantification capabilities, while fluorescence and chemiluminescence typically yield relative values requiring careful calibration [95] [97].
- Multiplexing Potential: Fluorescence allows simultaneous detection of multiple ROS with different probes, while EPR and chemiluminescence typically measure overall oxidative burden [94] [96].
- Model System Compatibility: Each method presents unique challenges for different model organisms, from C. elegans to mammalian systems [93] [50].
Research Reagent Solutions: Essential Tools for Redox Biology
Successful implementation of these detection methodologies requires appropriate selection of molecular probes and ancillary reagents. The following table summarizes key research tools for in vivo oxidative stress assessment.
Table 2: Essential Research Reagents for In Vivo Oxidative Stress Detection
| Reagent Category | Specific Examples | Primary Application | Key Considerations |
|---|---|---|---|
| Fluorescence Probes | Hydroethidine (DHE), MitoSOX Red [94] | Superoxide detection, mitochondrial targeting | Site-specific (mitochondrial) superoxide detection with high specificity |
| Fluorescence Probes | APF, HPF [98] | Hydroxyl radical and peroxynitrite detection | High specificity for highly reactive species, minimal response to H₂O₂ or O₂•⁻ |
| Fluorescence Probes | Amplex UltraRed/Amplex Red [98] | Hydrogen peroxide detection | Requires horseradish peroxidase for reaction with H₂O₂ |
| EPR Spin Traps | DMPO, DEPMPO [95] [50] | Radical trapping for identification | Form characteristic adducts with specific radicals, but limited stability in biological systems |
| EPR Nitroxides | TEMPOL, 3-CP, carboxy-PROXYL [50] | Redox status assessment | Reduction rate reflects reducing capacity of environment |
| EPR Hydroxylamines | CMH, CPH [50] | Oxidative stress detection | Oxidation to nitroxides proportional to ROS production |
| Chemiluminescence Probes | L-012, lucigenin [96] [99] | Superoxide detection in whole animals | Enhanced sensitivity compared to luminal derivatives |
| Chemiluminescence Probes | Luminal, isoluminal [96] | Phagocyte activity, general oxidative stress | Require peroxidase for maximum sensitivity |
| Chemiluminescence Enhancers | Cytochrome c, coumarin derivatives [96] | Signal amplification | Increase quantum yield of light emission |
Advanced Applications and Integrated Approaches
Complementary Techniques for Comprehensive Redox Assessment
Given the limitations of individual methods, combining approaches provides more comprehensive insights into oxidative stress. The following diagram illustrates how these techniques can be integrated with complementary methodologies for robust redox biology studies.
Emerging Trends and Future Directions
The field of in vivo redox detection continues to evolve with several promising developments:
- Genetically Encoded Sensors: Proteins like HyPer enable real-time monitoring of H₂O₂ dynamics in specific cell types with high temporal and spatial resolution [93].
- Multiparametric Assessment: Approaches like OxICAT (isotope-coded affinity tags) allow quantitative assessment of thiol redox status across hundreds of proteins simultaneously, providing systems-level insights [93].
- Hybrid Imaging Systems: Combining EPR with MRI or fluorescence with chemiluminescence leverages complementary strengths for more comprehensive oxidative stress mapping [50].
- Nanoparticle-Based Probes: Engineered nanomaterials offer improved stability, targeting capability, and signal amplification for sensitive in vivo detection [94].
For drug development applications, these advanced approaches enable more precise assessment of compound effects on redox homeostasis, distinguishing between beneficial modulation of redox signaling versus suppression of pathogenic oxidative damage [41] [97].
The selection of appropriate detection methodologies—fluorescence, EPR, or chemiluminescence—for in vivo oxidative stress research requires careful consideration of the specific biological question, required resolution, and model system. Fluorescence techniques offer unparalleled spatial resolution for subcellular ROS dynamics, EPR provides superior specificity for radical identification and redox mapping, while chemiluminescence delivers high sensitivity for overall oxidative burden assessment. A comprehensive understanding of ROS roles in health and disease will increasingly depend on strategic integration of these complementary approaches, coupled with emerging technologies that address current limitations in specificity, quantification, and temporal resolution. By matching the analytical tool to the biological question through the frameworks presented here, researchers can generate more reliable, interpretable data to advance our understanding of redox biology and therapeutic intervention.
Validating Probe Specificity with Genetic and Pharmacological Modulators (e.g., SOD Overexpression, L-BSO, Antimycin A)
Accurately detecting reactive oxygen species (ROS) in vivo is fundamental to understanding their dual roles in redox signaling and oxidative stress in health and disease. A significant challenge in the field is that many commonly used ROS probes lack specificity for particular ROS or for their subcellular sites of production [41]. The precise site of ROS generation is pivotal for the transmission of cellular information and its downstream (patho)physiological consequences [51]. Therefore, relying on data from a single probe without rigorous validation can lead to misleading conclusions. This Application Note outlines a robust framework for validating the specificity of redox probes using orthogonal genetic and pharmacological modulators, providing a protocol to confidently discriminate the subcellular origin of ROS production in complex biological systems, including living animals.
The Validation Strategy: A Dual-Modulator, Dual-Probe Approach
The core principle of this validation strategy is to perturb ROS production in a site-specific manner and to observe the response using compartment-targeted probes. A conclusive interpretation requires that the probe's signal responds specifically to perturbations in its intended compartment and remains unchanged by perturbations in other compartments. The recommended approach employs:
- Pharmacological Modulators: Small molecule inhibitors to selectively induce oxidative stress in specific subcellular locations.
- Genetic Modulators: Engineered overexpression of antioxidant enzymes to selectively scavenge ROS in a specific compartment.
- Compartment-Targeted Probes: A pair of nitroxide-based probes, one mitochondria-targeted and one untargeted, to simultaneously monitor different cellular locales.
The logical relationship and workflow of this integrated strategy are detailed in the diagram below.
Research Reagent Solutions
The following table details the key reagents essential for implementing the described validation protocols.
Table 1: Key Research Reagents for Probe Validation
| Reagent Name | Primary Function / Mechanism | Experimental Role in Validation |
|---|---|---|
| mitoTEMPO [51] | Mitochondria-targeted nitroxide radical scavenger and superoxide dismutase mimetic. | Probe for detecting mitochondrial ROS (mtROS). Its signal decay rate should increase specifically upon mitochondrial oxidative stress. |
| 3-Carbamoyl-PROXYL (3CP) [51] | Hydrophilic, non-targeted nitroxide. | Control probe for detecting ROS in cytosolic/extracellular compartments. Its signal should not be affected by purely mitochondrial perturbations. |
| L-Buthionine Sulfoximine (L-BSO) [51] | Inhibitor of gamma-glutamylcysteine synthetase, blocking glutathione (GSH) synthesis. | Pharmacological modulator to induce cytosolic oxidative stress by depleting the major cytosolic antioxidant, GSH. |
| Antimycin A [51] | Inhibitor of mitochondrial electron transport chain Complex III. | Pharmacological modulator to induce direct production of superoxide within the mitochondria. |
| Superoxide Dismutase 2 (SOD2) [51] | Mitochondrial isoform of superoxide dismutase. | Genetic modulator to selectively scavenge mitochondrial superoxide, used to confirm the contribution of mtROS to probe signal decay. |
Detailed Experimental Protocols
In Vivo Validation Using Pharmacological Modulators
This protocol, adapted from a 2025 study, uses EPR spectroscopy to monitor the decay of nitroxide probes in a live animal tumor model after treatment with site-specific ROS inducers [51].
Workflow:
Procedure:
- Animal Model Preparation: Utilize an appropriate in vivo model, such as a mouse bearing a 4T1 breast tumor allograft.
- Modulator Treatment: Treat animals with a modulator or its control.
- For Cytosolic Stress: Administer L-BSO (e.g., intraperitoneal injection). This inhibits glutathione synthesis, leading to cytosolic oxidative stress 1-2 days post-treatment [51].
- For Mitochondrial Stress: Administer Antimycin A (e.g., intratumoral injection). This inhibits mitochondrial Complex III, causing a rapid increase in mitochondrial superoxide production [51].
- Probe Injection: Inject the nitroxide probes (e.g., mitoTEMPO and 3CP, separately or as a mixture) into the tumor or systemically.
- EPR Measurement: Place the animal in the resonator of a low-frequency (e.g., 1 GHz) EPR spectrometer. Acquire the first EPR spectrum immediately after probe injection.
- Signal Monitoring: Continuously monitor the EPR signal intensity of each nitroxide at regular intervals (e.g., every 1-2 minutes) for a period of 10-20 minutes. The nitroxide signal will decay as it is reduced to its diamagnetic hydroxylamine by cellular reductants and ROS.
- Data Analysis: Calculate the relative decay rate for each probe under different treatment conditions. A specific increase in decay rate indicates higher local ROS production.
Expected Results & Interpretation: Table 2: Expected Probe Responses to Pharmacological Modulation
| Modulator | Target Compartment | Expected mitoTEMPO (Mitochondrial) Signal Decay | Expected 3CP (Cytosolic) Signal Decay | Interpretation of Specificity |
|---|---|---|---|---|
| L-BSO | Cytosol | No significant change [51] | Increased decay rate [51] | Validated: 3CP responds to cytosolic stress; mitoTEMPO is specific to mitochondria. |
| Antimycin A | Mitochondria | Increased decay rate [51] | No significant change [51] | Validated: mitoTEMPO responds to mitochondrial stress; 3CP is not affected by mtROS. |
Specificity Confirmation via Genetic Modulation (SOD2 Overexpression)
This protocol uses genetic engineering to overexpress the mitochondrial antioxidant enzyme SOD2, providing orthogonal confirmation that the observed signal from the mitochondrial probe is due to mitochondrial superoxide.
Workflow:
Procedure:
- Cell Line Generation: Create a stable cell line (e.g., using 4T1 cells) that overexpresses the mitochondrial superoxide dismutase 2 (SOD2). A wild-type (empty vector) cell line should be used as a control [51].
- Cell Treatment: Treat both the SOD2-overexpressing and control cells with a mitochondrial stressor like Antimycin A.
- Probe Incubation: Incubate the cells with the mitochondrial probe mitoTEMPO.
- EPR Measurement: Harvest the cells and transfer the cell suspension to a capillary tube for analysis using a 9 GHz EPR spectrometer. Monitor the decay of the mitoTEMPO EPR signal over time.
- Data Analysis: Compare the signal decay rates of mitoTEMPO between the SOD2-overexpressing cells and the control cells.
Expected Results & Interpretation: Table 3: Expected Outcomes with SOD2 Overexpression
| Experimental Condition | Expected mitoTEMPO Signal Decay | Interpretation |
|---|---|---|
| Control Cells + Antimycin A | High decay rate | Antimycin A generates mtROS, accelerating mitoTEMPO reduction. |
| SOD2-OE Cells + Antimycin A | Attenuated decay rate [51] | Confirmed Specificity: SOD2 scavenges mitochondrial superoxide, protecting mitoTEMPO from ROS-mediated decay. This confirms the signal is mtROS-dependent. |
Data Interpretation and Best Practices
Key Quantitative Metrics from Validation Studies
The following table summarizes quantitative outcomes from a proof-of-concept study, providing a benchmark for expected results [51].
Table 4: Summary of Key Validation Data from Proof-of-Concept Studies
| Experimental Model | Modulator Used | Probe Used | Key Quantitative Outcome | Conclusion |
|---|---|---|---|---|
| In Vivo (4T1 tumors) | L-BSO (Cytosolic) | 3CP | Increased relative decay rate at 1 & 2 days post-treatment [51] | 3CP detects cytosolic glutathione depletion. |
| In Vivo (4T1 tumors) | L-BSO (Cytosolic) | mitoTEMPO | No significant change in decay rate [51] | mitoTEMPO is insensitive to cytosolic stress. |
| In Vivo (4T1 tumors) | Antimycin A (Mitochondrial) | mitoTEMPO | Increased relative decay rate [51] | mitoTEMPO detects mitochondrial stress. |
| In Vivo (4T1 tumors) | Antimycin A (Mitochondrial) | 3CP | No significant change in decay rate [51] | 3CP is insensitive to pure mitochondrial stress. |
| In Vitro (4T1 cells) | Antimycin A | mitoTEMPO | Attenuated decay increase in SOD2-overexpressing cells [51] | Confirms superoxide dependence of mitoTEMPO signal. |
Guidelines for Best Practice
- Use Probes as "Redox Modulators": Recognize that nitroxides like mitoTEMPO and TEMPOL are not simple scavengers but undergo complex redox cycles. They are better described as "redox modulators" whose reduction kinetics report on local redox environment [41].
- Control for Probe Wash-Out: In in vivo experiments, the loss of EPR signal can be due to both chemical reduction and physical wash-out from the tissue. Include ex vivo experiments with oxidizing agents (e.g., potassium ferricyanide) to convert hydroxylamines back to nitroxides and quantify the reduction in signal attributable to wash-out [51].
- Employ Multiple Orthogonal Methods: No single validation method is foolproof. The combined use of two different pharmacological agents (L-BSO and Antimycin A) with a genetic approach (SOD2 overexpression) provides a highly robust and convincing validation of probe specificity [51].
Correlating Probe Signals with Direct Biomarkers of Oxidative Damage (Protein Carbonylation, Lipid Peroxidation)
In the broader context of redox probe research for in vivo oxidative stress measurement, a critical challenge remains: validating that the signals from rapid, live-cell probes accurately reflect the accumulation of irreversible molecular damage. This protocol provides a detailed framework for directly correlating the signals from common fluorescent probes with well-established, chemically specific biomarkers of oxidative damage: protein carbonylation and lipid peroxidation (LPO). The correlation of these dynamic signals with static biomarkers of damage is essential for moving from detecting the mere presence of reactive species to confirming the ensuing functional molecular alterations that underlie disease pathology [8] [100]. This approach is vital in drug development for confirming the mechanistic action of candidate compounds designed to mitigate oxidative damage in conditions such as neurodegenerative diseases, diabetes complications, and chronic inflammatory disorders [101] [102].
Background and Significance
Oxidative stress is defined as an imbalance between oxidants and antioxidants, leading to a disruption of redox signaling and control and/or molecular damage [103]. While reactive oxygen and nitrogen species (ROS/RNS) are essential for redox signaling, their excessive production can cause oxidative damage to macromolecules.
- Protein Carbonylation: This is a prominent and deleterious irreversible protein modification, often observed in models of neonatal brain injury and neurodegenerative diseases. It involves the introduction of carbonyl groups (ketones or aldehydes) into protein side chains, leading to loss of function and aggregation. It is frequently a byproduct of reactive nitrogen species chemistry [101].
- Lipid Peroxidation: This process entails the oxidative degradation of lipids, particularly polyunsaturated fatty acids. It generates a complex array of reactive and stable degradation products, such as malondialdehyde (MDA), 4-hydroxynonenal (4-HNE), and isoprostanes, which can further amplify cellular damage [100] [104].
Fluorescent probes like H2DCF-DA and C11-BODIPY581/591 are widely used to monitor general oxidative activity and lipid peroxidation in live cells in real-time [104]. However, their signals can be influenced by factors beyond the extent of macromolecular damage, including cellular esterase activity, antioxidant capacity, and metal ions. Therefore, correlating their oxidation with the definitive, cumulative biomarkers of damage provides a more robust and physiologically relevant assessment of oxidative stress status for preclinical research [100] [104].
The following diagram illustrates the core experimental workflow and the logical relationships between probe signals and damage biomarkers that this protocol aims to establish.
Experimental Protocols
Protocol 1: Correlation with Lipid Peroxidation Biomarkers in Mammalian Cells
This protocol adapts a methodology comparing LPO biomarkers with fluorescent probes in Chinese Hamster Ovary (CHO) cells, a model suitable for reliable and repeatable assays [104].
Materials and Reagents
Research Reagent Solutions
| Item | Function/Description |
|---|---|
| CHO (Chinese Hamster Ovary) Cells | A well-characterized, stable mammalian cell line for in vitro oxidative stress studies. |
| Menadione | A redox-cycling compound used to induce intracellular oxidative stress. |
| Cu²⁺/H₂O₂ | A metal-catalyzed oxidation system used to induce extracellular oxidative stress. |
| H2DCF-DA | Cell-permeant fluorescent probe; oxidized by a broad range of ROS to fluorescent DCF. |
| C11-BODIPY⁵⁸¹/₅₉₁ | Lipophilic fluorescent probe sensitive to lipid peroxidation; oxidation causes a spectral shift. |
| Vitamin E & C | Antioxidants used as experimental controls to test for attenuation of oxidative damage. |
| GC-ECD Instrument | Gas Chromatography with Electron Capture Detection for sensitive analysis of volatile LPO products. |
Detailed Procedure
Cell Culture and Treatment:
- Culture CHO cells in standard media (e.g., Ham's F-12) supplemented with 10% FBS and 1% penicillin/streptomycin at 37°C in a 5% CO₂ atmosphere.
- Seed cells at an appropriate density in multi-well plates (for probes) or culture flasks (for biomarker analysis) and allow to attach for 24 hours.
- Induce Oxidative Stress: Prepare fresh treatment solutions in serum-free media.
- Menadione: Treat cells with a concentration range (e.g., 20-200 µM) for a defined period (e.g., 2-4 hours).
- Cu²⁺/H₂O₂: Treat cells with a combination (e.g., 187 µM Cu²⁺ / 25 µM H₂O₂).
- Include negative controls (vehicle-only) and positive controls (antioxidants like 50 µM Vitamin E or 100 µM Vitamin C, added 1 hour prior to oxidant).
Cell Viability Assessment:
- Perform a viability assay (e.g., using nuclear dyes like propidium iodide) in parallel with all treatments. Only proceed with oxidant concentrations that maintain ≥80% cell viability to ensure measured effects are from sub-lethal oxidative stress [104].
Fluorescent Probe Analysis:
- H2DCF-DA Assay:
- Load cells with 10 µM H2DCF-DA in serum-free media for 30-45 minutes at 37°C.
- Wash cells to remove excess probe. Add treatment solutions and incubate.
- Measure fluorescence (Ex/Em: ~485/535 nm) using a plate reader. Increased fluorescence indicates ROS generation.
- C11-BODIPY⁵⁸¹/₅₉₁ Assay:
- Load cells with 2-5 µM C11-BODIPY⁵⁸¹/₅₉₁ for 30 minutes at 37°C.
- After treatment, measure fluorescence at two channels: the oxidized form (Ex/Em: ~485/510 nm) and the reduced form (Ex/Em: ~581/591 nm).
- Calculate the ratio of oxidized-to-reduced fluorescence. An increase in this ratio indicates lipid peroxidation.
- H2DCF-DA Assay:
Biomarker Analysis: Lipid Peroxidation Degradation Products:
- Sample Collection: Collect both cell lysates and incubation media after treatment.
- Derivatization: Derivatize aldehydes with O-(2,3,4,5,6-Pentafluorobenzyl)hydroxylamine hydrochloride (O-PFB) to form stable, volatile compounds for GC analysis [104].
- GC-ECD Analysis:
- Analyze the derivatized samples using a gas chromatograph equipped with an electron capture detector.
- Separate and quantify a panel of ten LPO degradation products, including acetaldehyde, propanal, butanal, pentanal, hexanal, heptanal, octanal, nonanal, malondialdehyde (MDA), and acetone.
- Use 3-bromofluorobenzene as an internal standard. Quantify concentrations using standard curves for each aldehyde.
Data Interpretation and Correlation
- Expected Results: Menadione treatment typically causes a significant increase in 8 out of 10 LPO biomarkers (e.g., hexanal, heptanal) in both cell lysates and media, accompanied by positive signals from both H2DCF-DA and C11-BODIPY probes. The Cu²⁺/H₂O₂ system may induce 6 out of 10 LPO biomarkers without necessarily oxidizing the fluorescent probes, suggesting the LPO biomarker panel can be more sensitive under certain conditions [104].
- Correlation Analysis: Perform linear regression or Spearman's correlation analysis between the fold-change in fluorescent probe signal (e.g., DCF fluorescence or C11-BODIPY ratio) and the concentration of key LPO biomarkers (e.g., hexanal, MDA) across all treatment conditions.
Protocol 2: Assessing Protein CarbonylationIn Vivo
This protocol outlines a method for detecting protein carbonylation, a key marker of irreversible protein oxidation, in tissue samples such as the immature brain, relevant to the study of neonatal brain injury and neuroprotection [101].
Materials and Reagents
- Tissue Homogenates (e.g., from rodent brain models of hypoxic-ischemic insult).
- DNPH Solution: 2,4-Dinitrophenylhydrazine, used to derivatize protein carbonyls.
- Anti-DNP Antibody: For immunodetection of derivatized carbonyl groups.
- Primary Antibodies for Specific Proteins: To assess carbonylation of specific targets (e.g., oligodendrocyte proteins).
- Cannabidiol: A potent antioxidant used here to demonstrate the modulation of protein carbonylation as a therapeutic target [101].
Detailed Procedure
Animal Model and Treatment:
- Utilize a validated translational model of neonatal brain injury (e.g., hypoxic-ischemic encephalopathy in postnatal day 7-10 rats).
- Administer the test compound (e.g., Cannabidiol) or vehicle post-injury. A positive control group (e.g., treated with a known antioxidant) and a sham-operated group should be included.
Tissue Sample Preparation:
- At a defined endpoint, euthanize the animals and dissect the brain regions of interest.
- Homogenize tissues in a cold buffer containing protease inhibitors to prevent protein degradation.
Protein Carbonyl Detection via Immunoblotting (OxyBlot):
- Derivatization: React 5-10 µg of extracted protein with DNPH. Include a negative control derivatized with a HCl-only solution.
- Gel Electrophoresis: Separate the derivatized proteins by SDS-PAGE.
- Western Blotting: Transfer proteins to a PVDF membrane.
- Immunodetection: Block the membrane and incubate with a primary anti-DNP antibody to detect carbonylated proteins. Follow with an HRP-conjugated secondary antibody and visualize using chemiluminescence.
- Data Normalization: Re-probe the membrane for a housekeeping protein (e.g., β-actin) to normalize for total protein loading.
Immunohistochemistry for Geographical Distribution:
- For spatial analysis of protein carbonylation and co-localization with specific cell types (e.g., immature oligodendrocytes), perform immunohistochemistry on formalin-fixed, paraffin-embedded brain sections.
- Use an anti-DNP antibody and an antibody against a cell-specific marker (e.g., Olig2 for oligodendrocytes). Use fluorescent secondary antibodies and analyze via confocal microscopy.
Data Interpretation
- Expected Results: In injured animal models, a notable elevation of protein carbonylation is observed via OxyBlot, which is attenuated by treatment with cannabidiol. Immunohistochemistry reveals the geographical distribution of carbonylation, showing high levels in vulnerable regions like white matter tracts, co-localizing with immature oligodendrocytes [101]. This correlates with the restoration of neurobehavioral performance and physiological myelination, linking the biomarker to functional outcomes.
Data Presentation and Analysis
The following table summarizes key quantitative findings from the application of these methodologies, illustrating the relationship between probe signals and direct biomarkers.
Table 1: Correlation between Probe Signals and Direct Biomarkers of Oxidative Damage
| Experimental Model | Oxidant Stressor | Probe Signal Result | Direct Biomarker Result | Correlation Findings |
|---|---|---|---|---|
| CHO Cells [104] | Menadione (20-200 µM) | H2DCF-DA: Increased fluorescence.C11-BODIPY: Significant oxidation. | LPO Biomarkers: 8 out of 10 aldehydes (e.g., hexanal, heptanal) significantly increased. | Strong positive correlation; both probes and biomarkers confirmed oxidative damage. |
| CHO Cells [104] | Cu²⁺/H₂O₂ (187/25 µM) | H2DCF-DA & C11-BODIPY: No significant oxidation. | LPO Biomarkers: 6 out of 10 aldehydes significantly increased. | LPO biomarkers showed higher sensitivity than fluorescent probes for this stressor. |
| Immature Rodent Brain [101] | Hypoxia-Ischemia | (Probes not used in cited study) | Protein Carbonylation: Noteworthy elevation. Geographically associated with immature oligodendrocytes. | N/A (Biomarker used as a standalone gold-standard readout for damage and neuroprotection). |
| Human Patients (Long COVID) [105] | Post-viral syndrome | (Probes not used) | Oxidative Stress Index: Elevated in patients, particularly with neurological symptoms. | N/A (Highlights clinical relevance of systemic oxidative stress biomarkers). |
Troubleshooting and Best Practices
- Probe Limitations: Be aware that H2DCF-DA is oxidized by a wide range of ROS and is not specific. It can also be influenced by cellular pH, esterase activity, and iron levels. C11-BODIPY is more specific for lipid peroxidation but can be photoxidized during imaging [8] [104].
- Biomarker Specificity and Sensitivity: The panel of LPO degradation products by GC-ECD is highly sensitive and can detect damage missed by probes. However, techniques like GC-ECD and OxyBlot require specialized equipment and rigorous controls [100] [104].
- Antioxidant Controls: The use of antioxidants like Vitamin E and C is crucial for control experiments. Note that Vitamin C can act as a pro-oxidant in the presence of metal ions like Cu²⁺, increasing biomarker levels such as acetaldehyde and dityrosine [104].
- Sample Handling: For biomarker analysis, samples should be snap-frozen and processed with antioxidants (e.g., BHT) in the buffers to prevent ex vivo oxidation during preparation.
This application note provides a standardized approach for correlating dynamic fluorescent probe signals with definitive, cumulative biomarkers of oxidative damage. By implementing these protocols, researchers in drug development can robustly validate that observed changes in probe fluorescence correspond to meaningful biochemical endpoints—specifically, protein carbonylation and lipid peroxidation. This correlation strengthens the interpretation of in vivo and in vitro oxidative stress data, ultimately enhancing the confidence in mechanistic studies and the evaluation of novel therapeutic compounds.
Reactive oxygen species (ROS) function as crucial signaling molecules, and their specific subcellular site of production dictates their physiological and pathophysiological outcomes [53] [41] [51]. Mitochondria are a major source of ROS, but differentiating between mitochondrial and cytosolic ROS pools in live cells and intact organisms has remained a significant technical challenge [51]. This case study details a novel methodology using Electron Paramagnetic Resonance (EPR) spectroscopy with compartment-specific nitroxide probes to noninvasively discriminate the site of ROS production in vivo, using a 4T1 breast tumor model as a proof-of-concept [53] [51]. This approach overcomes limitations of traditional fluorescent probes, which often lack specificity and have limited depth penetration for in vivo applications [51].
Principle of the Methodology
The core principle involves using two complementary nitroxide probes that accumulate in different cellular compartments: mitoTEMPO (targeted to mitochondria) and 3-Carbamoyl-Proxyl (3CP) (a hydrophilic nitroxide distributing throughout intra- and extracellular compartments) [51]. The decay rate of the EPR signal from these nitroxides is modulated by local ROS levels. Superoxide can oxidize the nitroxide to an oxoammonium cation, which is then reduced to a diamagnetic, EPR-silent hydroxylamine. This ROS-initiated two-step mechanism accelerates the signal decay under oxidative stress [51]. By comparing the signal decay rates of mitoTEMPO and 3CP, the site of ROS production can be pinpointed.
Diagram 1: Principle of Site-Specific ROS Detection. The workflow illustrates how compartment-specific nitroxide probes are oxidized by local ROS, leading to accelerated EPR signal decay that indicates the site of production.
Experimental Models and Reagents for ROS Modulation
To validate the specificity of the dual-probe EPR approach, researchers employed specific pharmacological and genetic tools to manipulate ROS levels in distinct compartments within 4T1 breast cancer cells and tumor-bearing mice [51].
Table 1: Reagents for Modulating Site-Specific ROS Production
| Reagent | Target/Pathway | Primary Site of ROS Induction/Modulation | Key Experimental Use |
|---|---|---|---|
| L-Buthionine Sulfoximine (L-BSO) | Glutathione synthesis inhibitor [53] [51] | Cytosol [51] | Induces cytosolic oxidative stress by depleting glutathione [51] |
| Antimycin A | Inhibitor of mitochondrial Electron Transport Chain Complex III [53] [51] | Mitochondria [51] | Induces mitochondrial superoxide production [53] [51] |
| Genetically engineered 4T1 cells overexpressing SOD2 | Mitochondrial superoxide dismutase [53] [51] | Mitochondria [53] [51] | Assesses contribution of mitochondrial superoxide to EPR signal decay [51] |
Detailed Experimental Protocols
In Vitro EPR Spectroscopy in 4T1 Cells
This protocol measures nitroxide decay kinetics in cell culture using a 9 GHz EPR spectrometer [51].
- Cell Culture: Maintain 4T1 murine breast cancer cells in standard culture conditions.
- ROS Modulation Pre-treatment:
- Nitroxide Probe Incubation: Incubate cells with either 20 µM mitoTEMPO or 20 µM 3CP for 15-30 minutes at 37°C [51].
- Sample Preparation: After incubation, wash cells to remove excess probe. Gently detach and resuspend cells in a suitable buffer (e.g., PBS). Transfer the cell suspension to a gas-permeable Teflon tube or a quartz capillary tube suitable for the EPR spectrometer.
- EPR Measurement: Insert the sample into a 9 GHz EPR spectrometer. Record the EPR signal intensity of the nitroxide over time (typically 20-60 minutes) under constant temperature. The instrument settings should be optimized for nitroxide detection (e.g., center field, microwave power, modulation amplitude).
- Data Analysis: Plot the normalized EPR signal intensity versus time. Calculate the first-order decay rate constant (k) for the nitroxide in each treatment group. An increase in the decay rate of a specific probe indicates elevated ROS in its target compartment.
In Vivo EPR Spectroscopy in Tumor-Bearing Mice
This protocol enables noninvasive, repeated measurement of ROS in live animals using a low-frequency (1 GHz) EPR spectrometer [51].
- Tumor Model Generation: Implant 4T1 cells (wild-type or SOD2-overexpressing) subcutaneously into the flank of syngeneic mice. Allow tumors to grow to a predetermined volume (e.g., 100-200 mm³).
- Systemic ROS Modulation:
- Probe Injection: Intratumorally inject either mitoTEMPO or 3CP (e.g., 50-100 nmol in a small volume of saline) directly into the tumor tissue [51].
- In Vivo EPR Measurement: Anesthetize the mouse and position the tumor within the loop of the 1 GHz EPR spectrometer. Record the EPR signal intensity from the nitroxide probe repeatedly over time (e.g., every 2-5 minutes for up to 60 minutes).
- Data Analysis: Calculate the relative decay rate of the nitroxide signal over time for each probe and treatment group. Compare the decay rates to discriminate the site of ROS production.
Diagram 2: In Vivo EPR Workflow. The key steps for noninvasively discriminating ROS production in a live tumor-bearing mouse model.
Ex Vivo Analysis for Signal Decay Validation
To confirm that the observed in vivo signal decay is primarily due to redox reactions and not probe washout, perform the following control experiment [51]:
- After the final in vivo EPR measurement, immediately excise the tumor.
- Homogenize the tumor tissue and split the homogenate into two aliquots.
- To one aliquot, add potassium ferricyanide (e.g., 1-5 mM), which chemically re-oxidizes hydroxylamines back to nitroxides.
- Measure the EPR signal in both aliquots ex vivo.
- Interpretation: Non-significant changes in the total amount of (nitroxide + hydroxylamine) between the two aliquots suggest that blood wash-out did not significantly contribute to the signal decay observed in vivo [51].
Key Quantitative Data and Findings
The application of the dual-probe EPR protocol in the 4T1 tumor model yielded clear, quantitative evidence for site-specific ROS detection.
Table 2: Summary of Key Experimental Findings from 4T1 Model [51]
| Experimental Condition | Effect on 3CP (Cytosolic) Decay Rate | Effect on mitoTEMPO (Mitochondrial) Decay Rate | Interpretation |
|---|---|---|---|
| L-BSO Treatment (Cytosolic Stress) | Increased significantly (1 and 2 days post-treatment) [51] | No significant change [51] | Selective increase in cytosolic, non-mitochondrial ROS |
| Antimycin A Treatment (ETC Inhibition) | No significant change [51] | Increased significantly [51] | Selective increase in mitochondrial ROS |
| SOD2 Overexpression + Antimycin A | Not Applicable | Attenuated decay rate increase [51] | Confirms superoxide contribution to mitoTEMPO decay |
The data showed that in mice, an increase in relative decay rate was observed for 3CP, but not for mitoTEMPO, 1 and 2 days after starting L-BSO treatment, while the opposite result was obtained after Antimycin A treatment [51]. These observations were consistent with results obtained on cells in vitro and were further validated by the control experiments with SOD2 overexpression and ex-vivo ferricyanide treatment [51].
The Scientist's Toolkit: Key Research Reagents
Table 3: Essential Reagent Solutions for Dual-Probe EPR ROS Detection
| Reagent / Tool | Function / Specificity | Key Considerations |
|---|---|---|
| mitoTEMPO | Mitochondria-targeted nitroxide probe; scavenges ROS and acts as a redox sensor [51]. | The triphenylphosphonium cation drives mitochondrial accumulation. Its decay rate reports on mitochondrial ROS. |
| 3-Carbamoyl-PROXYL (3CP) | Hydrophilic, non-targeted nitroxide; distributes in cytosolic and extracellular compartments [51]. | Serves as a global ROS sensor. Contrast with mitoTEMPO to discriminate subcellular ROS origin. |
| L-Buthionine Sulfoximine (L-BSO) | Selective and irreversible inhibitor of γ-glutamylcysteine synthetase, the rate-limiting enzyme in glutathione synthesis [51]. | Induces cytosolic oxidative stress by depleting the major cellular antioxidant, glutathione. |
| Antimycin A | Potent inhibitor of the mitochondrial electron transport chain at Complex III (CIII) [53] [51]. | Robustly induces mitochondrial superoxide production by causing maximal semiubiquinone occupancy at the Qo site of CIII. |
| Xanthine/Xanthine Oxidase | Enzymatic system for in vitro generation of superoxide [51]. | Used as a positive control to validate the ROS-dependent decay of nitroxide probes in cell-free systems. |
Conclusion
The precise measurement of oxidative stress in vivo is paramount for elucidating its role in health and disease. This review has synthesized the foundational principles, diverse methodologies, and critical validation frameworks necessary for leveraging redox probes effectively. The field is moving beyond simply detecting 'ROS' to precisely identifying specific species within defined subcellular compartments, a capability crucial for decoding complex redox signaling networks. Future progress hinges on developing next-generation probes with enhanced specificity, minimal invasiveness, and compatibility with dynamic, multi-scale imaging. The integration of these advanced redox tools with AI-driven analysis and multi-omics approaches will unlock a new era of precision medicine, enabling targeted therapies that restore redox balance in conditions ranging from cancer and neurodegeneration to metabolic disorders.
References
- 1. at the crossroads of human health and disease - PMC Redox signaling [https://pmc.ncbi.nlm.nih.gov/articles/PMC8971743/]
- 2. regulation: Redox , biology and therapeutic targets in... mechanisms [https://www.nature.com/articles/s41392-024-02095-6?error=cookies_not_supported&code=a265fc68-11d2-49c6-84e8-34991748e8f1]
- 3. Reactive Oxygen Species Signaling and Oxidative Stress [https://pmc.ncbi.nlm.nih.gov/articles/PMC10967436/]
- 4. Roles and Functions of ROS and RNS in Cellular ... [https://pmc.ncbi.nlm.nih.gov/articles/PMC7140712/]
- 5. The Redox Revolution in Brain Medicine [https://www.mdpi.com/1422-0067/26/15/7498]
- 6. Reactive Oxygen Species (ROS) and Reactive Nitrogen ... [https://www.sciencedirect.com/science/article/pii/S266713792200011X]
- 7. RONS and Oxidative Stress: An Overview of Basic Concepts [https://www.mdpi.com/2673-9801/2/4/30]
- 8. Chemical Probes for Redox Signaling and Oxidative Stress [https://pmc.ncbi.nlm.nih.gov/articles/PMC6391619/]
- 9. Oxidative Stress Detection | Thermo Fisher Scientific - US [https://www.thermofisher.com/us/en/home/life-science/cell-analysis/cell-viability-and-regulation/oxidative-stress.html]
- 10. Redox regulation: mechanisms, biology and therapeutic ... [https://www.nature.com/articles/s41392-024-02095-6]
- 11. Review Redox signaling in cell fate: Beyond damage [https://www.sciencedirect.com/science/article/pii/S016748892400065X]
- 12. Approaches and Methods to Measure Oxidative Stress in ... [https://pmc.ncbi.nlm.nih.gov/articles/PMC6434272/]
- 13. Advances in PET imaging of oxidative stress [https://link.springer.com/article/10.1007/s00259-025-07505-7]
- 14. An overview of mechanisms of redox signaling - PMC [https://pmc.ncbi.nlm.nih.gov/articles/PMC4048798/]
- 15. A guide to reactive oxygen species in tumour hypoxia [https://pmc.ncbi.nlm.nih.gov/articles/PMC12591319/]
- 16. Multi-spin Redox Sensor for Electron Paramagnetic ... [https://pmc.ncbi.nlm.nih.gov/articles/PMC12396052/]
- 17. Reversible redox 19 F magnetic resonance imaging ... [https://pubs.rsc.org/en/content/articlehtml/2025/sc/d4sc08297d]
- 18. ROS: Basic Concepts, Sources, Cellular Signaling, and its ... [https://pmc.ncbi.nlm.nih.gov/articles/PMC9605829/]
- 19. Nox Enzymes, ROS, and Chronic Disease - PubMed Central [https://pmc.ncbi.nlm.nih.gov/articles/PMC2013737/]
- 20. Reactive Oxygen Species (ROS) [https://www.rndsystems.com/resources/articles/reactive-oxygen-species-ros]
- 21. Reactive oxygen species [https://en.wikipedia.org/wiki/Reactive_oxygen_species]
- 22. Generation of Reactive Oxygen Species by Mitochondria [https://www.mdpi.com/2076-3921/10/3/415]
- 23. How mitochondria produce reactive oxygen species - PMC [https://pmc.ncbi.nlm.nih.gov/articles/PMC2605959/]
- 24. NADPH Oxidases (NOX): An Overview from Discovery, ... [https://www.mdpi.com/2076-3921/10/6/890]
- 25. State of the art in vivo reactive oxygen species ... [https://www.sciencedirect.com/science/article/pii/S2773176625000100]
- 26. Measurements of redox balance along the gut using a ... [https://www.nature.com/articles/s41928-025-01411-4]
- 27. Profiling the landscape of cysteine posttranslational ... [https://www.sciencedirect.com/science/article/pii/S1878747925002041]
- 28. Cysteine Thiol-Based Oxidative Post-Translational ... [https://www.mdpi.com/2073-4395/14/12/2757]
- 29. Oxidative post‐translational modifications of plant ... [https://pmc.ncbi.nlm.nih.gov/articles/PMC11837463/]
- 30. Strategic approaches to assess and quantify the oxidative ... [https://pubmed.ncbi.nlm.nih.gov/40183176/]
- 31. Measuring oxidative stress by the iridium reducing capacity ... [https://www.sciencedirect.com/science/article/pii/S2667137925000104]
- 32. S-glutathionylation modification of proteins and the ... [https://www.spandidos-publications.com/10.3892/mi.2025.263]
- 33. The Applications and Mechanisms of Superoxide Dismutase ... [https://pmc.ncbi.nlm.nih.gov/articles/PMC10525108/]
- 34. Therapeutic potentials of catalase: Mechanisms, applications ... [https://pmc.ncbi.nlm.nih.gov/articles/PMC10915913/]
- 35. Superoxide dismutase [https://en.wikipedia.org/wiki/Superoxide_dismutase]
- 36. Role of Catalase in Oxidative Stress- and Age-Associated ... [https://pmc.ncbi.nlm.nih.gov/articles/PMC6885225/]
- 37. Glutathione: new roles in redox signaling for an old ... [https://pmc.ncbi.nlm.nih.gov/articles/PMC4144092/]
- 38. Activation of the Nrf2 Signaling Pathway as a Therapeutic ... [https://pmc.ncbi.nlm.nih.gov/articles/PMC12293358/]
- 39. Involvement of Nrf2 and NF-kB Pathways in the Antioxidant ... [https://www.sciencedirect.com/science/article/pii/S0022356524173892]
- 40. Measurement of Oxidative Stress Markers In Vitro Using ... [https://www.ncbi.nlm.nih.gov/books/NBK566442/]
- 41. Guidelines for measuring reactive oxygen species and ... [https://www.nature.com/articles/s42255-022-00591-z]
- 42. Methods for Detection of Mitochondrial and Cellular ... [https://pmc.ncbi.nlm.nih.gov/articles/PMC3887411/]
- 43. Small-molecule luminescent probes for the detection of ... [https://pmc.ncbi.nlm.nih.gov/articles/PMC6146080/]
- 44. Imaging ROS signaling in cells and animals [https://link.springer.com/article/10.1007/s00109-013-1067-4]
- 45. Generating and Detecting Reactive Oxygen Species— ... [https://www.thermofisher.com/us/en/home/references/molecular-probes-the-handbook/probes-for-reactive-oxygen-species-including-nitric-oxide/generating-and-detecting-reactive-oxygen-species.html]
- 46. A Redox-Sensitive Green Fluorescent Protein (roGFP ... [https://pmc.ncbi.nlm.nih.gov/articles/PMC12019446/]
- 47. Review Genetically encoded fluorescent redox sensors [https://www.sciencedirect.com/science/article/abs/pii/S0304416513002262]
- 48. Genetically Encoded Biosensors to Monitor Intracellular ... [https://pmc.ncbi.nlm.nih.gov/articles/PMC8509583/]
- 49. Redox Probing for Chemical Information of Oxidative Stress [https://pmc.ncbi.nlm.nih.gov/articles/PMC5300039/]
- 50. Molecular Probes for Evaluation of Oxidative Stress by In ... [https://www.mdpi.com/2312-7481/5/1/13]
- 51. Noninvasive in vivo discrimination between mitochondrial ... [https://pmc.ncbi.nlm.nih.gov/articles/PMC12475512/]
- 52. Use of Electron Paramagnetic Resonance Spectroscopy to ... [https://pmc.ncbi.nlm.nih.gov/articles/PMC2702846/]
- 53. Noninvasive in vivo discrimination between mitochondrial ... [https://www.sciencedirect.com/science/article/pii/S2213231725003842]
- 54. Monitoring redox-sensitive paramagnetic contrast agent by ... [https://www.sciencedirect.com/science/article/abs/pii/S1090780707003291]
- 55. Advancing EPR spectroscopy with BMPO for UVA-induced ... [https://www.sciencedirect.com/science/article/pii/S0009279725003746]
- 56. Advancing EPR spectroscopy with BMPO for UVA-induced ... [https://pubmed.ncbi.nlm.nih.gov/40945699/]
- 57. Hydroperoxide-Independent Generation of Spin Trapping ... [https://pmc.ncbi.nlm.nih.gov/articles/PMC11851217/]
- 58. Guidelines for measuring reactive oxygen species and ... [https://pmc.ncbi.nlm.nih.gov/articles/PMC9711940/]
- 59. Redox Imbalance in Inflammation: The Interplay of ... [https://www.mdpi.com/2076-3921/14/6/656]
- 60. Small-molecule fluorescent probes for detecting hydrogen ... [https://www.sciencedirect.com/science/article/abs/pii/S0010854525003558]
- 61. Comparison of different methods for measuring the ... [https://pmc.ncbi.nlm.nih.gov/articles/PMC6602867/]
- 62. Bioluminescence measurement of superoxide anion in ... [https://www.sciencedirect.com/science/article/pii/S1011134424000125]
- 63. A Novel Fluorescent Probe for Hydrogen Peroxide and Its ... [https://pmc.ncbi.nlm.nih.gov/articles/PMC8199646/]
- 64. Comparison of fluorescence-based techniques for the ... [https://particleandfibretoxicology.biomedcentral.com/articles/10.1186/1743-8977-5-2]
- 65. A turn-on fluorescent probe for imaging of hydroxyl radicals ... [https://pubmed.ncbi.nlm.nih.gov/39671817/]
- 66. Using redox-sensitive fluorescent probes to record real ... [https://pmc.ncbi.nlm.nih.gov/articles/PMC8132123/]
- 67. Visualization of the Redox Status of Cytosolic Glutathione ... [https://www.mdpi.com/2076-3921/9/2/129]
- 68. Peroxisomes as emerging clinical targets in ... [https://www.frontiersin.org/journals/molecular-neuroscience/articles/10.3389/fnmol.2025.1642590/full]
- 69. The Redox Paradox: Cancer's Double-Edged Sword for ... [https://pmc.ncbi.nlm.nih.gov/articles/PMC12561025/]
- 70. Genetically encoded biosensors of metabolic function for the ... [https://pmc.ncbi.nlm.nih.gov/articles/PMC12408211/]
- 71. Acute stimulation of glucose metabolism by H2O2 sustains ... [https://pubmed.ncbi.nlm.nih.gov/40609477/]
- 72. Low-input redoxomics facilitates global identification of ... [https://www.nature.com/articles/s41392-024-02094-7]
- 73. Single-cell signaling network profiling during redox stress ... [https://www.nature.com/articles/s41467-025-60727-z]
- 74. Challenges and Opportunities for Small-Molecule Fluorescent ... [https://pmc.ncbi.nlm.nih.gov/articles/PMC6056262/]
- 75. Practical considerations for using redox probes in ... [https://www.sciencedirect.com/science/article/abs/pii/S0013468624016104]
- 76. Rethinking the use of redox probes for the detection ... [https://www.sciencedirect.com/science/article/abs/pii/S0956566324011126]
- 77. Utilizing redox-sensitive GFP fusions to detect in vivo ... [https://www.sciencedirect.com/science/article/pii/S221323171930641X]
- 78. Biological markers of oxidative stress - PubMed Central - NIH [https://pmc.ncbi.nlm.nih.gov/articles/PMC3830063/]
- 79. Single compartment drug delivery - PMC - PubMed Central [https://pmc.ncbi.nlm.nih.gov/articles/PMC4179298/]
- 80. Targeting oxidative stress in disease: promise and ... [https://www.nature.com/articles/s41573-021-00233-1]
- 81. Assays for oxidative stress and antioxidant status [https://www.sciencedirect.com/science/article/pii/S0002916523275152]
- 82. Cell-type and subcellular compartment-specific APEX2 ... [https://www.nature.com/articles/s41467-021-25144-y]
- 83. Avoiding false positives and false negatives with power ... [https://www.statsig.com/perspectives/avoiding-false-positives-negatives]
- 84. Research practices that can prevent an inflation of false ... [https://pubmed.ncbi.nlm.nih.gov/23965303/]
- 85. Store Your Water Quality Instrumentation Properly [https://www.ysi.com/ysi-blog/water-blogged-blog/2020/01/store-your-water-quality-instrumentation-properly?srsltid=AfmBOoo1VLlXEdtU5DzRUf4_KCoik8Qx771owpi9QGPj1zIgvdXAd7Ub]
- 86. Red fluorescent genetically encoded indicator for ... [https://www.nature.com/articles/ncomms6222]
- 87. A novel approach for in vivo measurement of mouse red ... [https://pmc.ncbi.nlm.nih.gov/articles/PMC3186341/]
- 88. ROS Staining & Antibody Methods: Visualizing Oxidative ... [https://www.betalifesci.com/blogs/news/ros-staining?srsltid=AfmBOoo1By8HYc5-ArHbHINq63OEfvFJctXhWBbTB_hkiz5MMOa-9Qis]
- 89. A positron emission tomography tracer for the imaging of ... [https://pmc.ncbi.nlm.nih.gov/articles/PMC12092265/]
- 90. Advancements and perspectives on organelle-targeted ... [https://pubs.rsc.org/en/content/articlehtml/2025/sc/d5sc04640h]
- 91. Chemical Probes for Redox Signaling and Oxidative Stress - PMC [https://www.ncbi.nlm.nih.gov/pmc/articles/PMC6391619/]
- 92. Feasibility study of multimodal imaging for redox status and ... [https://www.sciencedirect.com/science/article/pii/S0891584924001655]
- 93. Quantitative In Vivo Redox Sensors Uncover Oxidative ... [https://pmc.ncbi.nlm.nih.gov/articles/PMC3444654/]
- 94. Detection Technologies for Reactive Oxygen Species [https://pmc.ncbi.nlm.nih.gov/articles/PMC7911324/]
- 95. Clinical Probes for ROS and Oxidative Stress - NCBI - NIH [https://www.ncbi.nlm.nih.gov/books/NBK566439/]
- 96. Chemiluminescence Detection in the Study of Free-Radical ... [https://pmc.ncbi.nlm.nih.gov/articles/PMC8526183/]
- 97. The Importance of Multifaceted Approach for Accurate and ... [https://www.mdpi.com/2076-3921/14/9/1083]
- 98. Comparison of fluorescence-based techniques for the ... - PMC [https://pmc.ncbi.nlm.nih.gov/articles/PMC2289838/]
- 99. A Chemiluminescence Study of UVA-Induced Oxidative ... [https://www.sciencedirect.com/science/article/pii/S0022202X15307569]
- 100. Oxidative and Glycation Stress Biomarkers - PubMed Central [https://pmc.ncbi.nlm.nih.gov/articles/PMC12610123/]
- 101. Protein Carbonylation as a Biomarker of Oxidative Stress and ... [https://pmc.ncbi.nlm.nih.gov/articles/PMC10603858/]
- 102. Integrated Approaches to Drug Discovery for Oxidative ... [https://pmc.ncbi.nlm.nih.gov/articles/PMC5174186/]
- 103. Artificial intelligence as a potential tool for oxidative stress ... [https://www.explorationpub.com/Journals/edht/Article/101157]
- 104. Application of lipid peroxidation and protein oxidation ... [https://www.sciencedirect.com/science/article/abs/pii/S0887233306000142]
- 105. Exploring Biomarkers of Oxidative Stress in Health and ... [https://www.mdpi.com/2076-3921/14/12/1400]