Electrochemical vs. HPLC Methods in Pharma: A Strategic Guide to Analytical Selection
Selecting the optimal analytical method is critical for efficient and reliable pharmaceutical analysis.
Electrochemical vs. HPLC Methods in Pharma: A Strategic Guide to Analytical Selection
Abstract
Selecting the optimal analytical method is critical for efficient and reliable pharmaceutical analysis. This article provides a comprehensive guide for researchers and drug development professionals on strategically choosing between electrochemical methods and High-Performance Liquid Chromatography (HPLC). We explore the foundational principles of both techniques, detail their specific applications in analyzing pharmaceuticals and biologics, and offer practical troubleshooting advice. A thorough comparison of validation parameters, including sensitivity, selectivity, and cost, is presented to empower scientists in making evidence-based decisions that enhance analytical workflows, ensure data integrity, and accelerate drug development.
Understanding the Core Principles: Electrochemical Sensors vs. HPLC Systems
Core Principles of HPLC Separation
High-Performance Liquid Chromatography (HPLC) remains a cornerstone analytical technique in scientific fields due to its flexibility, precision, and effectiveness in separating, identifying, and quantifying compounds in complex mixtures [1]. The fundamental principle of HPLC is the differential partitioning of analytes between a stationary phase and a mobile phase [1]. A high-pressure pump forces the mobile phase, containing the sample, through a column packed with the stationary phase [1]. As the sample components migrate through the column, they interact to varying degrees with the stationary phase based on physicochemical properties such as size, polarity, and charge [1]. These differential interaction rates cause the compounds to separate as they elute from the column at different times, ready for detection [1].
The selection of the separation mode is crucial and depends on the nature of the target analytes. The most common mode is reversed-phase HPLC, where the stationary phase is non-polar (e.g., C18 bonded silica) and the mobile phase is polar (e.g., water-acetonitrile mixtures). Analytes elute in order of increasing hydrophobicity. Other important modes include normal-phase (polar stationary, non-polar mobile phase), ion-exchange (charged stationary phase for ionic analytes), size-exclusion (porous stationary phase for size-based separation), and affinity chromatography (bio-specific interactions) [1].
The following diagram illustrates the general workflow and separation mechanism of an HPLC system:
The HPLC Detector Landscape
The detector is a critical component that converts the physicochemical properties of eluted analytes into measurable electrical signals, enabling identification and quantification [2] [3]. The choice of detector directly impacts the sensitivity, selectivity, and range of analytes that can be detected [4]. Detectors can be broadly classified into specific detectors, which respond to particular properties of the analyte, and universal or bulk property detectors, which respond to a broader range of compounds [4].
Ultraviolet-Visible (UV-Vis) Detection
UV-Vis detectors are the most widely used in HPLC systems, with approximately 80% of pharmaceutical HPLC methods relying on them due to their robustness, affordability, and reproducibility [3]. They measure the absorption of ultraviolet or visible light (typically 190–800 nm) by analytes as they pass through a flow cell [2]. The key principle is the Beer-Lambert law, where absorbance is proportional to concentration [2]. There are several types of UV-based detectors:
- Variable Wavelength Detector (VWD): Uses a single wavelength for detection, offering high sensitivity for methods targeting specific, known compounds [2].
- Diode Array Detector (DAD/PDA): Exposes the sample to the entire spectrum and disperses the transmitted light onto an array of photodiodes [2]. This allows for the simultaneous collection of data across all wavelengths, enabling peak purity assessment and spectral identification for unknown compounds [2] [4].
Mass Spectrometric (MS) Detection
Mass spectrometry is a powerful detector that provides high sensitivity and selectivity [2]. It works by ionizing analytes, separating the resulting ions based on their mass-to-charge ratio (m/z), and detecting them [2]. MS detectors provide molecular weight and structural information, making them indispensable for applications like drug metabolism studies, proteomics, and identifying unknown compounds [2] [4]. Tandem mass spectrometry (MS/MS) provides even greater specificity by isolating and fragmenting precursor ions to gain detailed structural information [2]. The key differentiator among mass spectrometers is the mass analyzer, with common types being quadrupole, time-of-flight (TOF), ion trap, and Orbitrap, each with advantages in resolution, speed, and sensitivity [2].
Electrochemical Detection (ECD)
Electrochemical detectors are highly sensitive and selective for analytes that undergo oxidation or reduction (redox reactions) [2]. They measure the current produced when an electroactive compound undergoes such a reaction at the surface of an electrode under an applied potential [2] [5]. According to Faraday's law, the resulting current is directly proportional to the concentration of the analyte [2]. ECD is often used for detecting low-level analytes in complex biological matrices, such as neurotransmitters, catecholamines, and certain pharmaceuticals, and offers the advantage of direct measurement without the need for complex derivatization procedures [2] [3].
Other Notable Detectors
- Fluorescence Detector (FLD): Excites fluorescent molecules at a specific wavelength and detects the emitted light at a longer wavelength (Stokes shift) [2]. FLD can be 10 to 1,000 times more sensitive than UV-Vis detection but is limited to naturally fluorescent compounds or those that can be tagged with a fluorophore [2] [3].
- Refractive Index Detector (RID): A universal detector that measures the change in the refractive index of the mobile phase caused by the eluting analyte [2]. It is widely used for analytes without chromophores, such as sugars, polymers, and lipids, but has lower sensitivity and is not suitable for gradient elution due to high sensitivity to temperature and flow changes [2] [4].
- Evaporative Light Scattering Detector (ELSD) and Charged Aerosol Detector (CAD): Both are near-universal detectors for non-volatile and semi-volatile analytes [2]. They work by nebulizing and evaporating the mobile phase, leaving behind analyte particles. ELSD measures the light scattered by these particles, while CAD charges the particles with nitrogen gas and measures the resulting current [2]. CAD generally offers higher sensitivity and a more uniform response [2].
Table 1: Comparison of Common HPLC Detectors
| Detector Type | Principle of Detection | Sensitivity | Selectivity | Gradient Compatibility | Primary Applications |
|---|---|---|---|---|---|
| UV-Vis [2] [3] | Light absorption | Nanograms | Good | Yes | Pharmaceuticals, peptides, any UV-absorbing compound |
| Mass Spectrometry (MS) [2] [4] | Mass-to-charge ratio | Picograms | Very High | Yes | Structural elucidation, trace analysis, metabolomics |
| Electrochemical (ECD) [2] [5] | Redox reaction | Femtograms | High | Yes | Neurotransmitters, catecholamines, redox-active drugs |
| Fluorescence (FLD) [2] [3] | Light emission | Femtograms | Very High | Yes | Vitamins, PAHs, fluorescently-tagged compounds |
| Refractive Index (RID) [2] [4] | Refractive index change | Micrograms | Universal | No | Sugars, polymers, lipids (no chromophore) |
| Charged Aerosol (CAD) [2] | Particle charging | Picograms | Near-Universal | Yes | Non-volatile analytes, impurities |
Table 2: Detector Selection Guide for Pharmaceutical Applications
| Analytical Goal | Recommended Detector(s) | Key Rationale |
|---|---|---|
| Routine API Quantification | UV-Vis (VWD) [3] | Robust, cost-effective, and reproducible for known UV-absorbing compounds. |
| Impurity/Forced Degradation Profiling | DAD, MS [4] [6] | DAD provides peak purity; MS identifies unknown impurities and degradants. |
| Bioanalysis (e.g., plasma levels) | MS, FLD, ECD [2] [4] | High sensitivity required for trace-level compounds in complex matrices. |
| Analysis without Chromophores | CAD, ELSD, RID [2] [4] | Universal detection for sugars, polymers, excipients. |
| Chiral Separation Analysis | UV-Vis, RID, CAD [7] | Compatibility with common mobile phases for chiral methods. |
The following diagram summarizes the working principles of the three detectors central to this guide:
HPLC vs. Electrochemical Methods: A Pharmaceutical Context
The selection between conventional HPLC and standalone electrochemical methods for pharmaceutical analysis is guided by the specific analytical question, the nature of the analyte, and the required data output.
HPLC is a separative technique that physically resolves individual components in a mixture before detection. It is the unequivocal choice when analyzing complex samples containing multiple analytes, impurities, or degradants, or when the identity of compounds is unknown [6]. The coupling of separation with detection (e.g., LC-MS) provides both qualitative (retention time, spectral data) and quantitative information in a single run [2] [1].
In contrast, standalone electroanalytical methods (e.g., using a glassy carbon sensor) are primarily quantitative techniques that measure the total content of an electroactive species in a sample without prior separation [8]. They offer distinct advantages in speed, cost, and operational simplicity, requiring minimal sample preparation and no organic solvents, aligning with green chemistry principles [8] [9].
A recent comparative study on quantifying the sunscreen agent octocrylene in water matrices highlights these trade-offs. The study found electroanalysis to have lower limits of detection (LOD: 0.11 mg L⁻¹) and quantification (LOQ: 0.86 mg L⁻¹) compared to HPLC (LOD: 0.35 mg L⁻¹, LOQ: 2.86 mg L⁻¹) [8]. While electroanalysis was the most appropriate method for this specific quantification task, HPLC would be necessary if the goal was to separate, identify, and quantify octocrylene simultaneously from its potential degradation products or other co-formulants [8].
Therefore, the choice is not a matter of which technique is superior, but which is more fit-for-purpose. Electrochemical methods excel for rapid, targeted quantification of known electroactive compounds. HPLC and LC-ECD are essential for complex mixture analysis, method development for unknown samples, and when qualitative information is as critical as quantitative data.
The Scientist's Toolkit: Essential Reagents and Materials
Table 3: Key Research Reagent Solutions for HPLC and Electrochemical Analysis
| Item | Function/Description | Common Examples / Notes |
|---|---|---|
| HPLC Grade Solvents [1] | Serve as the mobile phase; high purity is critical to minimize baseline noise and detect trace analytes. | Acetonitrile, Methanol, Water. |
| Buffers & Additives [7] | Control mobile phase pH and ionic strength, modify selectivity, and suppress analyte ionization. | Ammonium acetate/formate, phosphate buffers, trifluoroacetic acid (TFA). |
| Stationary Phases [1] | The packed material inside the column where the separation occurs; selection is key to method development. | C18 (reversed-phase), Silica (normal-phase), Chiral selectors, Ion-exchange resins. |
| Electrolytes [8] | Conducting medium required for electrochemical detection and standalone electroanalysis. | Sodium chloride, Britton-Robinson buffer, phosphate-buffered saline (PBS). |
| Reference Standards [6] | Highly pure characterized substances used for method development, calibration, and quantification. | Pharmacopeial standards (USP, Ph. Eur.), certified reference materials (CRMs). |
Electrochemical analysis is a powerful discipline within analytical chemistry that measures electrical properties like voltage, current, or resistance to gain insights into the chemical properties of a solution. These methods have become indispensable tools across various scientific fields, including clinical diagnostics, pharmaceutical development, and environmental monitoring, due to their excellent sensitivity for trace-level analysis, wide linear dynamic range, and relatively low cost of instrumentation [10]. The fundamental principle underlying all electrochemical techniques is the redox reaction, which involves the transfer of electrons between chemical species [10]. This in-depth technical guide explores the core principles of three key electroanalytical techniques—voltammetry, amperometry, and potentiometry—framed within the context of method selection for pharmaceutical research, particularly in comparison with high-performance liquid chromatography (HPLC).
The applicability of electroanalysis in pharmaceuticals is broad, ranging from quantifying hydrogen sulfide (H₂S) donors in simulated physiological solutions [11] to detecting sunscreen agents like octocrylene in water matrices [8]. Recent studies demonstrate that electroanalysis, specifically using a glassy carbon sensor, provides an appropriate choice for quantifying recalcitrant organic compounds with limits of detection for octocrylene approximately 0.11 ± 0.01 mg L⁻¹ compared to 0.35 ± 0.02 mg L⁻¹ by HPLC [8]. This sensitivity advantage, coupled with rapid response and cost-effectiveness, positions electrochemical methods as valuable alternatives or complements to chromatographic techniques in pharmaceutical analysis.
Fundamental Principles and Setup
The Electrochemical Cell
At the heart of every electrochemical measurement is an electrochemical cell containing three essential components that enable precise control and measurement of electrical properties. The working electrode (WE) serves as the platform where the redox reaction of interest occurs, with its potential carefully controlled relative to a reference electrode [10]. The reference electrode (RE), such as a saturated calomel electrode (SCE) or silver/silver chloride (Ag/AgCl) electrode, provides a stable and known potential baseline against which the working electrode's potential is measured or controlled [10]. Completing the circuit is the counter electrode (CE), which carries the current needed to balance the current flowing at the working electrode, ensuring that the potential of the working electrode remains unaffected by the current passing through the reference electrode [10].
The relationship between chemical and electrical properties in these systems is governed by fundamental principles. Faraday's Laws of Electrolysis relate the amount of substance produced or consumed at an electrode to the quantity of electrical charge passed through the cell, forming the foundation for coulometric techniques [10]. Meanwhile, the Nernst Equation describes the relationship between the potential of an electrode and the concentration of species undergoing a redox reaction, serving as the cornerstone for potentiometric measurements [10]. Understanding these principles is essential for mastering the diverse techniques within electrochemical analysis and optimizing them for pharmaceutical applications.
Method Selection Framework
Electrochemical techniques offer distinct advantages for pharmaceutical analysis, particularly when compared to traditional chromatographic methods. The selection between these approaches depends on the specific requirements of the research project in terms of sensitivity, response time, and cost-effectiveness [11]. Table 1 compares the key characteristics of voltammetry, amperometry, and potentiometry against HPLC for pharmaceutical analysis.
Table 1: Comparison of Electroanalytical Methods and HPLC for Pharmaceutical Analysis
| Method | Principle | Detection Range | Key Pharmaceutical Applications | Advantages vs. HPLC |
|---|---|---|---|---|
| Voltammetry | Measures current as function of applied potential [10] | Nanomolar to micromolar [11] [8] | Heavy metal detection, organic compound analysis, reaction mechanism studies [12] | Higher sensitivity for specific compounds, lower operational costs, minimal sample preparation [8] |
| Amperometry | Measures current at constant potential [10] | Nanomolar to picomolar [11] | Glucose biosensors, detection of electroactive compounds in flow systems [10] [13] | Rapid response, excellent for miniaturization and point-of-care devices [10] |
| Potentiometry | Measures potential at zero current [10] | Micromolar to millimolar [11] | pH measurement, ion-selective electrodes (Na⁺, K⁺, Ca²⁺, F⁻, Cl⁻) [10] | Simple operation, non-destructive, continuous monitoring capability [10] |
| HPLC | Separation based on partitioning between mobile and stationary phases | Micromolar range [11] [8] | Broad-spectrum analysis, complex mixtures, method versatility [14] | Established validation protocols, wider applicability for non-electroactive compounds [14] |
Voltammetry
Principles and Techniques
Voltammetry encompasses a family of dynamic electrochemical techniques that measure current passing through an electrochemical cell as a function of the applied potential [10]. By systematically sweeping or pulsing the potential of the working electrode, researchers obtain a characteristic plot called a voltammogram that provides rich information about the analyte, including both identity (qualitative analysis) and concentration (quantitative analysis) [10]. The fundamental parameters obtained from voltammetric analysis include peak potential (Eₚ), which identifies the analyte, and peak current (iₚ), which is proportional to the concentration of the analyte [12].
Several voltammetric techniques have been developed, each with specific advantages for pharmaceutical analysis. Cyclic Voltammetry (CV) involves scanning the potential back and forth between two set values at a fixed rate, generating current-potential curves that provide insights into the reversibility and kinetics of redox reactions [10] [12]. The separation between oxidation and reduction peaks (ΔEₚ) indicates the reversibility of the redox reaction, with reversible systems showing ΔEₚ = 59/n mV at 25°C [12]. Differential Pulse Voltammetry (DPV) and Square Wave Voltammetry (SWV) apply small, successive potential pulses to the working electrode, significantly enhancing sensitivity for trace analysis of organic compounds and pharmaceuticals [10]. These pulsed techniques minimize background current, resulting in superior signal-to-noise ratios compared to classical voltammetry [10].
Experimental Protocol: Voltammetric Analysis
Objective: To determine the concentration of octocrylene (OC), a common sunscreen agent, in water matrices using differential pulse voltammetry (DPV) with a glassy carbon working electrode [8].
Materials and Equipment:
- Autolab PGSTAT302N potentiostat/galvanostat (Metrohm) controlled by GPES software [8]
- Three-electrode electrochemical cell:
- Britton–Robinson (BR) buffer solution (0.04 M, pH 6) as electrolyte [8]
- Stock solution of OC (1.0 × 10⁻³ M) prepared in ethyl alcohol/water mixture [8]
- Polishing paper for electrode surface preparation [8]
Procedure:
- Polish the glassy carbon working electrode with polishing paper before each measurement to ensure a fresh, reproducible surface [8].
- Transfer 10 mL of BR buffer solution (pH 6) to the electrochemical cell [8].
- Set the DPV parameters as follows [8]:
- Initial potential: -0.8 V
- Final potential: -1.5 V
- Step potential: +0.005 V
- Modulation amplitude: +0.1 V
- Modulation time: 0.02 s
- Time interval: 0.5 s
- Equilibrium time: 10 s
- Add known concentrations of OC standard solution to the cell to construct a calibration curve.
- Run the DPV measurement for each standard solution and record the current response.
- Introduce the sample with unknown OC concentration and measure its current response under identical conditions.
- Determine the OC concentration by comparing the sample current response to the calibration curve.
Data Interpretation: The peak current in the voltammogram is proportional to the concentration of OC. The method provides limits of detection (LOD) and quantification (LOQ) for OC of approximately 0.11 ± 0.01 mg L⁻¹ and 0.86 ± 0.04 mg L⁻¹, respectively, demonstrating superior sensitivity compared to HPLC for this application [8].
Amperometry
Principles and Techniques
Amperometry is an electrochemical technique that measures the current resulting from the oxidation or reduction of an analyte at a fixed potential, with the measured current being directly proportional to the concentration of the analyte [12]. Unlike voltammetry, which involves varying the potential, amperometry maintains a constant applied potential while monitoring current changes over time [10]. This technique is particularly valuable for continuous monitoring applications and when coupled with flow systems such as HPLC [10].
The most prominent application of amperometry in the pharmaceutical and clinical fields is in glucose biosensors, where the enzyme glucose oxidase catalyzes the oxidation of glucose, producing an electrical current proportional to glucose concentration [10]. Another significant advancement is pulsed amperometric detection (PAD), which extends the applicability of HPLC to substances with complex two-step redox processes [13]. PAD applies multiple potential steps that mimic sequential stages typically performed in static voltammetric measurements, enabling the detection of compounds like cinnamon biomarkers (eugenol, coumarin, cinnamaldehyde, and cinnamic acid) that require an oxidation step prior to their amperometric detection in flow conditions [13].
Experimental Protocol: Amperometric Detection in Flow Systems
Objective: To implement pulsed amperometric detection (PAD) for the determination of cinnamon biomarkers (eugenol, coumarin, cinnamaldehyde, cinnamic acid) in HPLC separation [13].
Materials and Equipment:
- HPLC system with pulsed amperometric detector [13]
- Screen-printed carbon electrode or conventional three-electrode flow cell [13]
- Mobile phase appropriate for cinnamon biomarkers separation
- Standard solutions of target biomarkers
Procedure:
- Set up the HPLC system with the appropriate column and mobile phase for separating the target biomarkers.
- Configure the PAD waveform with optimized parameters. Two scenarios may be employed [13]:
- Scenario 1: Oxidation time much greater than reduction time (tₒₓ >> tred)
- Scenario 2: Oxidation time much less than reduction time (tₒₓ << tred)
- Equilibrate the HPLC-PAD system with mobile phase until a stable baseline is achieved.
- Inject standard solutions of known concentrations to establish retention times and calibration curves.
- Inject unknown samples and quantify biomarkers based on peak areas compared to the calibration curve.
Data Interpretation: The PAD waveform parameters define the detection mechanism involved, with different oxidation and reduction times leading to either upward or downward peaks [13]. The method successfully validates the analysis of cinnamon samples, obtaining statistically comparable results to those obtained by HPLC-UV [13].
Potentiometry
Principles and Techniques
Potentiometry is a zero-current electrochemical technique that measures the potential difference between two electrodes when no net current is flowing through the cell [10]. This potential provides a direct function of the concentration or activity of a specific ion in the solution, as described by the Nernst equation [10]. The simplicity, reliability, and non-destructive nature of potentiometric measurements have made them foundational in both clinical and pharmaceutical laboratories.
The most ubiquitous application of potentiometry is pH measurement using a glass electrode, where the potential changes in response to the activity of hydrogen ions (H⁺) in the solution [10]. Beyond pH, ion-selective electrodes (ISEs) represent a powerful extension of potentiometry, designed to respond selectively to a single type of ion [10]. These electrodes are extensively used to measure ions including sodium (Na⁺), potassium (K⁺), calcium (Ca²⁺), fluoride (F⁻), and chloride (Cl⁻), making them indispensable in clinical laboratories for electrolyte analysis and in environmental monitoring for water quality assessment [10]. Another important application is potentiometric titration, where a titrant is added to a solution while monitoring the potential of an indicator electrode, with the endpoint determined by a sharp change in potential rather than a visual indicator [10].
Experimental Protocol: Hydrogen Sulfide Quantification
Objective: To quantify hydrogen sulfide (H₂S) in simulated physiological solutions using a potentiometric (voltametric) technique with a sulfide-selective electrode [11].
Materials and Equipment:
- Shelf Scientific Lazar electrode [11]
- Antioxidant buffer: 25 g sodium salicylate, 6.5 g ascorbic acid, and 8.5 g NaOH in 100 ml deionized water, diluted fourfold before use [11]
- Standard NaSH solutions prepared in diluted antioxidant buffer [11]
- Simulated tear fluid (STF) or phosphate-buffered saline (PBS) at pH 7.4 as release media [11]
Procedure:
- Prepare diluted antioxidant buffer (DAOB) by fourfold dilution of the stock antioxidant buffer solution [11].
- Soak the sulfide-selective electrode in the lowest NaSH concentration (e.g., 0.1 μM) for 30 minutes to condition [11].
- Rinse the electrode with deionized water and record baseline measurement with DAOB [11].
- Add standard NaSH solutions in order from lowest to highest concentration, recording a stabilized reading for each concentration [11].
- Construct a calibration curve by plotting the signal (mV) against NaSH concentration (μM) [11].
- Measure samples with unknown H₂S concentration and determine concentration from the calibration curve.
Data Interpretation: The potentiometric method quantifies H₂S in the nanomole range and is less time-consuming than colorimetric or chromatographic methods [11]. The antioxidant buffer is crucial for stabilizing sulfide species and obtaining reproducible measurements.
Method Selection Framework for Pharmaceutical Analysis
Electrochemical vs. HPLC Methods
The selection between electrochemical and chromatographic methods for pharmaceutical analysis requires careful consideration of the specific analytical requirements, sample characteristics, and practical constraints. Electrochemical methods offer distinct advantages in situations requiring high sensitivity for electroactive compounds, minimal sample preparation, and cost-effective operation [11] [8]. For instance, electrochemical methods successfully quantified hydrogen sulfide in nanomolar to picomolar ranges, significantly lower than colorimetric (millimolar) or chromatographic (micromolar) methods [11]. Similarly, for octocrylene detection, electroanalysis provided approximately three times lower detection limits compared to HPLC (0.11 mg L⁻¹ vs. 0.35 mg L⁻¹) [8].
Conversely, HPLC methods remain the gold standard for many pharmaceutical applications due to their exceptional separation capability, broad applicability to diverse compound classes, and well-established validation protocols [14]. HPLC excels at analyzing complex mixtures and can be coupled with various detection systems, including UV, fluorescence, and mass spectrometry, enhancing its versatility [14]. However, HPLC typically requires more extensive sample preparation, longer analysis times, and higher operational costs compared to electrochemical methods [8].
Decision Framework and Workflow
Graphviz Diagram: Electrochemical vs HPLC Method Selection
Diagram Title: Pharmaceutical Analysis Method Selection
The decision framework illustrated above provides a systematic approach for selecting between electrochemical and HPLC methods based on key analytical requirements. For targeted analysis of electroactive compounds, electrochemical methods often provide superior sensitivity and faster analysis times [11] [8]. When dealing with complex mixtures containing multiple analytes, HPLC with appropriate detection (including electrochemical detection) offers superior separation capability [15] [14]. The combined approach of HPLC with electrochemical detection (HPLC-EC) leverages the strengths of both techniques, providing high separation efficiency coupled with sensitive detection for electroactive compounds [13] [15].
Research Reagent Solutions
Table 2: Essential Research Reagents and Materials for Electrochemical Pharmaceutical Analysis
| Reagent/Material | Function/Application | Example Specifications |
|---|---|---|
| Glassy Carbon Electrode | Working electrode for voltammetric analysis | 3.14 mm² geometric area, polishable surface [8] |
| Antioxidant Buffer | Stabilization of sensitive analytes like H₂S | 25 g sodium salicylate, 6.5 g ascorbic acid, 8.5 g NaOH in 100 ml water [11] |
| Britton-Robinson Buffer | Versatile electrolyte for wide pH range | 0.04 M, adjustable pH (2-12) [8] |
| Ion-Selective Membranes | Potentiometric sensors for specific ions | Na⁺, K⁺, Ca²⁺, Cl⁻ selective cocktails [10] |
| Electrode Polishing Materials | Surface renewal for reproducible measurements | Alumina slurry, polishing pads [8] |
| Faradaic Shielding | Noise reduction in sensitive measurements | Metal enclosure connected to ground |
Voltammetry, amperometry, and potentiometry represent powerful electroanalytical techniques with distinct advantages for pharmaceutical analysis. Voltammetry offers unparalleled capability for both qualitative and quantitative analysis of electroactive species, with pulsed techniques providing exceptional sensitivity into the nanomolar range [10] [8]. Amperometry excels in continuous monitoring applications and when integrated with flow systems, with pulsed amperometric detection extending applicability to compounds with complex redox behavior [13]. Potentiometry provides simple, reliable measurements of ionic species and activity, forming the foundation for pH measurement and ion-selective electrodes [10].
When strategically selected based on specific analytical requirements, electrochemical methods can provide superior sensitivity, faster analysis times, and more cost-effective operation compared to chromatographic techniques for appropriate applications [11] [8]. The continuing evolution of electrode materials, surface modification strategies, and miniaturization approaches ensures that electrochemical analysis will maintain its relevance and expand its applications in pharmaceutical research and quality control [10] [12]. By understanding the fundamental principles, methodological details, and comparative advantages outlined in this technical guide, researchers can make informed decisions about method selection and implementation to address their specific analytical challenges in pharmaceutical development.
High-Performance Liquid Chromatography with Electrochemical Detection (HPLC-ECD) represents a powerful hybrid analytical technique that combines exceptional separation capabilities with high sensitivity and selectivity for the analysis of electroactive compounds. In the pharmaceutical research landscape, where method selection critically impacts research outcomes, HPLC-ECD occupies a unique position between conventional HPLC methods and more complex mass spectrometry-based approaches [16]. This technique is particularly invaluable for quantifying biologically significant molecules at trace levels in complex matrices, enabling researchers to address critical questions in drug metabolism, neuropharmacology, and biomarker discovery.
The fundamental strength of the hybrid HPLC-ECD approach lies in its dual-phase methodology: chromatographic separation followed by highly selective electrochemical detection. This combination allows for precise quantification of specific analytes that are often challenging to measure using other techniques, especially in biological samples where interfering compounds may be present at much higher concentrations [17]. For pharmaceutical professionals selecting analytical methods, understanding the capabilities, limitations, and optimal applications of HPLC-ECD is essential for designing robust and reproducible analytical workflows.
Principles and Mechanisms of HPLC-ECD
Core Components and Separation Principles
The HPLC-ECD system operates through a sequential process where separation precedes detection. The chromatographic phase utilizes a stationary phase packed into a column and a liquid mobile phase that transports the sample under high pressure. Separation occurs based on the differential partitioning of analytes between the mobile and stationary phases, with factors such as hydrophobicity, ionic interactions, and molecular size influencing retention times [18] [19]. This separation is crucial for resolving complex mixtures into individual components before they reach the detection cell.
Following chromatographic separation, the eluent passes through an electrochemical detector where quantification occurs. The detection principle relies on the redox properties of target analytes. When electroactive compounds pass between working and counter electrodes in the flow cell, they undergo oxidation (lose electrons) or reduction (gain electrons) at specific applied potentials [17]. This electron transfer generates a measurable current that is directly proportional to the concentration of the analyte, enabling highly sensitive quantification [17].
Electrochemical Detection Modalities
HPLC-ECD systems primarily utilize two types of electrochemical detection: amperometric and coulometric. Amperometric detection employs a solid working electrode with a smooth surface (typically glassy carbon) where only a fraction (1-10%) of the analyte undergoes electrolysis [17]. This approach offers high sensitivity with low noise levels and is particularly well-suited for microdialysis samples and trace analysis [17].
In contrast, coulometric detection utilizes porous graphite electrodes with a large surface area that enables nearly 100% electrolysis of the analytes [17]. While potentially slightly less sensitive than amperometric detection due to higher background noise, coulometric cells are advantageous for applications requiring complete conversion of the analyte, such as in preparatory electrolysis or for compounds that require derivatization for detection [17]. The choice between these detection modes depends on the specific analytical requirements, with amperometry generally preferred for maximum sensitivity and coulometry for complete analyte conversion.
Table: Comparison of Electrochemical Detection Modalities
| Parameter | Amperometric Detection | Coulometric Detection |
|---|---|---|
| Electrode Surface | Solid, smooth (e.g., glassy carbon) | Porous graphite |
| Electrolysis Efficiency | Partial (1-10%) | Nearly 100% |
| Sensitivity | Higher (lower noise) | Slightly lower |
| Best For | Trace analysis, microdialysis | Complete conversion, derivatized compounds |
| Maintenance | Regular polishing required | Less frequent maintenance |
Detection Process Workflow
The following diagram illustrates the fundamental signaling pathway and operational workflow of an HPLC-ECD system:
HPLC-ECD Operational Workflow
HPLC-ECD in Pharmaceutical Research Applications
Neurotransmitter Analysis in Neuroscience Drug Development
HPLC-ECD has established itself as a gold standard technique for monitoring neurotransmitter dynamics in neuroscience drug discovery and development. The method provides exceptional sensitivity for monoamine neurotransmitters and their metabolites, with detection capabilities in the femtomolar to picomolar range [16] [20]. This sensitivity is crucial for analyzing microdialysis samples from brain tissue, where sample volumes are small and analyte concentrations are extremely low [21].
Key neurotransmitter targets include dopamine, serotonin (5-HT), norepinephrine, and their metabolites such as DOPAC, HVA, and 5-HIAA [16] [21]. The ability to monitor these compounds in real-time during pharmacological experiments provides invaluable insights into drug mechanisms of action, blood-brain barrier penetration, and neurochemical effects of candidate compounds [16]. For instance, in substance abuse research, HPLC-ECD has been utilized to investigate how experimental compounds affect dopamine and serotonin signaling during long-term behavioral experiments [16].
Analysis of Pharmaceuticals and Metabolites
Beyond neurotransmitter monitoring, HPLC-ECD finds extensive application in the quantification of pharmaceutical compounds and their metabolites in biological fluids. The technique has been successfully applied to diverse drug classes including piperazine antihistamines (cetirizine, cyclizine, meclizine), where it offers limits of detection in the nanomolar range—significantly enhancing sensitivity compared to spectrophotometric methods [22].
HPLC-ECD has also been employed for sensitive determination of vitamin D metabolites in plasma, achieving detection limits of approximately 50 pg mL⁻¹ for 25-hydroxyvitamin D₃ and 24,25-dihydroxyvitamin D₃ [23]. This application demonstrates the technique's utility in nutritional assessment and clinical diagnostics. Furthermore, HPLC-ECD enables measurement of low levels of antioxidants in food and pharmaceutical products, facilitating studies on their distribution and consumption in complex matrices [24].
Comparative Analytical Performance
When selecting analytical methods for pharmaceutical research, understanding the performance characteristics of available techniques is essential. The following table compares HPLC-ECD with alternative chromatography-based approaches:
Table: Comparison of HPLC-ECD with Alternative Chromatographic Methods
| Parameter | HPLC-ECD | HPLC-UV/VIS | LC-MS/MS |
|---|---|---|---|
| Sensitivity | High (femtomole-picomole) | Moderate (nanomole) | Very High (sub-picomole) |
| Selectivity | Excellent for electroactive compounds | Moderate | Excellent |
| Sample Preparation | Simple (often only filtration) | Moderate | Complex (SPE, derivatization) |
| Run Time | 5-30 minutes | 15-45 minutes | 15-45 minutes |
| Cost per Sample | ~$2-5 | ~$5-10 | ~$10-30 |
| Instrument Cost | ~$45k-80k | ~$50k-100k | ~$250k-450k |
| Best For | Targeted electroactive analytes | Broad-range screening | Multiplexed analysis, unknown ID |
Experimental Design and Methodologies
Standard Protocol for Neurotransmitter Analysis
A validated experimental protocol for monoamine neurotransmitter analysis typically involves the following steps:
Sample Preparation: Microdialysis samples, tissue homogenates, or biological fluids are typically prepared using simple filtration (0.22 μm membrane) to remove particulate matter [16] [20]. For tissue samples, homogenization in perchloric or phosphoric acid (0.1-0.2 M) containing an antioxidant such as sodium metabisulfite (0.1-0.2 mM) is recommended to stabilize monoamines against oxidation [21]. Samples are then centrifuged at 10,000-15,000 × g for 15-20 minutes at 4°C, and the supernatant is collected for analysis.
Chromatographic Conditions:
- Column: Reversed-phase C18 column (150 × 3.0 mm, 3 μm particle size)
- Mobile Phase: 50-100 mM phosphate or citrate buffer (pH 3.0-3.5), ion-pairing agent (0.5-1.0 mM octanesulfonic acid), 5-10% methanol or acetonitrile
- Flow Rate: 0.4-0.6 mL/min
- Temperature: 25-30°C
- Injection Volume: 10-50 μL [16] [21]
Electrochemical Detection Parameters:
- Working Electrode: Glassy carbon
- Reference Electrode: Ag/AgCl
- Applied Potential: +0.6 to +0.8 V (vs. reference)
- Data Collection: Current output sampled at 10 Hz [17] [21]
Method for Pharmaceutical Compound Analysis
For the analysis of piperazine antihistamines in biological matrices, the following method has been demonstrated [22]:
Sample Preparation: Plasma samples (100-200 μL) are protein-precipitated with 2 volumes of acetonitrile or methanol containing an internal standard (e.g., diclofenac). After vortex mixing for 30 seconds and centrifugation at 12,000 × g for 10 minutes, the supernatant is transferred to autosampler vials for analysis.
Chromatographic Conditions:
- Column: ARION-CN column (3 μm particle size)
- Mobile Phase: 50 mM phosphate buffer (pH 3.0) and methanol (45:55, v/v)
- Flow Rate: 0.8 mL/min
- Temperature: 25°C
- Run Time: 15 minutes
Electrochemical Detection:
- Working Electrode: Nickel oxide nanoparticle-modified carbon fiber microelectrode
- Applied Potential: +1500 mV (vs. Ag/AgCl)
- Linear Range: Up to 5 μmol L⁻¹
- LOD: 3.8-120 nM, depending on the specific drug [22]
Optimization Strategies for Enhanced Performance
Method development in HPLC-ECD requires careful optimization of multiple parameters. The mobile phase pH significantly impacts both chromatographic separation and electrochemical response, with lower pH (3.0-4.0) generally enhancing resolution and detection sensitivity for monoamines [17]. The applied potential must be optimized for each analyte class using hydrodynamic voltammetry studies to maximize sensitivity while minimizing background noise [17] [24].
Electrode maintenance is crucial for reproducible results. Glassy carbon electrodes require regular polishing with alumina slurry (0.05-0.1 μm) to maintain a clean, reactive surface [21]. For complex applications, dual-electrode configurations can enhance selectivity by using different potentials at each electrode or employing redox mode, where compounds are first reduced then oxidized (or vice versa) [17].
The Scientist's Toolkit: Essential Research Reagents and Materials
Successful implementation of HPLC-ECD methods requires specific reagents and materials optimized for electrochemical detection. The following table details essential components:
Table: Essential Research Reagents and Materials for HPLC-ECD
| Item | Function | Application Notes |
|---|---|---|
| HPLC-ECD System | Integrated liquid chromatography with electrochemical detector | Should include degasser, pump, autosampler, temperature-controlled column compartment, and electrochemical cell |
| C18 Reverse Phase Column | Chromatographic separation of analytes | 150 × 3.0 mm, 3 μm particle size; compatible with low pH mobile phases |
| Glassy Carbon Working Electrode | Site of electrochemical oxidation/reduction | Requires weekly polishing with alumina slurry for optimal performance |
| Phosphate/Citrate Buffer | Mobile phase component | 50-100 mM, pH 3.0-3.5; provides proton source and controls ionization |
| Ion-Pairing Reagent | Enhances retention of polar compounds | 0.5-1.0 mM octanesulfonic acid or heptanesulfonic acid |
| Methanol/Acetonitrile | Organic mobile phase modifier | HPLC grade; 5-15% concentration for gradient elution |
| Antioxidants | Stabilize easily oxidized analytes | Sodium metabisulfite (0.1-0.2 mM) or ascorbic acid in sample preparation |
| Standard Compounds | Method development and quantification | High-purity neurotransmitters, metabolites, or pharmaceutical compounds |
Complementary Role in Analytical Workflows
HPLC-ECD should not be viewed as competing with but rather complementing other chromatographic techniques in pharmaceutical research. The following diagram illustrates how HPLC-ECD fits within an integrated analytical strategy:
HPLC-ECD Complementary Workflow
As illustrated, HPLC-ECD serves as an ideal tool for high-throughput routine analysis of known electroactive compounds, while LC-MS/MS provides complementary capabilities for broad metabolite profiling and structural identification of unknown compounds [16]. This hybrid approach maximizes laboratory efficiency by allocating resources appropriately based on analytical needs.
Many research laboratories successfully employ both platforms, using HPLC-ECD for rapid, cost-effective monitoring of core analytes and LC-MS/MS for method validation, expanded panels, and discovery applications [16]. This strategy combines the operational efficiency of HPLC-ECD (~$2-5 per sample) with the comprehensive analytical power of LC-MS/MS, providing both economic and scientific benefits [16].
HPLC-ECD continues to evolve as a robust and highly relevant analytical technique in pharmaceutical research. Recent innovations include nanomaterial-modified electrodes that enhance sensitivity and lower oxidation potentials through electrocatalysis [22]. These advancements expand the range of analyzable compounds and improve detection limits for challenging analytes.
The development of multi-channel electrochemical array detectors represents another significant advancement, enabling simultaneous detection at different potentials for enhanced selectivity [24]. Additionally, miniaturized detection systems with microelectrodes show promise for analyzing very small sample volumes, such as in single-cell analysis or microdialysis studies [22].
In conclusion, the hybrid approach of HPLC with electrochemical detection provides pharmaceutical researchers with a powerful tool for quantifying electroactive compounds at trace levels in complex biological matrices. Its unique combination of sensitivity, selectivity, and operational efficiency ensures its continued relevance in drug discovery and development. When strategically integrated with complementary techniques like LC-MS/MS within analytical workflows, HPLC-ECD becomes an indispensable component of a comprehensive pharmaceutical research strategy, enabling scientists to address challenging analytical questions with confidence and precision.
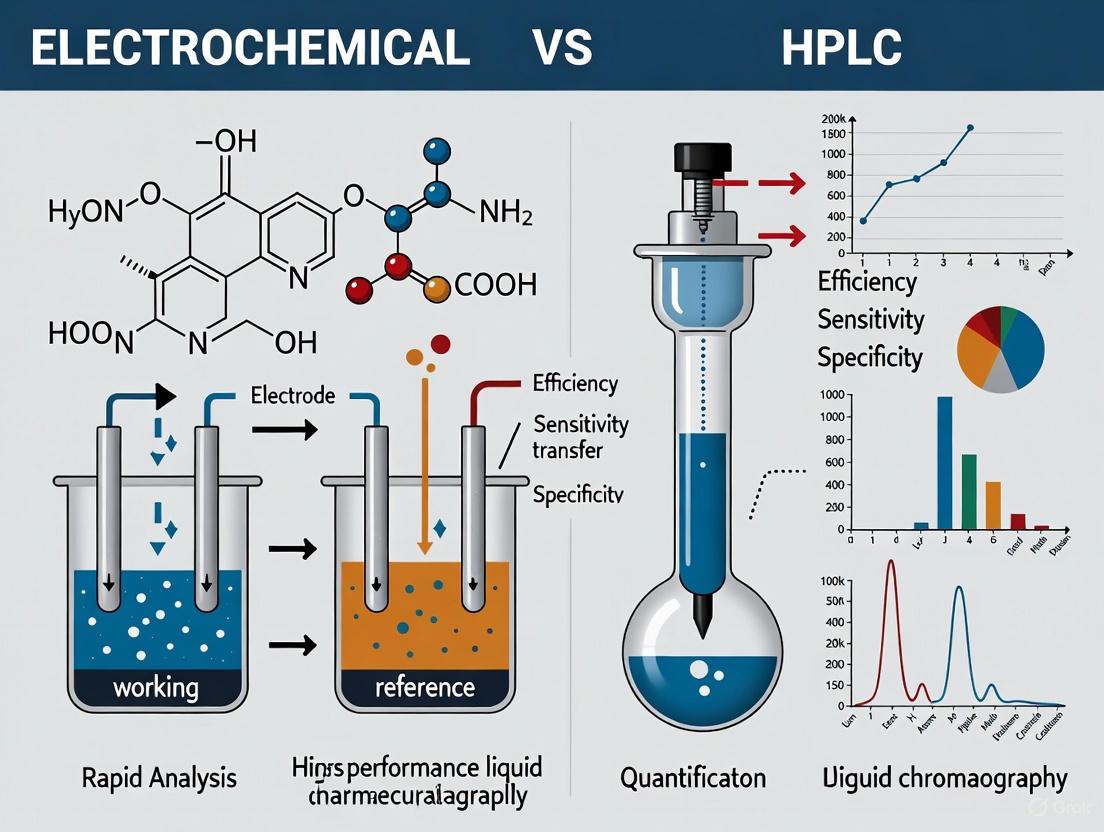
In the rigorous world of pharmaceutical research and development, the selection of an analytical technique is a critical decision that balances sensitivity, selectivity, speed, and cost. High-Performance Liquid Chromatography (HPLC) and electrochemical methods represent two foundational pillars, each with distinct capabilities and optimal application domains. HPLC excels as a separation powerhouse, capable of resolving complex mixtures into individual components for identification and quantification [25] [26]. In contrast, electrochemical techniques offer remarkable sensitivity for detecting electroactive compounds, often at trace levels far below the reach of other detectors [27] [28]. This whitepaper provides a structured comparison of these techniques, offering scientists a clear framework for method selection based on specific analytical needs within pharmaceutical workflows. By understanding their complementary strengths, researchers can better leverage these tools to enhance drug development, quality control, and biomedical research.
High-Performance Liquid Chromatography (HPLC): The Separation Workhorse
Core Principles and Pharmaceutical Applications
HPLC operates on the principle of partitioning analytes between a stationary phase (column packing) and a mobile phase (liquid solvent). Components of a mixture are separated based on their differential interactions with these phases as they are pumped under high pressure through the column [25] [14]. The versatility of HPLC stems from the ability to fine-tune these interactions by selecting different stationary phases (e.g., C18, cyano, phenyl), modifying mobile phase composition, pH, and temperature [14].
The applications of HPLC in the pharmaceutical industry are extensive and critical to ensuring drug safety and efficacy:
- Drug Development and Formulation: Analyzing chemical composition, stability, solubility, and compatibility of drug candidates and formulation ingredients [26].
- Quality Control and Assurance: Verifying the identity, purity, and potency of active pharmaceutical ingredients (APIs), excipients, and finished products to comply with pharmacopeial standards (e.g., USP) [26].
- Impurity and Degradation Profiling: Identifying and quantifying impurities and degradation products in APIs and finished products to ensure patient safety [26].
- Bioavailability and Bioequivalence Studies: Measuring drug concentrations in biological fluids like plasma and serum to determine pharmacokinetic profiles [25] [26].
- Dissolution Testing: Monitoring the release of APIs from pharmaceutical formulations to assess performance [29].
- Cleaning Validation: Detecting residual APIs or cleaning agents on manufacturing equipment to prevent cross-contamination [26].
Key Detector Types and Their Performance
A critical strength of HPLC is its compatibility with a diverse array of detectors, each suited for different analytes. The table below summarizes the common detectors and their typical uses.
Table 1: Common HPLC Detectors and Their Characteristics
| Detector Type | Principle | Best For | Limitations |
|---|---|---|---|
| Ultraviolet/VIS (UV/VIS) | Measures absorption of ultraviolet or visible light [25]. | Compounds with chromophores; excellent linearity; versatile [25] [14]. | Lacks specificity; may require high resolution; poor for compounds with weak chromophores [25]. |
| Diode Array (DAD) | Measures absorbance across a spectrum of wavelengths [25]. | Peak identification and purity monitoring [25]. | Generally less sensitive than single-wavelength UV detectors [25]. |
| Fluorescence | Measures light emitted by excited molecules [25]. | Native fluorescent compounds or those that can be derivatized; high sensitivity and selectivity [25] [14]. | Limited to specific compound classes. |
| Electrochemical (ECD) | Measures current from oxidation/reduction reactions [25] [27]. | Electroactive species (e.g., catecholamines, antioxidants); very high sensitivity and selectivity [25] [27] [28]. | Limited to electroactive compounds; can be affected by matrix interference. |
| Mass Spectrometry (MS) | Measures mass-to-charge ratio of ionized molecules [25]. | Unparalleled compound identification and quantification; structural elucidation [25]. | High cost, complex operation, and can suffer from matrix effects [27]. |
Electrochemical Methods: The Epitome of Sensitivity
Fundamental Principles and Techniques
Electroanalysis encompasses a suite of techniques that measure electrical properties—such as current, potential, or charge—resulting from redox reactions involving an analyte at an electrode surface [30]. The exceptional sensitivity of these methods arises from the direct transduction of a chemical event (electron transfer) into an easily measurable electrical signal [31].
Common electrochemical techniques include:
- Voltammetry: Measures current as a function of an applied potential. Key variants include:
- Cyclic Voltammetry (CV): Primarily used for qualitative studies of redox mechanisms and reaction kinetics [30].
- Differential Pulse Voltammetry (DPV) and Square Wave Voltammetry (SWV): Pulse techniques that minimize charging current, resulting in significantly lower background noise and superior sensitivity for trace-level quantification [8] [30].
- Amperometry: Measures current at a constant potential, often used in continuous monitoring and detection in flow systems like HPLC [32] [27].
- Potentiometry: Measures potential at zero current, commonly used with ion-selective electrodes (e.g., pH electrodes) [30].
Pharmaceutical and Biomedical Applications
The high sensitivity and selectivity of electrochemical methods make them ideal for specific, challenging applications:
- Neurotransmitter Analysis: Quantifying catecholamines (dopamine, norepinephrine), serotonin, and their metabolites in brain tissue and biological fluids at ultra-low concentrations for neurological and psychiatric research [27].
- Pharmaceutical Antioxidant Analysis: Detecting electroactive antioxidants like Vitamin C (ascorbic acid) in foods, supplements, and biological samples with superior sensitivity compared to titration or spectrophotometry [28].
- Therapeutic Drug Monitoring (TDM): Measuring low concentrations of electroactive drugs and their metabolites in serum, plasma, or urine [30].
- Environmental Monitoring of Pharmaceuticals: Detecting and quantifying persistent pharmaceutical residues, such as the sunscreen agent octocrylene, in water matrices [8].
- Enzyme Kinetics and Inhibitor Screening: Studying enzyme mechanisms and inhibitor binding, as demonstrated with horseradish peroxidase, without the need for additional substrates that can interfere [31].
Direct Comparison: Quantifying the Performance Gap
Sensitivity and Limit of Detection (LOD)
The most pronounced difference between the techniques lies in their achievable sensitivity for electroactive analytes. The following table compares performance metrics for specific compounds analyzed by both methods.
Table 2: Quantitative Comparison of Sensitivity: Electrochemical vs. HPLC Methods
| Analyte | Sample Matrix | Electchemical Method (LOD) | HPLC with Common Detectors (LOD) | Citation |
|---|---|---|---|---|
| Octocrylene (OC) | Water, Sunscreen | 0.11 mg L⁻¹ (Electroanalysis with GCS) | 0.35 mg L⁻¹ (HPLC-UV) | [8] |
| Vitamin C (VC) | Honey, Fruit | 0.0043 µg mL⁻¹ (HPLC-ECD) | Not specified for HPLC-DAD, but method is less suited for low VC levels [28] | [28] |
| Neurotransmitters (e.g., DA, SER) | Rat Brain Tissue | 0.01 - 0.03 ng/mL (HPLC-ECD) | HPLC-MS/MS is typical, but can suffer from matrix interference [27] | [27] |
The data consistently shows that electrochemical detection, whether used as a stand-alone technique or as a detector in HPLC, provides significantly lower (superior) limits of detection for electroactive species. For example, in the analysis of Vitamin C, HPLC-ECD achieves an LOD in the picogram-per-milliliter range, making it suitable for samples with very low VC content where common HPLC-DAD methods would fail [28]. Similarly, for neurotransmitters, the LODs in the sub-nanogram-per-milliliter range are crucial for analyzing these low-concentration biomarkers in complex brain tissues [27].
Operational and Practical Considerations
Beyond raw sensitivity, the techniques differ significantly in their operational characteristics, influencing their suitability for different laboratory environments and applications.
Table 3: Operational Comparison: Electrochemical Methods vs. HPLC
| Characteristic | Electrochemical Methods | HPLC |
|---|---|---|
| Selectivity | High for electroactive compounds, but can be susceptible to interference from other electroactive species in the matrix [27]. | Superior for complex mixtures; selectivity is achieved through chromatographic separation combined with detector choice [25] [26]. |
| Sample Throughput | Rapid response; can be very high for direct analysis [8] [31]. | Generally slower per analysis due to required separation time, but can be automated [14]. |
| Cost & Complexity | Lower cost, simpler instrumentation, minimal solvent consumption [8] [30]. | Higher capital cost, expensive solvent consumption, more complex maintenance [8]. |
| Sample Preparation | Can be minimal, but often requires careful optimization to mitigate matrix effects (e.g., protein precipitation) [27]. | Typically required to protect the column and ensure accuracy (e.g., extraction, filtration, clean-up) [25] [14]. |
| Robustness | Can be prone to electrode fouling, requiring surface renewal [8] [30]. | Generally robust and reproducible when methods are well-developed and validated [14] [26]. |
Decision Framework and Experimental Protocols
Method Selection Guide
The following workflow diagram provides a systematic guide for scientists to select the most appropriate analytical technique based on their project's primary requirements.
Experimental Protocol: HPLC-ECD for Neurotransmitters
The following protocol, adapted from a 2023 study, details the simultaneous determination of nine neurotransmitters in rat brain tissue, showcasing a powerful synergy of separation and sensitivity [27].
1. Reagent Solutions:
- Stability Solution (0.1 M perchloric acid + 0.1 mM sodium metabisulfite): Prevents oxidation of sensitive neurotransmitters during preparation and storage [27].
- Mobile Phase: A complex, buffered aqueous solution containing 0.07 M KH₂PO₄, 20 mM citric acid, 5.3 mM ion-pairing reagent (e.g., 1-octanesulfonic acid, OSA), 100 μM EDTA, 3.1 mM triethylamine, 8 mM KCl, and 11% (v/v) methanol. The solution is filtered through a 0.22 μm membrane before use [27].
2. Instrumentation and Separation:
- Column: F5 stationary phase (e.g., Kinetex F5, 150 mm x 4.6 mm, 2.6 μm).
- System: HPLC system equipped with an electrochemical detector (e.g., DECADE II) operating in amperometric mode.
- Conditions: Isocratic elution. The working electrode potential is typically set between +0.6 V to +0.8 V vs. a reference electrode for oxidizing monoamines.
3. Sample Preparation:
- Homogenize the brain tissue in the cold stability solution.
- Centrifuge the homogenate at high speed (e.g., 10,000-15,000 g) for 10-15 minutes at 4°C.
- Filter the supernatant through a 0.22 μm syringe filter before injection into the HPLC-ECD system.
4. Method Validation: The method should be validated for selectivity, linearity (r > 0.99), precision, accuracy, and limits of detection and quantification (LOD/LOQ) as per FDA/EMA guidelines [27].
The Scientist's Toolkit: Essential Reagents and Materials
Table 4: Key Research Reagent Solutions for HPLC and Electrochemical Analysis
| Reagent/Material | Function | Example Use Case |
|---|---|---|
| Ion-Pairing Reagents | Modifies retention of ionic analytes on reversed-phase columns. | Heptanesulfonate for sulphonamides; OSA for basic neurotransmitters [25] [27]. |
| Stability Solutions | Prevents degradation of labile analytes during processing. | Perchloric acid/Sodium metabisulfite for catecholamines and ascorbic acid [27] [28]. |
| Chiral Selectors | Enables separation of enantiomers, which may have different pharmacological effects. | Chiral stationary phases (e.g., proteins, cyclodextrins) for compounds like thalidomide [25]. |
| Nafion Polymer | A cation-exchange polymer used to immobilize enzymes and prevent fouling. | Used to create HRP-based biosensors for hydrogen peroxide detection [31]. |
| Glassy Carbon Electrode | A common working electrode with a wide potential window and low background current. | Used for voltammetric detection of octocrylene in water and other analytes [8] [31]. |
HPLC and electrochemical methods are not competing but rather complementary techniques in the pharmaceutical scientist's arsenal. The choice is unequivocally driven by the analytical question: HPLC is indispensable when the key challenge is the separation of a target from a complex mixture, while electrochemical methods are superior when the paramount requirement is ultra-sensitive detection of an electroactive compound.
The future lies in the intelligent integration and advancement of these techniques. Trends include the wider adoption of HPLC-ECD to harness the strengths of both worlds, the development of miniaturized, portable electrochemical sensors for point-of-care testing, and the integration of nanomaterials and artificial intelligence to create smarter, more sensitive, and more robust analytical systems [30]. By applying the clear decision framework and understanding the quantitative performance differences outlined in this guide, researchers can make informed choices that accelerate drug development and enhance analytical precision.
The selection of an appropriate analytical method is a critical determinant of success in pharmaceuticals research. This choice dictates the reliability, efficiency, and cost-effectiveness of quantifying active pharmaceutical ingredients (APIs), monitoring metabolites, and ensuring product quality. The process involves applying a specific technique to a particular analyte within a given sample matrix, and its success hinges on meeting key design criteria such as accuracy, precision, sensitivity, and selectivity [33]. Within the context of a broader thesis on analytical method selection, this guide provides a structured framework for choosing between electrochemical methods and high-performance liquid chromatography (HPLC) coupled with various detectors. The decision is primarily governed by three fundamental analyte properties: electroactivity, volatility, and the complexity of the sample matrix. By systematically evaluating these properties, researchers can navigate the selection process to develop robust analytical protocols tailored to specific challenges in drug development and quality control.
Core Analyte Properties and Method Selection
The intrinsic physicochemical properties of an analyte are the primary factors guiding the selection of an appropriate analytical technique. The following diagram illustrates the core decision-making workflow for selecting between electrochemical and HPLC methods based on these properties.
Electroactivity
Electroactivity refers to an analyte's ability to undergo oxidation or reduction at a working electrode surface when an appropriate potential is applied. This property is the cornerstone of electrochemical detection.
Method Implication: If an analyte is electroactive, electrochemical detection (ECD) becomes a prime candidate. ECD can be coupled with separation techniques like capillary electrophoresis (CE) or HPLC. For example, neurotransmitters like dopamine and serotonin are electroactive, making HPLC-ECD a standard method for their determination in neurological research [21] [34]. The key advantage is exceptional sensitivity for these specific compounds, often achieving detection limits in the low nanomolar to picomolar range [35].
Determination: An analyte's electroactivity can be confirmed through preliminary voltammetric techniques, such as cyclic voltammetry, which helps establish the optimal operating potential for detection [36].
Volatility
Volatility describes the tendency of a substance to transition into the gas phase. This property is critical for gas-phase separation techniques.
- Method Implication: Volatile compounds, or those that can be easily and reliably chemically derivatized into volatile forms, are ideally suited for gas chromatography (GC). A common drawback of GC is that it often requires derivatization to make compounds more volatile, which adds complexity to sample preparation [21]. For non-volatile and thermally labile compounds, which encompass most pharmaceuticals and their metabolites, HPLC is the superior choice as it operates in the liquid phase at ambient or controllable temperatures.
Matrix Complexity
Matrix Complexity refers to the number and concentration of interfering substances present in the sample alongside the target analyte. Biological samples (e.g., plasma, serum, brain homogenate) represent some of the most complex matrices.
- Method Implication: A highly complex matrix necessitates a high-resolution separation step prior to detection.
- Stand-alone electrochemical sensors can be susceptible to interference from other electroactive species in the matrix, which limits their direct application [36].
- HPLC excels in such environments. Its powerful separation capability physically resolves the analyte from interferents before it reaches the detector. This is why HPLC-ECD is so effective for analyzing neurotransmitters in microdialysis samples from the brain; the chromatography separates the monoamines from their metabolites and other endogenous compounds before sensitive electrochemical detection [21].
- Coupling CE with ECD also provides a separation dimension to mitigate matrix effects, making CE-EC a viable platform for complex samples like those in anti-doping analysis [37].
Comparative Technical Profiles of Analytical Methods
The table below provides a quantitative comparison of key analytical techniques to guide the selection process.
Table 1. Technical comparison of analytical methods
| Method | Optimal Analyte Profile | Typical Sensitivity (LOD) | Key Advantages | Primary Limitations |
|---|---|---|---|---|
| HPLC-ECD | Electroactive, non-volatile, in complex matrices [21] [36] | ~0.5 fmol (e.g., for serotonin) [21] | High selectivity & sensitivity for electroactive species; low operating cost; wide linear dynamic range (>6 orders) [21] [36] | Limited to electroactive compounds; electrode surface can be passivated/fouled [36] |
| HPLC-MS | Non-volatile, thermally labile, in complex matrices | High (e.g., nM-pM range) | Universal detection; high sensitivity and selectivity; provides structural information | High equipment cost and maintenance; complex operation; ion suppression effects |
| GC-MS | Volatile or derivatizable | High (e.g., nM-pM range) | High resolution; excellent sensitivity; robust compound libraries | Requires volatility; often needs derivatization; not ideal for thermally labile compounds [21] |
| CE-ECD | Electroactive, charged/chargeable, limited sample volume [37] | Nanomole to picomole range [35] | High separation efficiency; very small sample requirements; cost-effective | Lower reproducibility vs. HPLC; more susceptible to matrix effects [37] |
| Stand-alone Electrochemical Sensors | Electroactive, in simple or pre-treated matrices | Nanomole range [35] | Rapid analysis; potential for miniaturization & on-site testing; low cost | Low selectivity in complex matrices without separation; sensor fouling [36] |
Detailed Experimental Protocols
Protocol 1: HPLC-ECD for Neurotransmitters in Microdialysate
This protocol is adapted from methods used to quantify monoamine neurotransmitters and their metabolites in brain microdialysate samples, crucial for neuropharmacology studies [21].
1. Sample Preparation:
- Collect microdialysate samples directly from the perfusion system into vials containing a small volume of antioxidant preservative (e.g., 0.1 M perchloric acid or a solution of ascorbic acid/EDTA) to prevent oxidative degradation of catecholamines and indolamines [21].
- Centrifuge the samples at high speed (e.g., 12,000 × g for 10 minutes at 4°C) to remove any particulate matter.
- The supernatant can be directly injected into the HPLC system. Minimal preparation is a key advantage of HPLC-ED, as extensive clean-up is often unnecessary due to the selectivity of the detection [36].
2. HPLC Separation Conditions:
- Column: A reverse-phase (RP) C18 column (e.g., 150 mm × 4.6 mm, 5 µm particle size) is standard. For higher efficiency, a UHPLC column with smaller particles (e.g., <2 µm) can be used [21].
- Mobile Phase: A buffered aqueous-organic mixture. A typical composition is:
- 50-100 mM Sodium phosphate or citrate buffer, pH 3.0-4.0.
- An ion-pairing reagent (e.g., 0.1-1.0 mM Octane sulfonic acid) to improve the retention of polar amines.
- 5-15% Methanol or Acetonitrile as the organic modifier.
- The mobile phase must be degassed and filtered through a 0.22 µm membrane.
- Flow Rate: 0.8 - 1.2 mL/min for conventional HPLC; 0.2 - 0.5 mL/min for UHPLC.
- Temperature: Column compartment maintained at 25-30°C.
3. Electrochemical Detection:
- Detector Type: Amperometric or coulometric. Coulometric detectors with multiple electrodes in series can be used for screening interferents and increasing sensitivity [36].
- Working Electrode: Glassy Carbon (GC) electrode.
- Reference Electrode: Ag/AgCl.
- Applied Potential: Typically set between +0.6 to +0.8 V vs. Ag/AgCl for oxidizing monoamines, though the optimal potential should be determined via hydrodynamic voltammetry for each specific setup [21] [36].
- Electrode Maintenance: Polish the GC electrode weekly with alumina slurry (e.g., 0.05 µm) to maintain a reflective surface and ensure reproducibility [21].
4. Data Analysis:
- Quantify analytes by measuring peak areas and comparing them to a calibration curve constructed from external standards of known concentration. The method should be validated for linearity, accuracy, precision, LOD, and LOQ.
Protocol 2: CE-EC for Pharmaceutical Compounds
This protocol outlines a general approach for analyzing pharmaceutical compounds using Capillary Electrophoresis with Electrochemical Detection, applicable to anti-doping analysis and drug quality control [37].
1. Sample and Buffer Preparation:
- Background Electrolyte (BGE): Prepare a running buffer suitable for the analytes' charge. For basic drugs, a phosphate or borate buffer (e.g., 20-50 mM, pH 7.5-9.0) is common.
- Sample: Dissolve the sample in the BGE or water. For complex matrices like urine, a pre-treatment such as dilution, liquid-liquid extraction, or solid-phase microextraction may be necessary to reduce matrix effects [37].
- Filter all solutions through a 0.22 µm or 0.45 µm syringe filter.
2. CE-EC System Setup:
- Capillary: A fused-silica capillary (e.g., 25-75 µm inner diameter, 30-60 cm length). The length is often shorter than in HPLC to facilitate detection.
- Capillary Conditioning: Before first use, flush the capillary sequentially with 1 M NaOH for 30 min, water for 10 min, and running buffer for 20 min. Between runs, flush with buffer for 2-3 minutes.
- Separation Voltage: Apply a high voltage (e.g., 10-30 kV) for separation.
- Electrochemical Detection:
- Working Electrode: A carbon-based microelectrode (e.g., 300 µm carbon fiber) or a nanomaterial-modified electrode positioned at the capillary outlet.
- Decoupler: A crucial component to isolate the high separation voltage from the sensitive electrochemical detector. This is often a porous joint or fracture near the capillary outlet.
- Potential: The applied potential is optimized based on the analyte, often via cyclic voltammetry [37].
3. Analysis:
- Inject the sample hydrodynamically (by pressure) or electrokinetically (by voltage).
- Under the applied electric field, analytes separate based on their charge-to-size ratio.
- As analytes reach the detector, they are oxidized or reduced, generating a current proportional to their concentration.
The Scientist's Toolkit: Essential Research Reagents and Materials
Table 2. Key reagents and materials for electrochemical and HPLC methods
| Item | Function / Application | Technical Notes |
|---|---|---|
| Glassy Carbon (GC) Electrode | The standard working electrode for ECD of monoamines and many other organic compounds [21]. | Requires weekly polishing with alumina slurry to maintain a clean, active surface and ensure reproducibility [21]. |
| Ion-Pairing Reagents (e.g., Octanesulfonic acid) | Added to the HPLC mobile phase to retain ionic analytes (like neurotransmitters) on a reverse-phase C18 column [21]. | Concentration and pH are critical for optimal retention and peak shape. |
| Microdialysis Probes & Perfusion Fluid | For in vivo sampling of extracellular fluid in animal brains to collect analytes like neurotransmitters [21]. | Flow rates are typically very low (0.5-1.5 µL/min). The perfusion fluid is an isotonic, buffered solution at physiological pH. |
| Ionic Liquids (ILs) | Versatile materials used as modifiers in background electrolytes for CE, or in stationary phases for GC/HPLC, to fine-tune separations [38]. | Their properties are highly tunable. Subclasses like Magnetic ILs (MILs) can simplify extraction steps [38]. |
| C18 Reverse-Phase Column | The workhorse stationary phase for separating a wide range of semi-polar to non-polar pharmaceutical compounds in HPLC [21]. | Column dimensions and particle size (e.g., 5 µm vs. sub-2 µm) directly impact resolution, pressure, and analysis time. |
| Antioxidant Preservatives (e.g., Ascorbic acid, Perchloric acid) | Added to sample vials to prevent the oxidation of electroactive analytes like catecholamines prior to analysis [21]. | Essential for obtaining accurate quantitative results for easily oxidizable compounds. |
The strategic selection between electrochemical and HPLC methods is a fundamental skill for the modern pharmaceutical scientist. As detailed in this guide, the decision pathway is clearly illuminated by three core analyte properties: electroactivity, volatility, and the complexity of the sample matrix. Electroactivity opens the door to highly sensitive electrochemical detection, volatility directs the path toward gas-phase techniques, and matrix complexity dictates the necessity for high-resolution liquid chromatography. By applying the structured workflow, consulting the comparative technical data, and implementing the detailed experimental protocols provided, researchers can make informed, rational choices. This systematic approach ensures the development of robust, reliable, and fit-for-purpose analytical methods that accelerate drug development and uphold the highest standards of pharmaceutical quality and safety.
Strategic Method Applications in Pharmaceutical Analysis
The precise measurement of monoamine neurotransmitters, specifically dopamine (DA) and serotonin (5-HT), in microdialysis samples represents a critical methodology in neuroscience and pharmaceutical research. This technical guide examines High-Performance Liquid Chromatography with Electrochemical Detection (HPLC-ECD) for monitoring these neurotransmitters within the context of electrochemical versus chromatographic method selection for pharmaceutical analysis. HPLC-ECD provides an exceptional balance of sensitivity, selectivity, and cost-effectiveness for detecting electroactive compounds like DA and 5-HT at physiologically relevant concentrations [39] [40]. When integrated with in vivo microdialysis sampling, this technique enables real-time monitoring of neurotransmitter dynamics in the extracellular fluid of conscious, freely-moving animals, offering invaluable insights into brain function, drug mechanisms, and neurological disorders [41] [21].
The selection of analytical methodology is paramount in pharmaceutical research, where researchers must balance sensitivity requirements, equipment costs, and analytical throughput. While mass spectrometry (LC-MS/MS) offers excellent sensitivity and specificity, HPLC-ECD remains a competitive alternative for targeted monoamine analysis due to its substantially lower operational costs and maintained sensitivity at the femtomolar level [39] [40]. This technical guide provides researchers with comprehensive methodologies, performance characteristics, and practical considerations for implementing HPLC-ECD in neurotransmitter research.
Neurotransmitter Systems and Analytical Significance
The Dopaminergic System
Dopamine is a catecholamine neurotransmitter synthesized from tyrosine through a two-step enzymatic process involving tyrosine hydroxylase and DOPA decarboxylase [21] [42]. It plays crucial roles in regulating motivation, pleasure, reward, and movement [21] [42]. The dopaminergic system comprises several neural pathways, including the mesolimbic, mesocortical, and nigrostriatal pathways. Dysfunction in these systems is associated with neurological and psychiatric disorders; overactivity is linked to schizophrenia, while deficiency is characteristic of Parkinson's disease [21] [42]. Medications targeting dopaminergic activity are commonly used to treat these conditions, necessitating precise analytical methods for pharmacokinetic and pharmacodynamic studies.
The Serotonergic System
Serotonin (5-hydroxytryptamine, 5-HT) is an indolamine neurotransmitter synthesized from the essential amino acid tryptophan via tryptophan hydroxylase and aromatic amino acid decarboxylase (AADC) enzymes [21] [42]. The serotonergic system regulates diverse physiological and psychological processes, including mood, sleep, appetite, thermoregulation, and heart rate [21] [42]. Dysfunctions in this system contribute to neurodegenerative diseases like Parkinson's and Alzheimer's, as well as psychiatric disorders including anxiety and depression [21] [42].
Figure 1: Dopamine and Serotonin Metabolic Pathways. Key enzymes: (1) Tyrosine hydroxylase, (2) DOPA decarboxylase, (3) Monoamine oxidase (MAO), (4) Catechol-O-methyltransferase (COMT), (5) Tryptophan hydroxylase, (6) Aromatic amino acid decarboxylase. Metabolites shown in green boxes.
Microdialysis Sampling Principles
Microdialysis is a well-established sampling technique used for over forty years that enables continuous in vivo monitoring of extracellular fluid composition [21] [42]. The technique operates on the principle of passive diffusion, where small molecular-weight compounds move across a semi-permeable membrane from the region of higher concentration (extracellular fluid) to lower concentration (perfusate) [21] [42]. A typical microdialysis system consists of:
- Microdialysis Probe: A hollow fiber membrane with molecular weight cutoff (typically 20-30 kDa) implanted in the brain region of interest
- Perfusion Pump: Delers isotonic solution (e.g., artificial cerebrospinal fluid) at controlled flow rates (0.5-1.5 μL/min)
- Sample Collection System: Gathers dialysate at predetermined intervals for analysis
Microdialysis offers several advantages for neurotransmitter monitoring, including continuous temporal monitoring, minimal tissue damage, and exclusion of large molecules like proteins that could interfere with analysis [21]. The technique can be coupled online with HPLC-ECD systems, enabling direct analysis while preventing oxidative degradation of analytes due to air exposure [41]. A significant consideration in microdialysis is determining relative recovery, which represents the efficiency of analyte passage across the membrane and is influenced by flow rate, membrane characteristics, and temperature [41].
HPLC-ECD Methodological Framework
System Configuration and Components
A complete HPLC-ECD system for monoamine neurotransmitter analysis consists of several specialized components optimized for sensitivity and reproducibility:
- Solvent Delivery System: Binary or quaternary pumps capable of generating precise, pulse-free mobile phase gradients at low flow rates (typically 0.1-0.5 mL/min)
- Autosampler: Temperature-controlled injection system capable of handling small sample volumes (1-10 μL) with minimal dispersion
- Analytical Column: Reverse-phase C18 columns with small particle sizes (1.7-3 μm) for high separation efficiency [21] [43]
- Electrochemical Detector: Flow cell with working electrode (typically glassy carbon), reference electrode (Ag/AgCl), and auxiliary electrode
- Data Acquisition System: Software for instrument control, data collection, and peak integration
Advanced systems like the ALEXYS Neurotransmitter Analyzer integrate these components into a dedicated platform optimized for monoamine analysis, featuring pulse damper technology to minimize baseline noise and specialized injection programs for microvolume samples [43].
Separation Optimization
Effective chromatographic separation of monoamines and their metabolites requires optimization of several parameters:
Mobile Phase Composition: Reverse-phase separation typically employs a buffered aqueous phase (often phosphate or acetate buffer) mixed with an organic modifier such as acetonitrile or methanol [43]. For monoamine separation, ion-pairing agents (e.g., octanesulfonic acid) are frequently added to enhance retention of these hydrophilic compounds on hydrophobic stationary phases [43]. The pH of the mobile phase significantly affects separation, particularly for acidic metabolites which require acidic conditions (pH 3-4) for optimal retention [43].
Column Selection: Modern UHPLC columns packed with sub-2μm particles provide superior separation efficiency compared to conventional HPLC columns, enabling faster analysis times and better resolution [21] [43]. Column dimensions (typically 50-100 mm length × 1-2 mm internal diameter) are selected based on the required separation efficiency and sensitivity needs.
Temperature Control: Maintaining consistent column temperature (±0.5°C) enhances retention time reproducibility and peak shape.
Electrochemical Detection Principles
Electrochemical detection exploits the redox properties of monoamine neurotransmitters, which undergo oxidation at specific applied potentials [39]. When an electroactive compound passes through the detection cell, electrons are transferred at the working electrode surface, generating a current proportional to the analyte concentration [36].
The applied working potential is critical for detection sensitivity and selectivity. Different neurotransmitter classes exhibit characteristic oxidation potentials:
- Catechol compounds (DA, DOPAC): E½ = 380-500 mV
- Indoles (5-HT, 5-HIAA): E½ = 480-520 mV
- Vanillic compounds (HVA): E½ = 640-680 mV [43]
These values are pH-dependent, shifting approximately 60 mV per pH unit [43]. Optimal detection potential is determined by constructing hydrodynamic voltammograms for each analyte, selecting a potential that maximizes signal-to-noise ratio while minimizing interference from other electroactive compounds.
Advanced detection systems employ dual-electrode configurations arranged in series, which facilitates peak identification through collection efficiency calculations and enables redox cycling for signal amplification [41]. Recent innovations include track-etched membrane electrodes (TEMEs) that provide high electrolysis efficiency, enabling calibration-free coulometric detection [41].
Experimental Protocols
Sample Preparation Procedures
Proper sample preparation is essential for reliable HPLC-ECD analysis:
Microdialysate Samples: These are relatively clean and can typically be injected directly without extensive processing [43]. To prevent analyte degradation, samples are often acidified (with 0.1-0.5 M perchloric or acetic acid) and may include antioxidants such as sodium metabisulfite [43]. Immediate analysis or storage at -80°C is recommended to maintain sample integrity.
Brain Tissue Homogenates: Tissue samples are typically homogenized in 0.1-0.2 M perchloric acid (5-10 volumes per tissue weight) using mechanical homogenizers or ultrasonic disruption [43]. The homogenate is centrifuged at 10,000-15,000 × g for 15-20 minutes at 4°C, and the supernatant is filtered through 0.2 μm membranes before analysis.
Cerebrospinal Fluid: CSF samples may require centrifugation or filtration to remove particulate matter, but generally need minimal processing [43]. Acidification with preservatives is recommended for extended storage.
HPLC-ECD Analytical Method
The following protocol describes a validated method for simultaneous determination of DA and 5-HT in microdialysis samples:
Mobile Phase Preparation:
- 100 mM phosphate buffer, pH 3.0-3.5
- 1.0-2.5 mM octanesulfonic acid (ion-pairing agent)
- 8-12% (v/v) acetonitrile
- 0.1 mM EDTA (chelating agent)
- Filter through 0.2 μm membrane and degass under vacuum or sonication
Chromatographic Conditions:
- Column: UHPLC BEH C18, 1.7 μm, 1.0 × 50 or 100 mm
- Flow rate: 0.05-0.15 mL/min
- Temperature: 25-35°C
- Injection volume: 2-10 μL
- Run time: 5-12 minutes
Electrochemical Detection:
- Working electrode: Glassy carbon
- Reference electrode: Ag/AgCl
- Applied potential: +0.6 to +0.8 V (optimized for target analytes)
- Data collection rate: 2-10 Hz
System Suitability Testing: Before sample analysis, verify system performance using standard solutions:
- Retention time reproducibility: %RSD < 2%
- Peak area reproducibility: %RSD < 5%
- Theoretical plates: >5000 for each analyte
- Resolution: >1.5 between critical analyte pairs
Figure 2: HPLC-ECD Workflow for Neurotransmitter Analysis. The complete analytical process from sample collection to data interpretation, highlighting key system components.
Method Validation Parameters
Rigorous method validation is essential for generating reliable data. Key validation parameters include:
Linearity: Assessed by analyzing standard solutions across the expected concentration range (typically 0.1-100 nM for microdialysate samples). Correlation coefficients (R²) should exceed 0.995 [21].
Sensitivity: Determined by calculating the limit of detection (LOD, signal-to-noise ratio ≥ 3) and limit of quantification (LOQ, signal-to-noise ratio ≥ 5). For monoamine neurotransmitters, LOD values of 0.1-0.5 fmol on column are achievable with modern HPLC-ECD systems [43].
Precision and Accuracy: Evaluated through replicate analysis of quality control samples at low, medium, and high concentrations within the calibration range. Intra-day and inter-day precision should demonstrate %RSD < 15%, and accuracy should be within 85-115% of nominal values [44].
Selectivity: Verified by analyzing blank matrix samples to confirm absence of interfering peaks at analyte retention times. Dual-electrode detection with different applied potentials can enhance selectivity through collection efficiency ratios [41].
Performance Data and Method Comparison
Analytical Performance of HPLC-ECD
Table 1: Typical Performance Characteristics of HPLC-ECD for Monoamine Neurotransmitters
| Analyte | Limit of Detection (fmol) | Limit of Quantification (fmol) | Linear Range | Retention Time (min) | Working Potential (V) |
|---|---|---|---|---|---|
| Dopamine (DA) | 0.1-0.3 | 0.3-1.0 | 0.3-5000 pM | 2.5-4.0 | +0.5 - +0.7 |
| Serotonin (5-HT) | 0.2-0.5 | 0.5-1.5 | 0.5-5000 pM | 4.0-6.5 | +0.6 - +0.8 |
| DOPAC | 0.5-1.0 | 1.5-3.0 | 1.0-10000 pM | 3.0-5.0 | +0.5 - +0.7 |
| 5-HIAA | 0.5-1.0 | 1.5-3.0 | 1.0-10000 pM | 3.5-6.0 | +0.6 - +0.8 |
| HVA | 1.0-2.0 | 3.0-6.0 | 5.0-20000 pM | 5.0-8.0 | +0.7 - +0.9 |
Data compiled from [21] [44] [43]
Comparison with Alternative Analytical Techniques
Table 2: Method Comparison for Neurotransmitter Analysis in Microdialysis Samples
| Parameter | HPLC-ECD | LC-MS/MS | Capillary Electrophoresis | Fluorescence Detection |
|---|---|---|---|---|
| Sensitivity | Femtomolar (10⁻¹⁵ M) | Attomolar-femtomolar (10⁻¹⁸-10⁻¹⁵ M) | Picomolar (10⁻¹² M) | Picomolar (10⁻¹² M) |
| Selectivity | High for electroactive compounds | Excellent | Moderate | Requires derivatization |
| Analysis Time | 5-12 minutes | 5-15 minutes | 5-20 minutes | 10-20 minutes |
| Sample Volume | 2-10 μL | 1-5 μL | 10-100 nL | 5-20 μL |
| Equipment Cost | Moderate | High | Low-Moderate | Moderate |
| Operational Costs | Low | High | Low | Moderate |
| Maintenance Requirements | Electrode polishing, mobile phase degassing | High (source cleaning, calibration) | Low (capillary replacement) | Low (lamp replacement) |
| Matrix Effects | Moderate | Significant (ion suppression) | Low | Moderate |
| Multiplexing Capacity | 6-8 compounds | Dozens of compounds | Limited | 2-4 compounds with derivatization |
Data compiled from [21] [39] [45]
The Scientist's Toolkit: Essential Research Reagents and Materials
Table 3: Essential Research Reagents and Materials for HPLC-ECD Neurotransmitter Analysis
| Item | Specification | Function/Purpose | Application Notes |
|---|---|---|---|
| HPLC-ECD System | Integrated system with degasser, pump, autosampler, temperature-controlled column compartment, and electrochemical detector | Complete analytical platform for neurotransmitter separation and detection | Systems like ALEXYS Analyzer are optimized for neurotransmitter analysis [43] |
| Analytical Column | UHPLC BEH C18, 1.7 μm, 1.0 × 50 mm or 1.0 × 100 mm | Stationary phase for chromatographic separation of monoamines and metabolites | Smaller particles and narrower diameters enhance sensitivity [43] |
| Electrochemical Flow Cell | SenCell with 2 mm glassy carbon working electrode and salt-bridge reference electrode | Detection of electroactive compounds through oxidation at controlled potentials | Dual-electrode configurations enhance selectivity [41] [43] |
| Ion-Pairing Reagent | Octanesulfonic acid sodium salt, 1-2.5 mM in mobile phase | Enhances retention of hydrophilic monoamines on reverse-phase columns | Concentration optimization required for specific analyte mixtures [43] |
| Mobile Phase Buffer | Phosphate or acetate buffer, 50-100 mM, pH 3.0-3.5 | Maintains pH for consistent retention times and electrochemical response | pH critically affects separation of acidic metabolites [43] |
| Antioxidant Reagents | Perchloric acid (0.1-0.5 M), sodium metabisulfite (0.1 mM) | Prevents oxidative degradation of catecholamines during sample processing | Essential for preserving sample integrity, especially in animal studies [43] |
| Standard Solutions | Dopamine HCl, serotonin HCl, metabolite standards (DOPAC, 5-HIAA, HVA) | Method calibration and quality control | Prepare fresh daily or aliquot and store at -80°C [41] [43] |
Applications in Pharmaceutical Research
HPLC-ECD with microdialysis sampling has proven invaluable in numerous pharmaceutical research applications:
Drug Mechanism Studies: Monitoring neurotransmitter dynamics in response to drug administration provides insights into mechanism of action. For example, a recent study using microdialysis-integrated HPLC with TEME detection demonstrated that acute mirtazapine administration caused no increase in dopamine levels in the dorsal striatum, challenging previous hypotheses about its mechanism [41].
Pharmacokinetic-Pharmacodynamic Modeling: Simultaneous monitoring of drug concentrations and neurotransmitter responses enables construction of PK-PD models that relate drug exposure to pharmacological effects [41].
Neurotoxicity Screening: Assessing changes in neurotransmitter systems following administration of candidate compounds helps identify potential neurotoxic effects early in drug development.
Blood-Brain Barrier Permeability: Comparing systemic and brain extracellular fluid drug concentrations provides information on blood-brain barrier penetration.
Troubleshooting and Method Optimization
Common challenges in HPLC-ECD analysis of neurotransmitters and their solutions include:
Baseline Noise and Drift:
- Cause: Oxygen in mobile phase, contaminated electrode, temperature fluctuations
- Solution: Thorough mobile phase degassing (helium sparging), electrode cleaning/polishing, temperature control
Loss of Sensitivity:
- Cause: Electrode fouling, mobile phase contamination, column degradation
- Solution: Regular electrode maintenance (polishing with alumina slurry), mobile phase filtration, column cleaning/regeneration
Peak Tailing:
- Cause: Secondary interactions with stationary phase, column overload, inappropriate mobile phase pH
- Solution: Optimize ion-pairing reagent concentration, reduce injection volume, adjust mobile phase pH
Retention Time Shifts:
- Cause: Mobile phase composition variations, temperature fluctuations, column degradation
- Solution: Precise mobile phase preparation, temperature control, column replacement when necessary
Advanced troubleshooting techniques include electrode activation through potential pulsing (e.g., alternating +1.0V and -1.0V for specified durations) to restore detector performance [43].
HPLC-ECD continues to evolve as a robust methodology for monoamine neurotransmitter analysis. Future developments likely include further miniaturization of systems for improved sensitivity, integration with data science approaches for pattern recognition in complex chromatograms, and development of novel electrode materials with enhanced selectivity and stability [39]. The emergence of track-etched membrane electrodes (TEMEs) represents a significant advancement, enabling calibration-free coulometric detection and improved peak identification through dual-electrode configurations [41].
While LC-MS/MS offers advantages for comprehensive metabolomic profiling, HPLC-ECD maintains a strong position in targeted analysis of monoamine neurotransmitters due to its cost-effectiveness, operational simplicity, and sufficient sensitivity for most microdialysis applications. The technique provides an optimal balance of performance and practicality for pharmaceutical researchers investigating neurochemical mechanisms of drug action.
For laboratories specializing in monoamine research, implementing HPLC-ECD with microdialysis sampling provides a powerful platform for advancing understanding of neurotransmitter dynamics in health and disease, ultimately contributing to the development of novel therapeutics for neurological and psychiatric disorders.
The precise quantification of Coenzyme Q({10}) (CoQ({10})) in biological matrices is a critical component of diagnosing CoQ({10}) deficiency syndromes and monitoring supplementation therapy. Among available analytical techniques, High-Performance Liquid Chromatography with Electrochemical Detection (HPLC-ED) has established itself as a robust methodology for this application, offering superior selectivity and sensitivity for CoQ({10}) measurement in complex samples. This technique is particularly valuable in pharmaceutical and clinical research where accurate monitoring of CoQ(_{10}) status in tissues and fluids is essential for understanding disease mechanisms and treatment efficacy.
The analysis of CoQ({10}) presents significant technical challenges due to its lipophilic nature, low abundance in biological tissues, and susceptibility to oxidation. This technical guide provides a comprehensive overview of HPLC-ED methodologies for CoQ({10}) quantification, framed within the broader context of analytical method selection for pharmaceutical research, where the choice between electrochemical and chromatographic approaches is dictated by requirements for sensitivity, selectivity, and practical implementation in complex matrices.
Analytical Principle: Why HPLC-ED for CoQ(_{10})?
Fundamental Advantages
Electrochemical detection (ED) provides exceptional sensitivity for the detection of electroactive compounds like CoQ({10}). The fundamental principle involves applying a specific potential to induce oxidation or reduction of analytes as they elute from the HPLC column, generating a measurable current proportional to concentration. For CoQ({10}), which contains a redox-active benzoquinone ring, ED offers significant advantages over optical detection methods:
- High Sensitivity: Capable of detecting CoQ(_{10}) at picomolar levels, essential for limited biological samples [46] [47].
- Enhanced Selectivity: The application of a specific redox potential reduces interference from non-electroactive matrix components [48].
- Minimal Sample Volume: Requires small sample quantities (50-100 µL), crucial for pediatric patients or rare specimens [47].
Comparison with Alternative Analytical Platforms
Table 1: Comparison of Analytical Methods for CoQ(_{10}) Quantification
| Method | Detection Principle | Sensitivity | Selectivity | Sample Preparation | Best Use Case |
|---|---|---|---|---|---|
| HPLC-ED | Electrochemical oxidation/reduction | High (pmol) | High for electroactive compounds | Moderate | Routine clinical monitoring, multiple sample types |
| LC-MS/MS | Mass-to-charge ratio | Very High (fmol) | Exceptional | Complex, requires internal standard (e.g., d6-CoQ10) | Research, method validation, CSF analysis |
| HPLC-UV | UV light absorption | Moderate (nmol) | Low | Simple | High-concentration samples only |
Liquid chromatography-tandem mass spectrometry (LC-MS/MS) offers exceptional sensitivity and specificity, with one method demonstrating a lower limit of detection of 2 nM for CoQ(_{10}) in cerebrospinal fluid using a novel deuterated internal standard (d6-CoQ10) [49]. However, HPLC-ED remains a robust, cost-effective alternative that provides adequate sensitivity for most clinical and pharmaceutical applications without requiring expensive mass spectrometry instrumentation [46].
Experimental Protocols for HPLC-ED Analysis
Equipment and Reagents
Research Reagent Solutions and Essential Materials
| Item | Function/Application |
|---|---|
| HPLC System | Liquid chromatography separation (e.g., Waters, Milford, MA, USA) |
| Electrochemical Detector | Coulometric detection (e.g., Coulochem II, ESA, Chelmsford, MA, USA) |
| Analytical Cell | Model 5010 with dual electrodes set to -600 mV and +600 mV |
| C18 Reverse-Phase Column | Compound separation (e.g., Nucleosil C-18, 250 mm or 150 mm) |
| Coenzyme Q9 (CoQ9) | Internal standard for quantification |
| Lithium Perchlorate | Mobile phase electrolyte (1.06 g/L in methanol/ethanol) |
| Hexane | Lipid extraction and sample preparation |
| Methanol/Ethanol (60:40) | Mobile phase and sample reconstitution |
| SETH Buffer | Muscle tissue homogenization and stabilization |
Detailed Sample Preparation Protocol
Plasma Sample Processing:
- Add internal standard (CoQ(_9) in ethanol) to 200 µL plasma
- Deproteinize with ethanol or hexane
- Extract with hexane for 10 minutes by vortexing
- Centrifuge at 1,500 × g for 10 minutes at 4°C
- Collect hexane phase and filter through 0.22 µm filter
- Evaporate to dryness under nitrogen stream
- Reconstitute in 100 µL methanol/ethanol (60:40, v/v)
- Inject 50 µL into HPLC system [46] [47]
Muscle Tissue Processing:
- Weigh 2-5 mg muscle tissue (vastus lateralis)
- Homogenize with cold SETH buffer in ice bath
- Vortex, sonicate, and centrifuge (1,500 × g, 10 minutes, 4°C)
- Collect supernatant and follow extraction steps as for plasma [47]
Fibroblast Cell Processing:
- Culture skin fibroblasts to confluence
- Harvest cells and wash with saline solution
- Lyse cells and extract with hexane as above
- Use 150 mm C18 column for shortened retention times [46]
Chromatographic Conditions
Table 2: HPLC-ED Analytical Parameters for Different Biological Samples
| Parameter | Plasma/Platelets/Urine | Muscle/BMCs | Fibroblasts |
|---|---|---|---|
| Column | C18, 250 × 4.6 mm, 5 µm | C18, 150 mm length | C18, 150 mm length |
| Mobile Phase | 1.06 g/L lithium perchlorate in methanol/ethanol (60:40, v/v) | Same | Same |
| Flow Rate | 1 mL/min | 1 mL/min | 1 mL/min |
| Injection Volume | 50 µL | 50 µL | 50 µL |
| Detection Potential | -600 mV (reduction) and +600 mV (oxidation) | Same | Same |
| Internal Standard | Coenzyme Q9 (CoQ9) | CoQ9 | CoQ9 |
Method Validation Parameters
For reliable CoQ(_{10}) quantification, the HPLC-ED method must undergo rigorous validation:
- Linearity: demonstrated over appropriate concentration ranges (R² ≥ 0.999) [46]
- Precision: intra-assay CV < 3.6%, inter-assay CV < 4.3% [49]
- Accuracy: recovery rates typically 77-160% for related compounds [50]
- Limit of Detection (LOD): as low as 2 nM in LC-MS/MS methods [49]
- Limit of Quantification (LOQ): sufficient for biological concentration ranges
Analytical Performance and Biological Reference Ranges
Table 3: Reference Ranges for CoQ10 in Human Biological Samples
| Biological Sample | Reference Range | Notes | Source |
|---|---|---|---|
| Plasma | Significant increase post-supplementation (p=0.003) | Best surrogate biomarker for treatment monitoring | [47] |
| Skeletal Muscle | 187.3-430.1 pmol/mg (baseline); increased in 8/10 subjects post-supplementation | Target tissue for deficiency syndromes | [49] [47] |
| Blood Mononuclear Cells (BMCs) | 57.0-121.6 pmol/mg protein | No significant change post-supplementation | [49] [47] |
| Platelets | No significant change post-supplementation | Requires normalization to platelet count | [47] |
| Urinary Cells | No significant change post-supplementation | Non-invasive sampling method | [47] |
| Cerebrospinal Fluid | 5.7-8.7 nM | Requires highly sensitive methods (LC-MS/MS) | [49] |
| Fibroblasts | 57.0-121.6 pmol/mg | Useful for primary deficiency diagnosis | [49] |
Methodological Considerations in Broader Context
Electrochemical vs. Chromatographic Method Selection
The selection of analytical methodology in pharmaceutical research involves careful consideration of multiple factors. Electrochemical techniques, including HPLC-ED, offer distinct advantages for specific applications:
- Complex Matrices: Electrochemical detection provides superior selectivity in biological samples by targeting electroactive functional groups, reducing matrix effects [30].
- Cost Effectiveness: HPLC-ED systems have lower operational costs compared to LC-MS/MS, making them suitable for routine clinical monitoring [46].
- Complementary Techniques: Recent advances in pulsed amperometric detection (PAD) extend HPLC-ED applicability to compounds with complex redox behavior [13].
Technical Challenges and Troubleshooting
- Matrix Effects: Use of longer columns (250 mm) for plasma samples helps separate CoQ(_{10}) from interfering compounds [47].
- Electrode Fouling: Regular maintenance and calibration of electrochemical cells is essential for reproducible results [30].
- Oxidation Protection: Sample processing under inert atmosphere or with antioxidant addition preserves CoQ(_{10}) integrity.
- Normalization Strategies: Plasma CoQ(_{10}) should be expressed relative to total cholesterol, while tissue levels normalize to protein content [47].
HPLC-ED remains a robust, sensitive, and practical methodology for quantifying CoQ({10}) status across multiple biological matrices. Its optimal application requires careful attention to sample processing, chromatographic conditions, and method validation. For clinical monitoring of CoQ({10}) supplementation, plasma analysis represents the most reliable and practical approach, while muscle tissue analysis provides crucial information about target tissue bioavailability. The continued evolution of electrochemical detection technologies ensures that HPLC-ED will maintain its relevance in pharmaceutical and clinical research settings where reliable, cost-effective CoQ(_{10}) quantification is required.
Artemisinin and its derivatives, such as artemether and artesunate, constitute the cornerstone of modern antimalarial treatment, particularly as first-line therapies against Plasmodium falciparum malaria. These compounds share a crucial pharmacophoric element—an endoperoxide bridge—that is essential for their potent antimalarial activity [51]. However, this critical chemical structure presents a significant analytical challenge: artemisinin compounds lack ultraviolet (UV) chromophores or fluorescent properties, making them virtually invisible to conventional HPLC detectors that rely on UV/Vis absorption [45]. This inherent limitation has driven the development of alternative detection strategies, with electrochemical detection (ECD) emerging as a powerful solution that directly addresses this analytical gap.
The problem of detecting artemisinin derivatives is not merely academic; it has substantial public health implications. The prevalence of substandard and falsified antimalarials in low- and middle-income countries is estimated at 19.1%, contributing to nearly 450,000 preventable deaths annually [51]. While gold-standard methods like HPLC-UV are established in well-equipped laboratories, they fail to detect under-dosed artemisinin formulations due to the chromophore deficiency. Electrochemical methods circumvent this limitation by targeting the electroactive endoperoxide moiety itself, enabling specific quantification without derivatization. This technical guide examines the fundamental principles, methodologies, and practical implementations of electrochemical detection for artemisinin antimalarials, contextualized within the broader framework of analytical method selection for pharmaceutical analysis.
Electrochemical Fundamentals and Detection Strategies
Leveraging the Electroactive Endoperoxide Bridge
The analytical power of electrochemical detection for artemisinin compounds stems from their unique chemical reactivity. The endoperoxide bridge (C-O-O-C) within the sesquiterpene lactone structure undergoes reductive cleavage at electrode surfaces, generating a measurable faradaic current. This reaction mirrors the proposed activation mechanism in vivo, where heme iron within the malaria parasite reduces the endoperoxide bridge, creating reactive oxygen species that kill the parasite [51]. Cyclic voltammetry studies demonstrate that the reduction of artemether is chemically irreversible within the potential range of -0.4 V to -1.4 V versus Ag/AgCl, with a characteristic reduction potential around -1.2 V in phosphate buffer at pH 7.55 [51].
The electrochemical behavior of artemisinin derivatives is influenced by several factors, including solution pH, electrode material, and scan rate. Studies investigating artemether's response to pH changes indicate possible protonation and coupled homogeneous chemistry, suggesting complex reduction mechanisms [51]. The response to varying scan rates provides kinetic and mechanistic information, essential for optimizing detection parameters. Understanding these fundamental electrochemical properties forms the basis for developing robust analytical methods for artemisinin detection and quantification.
Addressing the Oxygen Interference Challenge
A significant technical consideration in the electrochemical detection of artemisinin derivatives is potential interference from dissolved oxygen, which reduces at approximately -0.6 V versus Ag/AgCl on glassy carbon electrodes—near the reduction potential of artemisinin compounds [51]. As dissolved oxygen concentrations can vary substantially in field conditions (from 92 μM to 375 μM), this represents a critical methodological challenge.
Effective strategies for mitigating oxygen interference include:
- Solution degassing with inert gases (nitrogen or argon) for 20 minutes prior to analysis
- Chemical oxygen scavenging using sodium sulfite, which has been shown to effectively remove dissolved oxygen and improve artemether signal resolution in air-equilibrated phosphate-buffered saline [51]
- Use of selectively permeable membranes to exclude interferents while allowing analyte access to the electrode surface [36]
These approaches enable artemisinin quantification even in oxygen-rich environments, enhancing the robustness of electrochemical methods for field deployment.
Methodological Approaches and Experimental Protocols
Direct Electrochemical Detection Methods
Direct electrochemical detection leverages the inherent electroactivity of the endoperoxide bridge without chemical modification. The experimental workflow typically involves electrode preparation, analyte extraction, and voltammetric or coulometric analysis.
Table 1: Key Experimental Parameters for Direct Electrochemical Detection of Artemisinin Derivatives
| Parameter | Specification | Experimental Notes |
|---|---|---|
| Working Electrode | 1.6 mm glassy carbon | Requires polishing with alumina slurry (1 μm, 0.3 μm, 0.05 μm) and sonication in water:acetone (1:1) [51] |
| Reference Electrode | Ag/AgCl/KCl (3 M) | Provides stable reference potential in non-aqueous and aqueous environments [51] |
| Auxiliary Electrode | Pt wire or coiled wire | Surface area should be sufficient to handle current flow; 23 cm coiled wire used for sensitive measurements [51] |
| Supporting Electrolyte | Phosphate-buffered saline (PBS), pH 7.4 | 0.01 M phosphate buffer, 0.0027 M KCl, 0.137 M NaCl; degassed with N₂ for 20 min [51] |
| Extraction Solvent | Dimethyl sulfoxide (DMSO) | Effectively dissolves artemisinin derivatives for subsequent dilution in aqueous buffer [51] |
| Scan Parameters (CV) | -0.4 V to -1.4 V vs. Ag/AgCl | Scan rate typically 50-100 mV/s; irreversible reduction wave observed around -1.2 V [51] |
For quantification, chronocoulometry has been successfully employed. The method utilizes the Anson equation, which integrates current over time to determine charge, effectively increasing the signal-to-noise ratio. When adsorption occurs at the electrode surface (as observed with artemether), quantification is best achieved by extracting the diffusion-limited current from the edge-corrected Anson equation rather than relying on total charge measurements [51].
Indirect Detection Through Derivatization Strategies
When direct electrochemical detection is insufficiently sensitive or selective, indirect approaches employing chemical derivatization offer viable alternatives. A particularly innovative method involves the reaction of artemisinin with p-aminophenylboronic acid (p-ABA) to generate electroactive p-aminophenol (p-AP), which is readily detectable at low potentials (~0.045 V vs. Ag/AgCl) [52].
Table 2: Indirect Electrochemical Detection via Derivatization with p-Aminophenylboronic Acid
| Parameter | Specification | Analytical Performance |
|---|---|---|
| Derivatization Agent | p-aminophenylboronic acid | Reacts specifically with artemisinin to produce p-aminophenol [52] |
| Detection Potential | 0.045 V vs. Ag/AgCl | Significantly lower than direct reduction potentials, minimizing interferences [52] |
| Linear Range | 2-200 μmol/L | Suitable for pharmaceutical dosage forms and biological samples [52] |
| Limit of Detection | 0.8 μmol/L | More sensitive than other reported electrochemical methods [52] |
| Precision (RSD) | 4.83% (at 10 μM) | Acceptable for quality control applications [52] |
| Application | Compound naphthoquine phosphate tablets | Recovery rates of 101.7-107.6% demonstrate accuracy in real samples [52] |
The derivatization approach offers several advantages, including operation at low detection potentials (minimizing interference from other electroactive compounds), enhanced sensitivity, and the ability to detect artemisinin at bare electrodes without complex modification procedures [52]. This method also shows promise for adaptation to artemisinin derivatives through similar chemical pathways.
HPLC with Electrochemical Detection
Coupling high-performance liquid chromatography with electrochemical detection (HPLC-ECD) combines excellent separation capabilities with the sensitivity and selectivity of electrochemical detection. This approach is particularly valuable for analyzing complex matrices such as pharmaceutical formulations or biological samples, where multiple components may co-elute and interfere with detection.
The HPLC-ECD configuration for artemisinin analysis typically employs reductive electrochemical detection due to the reducible nature of the endoperoxide bridge. Early methods required rigorous deoxygenation and temperature control, but technological advances have improved robustness. Porous graphite electrodes in modern systems allow extended operation before maintenance is required [45]. HPLC-ECD methods have been successfully developed for simultaneous determination of artemether and its active metabolite dihydroartemisinin in plasma, achieving separation of the α and β isomeric forms of dihydroartemisinin with retention times of 4.6 and 5.9 minutes, respectively [53].
Table 3: HPLC-ECD Method Parameters for Artemisinin Derivative Analysis
| Component | Specification | Notes |
|---|---|---|
| Column | microBondapak CN | Provides retention and separation of artemisinin derivatives [53] |
| Mobile Phase | Acetonitrile-water (20:80) with 0.1 M acetic acid pH 5.0 | Optimized for separation of artemether and metabolites [53] |
| Extraction | Dichloromethane-tert.-methylbutyl ether (1:1) or n-butyl chloride-ethyl acetate (9:1) | Efficient recovery (86-93%) from plasma matrices [53] |
| Detection | Reductive electrochemical detection | Requires careful oxygen exclusion from mobile phase [45] |
| Linear Range | 80-640 ng/mL | Suitable for pharmacokinetic studies [53] |
| LOD/LOQ | 3-5 ng/mL | Sufficient for therapeutic drug monitoring [53] |
Comparative Analytical Performance
Electrochemical Detection vs. Alternative Techniques
The selection of an appropriate analytical method for artemisinin pharmaceuticals requires careful consideration of performance characteristics, operational requirements, and intended application context. Electrochemical methods offer distinct advantages for field deployment and resource-limited settings, while more sophisticated techniques may be preferable in well-equipped laboratories.
Table 4: Comprehensive Method Comparison for Artemisinin Analysis
| Method | Detection Principle | Sensitivity | Selectivity | Cost | Infrastructure Requirements | Best Applications |
|---|---|---|---|---|---|---|
| HPLC-UV [54] | UV absorption at 210 nm | ~20 μg/mL (LOD) | Low (requires derivatization) | Medium | HPLC system, controlled environment | Quality control in equipped labs |
| HPLC-ECD [45] | Reductive electrochemistry | 3-5 ng/mL | High | Medium-high | HPLC with ECD, deoxygenation | Pharmacokinetic studies |
| Voltammetry [51] | Direct reduction of endoperoxide | Not specified | Medium | Low | Portable potentiostat | Field screening of formulations |
| Derivatization-EC [52] | Detection of p-aminophenol at 0.8 μmol/L | High | High (low potential) | Low-medium | Basic EC system | Sensitive detection in complex matrices |
| LC-MS/MS [45] | Mass spectrometric detection | Sub-ng/mL | Very high | High | LC-MS/MS system, skilled operators | Reference method, metabolite profiling |
| NIR Spectroscopy [55] | Vibrational spectroscopy | Semi-quantitative | Medium for authentication | Low (handheld) | Handheld NIR spectrometer | Rapid authentication, falsified drug detection |
Electrochemical methods demonstrate particular strengths in sensitivity and selectivity for artemisinin detection, often surpassing HPLC-UV while requiring less expensive instrumentation than LC-MS/MS. The ability to deploy electrochemical techniques in portable, field-ready formats makes them especially valuable for screening pharmaceutical quality in resource-limited settings where malaria burden is highest [51].
Analytical Validation and Real-World Application
Robust validation is essential for any analytical method intended for pharmaceutical quality assessment. For artemisinin detection, key validation parameters include specificity for the endoperoxide bridge, accuracy in the presence of pharmaceutical excipients, and precision across the intended quantification range.
Studies evaluating voltammetric methods for artemether quantification demonstrate excellent performance in the presence of excipients from commercial Riamet tablets, with no significant difference observed between filtered and unfiltered samples [51]. Chronocoulometric quantification algorithms successfully generated calibration curves for pure artemether and tablet formulations, supporting the method's applicability to real pharmaceutical samples.
For HPLC-ECD methods, validation against reference techniques confirms reliability. Comparative studies show that HPLC-ECD performs well in terms of linearity, quantitation limits, selectivity, precision, and accuracy when benchmarked against LC-MS/MS, with good agreement between methods when calibrated in plasma [45]. The primary advantage of LC-MS/MS is its ability to work with smaller sample volumes (one-tenth that required for HPLC-ECD), but this comes with substantially higher instrumentation costs and operational complexity [45].
The Scientist's Toolkit: Essential Research Reagents and Materials
Successful implementation of electrochemical detection methods for artemisinin antimalarials requires specific reagents, materials, and instrumentation. The following toolkit summarizes critical components and their functions based on the methodologies documented in the literature.
Table 5: Essential Research Reagent Solutions for Artemisinin Electrochemical Analysis
| Category | Specific Items | Function/Application | Technical Notes |
|---|---|---|---|
| Electrode Systems | Glassy carbon working electrode (1.6 mm) | Primary working electrode for reduction | Polish with alumina slurry (1 μm, 0.3 μm, 0.05 μm) before use [51] |
| Ag/AgCl/KCl (3 M) reference electrode | Stable reference potential | Maintain proper KCl concentration for stable potential [51] | |
| Pt wire auxiliary electrode | Completes electrochemical circuit | Use coiled wire for increased surface area in sensitive measurements [51] | |
| Buffer Systems | Phosphate-buffered saline (PBS), pH 7.4 | Supporting electrolyte | 0.01 M phosphate, 0.0027 M KCl, 0.137 M NaCl; degas with N₂ [51] |
| Acetic acid buffer, pH 5.0 | Mobile phase modifier for HPLC-ECD | 0.1 M concentration in acetonitrile-water mobile phase [53] | |
| Solvents & Reagents | Dimethyl sulfoxide (DMSO) | Primary solvent for artemisinin standards | High solubility for artemisinin derivatives [51] |
| Sodium sulfite | Oxygen scavenger | Improves signal resolution in air-equilibrated solutions [51] | |
| p-aminophenylboronic acid | Derivatization agent for indirect detection | Reacts with artemisinin to produce electroactive p-aminophenol [52] | |
| Acetonitrile (HPLC grade) | Mobile phase component | Use with aqueous buffers for HPLC-ECD separation [53] | |
| Extraction Supplies | Dichloromethane-tert.-methylbutyl ether (1:1) | Liquid-liquid extraction | Efficient recovery from plasma matrices [53] |
| Alumina polishing slurry | Electrode preparation | Sequential polishing with 1 μm, 0.3 μm, and 0.05 μm particles [51] |
Electrochemical detection methods provide a powerful solution to the analytical challenge posed by the lack of chromophores in artemisinin antimalarials. By targeting the electroactive endoperoxide bridge directly, these techniques enable specific, sensitive quantification without the need for complex derivatization procedures. The versatility of electrochemical approaches—ranging from direct voltammetric detection to HPLC-ECD coupling—offers researchers and quality control professionals multiple pathways for method development based on available resources and required sensitivity.
Within the broader context of pharmaceutical analysis method selection, electrochemical techniques for artemisinin detection demonstrate a compelling balance of performance, accessibility, and operational cost. While LC-MS/MS remains the gold standard for sensitive bioanalysis, electrochemical methods provide a viable, cost-effective alternative that is particularly well-suited to resource-limited settings where malaria endemicity is highest. As technological advances continue to improve the robustness and user-friendliness of electrochemical instrumentation, these methods are poised to play an increasingly important role in global efforts to combat substandard and falsified antimalarial medicines.
Voltametric and Amperometric Quantification of Gasotransmitters like Hydrogen Sulfide
The recognition of hydrogen sulfide (H₂S) as a crucial gaseous signaling molecule (gasotransmitter) alongside nitric oxide (NO) and carbon monoxide (CO) has fundamentally shifted pharmacological research. [56] [57] [58] Accurate measurement of H₂S is paramount for understanding its role in cardiovascular, neurological, and inflammatory processes, and for developing H₂S-based therapies for cardiometabolic diseases. [59] However, the intrinsic properties of H₂S—including its volatility, susceptibility to oxidation, and existence in multiple chemical pools (free, acid-labile, bound sulfane sulfur)—present significant analytical challenges. [56] [57] This often leads to large discrepancies in reported physiological concentrations, historically ranging from 1-100 µM but now suggested to be in the nanomolar range. [60] [61]
Within pharmaceutical research, selecting the optimal bioanalytical method is critical. This technical guide details voltammetric and amperometric techniques for H₂S quantification, framing them within the broader context of method selection against established techniques like High-Performance Liquid Chromatography (HPLC). We provide a comprehensive resource for researchers and drug development professionals, enabling informed decisions for precise and reliable H₂S measurement in pharmacokinetic and metabolic studies.
Electrochemical Detection of H₂S: Core Principles and Challenges
Fundamental Electrochemistry of H₂S
Hydrogen sulfide is a weak acid that dissociates in aqueous solutions, with a pKa₁ of approximately 6.9. At physiological pH (7.4), it exists as a mixture of about 20% H₂S gas and 80% hydrosulfide anion (HS⁻). [56] [57] This distribution is critical because the lipophilic H₂S molecule can readily diffuse across cell membranes, whereas HS⁻ requires transporters. [57] Electrochemical detection primarily targets the oxidation of these species at a working electrode surface.
The oxidation mechanism and products are highly dependent on the applied potential. At low anodic potentials (≤ +0.7 V vs. Ag/AgCl), the primary reaction is the two-electron oxidation to elemental sulfur (S⁰), as shown in Equations 1 and 2. [61]
H₂S → S⁰ + 2e⁻ + 2H⁺ (1) HS⁻ → S⁰ + 2e⁻ + H⁺ (2)
At higher potentials, further oxidation to sulfur oxides (e.g., SO₃²⁻, SO₄²⁻) occurs. The formation of insoluble elemental sulfur at low potentials is the root cause of the primary challenge in H₂S electrochemistry: electrode passivation.
The Electrode Passivation Problem
The elemental sulfur (S⁰) produced from H₂S oxidation forms an insoluble, non-conductive layer on the electrode surface. [61] This layer fouls the electrode, progressively attenuating the analytical signal (current) upon successive measurements, a phenomenon known as sulfur poisoning. [60] [61] This passivation renders conventional constant potential amperometry (CPA) unreliable for continuous or repeated measurements, necessitating frequent electrode polishing and recalibration, which disrupts experimental workflow and hampers real-time analysis.
Advanced Voltammetric and Amperometric Methodologies
To overcome electrode passivation, researchers have developed sophisticated electrochemical techniques. The table below summarizes the key characteristics of these advanced methods.
Table 1: Comparison of Advanced Electrochemical Methods for H₂S Quantification
| Method | Core Principle | Key Innovation | Detection Limit | Linear Range | Advantages | Disadvantages |
|---|---|---|---|---|---|---|
| Triple Pulse Amperometry (TPA) [61] | Uses discrete, high-potential "cleaning" pulses to oxidize S⁰ to soluble SO₄²⁻, refreshing the surface between "measurement" pulses. | A specific pulse sequence that integrates cleaning into the measurement cycle. | < 100 nM | 150 nM - 15 µM | No membranes or mediators; real-time capability; excellent sensitivity. | Requires optimized pulse parameters; specialized potentiostat. |
| Surface-Conditioned Planar Carbon Electrodes [60] | Pre-conditioning the electrode with potential cycles to stabilize its response before applying a permselective coating. | Combining physical electrode design (planar) with chemical coating and pre-conditioning. | < 100 nM | Up to 10 µM | Enables cell growth on sensor; ideal for in situ measurement. | More complex fabrication process. |
| Flow-Analysis with Voltammetric Detection [62] | Measuring H₂S in a continuous flow stream, minimizing contact time between sulfide and reaction products (e.g., metallic mercury). | System geometry prevents accumulation of passivating species. | 0.5 nM (at 60 s adsorption) | Not Specified | Prevents decay of signal seen in batch-mode. | Requires flow injection system; not for static samples. |
| Clark-Type Amperometric Sensor [63] | Uses a gas-permeable membrane and an internal redox mediator (e.g., ferricyanide) to indirectly oxidize H₂S. | Physical separation of analyte from electrode via a membrane. | Not Specified | Not Specified | Commercially available; reduces surface fouling. | Difficult to miniaturize; mediator can leak; membrane adds response time. |
Detailed Experimental Protocol: Triple Pulse Amperometry (TPA)
The following protocol, adapted from S. Weigand et al., details the use of TPA for direct H₂S sensing without passivation. [61]
1. Materials and Instrumentation
- Potentiostat: CH Instruments 1030A or equivalent multi-channel system.
- Working Electrode: 3 mm diameter Glassy Carbon (GC) electrode.
- Reference Electrode: Ag|AgCl (3.0 M KCl).
- Counter Electrode: Coiled Platinum (Pt) wire.
- Chemicals: Sodium sulfide nonahydrate (Na₂S·9H₂O), Ethylenediaminetetraacetic acid disodium salt (EDTA), Potassium nitrate (KNO₃).
- Solutions: Deoxygenated 0.10 M KNO₃, adjusted to pH 7.4, is used as the electrolyte. A fresh H₂S stock solution (~4 mM) is prepared daily by dissolving Na₂S·9H₂O in deoxygenated 150 µM EDTA. The concentration must be verified by iodometric titration. [61]
2. Electrode Preparation
- Polish the GC electrode sequentially with 1.0, 0.3, and 0.05 µm alumina slurries on a polishing cloth.
- Rinse thoroughly with purified water between each polishing step and after the final polish.
3. Triple Pulse Amperometry Parameters
- The TPA sequence consists of three repeated potential pulses (E₁, E₂, E₃) with specified durations (T₁, T₂, T₃). The current is measured at the end of the detection pulse (T₃).
- Detection Pulse (E₃): Applied first, a low potential (e.g., +0.4 to +0.7 V) where H₂S oxidation occurs and the analytical signal is generated.
- Cleaning Pulse (E₁): Applied second, a high anodic potential (e.g., +1.4 to +1.6 V) that oxidizes adsorbed S⁰ to water-soluble sulfate (SO₄²⁻), regenerating the active electrode surface.
- Recovery Pulse (E₂): A brief intermediate potential to stabilize the system before the next cycle.
- Example Parameters (from literature): [61] E₁ = +1.54 V (T₁=400 ms), E₂ = -0.36 V (T₂=20 ms), E₃ = +0.64 V (T₃=400 ms). The total cycle time is 820 ms.
4. Calibration and Measurement
- Place the polished and assembled electrodes into 20 mL of deoxygenated KNO₃ electrolyte.
- Polarize the electrode by running the TPA sequence for 2000 s to establish a stable baseline.
- Inject aliquots of the H₂S stock solution into the stirred electrolyte to achieve increasing known concentrations.
- Record the amperometric current at the end of each detection pulse (E₃, T₃).
- Plot the steady-state current against H₂S concentration to generate a calibration curve.
Detailed Experimental Protocol: Planar Carbon Sensor for Live Cells
This protocol, based on the work of R. Brown et al., describes the fabrication and use of a planar sensor for real-time H₂S detection from stimulated cells. [60]
1. Sensor Fabrication
- Substrate: Polyethylene terephthalate (PET) sheets cut to size (e.g., 15.8 × 25.4 mm).
- Stencil Printing: Create a vinyl mask with the desired electrode pattern. Apply conductive carbon ink (e.g., CI-2042) through the mask onto the PET substrate. Remove excess ink with a razor blade.
- Curing: Cure the printed electrodes in an oven at 75°C for 90 min. Remove the mask to reveal the finished Stencil-Printed Carbon Electrode (SPCE).
2. Surface Conditioning and Coating
- Conditioning: Condition the SPCE in deoxygenated PBS using a constant potential amperometry methodology (e.g., +0.7 V) or a TPA protocol. This pre-passivates the surface and stabilizes the H₂S response, preventing sensor drift. [60]
- Permselective Coating (Electropolymerization):
- Immerse the conditioned SPCE in a 10 mM solution of ortho-phenylenediamine (o-PD) in PBS.
- Using Cyclic Voltammetry (CV), scan the potential between 0.0 and +1.0 V at 10 mV/s for 20 cycles.
- Rinse the coated electrode with water to remove unbound polymer, forming a poly-o-PD layer that rejects anionic and macromolecular interferents.
- Topcoat (Fluorinated Xerogel):
- Prepare a sol-gel solution from 30% v/v (heptadecafluoro-1,1,2,2-tetrahydrodecyl)trimethoxysilane (17FTMS) and balance methyltrimethoxysilane (MTMOS) in ethanol with water and HCl catalyst.
- Stir vigorously for 1 hour.
- Apply a thin layer over the poly-o-PD-coated SPCE using an airbrush gun. This fluorinated xerogel provides additional selectivity and protects the underlying polymer. [60]
3. Cell Culture and In-Situ Measurement
- Cell Seeding: Seed Human Umbilical Vein Endothelial Cells (HUVECs) directly onto the surface of the planar sensor.
- Stimulation and Measurement: Place the sensor with cells in a measurement chamber with suitable media. Stimulate the cells (e.g., with 17β-estradiol) and use TPA or CPA at the optimized potential to record real-time H₂S release. The planar geometry minimizes diffusion distance, capturing transient H₂S release before it is scavenged or oxidized. [60]
The Scientist's Toolkit: Essential Research Reagents and Materials
Table 2: Key Reagents and Materials for Electrochemical H₂S Sensing
| Item | Function / Role | Example / Specification |
|---|---|---|
| Sodium Sulfide Nonahydrate (Na₂S·9H₂O) | Primary source for preparing H₂S standard solutions. | Must be stored properly; fresh stock solutions prepared daily in deoxygenated EDTA solution. [60] [61] |
| Ethylenediaminetetraacetic Acid (EDTA) | Metal chelator added to H₂S stock and electrolyte solutions. | Prevents spurious oxidation of H₂S by trace metal ions, stabilizing the standard. [60] [61] |
| Ortho-Phenylenediamine (o-PD) | Monomer for electropolymerized permselective membranes. | Forms a poly-o-PD coating upon electrochemical cycling, rejecting common anionic interferents (e.g., ascorbate, nitrite). [60] |
| Fluorinated Silanes (e.g., 17FTMS) | Component of the gas-permeable xerogel topcoat. | Creates a hydrophobic, H₂S-permeable layer that blocks proteins and other fouling agents. [60] |
| Glassy Carbon (GC) Electrode | Standard working electrode material for fundamental studies. | 3 mm diameter disk; requires meticulous polishing before use. [61] |
| Stencil-Printed Carbon Electrode (SPCE) | Customizable, disposable planar sensor substrate. | Enables cell culture directly on the sensor surface for in situ measurements. [60] |
Electrochemical Methods vs. HPLC in Pharmaceutical Research
The choice between electrochemical methods and HPLC (often with electrochemical or mass spectrometric detection) is a critical decision in pharmaceutical R&D.
Performance Comparison and Selection Criteria
Table 3: Method Selection Guide: Electrochemical vs. HPLC for H₂S Analysis
| Criterion | Voltammetry/Amperometry (e.g., TPA, Planar Sensors) | HPLC with Electrochemical Detection (HPLC-ECD) | Liquid Chromatography-Mass Spectrometry (LC-MS/MS) |
|---|---|---|---|
| Primary Application | Real-time, direct measurement of H₂S dynamics in live systems (cells, tissues). | Endpoint measurement of H₂S and/or related sulfur species in plasma/tissue homogenates. | High-specificity endpoint measurement of drugs, metabolites, and sometimes sulfur species. |
| Temporal Resolution | Excellent (Seconds) – Suitable for monitoring rapid release kinetics. | Poor (Minutes-Hours) – Chromatographic run time per sample. | Poor (Minutes-Hours) – Chromatographic run time per sample. |
| Sensitivity | High (Nanomolar LOD) [60] [61] | High (Nanomolar LOD) [64] | Very High (Picomolar LOD) [64] |
| Selectivity/Specificity | Good (Achieved via coatings and pulsed potentials). | Good. | Excellent – Gold standard for specificity via mass fragmentation. [64] |
| Sample Throughput | Low (Single sample per sensor, real-time). | Moderate. | High – Automated injection of many samples. |
| Sample Volume | Low (Microliters, in micro-well formats). | High (e.g., 500 µL plasma for HPLC-ECD). [64] | Very Low (e.g., 50 µL plasma for LC-MS/MS). [64] |
| Operational Complexity | Moderate (Optimizing pulses/coatings). | High (Requires rigorous deoxygenation, dedicated equipment). [64] | Very High – Complex operation and maintenance. [64] |
Strategic Method Selection Framework
The decision matrix for method selection can be visualized as a workflow, helping researchers align their goals with the appropriate technology.
Diagram 1: Method selection decision tree for H₂S analysis.
Voltammetric and amperometric techniques, particularly advanced methods like Triple Pulse Amperometry and surface-conditioned planar sensors, have emerged as powerful tools for the direct, real-time quantification of the gasotransmitter H₂S. They offer unparalleled temporal resolution for studying the dynamic signaling of H₂S in live biological systems, a domain where chromatographic methods fall short.
However, for pharmaceutical research requiring definitive identification, high specificity, and high-throughput quantification of H₂S donors or metabolites in complex biological matrices, LC-MS/MS remains the gold standard. [64] The choice between these techniques is not a matter of superiority but of strategic alignment with the research question at hand. As H₂S continues to gain prominence as a therapeutic target for cardiometabolic diseases, [59] the ability to select and implement the correct analytical method will be fundamental to advancing our understanding and developing effective H₂S-based pharmacotherapies.
The journey of a drug from discovery to market relies on robust analytical techniques to ensure its safety, efficacy, and quality. High-Performance Liquid Chromatography (HPLC) has long been the undisputed gold standard for quantifying active pharmaceutical ingredients (APIs), profiling impurities, and conducting stability studies in the pharmaceutical industry [65] [66]. Its unparalleled precision in separation and quantification makes it indispensable for compliance with stringent global regulatory standards [67] [68]. Meanwhile, electrochemical sensing has emerged as a powerful complementary technology. Particularly for biologics and therapeutic monitoring, it offers the potential for real-time, label-free, and miniaturized detection of biomolecules and live cells, which is a significant advancement for personalized medicine and advanced therapy development [69] [70].
This technical guide explores the application scope of both techniques, framing them not as competitors but as complementary tools within a modern pharmaceutical analyst's arsenal. It provides a detailed comparison of their principles, performance, and ideal use cases, supported by experimental protocols and data to inform method selection for specific analytical challenges.
High-Performance Liquid Chromatography (HPLC): The Gold Standard for API and Impurity Analysis
HPLC's role is foundational in pharmaceutical quality control (QC) and quality assurance (QA). It serves as the primary technique for analyzing raw materials, intermediates, and finished products, with every batch undergoing HPLC analysis before market release [66].
Core Applications and Regulatory Framework
- Drug Purity Testing and Stability Studies: HPLC verifies that APIs and finished products meet purity standards. It is crucial for stability studies, determining a drug's shelf life and storage conditions by monitoring how APIs and formulations degrade over time under various environmental stresses [65].
- Impurity Profiling and Degradation Product Analysis: One of HPLC's most critical applications is identifying and quantifying impurities and degradation products. Regulatory bodies like the FDA, EMA, and ICH require stringent control of impurities, sometimes at concentrations as low as 0.05%. HPLC provides the necessary precision, selectivity, and sensitivity to meet these standards [66].
- Advanced Techniques: HPLC adapts to complex analytical needs through specialized forms. Chiral HPLC separates enantiomers using specialized columns, which is critical as one enantiomer may be therapeutic while the other is harmful [65]. For biopharmaceuticals, techniques like size-exclusion chromatography (SEC) and ion-exchange chromatography (IEX) are essential for characterizing proteins, peptides, and monoclonal antibodies [66].
Detailed HPLC Protocol: A Stability-Indicating Assay
The following protocol, derived from a regulated HPLC procedure, illustrates the comprehensive nature of a stability-indicating method for a drug product [68].
Principle/Scope: To determine the assay (% Label Claim), related substances, and identity in a drug product capsule by HPLC using reversed-phase separation with UV detection.
Apparatus/Equipment:
- HPLC System: Binary or quaternary pump, auto-sampler, temperature-controlled column compartment, and UV or diode array detector (DAD).
- Column: ACE 3 C18, 150 mm x 4.6 mm, 3 µm.
- Other: Analytical balance, pH meter, sonicator, vortex mixer, Class A volumetric glassware, and 0.45 µm nylon syringe filters.
Reagents and Solutions:
- Mobile Phase A (MPA): 20 mM ammonium formate buffer, pH 3.7.
- Mobile Phase B (MPB): 0.05% Formic acid in acetonitrile.
- Diluent: 20 mM ammonium formate buffer, pH 3.7.
- Reference Standard Solution: ~0.5 mg/mL of qualified API reference standard in diluent.
Operating Parameters:
- Flow Rate: 1.0 mL/min
- Column Temperature: 40 °C
- Injection Volume: 10 µL
- Detection (DAD): 220 nm
- Gradient Program:
- Time = 0 min: 90% A, 10% B
- Time = 20 min: 10% A, 90% B
- Time = 25 min: 10% A, 90% B
- Time = 25.1 min: 90% A, 10% B
- Time = 30 min: 90% A, 10% B
Sample Preparation: For a 5 mg capsule: The contents of five capsules are transferred to a 50 mL volumetric flask. Diluent is added, and the solution is sonicated for at least 5 minutes to dissolve. It is then diluted to volume, mixed, and an aliquot is passed through a 0.45 µm nylon filter into an HPLC vial, discarding the first 0.5 mL of filtrate.
System Suitability: Tests are performed before analysis to ensure system functionality. Critical parameters include precision (%RSD of replicate injections < 2.0%) and tailing factor (T ≤ 2.0) to confirm the method is operating within validated parameters [68].
Electrochemical Sensors: Emerging Tools for Real-Time Monitoring
Electrochemical sensors have gained significant traction for applications where HPLC faces limitations, particularly in real-time, in-situ monitoring and analysis in complex biological matrices [69].
Fundamentals and Advantages
These sensors measure electrical signals (current, potential, impedance) generated from redox reactions of target analytes. Their advantages are multifaceted [71] [69] [8]:
- Rapid Response and High Sensitivity: Capable of detecting ultra-low concentrations of biomarkers and drugs.
- Portability and Miniaturization: Ideal for developing point-of-care (POC) devices and for field-deployable analysis.
- Cost-Effectiveness: Require simpler instrumentation, minimal reagents, and less training to operate compared to HPLC.
- Label-Free, Real-Time Monitoring: Enable continuous, non-invasive monitoring of dynamic biological processes, such as live-cell activity and drug metabolism.
Key Applications in Biologics and Advanced Therapies
- Live-Cell Monitoring and Anticancer Assessment: Electrochemical biosensors can monitor cell viability, proliferation, and function in real-time. Techniques like Electric Cell–Substrate Impedance Sensing (ECIS) can assess the efficacy of anticancer drugs by tracking changes in cell morphology and adhesion without destructive sampling or chemical labels [70].
- Therapeutic Drug Monitoring: For drugs like non-steroidal anti-inflammatory drugs (NSAIDs), electrochemical sensors offer potential for real-time monitoring of drug levels in biological fluids, enabling faster early diagnosis of side effects and personalized dosing [71].
- Neurodegenerative Disease Biomarker Detection: Electrochemical biosensors functionalized with nanomaterials are being developed for sensitive detection of biomarkers like α-synuclein for Parkinson's disease and amyloid-β for Alzheimer's disease. This is crucial for early diagnosis and monitoring disease progression [72].
- Environmental Monitoring: Electrochemical sensors provide an efficient and reliable alternative for monitoring pharmaceutical pollutants in water matrices. They have been successfully used to detect and quantify compounds like the sunscreen agent octocrylene, with performance comparable to HPLC [8].
Detailed Electrochemical Protocol: NSAID Detection
The following protocol details the detection of Diclofenac (DIC), a common NSAID, using a nanomaterial-modified electrochemical sensor [71].
Principle: A glassy carbon electrode (GCE) is modified with a hybrid nanomaterial (e.g., graphene oxide and metallic nanoparticles) to enhance its electrocatalytic properties. The sensor quantifies DIC based on its oxidation current, measured using differential pulse voltammetry (DPV).
Apparatus/Equipment:
- Potentiostat/Galvanostat with control software.
- Three-Electrode Electrochemical Cell:
- Working Electrode: Glassy carbon sensor (GCS), often modified.
- Reference Electrode: Ag/AgCl (3M KCl).
- Counter Electrode: Platinum wire.
- Supporting Equipment: Ultrasonic bath, analytical balance, magnetic stirrer.
Reagents and Solutions:
- Electrolyte: 0.04 M Britton-Robinson (BR) buffer solution, pH 6.0.
- Standard Solution: Stock solution of DIC (e.g., 1.0 × 10⁻³ M) prepared in a suitable solvent/water mixture.
- Nanomaterials: e.g., Graphene oxide dispersion, solution of gold nanoparticles (AuNPs).
Electrode Modification:
- Polish the bare GCE with alumina slurry on a polishing cloth, then rinse thoroughly with distilled water and dry.
- Deposit a precise volume (e.g., 5 µL) of the nanomaterial dispersion onto the GCE surface and allow it to dry under an infrared lamp, forming a modified GCE (e.g., GO/AuNPs/GCE).
DPV Measurement Parameters:
- Initial/Final Potential: -0.8 V / +1.5 V (vs. Ag/AgCl)
- Modulation Amplitude: 50 mV
- Step Potential: 2 mV
- Modulation Time: 50 ms
- Equilibrium Time: 15 s
Analytical Procedure:
- Place the modified GCE into the electrochemical cell containing 10 mL of BR buffer (pH 6.0).
- Run the DPV method to obtain a baseline.
- Add successive aliquots of the DIC standard solution to the cell, mixing between each addition.
- After each addition, run the DPV method and record the oxidation peak current for DIC.
- Construct a calibration curve by plotting the peak current against DIC concentration.
Comparative Analysis: HPLC vs. Electrochemical Methods
The choice between HPLC and electrochemical methods depends on the specific analytical requirements. The table below summarizes their core characteristics for easy comparison.
Table 1: Comparative Analysis of HPLC and Electrochemical Methods for Pharmaceutical Analysis
| Parameter | High-Performance Liquid Chromatography (HPLC) | Electrochemical Sensors |
|---|---|---|
| Primary Principle | Separation based on chemical affinity for stationary vs. mobile phase | Detection based on redox activity of the analyte |
| Key Applications | API potency, impurity profiling, stability testing, chiral separation | Real-time therapeutic monitoring, live-cell analysis, environmental tracking, point-of-care diagnostics |
| Sensitivity (LOD) | Very high (e.g., impurities at 0.05%) [66] | High (e.g., nanomolar to picomolar for biomarkers) [70] [72] |
| Quantitative Performance | Excellent precision and accuracy, wide linear dynamic range | Good precision and accuracy, linear range can be narrower |
| Analysis Time | Longer (minutes to hours per sample) | Rapid (seconds to minutes) |
| Portability | Low (benchtop instruments) | High (miniaturized, portable systems possible) |
| Cost | High (instrumentation, maintenance, solvent consumption) | Low (instrumentation and operational costs) |
| Regulatory Adoption | Well-established, mandated for product release [66] | Emerging, primarily in research and development |
| Sample Complexity | Handles complex mixtures via separation | Can be affected by interfering electroactive species in complex matrices |
A direct study comparing both techniques for quantifying the sunscreen agent octocrylene in water provides concrete performance data [8]:
Table 2: Performance Comparison for Octocrylene Detection in Water Matrices [8]
| Analytical Technique | Limit of Detection (LOD) | Limit of Quantification (LOQ) |
|---|---|---|
| Electroanalysis (GCS) | 0.11 ± 0.01 mg L⁻¹ | 0.86 ± 0.04 mg L⁻¹ |
| HPLC | 0.35 ± 0.02 mg L⁻¹ | 2.86 ± 0.12 mg L⁻¹ |
This data demonstrates that for specific applications, electroanalysis can surpass HPLC in sensitivity while offering the benefits of speed and lower operational complexity.
Method Selection Workflow and Synergistic Use
Selecting the appropriate analytical method is critical for efficient and effective pharmaceutical R&D. The following diagram outlines a logical decision-making workflow.
A synergistic approach is often the most powerful. For instance, HPLC can be used during drug development to establish baseline purity and stability profiles, while electrochemical sensors derived from that knowledge can be developed for subsequent therapeutic monitoring in clinical settings.
Essential Research Reagent Solutions
The following table details key materials and reagents essential for executing the HPLC and electrochemical experiments described in this guide.
Table 3: Essential Research Reagent Solutions for HPLC and Electrochemical Analysis
| Item | Function / Application | Technical Specifications / Purpose |
|---|---|---|
| HPLC Reference Standard | Calibrates the HPLC system for API potency and identity [68]. | Qualified material with certified purity and concentration from a recognized supplier (e.g., USP). |
| Chromatography Column (C18) | Separates analytes in reversed-phase HPLC [68]. | ACE 3 C18, 150 x 4.6 mm, 3 µm; or equivalent. The backbone of the separation. |
| HPLC-Grade Solvents | Used as mobile phase components and for sample preparation [68]. | High-purity Acetonitrile, Methanol, and Water to minimize baseline noise and ghost peaks. |
| Buffer Salts & Additives | Modifies mobile phase to control pH and ionic strength, improving separation [68]. | e.g., Ammonium formate, Formic Acid. Grade: LC/MS recommended for optimal performance. |
| Electrochemical Standard | Used for calibration of electrochemical sensors [71]. | e.g., Potassium Ferricyanide for sensor characterization, or a pure standard of the target analyte (e.g., Diclofenac). |
| Electrode Modifying Nanomaterials | Enhances sensor sensitivity, selectivity, and stability [71] [72]. | Graphene oxide, Gold Nanoparticles (AuNPs), Carbon Nanotubes (MWCNTs). Create a conductive, high-surface-area platform. |
| Supporting Electrolyte | Provides ionic conductivity in the electrochemical cell and can influence reaction kinetics [71] [8]. | e.g., Britton-Robinson (BR) buffer, Phosphate Buffered Saline (PBS), or Sodium Chloride solution. |
HPLC and electrochemical sensing are powerful analytical techniques with distinct and overlapping application scopes in pharmaceutical research and development. HPLC remains the irreplaceable workhorse for ensuring drug quality, purity, and stability from the API stage through to the final product, providing the rigorous data demanded for regulatory compliance [66]. In contrast, electrochemical sensors represent the vanguard of analytical technology, offering transformative potential for real-time monitoring in biologics, personalized therapeutic drug monitoring, and rapid environmental screening [71] [70].
The future of pharmaceutical analysis lies not in choosing one technique over the other, but in strategically deploying them based on the specific analytical question. As electrochemical biosensors continue to mature, gaining in robustness and regulatory acceptance, their integration with the established power of HPLC will undoubtedly accelerate drug development and usher in a new era of advanced, patient-specific therapies.
Solving Common Problems and Enhancing Analytical Performance
In pharmaceutical research and quality control, High-Performance Liquid Chromatography (HPLC) remains a cornerstone analytical technique for drug separation, identification, and quantification. Robust HPLC methods that deliver consistent peak shape and retention are fundamental to ensuring accurate results in drug development, stability testing, and impurity profiling. However, analysts frequently encounter three persistent challenges that compromise data integrity: peak tailing, broad peaks, and retention time shifts. Effectively troubleshooting these issues is essential for maintaining method reproducibility and regulatory compliance.
This guide provides a systematic approach to diagnosing and resolving common HPLC problems, framed within the broader context of analytical method selection. As the pharmaceutical industry increasingly adopts innovative techniques like electrochemical analysis for specific applications, understanding the comparative strengths and maintenance requirements of HPLC is crucial for strategic method deployment.
Understanding and Troubleshooting Common HPLC Peak Shape Issues
Peak Tailing: Causes and Corrective Strategies
Peak tailing is characterized by an asymmetrical peak with a prolonged trailing edge. It is quantified using the Tailing Factor (Tf), where a value of 1.0 is ideal, and values exceeding 1.2-1.5 generally indicate problematic tailing [73] [74].
Primary Causes and Solutions for Peak Tailing:
- Silanol Interactions: Under acidic or aqueous conditions, residual silanol groups on the silica support can ionize and strongly interact with basic analytes, causing tailing [73].
- Column Degradation: Voids in the column bed or a partially blocked inlet frit disrupt the laminar flow path [75] [73].
- Solution: Replace the column, or reverse it and flush with a strong solvent to clear the inlet frit (ensure the column is disconnected from the detector during flushing) [73].
- Mass Overload: Injecting too much sample saturates the stationary phase [73] [74].
- Solution: Dilute the sample or reduce the injection volume. A quick test is to dilute the sample 10-fold and re-inject [73].
- Inactive Sites and Contamination: Contaminants from samples or the mobile phase can create active sites on the stationary phase, leading to mixed retention mechanisms and tailing [75] [76].
Broad Peaks: Origins and Remedies
Broad, wide peaks reduce resolution and detection sensitivity. This problem often stems from factors that increase the resistance to mass transfer of the analyte.
Key Causes and Fixes for Broad Peaks:
- Extra-column Band Broadening: Tubing with large internal volume, large detector flow cells, or loose fittings create dead volume where diffusion occurs [74] [76].
- Solution: Minimize system dead volume by using short, narrow-bore tubing (e.g., 0.12-0.17 mm ID) and ensure all fittings are properly tightened [74].
- Slow Detector Response: A detector time constant set too high can distort and broaden peaks [74].
- Solution: Reduce the detector's time constant setting to a more appropriate value for the peak widths in your method [74].
- Weak Elution Strength: A mobile phase with insufficient elution strength causes analytes to linger on the column, leading to broad, late-eluting peaks [74].
- Solution: Increase the percentage of organic modifier (e.g., acetonitrile or methanol) in the mobile phase [74].
- Column Deterioration: An old or contaminated column loses efficiency, reflected as peak broadening over time [74].
- Solution: Flush the column with a strong solvent. If performance does not improve, replace the column [74].
Retention Time Shifts: Diagnosis and Stabilization
Retention time (RT) drift complicates peak identification and integration, jeopardizing quantitative accuracy.
Systematic Diagnosis of Retention Time Shifts [77] [78]:
Diagnosing Retention Time Shifts: A simple diagnostic check of the solvent front (t₀ marker) can pinpoint the general cause of retention time instability [77].
Common Causes and Stabilization Techniques:
- Mobile Phase Instability: For pre-mixed mobile phases, the more volatile organic component (e.g., acetonitrile) or pH-modifier (e.g., TFA) can evaporate, progressively changing the eluent composition and increasing retention [77].
- Solution: Prepare fresh mobile phase daily, ensure solvent bottles are tightly capped, and avoid placing reservoirs under air conditioning vents [77]. Consider using a pump capable of dynamic mixing.
- Inadequate Temperature Control: In reversed-phase HPLC, a 1°C change in temperature can alter retention by approximately 2% [78].
- Solution: Always use a thermostatted column oven. Never operate a column without active temperature control [78].
- Column Equilibration: A new column, or one subjected to a change in mobile phase, may require several "priming" injections to irreversibly bind to the most active silanol sites, leading to initial RT drift that stabilizes over time [77].
- Solution: Condition a new column with multiple injections of the actual sample or a high-concentration standard to speed up equilibration [77].
- Small Leaks: A very small, slow leak in the system may not form a visible droplet but can cause a gradual reduction in flow rate and an increase in retention times [77].
- Solution: Check all unions and connections with a folded piece of laboratory absorbent paper; a dark blue wet spot will indicate a leak [77].
The Scientist's Toolkit: Essential Reagents and Consumables
The quality and compatibility of consumables are often overlooked factors that directly impact HPLC performance [76].
Table 1: Essential Research Reagent Solutions for HPLC Troubleshooting
| Item | Function & Importance | Selection Guide |
|---|---|---|
| Guard Column | Protects the expensive analytical column by trapping contaminants and particulates from samples, greatly extending column life [73] [74]. | Pack with the same stationary phase as your analytical column. |
| In-line Filter | Placed between the injector and column, it protects against particles from the injector or that were not fully removed by sample filtration [73]. | Use a 0.5-2 µm porosity frit. |
| Syringe Filters | Removes particulate matter from samples that could block column frits. Membrane choice is critical to avoid analyte adsorption [76]. | PTFE: Best for organic solvents. Nylon: General purpose, avoid with strong acids/bases. PES: Good for biological samples. |
| Silanized Vials | Vials with deactivated (silanized) glass surfaces prevent adsorption of basic or metal-sensitive analytes, which can cause tailing and recovery issues [76]. | Essential for analyzing basic compounds at low concentrations. |
| PTFE-lined Septa | Provides superior chemical resistance against the mobile phase, reducing extractable compounds that cause ghost peaks and baseline drift [76]. | Highly recommended for LC-MS and high-organic mobile phases. |
| High-Purity Buffers | Low-purity salts and additives contain UV-absorbing impurities that contribute to high background noise and ghost peaks [74]. | Use HPLC-grade or LC-MS grade solvents and additives. |
A Systematic Workflow for Troubleshooting Poor Peak Shape
Adopting a logical, step-by-step workflow prevents haphazard troubleshooting and saves time.
Table 2: Systematic Troubleshooting Workflow for HPLC Peak Shape
| Step | Action | Goal |
|---|---|---|
| 1 | Confirm the Problem: Calculate the Tailing Factor (Tf) or plate count (N). Compare with historical system suitability data [74]. | Objectively characterize the issue and determine if it is new or progressive. |
| 2 | Isolate the Cause: Change one variable at a time. Start with the simplest: prepare a fresh mobile phase, then replace the column with a known-good one [78]. | Systematically narrow down the root cause (mobile phase, column, or instrument). |
| 3 | Inspect the Column: Check for increased backpressure. If a void is suspected, reverse the column and flush. If blocked, replace the inlet frit or the column [75] [73]. | Determine if the column is the source of the problem. |
| 4 | Evaluate the Mobile Phase: Verify pH (±0.1 units of target) and buffer concentration (≥20 mM). Ensure solvents are fresh and properly degassed [74] [76]. | Eliminate mobile phase composition as a variable. |
| 5 | Assess Sample & Consumables: Check for sample overloading and solvent mismatch. Use inert, low-extractable filters and vials to eliminate adsorption [74] [76]. | Rule out sample-induced problems or contamination from consumables. |
| 6 | Check Instrument Hardware: Look for leaks, check for extra-column volume (tubing, fittings), and verify detector settings (e.g., time constant) [74] [78]. | Identify and correct instrumental faults. |
Systematic HPLC Troubleshooting Workflow: A sequential approach to efficiently diagnosing and resolving chromatographic issues.
HPLC in Context: A Comparative View with Electroanalysis
While HPLC is a powerful and versatile workhorse, the selection of an analytical technique in pharmaceutical research is strategic. Electroanalysis has emerged as a complementary technique, particularly for specific applications where its advantages are pronounced.
Electrochemical methods, including various voltammetry and potentiometry techniques, offer high sensitivity, minimal sample volume requirements, and cost-effectiveness [30]. Recent innovations, such as paper-based electrochemical devices and wearable sensors, highlight a trend toward portability and real-time monitoring [79] [30]. These devices are gaining traction for sustainable quality control, environmental monitoring of drug residues, and point-of-care therapeutic drug monitoring [79].
Table 3: Technique Selection: HPLC vs. Electroanalysis for Pharmaceutical Analysis
| Parameter | HPLC | Electroanalysis |
|---|---|---|
| Analytical Scope | Broad, for a wide range of non-volatile and volatile compounds. | Targeted, for electroactive species (compounds that can undergo redox reactions). |
| Sensitivity | High (e.g., ng/mL with UV detection). | Very High (e.g., pg/mL or lower with stripping voltammetry) [30]. |
| Sample Throughput | Moderate (typical run times of 10-30 min). | Rapid (analysis can take seconds to minutes) [30]. |
| Instrument Portability | Low (benchtop systems). | High (lab-on-a-chip, portable sensors) [79] [30]. |
| Operational Complexity | Higher (requires skilled operation, high-purity solvents). | Lower (minimal solvent use, simpler instrumentation) [30]. |
| Ideal Application | Stability-indicating methods, impurity profiling, pharmacokinetic studies. | Therapeutic drug monitoring, detection of specific metabolites, trace metal analysis, portable diagnostics [30]. |
The choice between HPLC and electroanalysis is not a matter of superiority but of fitness-for-purpose. HPLC provides a comprehensive, universal separation platform ideal for complex mixtures and unknown impurities. In contrast, modern electroanalysis offers a sensitive, rapid, and portable solution for targeted analyses, especially in settings outside the central laboratory. A robust HPLC method, free from peak shape and retention time issues, ensures data integrity for regulatory filings. Meanwhile, the rise of electroanalysis points to a future of decentralized testing and personalized medicine, expanding the toolkit available to pharmaceutical scientists.
Achieving and maintaining optimal HPLC performance requires a disciplined approach to method development and troubleshooting. Problems of peak tailing, broadening, and retention time shifts are common but manageable through a systematic process of elimination—addressing the mobile phase, column, sample, and instrument in sequence. Furthermore, the quality of consumables, from filters to vials, is a critical but often neglected factor that can make the difference between a robust and a problematic method.
As the pharmaceutical analytical landscape evolves, understanding the specific capabilities and maintenance needs of workhorse techniques like HPLC allows for more strategic method selection. While HPLC continues to be indispensable for comprehensive separation, emerging electrochemical techniques offer compelling advantages for specific, targeted applications, particularly in the realms of portability and real-time analysis. Mastering HPLC troubleshooting ensures that this foundational technology continues to deliver the reliable data that drug development relies on.
The selection of an appropriate analytical technique is a critical decision in pharmaceutical research, often involving a trade-off between the simplicity of electrochemical methods and the established robustness of High-Performance Liquid Chromatography (HPLC). A principal factor influencing this choice is the integrity of the electrode surface. Electrode fouling—the non-specific adsorption of proteins, organic molecules, or other sample matrix components onto the electrode surface—leads to diminished signal intensity, altered redox potentials, and poor reproducibility [30]. This degradation of performance poses a significant challenge for the adoption of electrochemical methods in quality control and pharmacokinetic studies. This guide provides a detailed examination of the sources of electrode fouling, outlines strategies to mitigate it, and establishes a framework for ensuring the reproducibility of electrochemical measurements, thereby enabling informed method selection for pharmaceutical analysis.
Understanding Electrode Fouling and Its Impact on Reproducibility
Electrode fouling occurs when molecules from a complex sample matrix adsorb onto the active surface of the electrode. This layer of contaminants can block electron transfer, increase impedance, and reduce the effective surface area, directly compromising analytical performance [30]. In the context of a broader thesis comparing electrochemical and HPLC methods, fouling is a key differentiator. While HPLC columns can also experience fouling, it is often more predictable and manageable through sample clean-up and column regeneration protocols. Electrode fouling, conversely, can be rapid and catastrophic for a single experiment.
The consequences of fouling are twofold. First, it causes a loss of sensitivity, manifesting as a gradual decrease in peak current with successive measurements [30]. Second, it undermines reproducibility, a cornerstone of analytical chemistry. Results become highly dependent on the history of the electrode and the number of previous sample injections, making it difficult to obtain consistent quantitative data across a batch of samples or between different laboratories. As noted in a metrology-led perspective, electrochemical experiments are highly sensitive, and their results are "often of uncertain quality and challenging to reproduce quantitatively" without rigorous control [80]. This uncertainty can tilt the balance in favor of HPLC for regulated pharmaceutical quality control, where demonstrating method robustness is paramount.
Strategic Approaches to Prevent Electrode Fouling
Preventing the adsorption of contaminants is the most effective way to maintain electrode integrity. This can be achieved through several strategic approaches, each with its own mechanisms and applications.
Electrode Selection and Design
The fundamental choice of electrode material and its physical design sets the baseline for fouling resistance.
- Material Choice: Glassy carbon is widely used due to its relatively low adsorption and ease of surface renewal [8]. For more demanding applications, boron-doped diamond (BDD) electrodes are superior; their inert surface and low background current make them highly resistant to fouling [8].
- Advanced Fabrication: 3D-printed electrodes represent a transformative approach. They offer unprecedented flexibility to design porous or architectured surfaces that can minimize fouling. Furthermore, they can be printed with novel carbon-based composites and metal-containing filaments that enhance both conductivity and stability [81].
- Surface Modification: Creating a physical barrier on the electrode is a highly effective strategy. This can involve:
- Nanomaterial Coatings: Applying a layer of carbon nanotubes or graphene can create a size-exclusion effect or reduce non-specific binding.
- Polymer Films: Coatings like Nafion can repel interferents based on charge, while hydrogels can create a biocompatible layer that resists protein adsorption.
- Molecularly Imprinted Polymers (MIPs): These polymers are synthesized to have cavities specific to the target analyte, allowing the molecule of interest to bind while excluding larger or differently shaped fouling agents [82].
Operational and Electrochemical Strategies
Adjusting the measurement protocol itself can significantly reduce fouling.
- Pulse Voltammetry: Techniques like Differential Pulse Voltammetry (DPV) and Square Wave Voltammetry (SWV) are preferred over constant potential techniques because their pulsed waveforms help desorb contaminants between measurements. This significantly reduces background noise and enhances sensitivity for trace analysis in complex samples [30].
- Potential Cycling: Applying a high positive or negative potential between measurements can electrochemically "clean" the surface by oxidizing or reducing adsorbed organic materials. This is a common practice in conjunction with techniques like Cyclic Voltammetry (CV) [30].
Sample Preparation and System Cleanliness
The purity of the electrochemical system is paramount. Impurities present at trace levels (part per billion) in the electrolyte or originating from system components can substantially alter the electrode surface and lead to misleading results [80].
- Electrolyte Purity: The choice of electrolyte grade is critical. Studies have shown that using a higher purity grade acid, for instance, can prevent a three-fold decrease in the specific activity of a catalyst [80].
- Rigorous Cleaning Protocols: A robust cleaning regimen for all cell components is non-negotiable. This often involves the use of oxidising solutions like piranha solution, followed by boiling in high-purity water [80]. Cleaned glassware and electrodes should be stored appropriately to prevent recontamination.
- Counter Electrode Considerations: Reactions at the counter electrode can generate impurities. For example, using a platinum counter electrode to assess 'platinum-free' electrocatalysts can result in performance-enhancing contamination, invalidating the results [80].
Table 1: Comparison of Electrode Fouling Mitigation Strategies
| Strategy | Specific Technique | Mechanism of Action | Ideal Use Cases |
|---|---|---|---|
| Electrode Design | Boron-Doped Diamond (BDD) | Inert surface with low adsorption energy | Harsh environments, complex matrices |
| 3D-Printed Architectures | Design-controlled fluidics & surface area | Customizable, on-demand sensors | |
| Surface Modification | Nafion Coating | Cation-exchange repels anions & macromolecules | Biological samples (e.g., serum, urine) |
| Molecularly Imprinted Polymers (MIPs) | Size & shape-specific recognition | Analysis of specific drugs in impurities | |
| Electrochemical Technique | Differential Pulse Voltammetry (DPV) | Current sampling reduces capacitive contributions | Trace-level drug detection [30] |
| In-situ Potential Cleaning | Oxidizes/Reduces adsorbed contaminants | Protocols requiring repeated measurements |
Ensuring Experimental Reproducibility
Reproducibility extends beyond preventing fouling. It requires a holistic approach to experimental design and reporting.
Robust Experimental Design
A metrology-led perspective emphasizes defining the specific measurand (the quantity intended to be measured) and the measurement model (the mathematical relation among all quantities involved) [80]. This clarity is vital. For instance, if the measurand is the intrinsic activity of a catalyst, the uncompensated solution resistance (iR drop) is an error that must be corrected. However, if the measurand is the operating voltage of a full cell, iR compensation is inappropriate as the resistance is intrinsic to the device's performance [80].
The choice between ex situ, in situ, and operando measurements is another critical consideration. While operando testing provides the most relevant conditions, it often comes with increased uncertainty due to reduced experimental control. An informed compromise must be sought between the relevance and the uncertainty of the measurement [80].
Electrode Pretreatment and Surface Renewal
A consistent electrode surface state is a prerequisite for reproducible results. For glassy carbon electrodes, this involves a multi-step polishing regimen on a flat surface using successively finer alumina or diamond slurries, followed by thorough rinsing [8]. For some sensors, an electrochemical activation step, such as potential cycling in a suitable electrolyte, is required to ensure a defined and active surface. The practice of periodic surface renewal, whether by mechanical polishing or electrochemical etching, is essential [8].
Reference Electrode and Cell Geometry
The measured potential is sensitive to the geometry of the electrochemical cell. The reference electrode should be positioned close to the working electrode using a Luggin-Haber capillary to minimize errors from the iR drop, but not so close as to cause shielding [80]. The choice of reference electrode must also consider chemical compatibility, as components from the reference (e.g., chloride from Ag/AgCl) can leach into the solution and poison catalysts [80].
Experimental Protocols for Fouling Resistance and Reproducibility
Protocol: Fouling-Resistant Determination of a Drug Using DPV
This protocol is adapted from methodologies used for detecting persistent organic compounds like octocrylene, which is relevant for analyzing pharmaceutical contaminants in environmental matrices [8].
- Electrode Preparation: Polish a glassy carbon working electrode (e.g., 3.14 mm² area) with 0.05 μm alumina slurry on a microcloth pad. Rinse thoroughly with distilled water and then with the supporting electrolyte.
- Electrochemical Cell Setup: Use a three-electrode system with the polished glassy carbon electrode as the working electrode, an Ag/AgCl (3M KCl) reference electrode, and a platinum wire counter electrode. The electrolyte is a 0.04 M Britton-Robinson (BR) buffer at pH 6 [8].
- Instrument Parameters (DPV): Set the potentiostat to Differential Pulse Voltammetry mode with the following parameters: Initial potential: -0.8 V; Final potential: -1.5 V; Step potential: +0.005 V; Modulation amplitude: +0.1 V; Modulation time: 0.02 s; Time interval: 0.5 s; Equilibrium time: 10 s [8].
- Measurement and Surface Renewal: Between each measurement, polish the electrode lightly and rinse to refresh the surface. This ensures that adsorption from the previous sample does not carry over. The use of DPV's pulsed waveform itself helps to minimize fouling during the measurement.
Protocol: Assessing Reproducibility via Repeated Cyclic Voltammetry
This protocol provides a quantitative measure of electrode stability.
- Redox Probe Preparation: Prepare a 1 mM solution of potassium ferricyanide (K₃[Fe(CN)₆]) in 1 M KCl as a well-understood redox couple.
- Baseline Measurement: Record 10 consecutive cyclic voltammograms (CVs) in the redox probe solution at a scan rate of 50 mV/s, spanning the relevant potential window (e.g., 0 V to 0.6 V).
- Fouling Challenge: Expose the electrode to the complex sample matrix (e.g., diluted serum, formulated drug) for a set time (e.g., 2 minutes).
- Post-Exposure Measurement: Rinse the electrode and record another 10 consecutive CVs in the fresh redox probe solution.
- Data Analysis: Calculate the relative standard deviation (RSD) of the peak current for both the baseline and post-exposure sets. A significant increase in the RSD after exposure indicates that the electrode surface has become unstable and fouled, compromising reproducibility.
Electrochemical vs. HPLC Method Selection: An Integrity-Focused Framework
The decision to use an electrochemical method or HPLC for a pharmaceutical application should be guided by the sample matrix, the required sensitivity, and the need for robustness versus speed.
Table 2: Method Selection Guide: Electrochemical vs. HPLC for Pharmaceutical Analysis
| Parameter | Electrochemical Methods | HPLC |
|---|---|---|
| Sample Throughput | Very high for sequential analysis | Moderate (run-time dependent) |
| Sensitivity | Excellent (e.g., LODs in ng/mL) [30] | Excellent |
| Impact of Fouling | High (can be immediate and catastrophic) | Moderate (column pressure increases over time) |
| Fouling Mitigation | In-situ cleaning, surface renewal, pulsed techniques | Sample filtration, guard columns, column flushing |
| Operational Cost | Low (minimal solvent use) | High (solvent and column consumption) |
| Portability | High (lab-on-a-chip, portable sensors) [82] | Low (typically benchtop) |
| Ideal Use Case | Rapid, on-site therapeutic drug monitoring, trace metal analysis | Complex mixtures, stability-indicating methods, regulated QC |
HPLC is often the default for separating complex mixtures and for stability-indicating methods where multiple degradation products must be resolved. Its robustness in regulated quality control environments is well-established [83]. However, electrochemical methods offer compelling advantages in specific niches. They are unparalleled for portability and real-time monitoring, enabling potential point-of-care diagnostics [82] [30]. They also have a significantly lower cost per analysis and can achieve exceptional sensitivity with minimal sample preparation, as demonstrated by the detection of octocrylene with lower LOD and LOQ than HPLC [8].
The integrity of the electrode is the linchpin. If a fouling-resistant system can be designed and its reproducibility rigorously demonstrated, electrochemistry becomes a powerful and often superior alternative. For instance, the combination of a BDD electrode with DPV for analyzing a drug in a clean formulation could be faster, cheaper, and more sensitive than HPLC. Conversely, for analyzing the same drug in a crude biological fluid like blood, the fouling risk might make HPLC the more pragmatic choice despite its higher operational cost.
The Scientist's Toolkit: Essential Reagents and Materials
Table 3: Research Reagent Solutions for Electrode Integrity
| Item | Function | Example & Specification |
|---|---|---|
| Alumina Polishing Slurry | Mechanical renewal of electrode surface to remove fouling layers | 0.05 μm alpha-alumina powder in aqueous suspension |
| Boron-Doped Diamond (BDD) Electrode | Provides an inert, low-fouling electrode surface | BDD on silicon or niobium substrate |
| Nafion Perfluorinated Resin | Forms a cation-exchange coating to repel interfering anions and biomacromolecules | 5% wt solution in lower aliphatic alcohols |
| High-Purity Electrolyte Salts | Minimizes introduction of trace metallic or organic impurities that poison surfaces | Trace metal basis grade, ≥99.99% purity |
| Britton-Robinson (BR) Buffer | A versatile buffer system for maintaining pH across a wide range (2-12) | Prepared from acetic, boric, and phosphoric acids |
| Redox Probe Solution | For characterizing electrode activity and monitoring fouling | 1-5 mM Potassium ferricyanide in 1 M KCl |
Visual Workflows for Method Development and Selection
Electrode Protection Strategy Workflow
The following diagram illustrates the decision-making process for selecting the appropriate electrode protection strategy based on the sample matrix.
Method Selection Logic
This diagram outlines the core logic for choosing between electrochemical and HPLC methods based on analytical requirements and sample properties.
Electrode integrity is not merely a technical detail but the foundational element that determines the viability of electrochemical methods in pharmaceutical research. By understanding the mechanisms of fouling and systematically implementing the strategies outlined—from material selection and surface modification to rigorous experimental design—researchers can significantly enhance the reproducibility and robustness of their electrochemical data. This empowers a more confident and strategic selection of analytical techniques. When electrode integrity is assured, electrochemistry stands as a powerful, sensitive, and cost-effective alternative to HPLC, particularly for applications demanding portability, rapid analysis, and high sensitivity. A methodical approach to maintaining the electrode surface is therefore essential for unlocking the full potential of electroanalysis in the modern pharmaceutical laboratory.
Optimizing Mobile Phase and Sample Preparation for HPLC-ECD
High-Performance Liquid Chromatography with Electrochemical Detection (HPLC-ECD) combines exceptional separation capabilities with remarkable sensitivity for analyzing electroactive compounds. This technique is particularly valuable in pharmaceutical research for quantifying biomarkers, active pharmaceutical ingredients (APIs), and metabolites at trace levels in complex biological matrices. The core principle of ECD involves applying a specific potential to a working electrode, typically glassy carbon, which catalyzes the oxidation or reduction of analytes as they elute from the chromatography column. The resulting electron transfer generates a measurable current proportional to analyte concentration, enabling detection limits that can extend into the nanomolar or even picomolar range [21] [84].
The selectivity of HPLC-ECD is twofold: first from the chromatographic separation, and second from the electrochemical detection that responds only to compounds oxidizing or reducing at the applied potential. This dual selectivity makes it indispensable for analyzing complex samples like plasma, urine, and microdialysates where interfering compounds are abundant. However, this sensitivity demands rigorous optimization of both mobile phase composition and sample preparation to ensure robustness, reproducibility, and accuracy—critical factors in pharmaceutical development and quality control [85] [21].
Fundamental Principles of ECD Optimization
Electrochemical Detection Mechanism
Electrochemical detection operates on the principle of measuring current generated from redox reactions of analytes at a working electrode surface. When an electroactive substance elutes from the HPLC column into the flow cell, it undergoes oxidation (loses electrons) or reduction (gains electrons) at the electrode surface maintained at a specific potential. This electron transfer generates a current that is amplified and recorded as a chromatographic peak. The key components include the working electrode (where detection occurs), reference electrode (to maintain stable potential), and counter electrode (to complete the circuit) [84].
The detector response depends critically on the working electrode material and the applied potential. Glassy carbon electrodes are most common due to their wide potential window and good electrochemical properties for many organic molecules. The applied potential must be carefully optimized—too low and sensitivity suffers as the reaction doesn't occur efficiently; too high and background noise increases while selectivity decreases due to co-oxidation/reduction of interfering compounds. Modern electrochemical detectors can operate in various modes including direct current (DC), pulsed amperometric detection (PAD), and multi-electrode arrays, each offering distinct advantages for different applications [21] [84].
Critical Mobile Phase Requirements
The mobile phase in HPLC-ECD must fulfill dual requirements: providing effective chromatographic separation and supporting electrochemical detection. Unlike UV detection, ECD requires the mobile phase to be electrically conductive to carry the faradaic current. This is typically achieved by adding supporting electrolytes such as salts (e.g., LiClO₄, Na₂EDTA) or buffers at concentrations of 10-100 mM. The mobile phase must be free of dissolved oxygen and other electroactive impurities that would increase background noise and baseline drift [85] [86].
The pH of the mobile phase profoundly affects both separation and detection. It influences the ionization state of analytes, thereby affecting retention times and separation efficiency on reverse-phase columns. Perhaps more critically, pH significantly impacts the electrochemical behavior of many compounds, as proton transfer often accompanies electron transfer in organic redox reactions. For example, the optimal pH for detecting neurotransmitters was found to be approximately 1.65, dramatically affecting column efficiency and analyte elution time [87] [88]. Organic modifier content (acetonitrile, methanol) must be balanced to provide adequate retention while maintaining electrolyte solubility and detector stability.
Systematic Mobile Phase Optimization
Experimental Design Approaches
Modern HPLC-ECD method development increasingly employs structured experimental design (Design of Experiments, DOE) rather than one-factor-at-a-time approaches to efficiently navigate multivariate relationships between mobile phase parameters and chromatographic outcomes. Doehlert designs are particularly valuable as they explore the experimental space with minimal experiments while providing detailed insights into complex processes. In one application, a Doehlert design combined with chemometric tools like Pearson correlation and Partial Least Squares Discriminant Analysis (PLS-DA) revealed significant relationships between chromatographic parameters and experimental conditions [87] [88].
These methodologies systematically vary multiple factors simultaneously—such as pH, organic modifier比例, buffer concentration, and flow rate—to model their effects on critical responses including retention time, peak asymmetry, theoretical plate count, and resolution. This approach not only identifies optimal conditions but also reveals interaction effects between parameters that would be missed in univariate optimization. For instance, pH and organic modifier比例 often exhibit significant interactions affecting both separation efficiency and detection sensitivity [87] [89].
Key Mobile Phase Parameters and Their Effects
Table 1: Key Mobile Phase Parameters and Their Chromatographic Effects
| Parameter | Optimal Range | Primary Effects | Considerations |
|---|---|---|---|
| pH | Compound-dependent (e.g., 1.65 for neurotransmitters) | Significant impact on column efficiency, retention time, and detection sensitivity [87] [88] | Affects electrochemical reaction mechanism; must be compatible with column stability |
| Organic Modifier | 10-50% (ACN or MeOH) | Polarity index influences peak asymmetry and retention [87] | Higher percentages may reduce electrolyte solubility; affects backpressure |
| Buffer/Electrolyte | 10-100 mM | Provides conductivity; affects peak shape and efficiency [85] | Must be electrochemically inert at working potential; may require post-column addition |
| Flow Rate | 0.2-1.0 mL/min | Affects backpressure and analysis time; influences mass transport to electrode [89] | Higher flows may reduce electrochemical response due to shorter contact time |
pH Optimization: The mobile phase pH critically influences both chromatographic separation and electrochemical detection. For neurotransmitter analysis, optimal separation occurred at pH 1.65, using a mobile phase of ACN/MeOH/H₂O (11.25/3.25/85.5; v/v/v) [87] [88]. Low pH values generally enhance electrochemical response for oxidizable compounds like catecholamines by promoting the oxidation reaction. However, extremely low pH may compromise column longevity and must be balanced against separation requirements.
Organic Modifier Selection: The type and proportion of organic modifier significantly impact retention and selectivity. Acetonitrile generally provides better efficiency and lower backpressure than methanol, but methanol may offer different selectivity. The polarity index, influenced by the organic modifier ratio, directly affects peak asymmetry [87]. In vitamin C analysis, an isocratic mobile phase containing 1.5% methanol with 150 mM monochloroacetic acid and 2 mM Na₂EDTA at pH 3.0 provided excellent results [85].
Advanced Sample Preparation Strategies
Techniques for Complex Matrices
Table 2: Sample Preparation Methods for Different Matrices
| Matrix | Preparation Technique | Key Steps | Application Example |
|---|---|---|---|
| Plasma/Serum | Protein Precipitation | Ice-cold metaphosphoric acid (MPA) or perchloric acid addition, centrifugation [85] [28] | Vitamin C analysis: 10% MPA added to plasma, centrifuged, supernatant collected [85] |
| Biological Tissues | Homogenization + Extraction | Tissue homogenization in stabilizing acid, centrifugation, solid-phase extraction [28] | Mouse liver VC analysis: homogenization in stabilizing solution [28] |
| Animal Feedstuffs | Complex Cleanup | Extraction, back-extraction, SPE cleanup [90] | Macrolide antibiotics: multi-step cleanup to remove matrix interferents [90] |
| Microdialysates | Direct Injection or Minimal Processing | Often direct injection due to low volume; dilution with acid if needed [21] | Neurotransmitter analysis: direct injection of cerebral microdialysates [21] |
Effective sample preparation is crucial for successful HPLC-ECD analysis, particularly for complex pharmaceutical and biological samples. Protein precipitation remains the most common technique for plasma and serum samples, typically using acids like metaphosphoric acid (MPA), perchloric acid, or trichloroacetic acid. These acids simultaneously precipitate proteins and stabilize easily oxidizable compounds like ascorbic acid and catecholamines. For example, in vitamin C analysis, ice-cold 10% MPA was added to plasma samples in a 1:1 ratio, followed by vortexing and centrifugation at 23,000×g for 5 minutes at 4°C [85] [28].
For more complex matrices or lower concentration analytes, solid-phase extraction (SPE) provides superior cleanup and preconcentration. Selective sorbents and optimized washing/elution protocols can significantly reduce matrix effects and improve method sensitivity. In monitoring macrolide antibiotics in animal feedingstuffs, researchers developed a multi-step sample preparation strategy involving liquid-liquid extraction and back-extraction to obtain sufficiently clean extracts for reliable quantification at target levels of 1.0 mg kg⁻¹ [90].
Stabilization of Electroactive Analytes
Many electroactive compounds are inherently unstable and require specialized handling to prevent degradation. Ascorbic acid oxidizes rapidly in neutral or basic conditions, while catecholamines are susceptible to oxidative degradation. Effective stabilization strategies include:
- Immediate acidification of samples after collection
- Addition of antioxidants like dithiothreitol (DTT) or EDTA
- Protection from light and oxygen
- Maintenance of low temperature during processing
- Rapid analysis or storage at -70°C [85] [28]
For vitamin C analysis in plasma, samples were treated with dithiothreitol (DTT) to reduce dehydroascorbic acid to ascorbic acid, followed by incubation at 4°C for 30 minutes. This step ensured accurate total vitamin C measurement and prevented oxidative losses during analysis [85].
Integrated Method Development Protocol
Systematic Optimization Workflow
Diagram 1: HPLC-ECD Method Development Workflow
A structured approach to HPLC-ECD method development ensures robust and reproducible methods. Begin by defining analytical goals including sensitivity requirements, linear range, precision, and sample throughput. Initial mobile phase screening should systematically evaluate different pH values, organic modifiers, and buffer systems to identify promising ranges. Concurrently, hydrodynamic voltammetry studies determine optimal working potentials for target analytes—selecting a potential on the current plateau while minimizing background noise [87] [84].
Once preliminary conditions are established, apply experimental design methodologies to model interactions between critical parameters and optimize multiple responses simultaneously. For example, a Box-Behnken design can efficiently optimize the percentage of organic phase, flow rate, and column temperature to achieve desired retention times, tailing factors, and theoretical plates [89]. The final method must be thoroughly validated according to ICH guidelines, assessing linearity, accuracy, precision, specificity, LOD, LOQ, and robustness [89].
Troubleshooting Common Issues
Common challenges in HPLC-ECD include high background noise, drifting baselines, decreased sensitivity, and peak shape issues. High background noise often results from contaminated mobile phase, electrode fouling, or insufficient degassing. Regular electrode maintenance including polishing for glassy carbon electrodes is essential for maintaining sensitivity. Drifting baselines may indicate mobile phase decomposition, temperature fluctuations, or reference electrode instability. Peak tailing can be addressed by adjusting mobile phase pH, adding ion-pairing reagents, or modifying organic modifier content [85] [84].
HPLC-ECD in Pharmaceutical Applications
Representative Method Parameters
Table 3: Optimized HPLC-ECD Conditions for Different Analytes
| Analyte Class | Mobile Phase Composition | Detection Potential | Sample Preparation | LOD/LOQ |
|---|---|---|---|---|
| Neurotransmitters (DA, 5-HT, metabolites) | ACN/MeOH/H₂O (11.25/3.25/85.5; v/v/v), pH 1.65 [87] [88] | Not specified | Protein precipitation, microdialysis | LOD ~10⁻¹¹ mol/L, LOQ ~10⁻¹⁰ mol/L [87] |
| Vitamin C (Plasma) | 150 mM monochloroacetic acid, 2 mM Na₂EDTA, 1.5% MeOH, pH 3.0 [85] | Coulombetry | Protein precipitation with MPA, reduction with DTT | LOQ: 1.9 µmol/L [85] |
| Vitamin C (Honey) | Not specified | Not specified | Extraction with 1% MPA | LOD: 0.0043 µg/mL [28] |
| Macrolide Antibiotics | Not specified | Multi-electrode array | Complex clean-up, back-extraction [90] | 0.04-0.22 mg/kg [90] |
HPLC-ECD has been successfully applied to diverse pharmaceutical analyses. For neurotransmitter monitoring in microdialysates, optimized methods achieve remarkable sensitivity with detection limits approaching 10⁻¹¹ mol/L, enabling real-time monitoring of extracellular neurotransmitter dynamics in preclinical studies [87] [21]. For vitamin C analysis in plasma, methods demonstrate excellent precision (RSD <5%) with quantification limits of 1.9 µmol/L, suitable for nutritional assessment and pharmacokinetic studies [85] [28].
The technique has been extended to antibiotic residue analysis in complex matrices like animal feedingstuffs, where careful sample cleanup enables quantification of multiple macrolide antibiotics at regulatory levels despite significant matrix challenges. The method's selectivity allows reliable quantification even without mass spectrometric detection when appropriate sample preparation and electrochemical conditions are employed [90].
The Scientist's Toolkit: Essential Research Reagents
Table 4: Essential Reagents for HPLC-ECD Analysis
| Reagent | Function | Application Notes |
|---|---|---|
| Metaphosphoric Acid (MPA) | Protein precipitant and antioxidant | Stabilizes ascorbic acid and catecholamines; use ice-cold [85] [28] |
| Dithiothreitol (DTT) | Reducing agent | Converts dehydroascorbic acid to ascorbic acid; improves recovery [85] |
| Na₂EDTA | Chelating agent | Binds metal ions that catalyze oxidation; improves stability [85] |
| Monochloroacetic Acid | Buffer component | Provides low pH mobile phase for separation of acids [85] |
| Acetonitrile (HPLC grade) | Organic modifier | Preferred for reverse-phase separation; low UV cutoff [87] |
HPLC-ECD offers unparalleled sensitivity for electroactive compounds compared to UV or fluorescence detection, often achieving detection limits 10-1000 times lower. When selecting between electrochemical and alternative detection methods, consider analyte electroactivity, required sensitivity, matrix complexity, and available resources. ECD is particularly advantageous for monitoring catecholamines, ascorbic acid, phenolic compounds, and other easily oxidizable/reducible molecules in biological matrices at trace concentrations [21] [28] [8].
While LC-MS/MS provides superior structural information and broader applicability, HPLC-ECD remains a cost-effective alternative with excellent sensitivity for targeted analysis of electroactive compounds. The technique's relative simplicity, lower operational costs, and minimal maintenance requirements make it particularly valuable for high-throughput routine analysis in pharmaceutical quality control and clinical research settings [21] [8]. Successful implementation requires careful attention to both chromatographic and electrochemical parameters, with systematic optimization of mobile phase composition and sample preparation protocols tailored to specific analytical challenges.
In the context of pharmaceutical research, the selection of analytical techniques is paramount for ensuring accurate pharmacokinetic and metabolic studies. High-Performance Liquid Chromatography (HPLC) coupled with electrochemical detection (ECD) represents a powerful tool for quantifying electroactive compounds, particularly those lacking strong chromophores for UV-Vis detection. Within this domain, reductive electrochemical detection offers unique advantages for analyzing compounds that undergo facile reduction, such as artemisinin-based antimalarials and various quinones [45]. However, this technique presents two formidable technical challenges: the pervasive interference of dissolved oxygen and the requirement for stringent temperature control.
The presence of oxygen in the mobile phase and sample matrices poses a significant problem for reductive ECD, as oxygen is electroactive and undergoes reduction within the typical operating potential window used for many pharmaceutical compounds. This interference manifests as a high background current, increased noise, and diminished signal-to-noise ratios, ultimately compromising detection sensitivity and reliability [45]. Simultaneously, the temperature sensitivity of electrochemical reactions and chromatographic separations demands precise thermal management to ensure reproducible retention times and detector response [45]. This technical guide examines these challenges in detail, providing practical solutions framed within the broader method selection paradigm for pharmaceutical analysis, where the superior sensitivity of ECD often competes with the versatility of mass spectrometric detection.
The Oxygen Interference Problem: Mechanisms and Impacts
Electrochemical Mechanisms of Oxygen Interference
Dissolved oxygen interferes with reductive detection through its electroactivity at typical working electrode surfaces. Oxygen can be reduced via two primary pathways in aqueous solutions:
- Two-electron reduction to hydrogen peroxide (in acidic media): O₂ + 2H⁺ + 2e⁻ → H₂O₂
- Four-electron reduction to water (in acidic media): O₂ + 4H⁺ + 4e⁻ → 2H₂O
These reduction reactions occur within the potential window commonly employed for reductive detection of pharmaceutical compounds (-0.2 V to -1.0 V vs. Ag/AgCl), generating a substantial background current that can mask the analyte signal, increase baseline noise, and reduce overall method sensitivity [45]. The problem is particularly acute in pharmaceutical analysis where low plasma concentrations of drugs and metabolites (often in the nanomolar to picomolar range) must be quantified against this interfering background.
Impact on Analytical Figures of Merit
The analytical consequences of oxygen interference are substantial, as evidenced by comparative studies of HPLC-ECD and LC-MS/MS for antimalarial analysis. When oxygen is not adequately removed, key method parameters are compromised [45]:
- Increased limits of detection (LOD) and quantification (LOQ)
- Reduced linear dynamic range due to background current saturation effects
- Impaired precision and accuracy from fluctuating oxygen levels
- Decreased electrode stability requiring more frequent maintenance and cleaning
Table 1: Comparative Performance of HPLC-ECD with Inadequate Oxygen Removal
| Parameter | Impact of Oxygen Interference | Effect on Pharmaceutical Analysis |
|---|---|---|
| Background Current | Increased significantly | Reduces signal-to-noise ratio for trace analytes |
| Baseline Noise | 3-5 fold increase | Compromises detection of low-abundance metabolites |
| Detection Limit | Elevated 5-10x | Impairs quantification of drugs at therapeutic levels |
| Reproducibility | Poor (%RSD >15%) | Undermines method validation for regulatory submission |
| Electrode Stability | Rapid fouling requiring frequent cleaning | Increases downtime and cost of analysis |
Strategies for Oxygen Removal in Reductive EC Detection
Traditional Deoxygenation Methods
Traditional approaches to oxygen removal have centered on physical displacement and chemical scavenging:
Sparging with Inert Gases: Bubbling high-purity nitrogen or argon through the mobile phase remains the most common deoxygenation method. Effective sparging requires:
- Oxygen-free grade gases (typically <5 ppm O₂ contamination)
- Fine-frit sparging tubes to create small bubbles with high surface area
- Continuous sparging during operation or extensive pre-sparging (30-60 minutes)
- Maintenance of positive pressure in mobile phase reservoirs to prevent oxygen back-diffusion
While effective, this approach consumes large volumes of expensive high-purity gases and presents challenges in maintaining consistent oxygen-free conditions throughout the entire HPLC flow path, particularly with gradient elution where changing solvent compositions exhibit varying oxygen solubility [45].
Chemical Scavengers: Commercially available oxygen scavenging systems can be incorporated into the mobile phase pathway. These typically employ:
- Self-contained cartridge systems placed between the mobile phase reservoir and the degasser
- Catalytic deoxygenation using metal catalysts (e.g., platinum) with hydrogen as a reducing agent
- In-line membrane contactors that facilitate gas exchange
These systems can effectively reduce oxygen to sub-ppb levels but introduce additional complexity, cost, and potential for introducing contaminants into the mobile phase.
Advanced Electrochemical Oxygen Management
Recent technological advances have introduced innovative electrochemical solutions for oxygen control that offer significant advantages for precision applications:
Integrated Electrochemical Oxygen Conditioners: Modern devices integrate both oxygen removal and generation functions into a single electrochemical stack, enabling precise environmental oxygen regulation through controlled electrochemical oxygen reduction and evolution reactions. These systems achieve [91]:
- Precise O₂ control from 1% to 99% concentration
- Rapid oxygen removal rates up to 470 mL/min
- Substantial reductions in size (>90%) and energy consumption (73%) compared to traditional systems like pressure swing adsorption
- Direct integration with fermentation systems or analytical instrumentation
Self-Powered Electrochemical Oxygen Removal: Novel systems utilize a sacrificial anode to self-power the cathodic oxygen reduction reaction, efficiently consuming environmental oxygen without external power requirements. These devices feature [92]:
- Real-time oxygen concentration estimation with ±1% accuracy (within 21%-1% range)
- Multi-dimensional oxygen removal control via electronic components
- Portable, low-cost design suitable for benchtop analytical systems
- Catalyst-enhanced efficiency using single-atom oxygen reduction reaction catalysts
Table 2: Comparison of Oxygen Removal Technologies for Reductive ECD
| Technology | Mechanism | Residual O₂ | Advantages | Limitations |
|---|---|---|---|---|
| Sparging | Physical displacement | 0.1-1 ppm | Simple implementation, well-established | High gas consumption, inconsistent |
| Chemical Scavengers | Chemical reduction | <0.1 ppm | Effective for trace O₂ | Ongoing cost, potential contamination |
| Electrochemical Conditioners | Electrochemical reduction | <0.01 ppm | Precise control, compact size | Higher initial investment, complexity |
| Membrane Degassers | Permeation through membrane | 1-5 ppm | Continuous operation, no consumables | Limited efficiency for reductive ECD |
Implementation Protocol: Comprehensive Mobile Phase Deoxygenation
For pharmaceutical laboratories implementing reductive ECD, the following protocol ensures effective oxygen removal:
Mobile Phase Preparation:
- Use high-purity solvents and water (HPLC grade)
- Add electrolytes (e.g., 0.1 M LiClO₄) before deoxygenation
- Filter through 0.2 μm membrane to remove particulates
Primary Deoxygenation:
- Sparge with helium (preferred) or nitrogen for 30 minutes minimum
- Use fine-frit spargers (10-20 μm porosity) for efficient gas transfer
- Maintain sparging during analysis at reduced flow rates (20-50 mL/min)
Secondary In-line Deoxygenation:
- Install commercial membrane degasser with oxygen-scavenging capability
- Alternatively, implement electrochemical oxygen removal system
- Ensure all tubing connections are gas-tight to prevent oxygen ingress
System Validation:
- Measure baseline current at analytical potential over 60 minutes
- Acceptable performance: <5% drift in baseline current
- Verify with standard injection (e.g., 10 nM hydroquinone) with peak area %RSD <3%
Temperature Control in Reductive Electrochemical Detection
Temperature Effects on Analytical Performance
Temperature influences multiple aspects of reductive ECD performance, creating a critical need for precise thermal management:
Electrochemical Response Sensitivity: The rate of electrochemical reactions typically increases with temperature, with current responses generally following Arrhenius-type behavior (2-3% increase per °C). However, this relationship is complex and compound-dependent, making consistent temperature control essential for quantitative reproducibility [45].
Chromatographic Separation Efficiency: Temperature affects retention times, separation efficiency, and peak shape in the HPLC separation preceding detection. fluctuations as small as 1-2°C can cause measurable shifts in retention times, potentially leading to misidentification of compounds in complex pharmaceutical matrices [45].
Baseline Stability: Temperature fluctuations cause expansion and contraction of mobile phase, leading to baseline drift that complicates integration of trace-level pharmaceutical compounds and their metabolites.
Temperature Control Implementation Strategies
Effective temperature control requires a multi-layered approach:
Mobile Phase Pre-equilibration:
- Utilize heated/cooled compartment for mobile phase reservoirs
- Maintain temperature within ±0.5°C of analytical column temperature
- Use pre-column heat exchangers for incoming mobile phase
Analytical Column Thermostatting:
- Employ forced-air circulation ovens or Peltier-based column heaters
- Maintain temperature stability of ±0.1°C during analysis
- Allow sufficient equilibration time (typically 30-60 minutes) after temperature changes
Electrochemical Cell Temperature Control:
- Implement direct temperature control of the flow cell
- Use integrated Peltier devices with feedback control
- Monitor cell temperature independently with precision thermistor
Table 3: Temperature Control Specifications for Pharmaceutical-Grade Reductive ECD
| Component | Recommended Stability | Monitoring Frequency | Corrective Action Threshold |
|---|---|---|---|
| Mobile Phase | ±0.5°C | Continuous | >1°C deviation requires re-equilibration |
| Analytical Column | ±0.1°C | Continuous | >0.2°C deviation triggers alarm |
| ECD Flow Cell | ±0.2°C | Every 30 seconds | >0.5°C deviation pauses analysis |
| Sample Compartment | ±1.0°C | Every minute | >2°C deviation requires sample re-preparation |
Method Validation in Pharmaceutical Analysis Context
Comparative Performance: HPLC-ECD vs. LC-MS/MS
When selecting analytical methods for pharmaceutical compounds, understanding the performance trade-offs between HPLC-ECD and LC-MS/MS is essential. For artesunate and dihydroartemisinin analysis in plasma, HPLC-ECD demonstrates [45]:
- Comparable linearity and precision to LC-MS/MS when properly calibrated
- Adequate sensitivity for most therapeutic drug monitoring applications
- Significantly lower instrumentation costs and operational complexity
However, LC-MS/MS offers distinct advantages for some applications:
- Superior sensitivity for ultra-trace analysis
- Reduced sample volume requirements (one-tenth that of HPLC-ECD)
- Simpler sample preparation without extensive deoxygenation needs
- Broader applicability to non-electroactive compounds
Validation Parameters for Reductive ECD Methods
For regulatory acceptance in pharmaceutical development, reductive ECD methods must demonstrate robust performance across key validation parameters:
Specificity: Verify absence of interference from oxygen, matrix components, and degradation products through:
- Comparison of blank plasma samples from at least six sources
- Forced degradation studies (heat, light, acid/base treatment)
- Assessment of resolution from known metabolites
Linearity and Range:
- Minimum of six concentration levels across the expected range
- Correlation coefficient (r) > 0.995 for pharmaceutical applications
- Back-calculated standards within ±15% of nominal value (±20% at LLOQ)
Accuracy and Precision:
- Intra-day precision: %RSD ≤ 15% (≤20% at LLOQ)
- Inter-day precision: %RSD ≤ 15% across three separate runs
- Accuracy: 85-115% of nominal value (80-120% at LLOQ)
The Scientist's Toolkit: Essential Research Reagent Solutions
Table 4: Key Research Reagents and Materials for Reductive ECD
| Item | Function | Technical Specifications | Application Notes |
|---|---|---|---|
| High-Purity Deoxygenated Electrolyte | Conductivity support in mobile phase | LiClO₄, concentration 0.05-0.1 M, O₂ < 1 ppm | Pre-purge with inert gas; store under positive pressure |
| Oxygen Scavenging Cartridge | In-line oxygen removal | Platinum-based catalyst, <0.1 ppm O₂ output | Replace after processing 1000 L mobile phase |
| Electrode Polishing System | Working electrode maintenance | Alumina powder (0.05 μm and 0.3 μm), polishing pads | Weekly polishing maintains sensitivity and reproducibility |
| Thermal Stabilization Unit | Temperature control of mobile phase and column | Peltier-based, stability ±0.1°C, range 4-40°C | Essential for retention time reproducibility |
| Sacrificial Anode Oxygen Remover | Self-powered oxygen consumption | Zn or Mg anode, air cathode, integrated catalyst | For stand-alone systems without external gas supply |
| In-line Degasser | Removal of dissolved gases | PTFE membrane, vacuum pressure <50 mbar | Reduces but does not eliminate oxygen for reductive ECD |
The successful implementation of reductive electrochemical detection in pharmaceutical research requires meticulous attention to oxygen elimination and temperature control. While these technical challenges present significant hurdles, the solutions outlined in this guide enable researchers to harness the exceptional sensitivity and selectivity of reductive ECD for appropriate applications.
The method selection decision between HPLC-ECD and alternative techniques like LC-MS/MS should be guided by specific application requirements. Reductive ECD offers compelling advantages for routine analysis of electroactive compounds where instrumentation cost is a concern, while LC-MS/MS provides broader applicability for discovery-phase research and ultra-trace analysis.
Future developments in electrochemical oxygen control technologies, particularly self-powered and integrated systems, promise to further reduce the operational burden of reductive ECD, potentially expanding its role in pharmaceutical analysis. By implementing the robust protocols and validation procedures detailed in this guide, researchers can overcome the historical challenges of reductive detection and leverage its unique capabilities for advancing drug development.
System Suitability and Precision Checks for Both Techniques
For researchers and scientists in pharmaceutical development, the selection and validation of an analytical technique is a critical decision that directly impacts data reliability and regulatory success. This guide provides an in-depth examination of system suitability tests (SSTs) and precision validation for two cornerstone methodologies: high-performance liquid chromatography (HPLC) and electrochemical methods. System suitability serves as a final verification that the entire analytical system—comprising instrument, reagents, column, and operator—is functioning correctly and is ready for use on a specific day of analysis [93]. Precision, defined as the closeness of agreement between a series of measurements obtained from multiple sampling of the same homogeneous sample, underpins the reliability of any quantitative method [94]. Within the context of pharmaceutical analysis, these parameters are not merely best practices but are mandatory requirements enforced by regulatory bodies and pharmacopeias such as ICH, FDA, and USP to ensure that every measurement is accurate, reproducible, and fit for its intended purpose [95] [96].
Core Principles of System Suitability
System suitability testing is a pharmacopeial requirement designed to ensure that the analytical system provides adequate resolution, sensitivity, precision, and reproducibility for the intended analysis at the time it is performed [93]. These tests are method-specific and are not a substitute for broader analytical instrument qualification (AIQ) [93].
The Regulatory Hierarchy and USP <621>
Chromatographic analysis in regulated GMP laboratories is controlled by pharmacopeial general chapters. USP General Chapter <621> is a mandatory standard for chromatography, and its requirements must be followed unless a specific monograph states otherwise [97]. The chapter details allowable adjustments to methods and the system suitability parameters that must be met. A significant update effective May 1, 2025, introduces new requirements for system sensitivity (signal-to-noise ratio) and peak symmetry, reinforcing the need for labs to stay current with evolving standards [97].
The relationship between the different components of analytical quality control in a regulated lab can be visualized as a hierarchy.
Key System Suitability Parameters
SSTs verify the performance of the complete analytical system against predefined criteria. The table below summarizes the core parameters for HPLC, as defined by authorities like the USP.
Table 1: Key System Suitability Test Parameters and Their Acceptance Criteria
| Parameter | Description | Typical Acceptance Criteria | Purpose |
|---|---|---|---|
| Resolution (Rs) | Ability to separate two adjacent peaks [93]. | Typically ≥ 1.5 between critical pair [93]. | Demonstrates specificity and selectivity of the method. |
| Precision/Repeatability | Closeness of agreement in a series of sequential injections [95]. | RSD of peak areas ≤ 2.0% for ≥5 injections [95] [93]. | Verifies injector precision and system stability. |
| Tailing Factor (Tf) | Measure of peak symmetry [93]. | Typically ≤ 2.0 [93]. | Indicates column health and appropriate chromatographic conditions. |
| Theoretical Plates (N) | Measure of column efficiency [95]. | As specified in the method; must be met. | Ensures the column is performing at adequate efficiency. |
| Signal-to-Noise (S/N) | Measure of system sensitivity for impurity methods [97]. | S/N ≥ 10 for LOQ [97]. | Confirms the system can reliably detect and quantify low-level impurities. |
Fundamentals of Precision Evaluation
Precision is a core component of analytical method validation, measuring the random error of a method. It is typically investigated at three levels: repeatability, intermediate precision, and reproducibility [95] [96].
Defining Precision and Accuracy
It is crucial to distinguish between precision and accuracy, as a method can be precise without being accurate, and vice-versa.
- Accuracy: The closeness of agreement between a test result and the accepted true value. It is often determined through recovery studies, where a known amount of analyte is spiked into a placebo or matrix, and the percentage recovered is measured [95] [94]. For assay methods, recovery should be evaluated across a range of 80-120% of the target concentration [95].
- Precision: The closeness of agreement between a series of measurements under specified conditions. It is usually expressed as relative standard deviation (RSD) or standard deviation [94].
Hierarchical Levels of Precision
Precision is not a single parameter but is stratified to reflect different sources of variability.
Table 2: Hierarchical Levels of Method Precision
| Precision Level | Experimental Conditions | Evaluation Purpose |
|---|---|---|
| Repeatability | Same analyst, same instrument, same day [95]. | Measures the basic reliability of the method under optimal conditions. |
| Intermediate Precision | Different days, different analysts, different instruments within the same lab [95]. | Assesses the method's robustness to normal laboratory variations. |
| Reproducibility | Comparison of results between different laboratories (collaborative studies) [96]. | Demonstrates the method's transferability and is required for standardization. |
For a method to be considered precise, the validation protocol must include a minimum of nine determinations over at least three concentration levels, often leading to a study design with triplicate preparations at the 80%, 100%, and 120% levels [95].
HPLC-Specific Protocols and Procedures
HPLC is the workhorse of pharmaceutical analysis, and its suitability and precision checks are well-defined and rigorous.
Experimental Workflow for HPLC SST and Precision
The following diagram outlines a standard workflow for establishing and verifying the performance of an HPLC method, from initial system preparation through to the final precision assessment.
Detailed Methodology for HPLC Validation
System Suitability Test Protocol:
- Preparation of SST Solution: Prepare a solution containing the active pharmaceutical ingredient (API) and critical impurities or a retention marker "cocktail" at specified concentrations [95].
- System Equilibration: Equilibrate the HPLC system with the mobile phase until a stable baseline is achieved.
- Injections and Calculation: Inject the SST solution a minimum of five times. Calculate the RSD for the peak areas and retention times of the API, and measure the resolution between the API and its closest eluting impurity [95] [93]. The system is only approved for use if all parameters meet the pre-defined acceptance criteria listed in Table 1.
Precision and Accuracy Validation Protocol:
- Study Design: For accuracy and repeatability, prepare a minimum of nine samples across three concentration levels (e.g., 80%, 100%, 120% of label claim) in triplicate [95] [98]. For intermediate precision, a second analyst repeats the entire study on a different day and with a different instrument.
- Sample Analysis: Analyze all samples following the validated method.
- Data Analysis:
The Scientist's Toolkit: Essential Reagents and Materials for HPLC
Table 3: Key Research Reagent Solutions for HPLC Method Validation
| Item | Function & Importance | Technical Specification Example |
|---|---|---|
| Chromatography Column | The heart of the separation; determines selectivity and efficiency [98]. | Luna C8 column (250 x 4.6 mm, 5 µm) for reversed-phase separation [98]. |
| Reference Standards | Used for peak identification, calibration, and quantification. Purity is critical for accuracy [94]. | Certified reference standards with documented purity (e.g., 99.8%) [98]. |
| Mobile Phase Buffers/Modifiers | Control pH, ionic strength, and improve separation of ionizable compounds [98]. | 0.02 M tetrabutylammonium sulfate for ion-pairing chromatography [98]. |
| Placebo Matrix | A mock formulation without the API; critical for demonstrating specificity and accuracy in drug products [95]. | Must contain all excipients in the same ratio as the actual drug product. |
Electrochemical Method-Specific Protocols
While specific electrochemical data in the provided results is limited, the core principles of validation are universally applied across analytical techniques, with adaptations for the technique's unique characteristics.
Adapting Core Principles to Electrochemical Systems
For electrochemical techniques (e.g., voltammetry, amperometric detection), system suitability and precision checks focus on parameters relevant to the electrode and electrochemical cell.
System Suitability Parameters:
- Electrode Stability: Verifying that the baseline current or potential is stable over time before sample analysis.
- Reproducibility of Response: Multiple measurements of a standard solution to ensure the electrode surface provides a consistent response, similar to injection precision in HPLC.
- Calibration Sensitivity: The slope of the calibration curve, confirming the system has adequate response to the analyte.
Precision and Accuracy Validation:
- The fundamental approach mirrors HPLC: repeated measurements of samples at multiple concentrations to determine repeatability and intermediate precision [96].
- Accuracy is often determined through standard addition methods, which is particularly useful in complex matrices to account for matrix effects [94]. This involves spiking the sample with known quantities of the analyte and measuring the recovery.
Comparative Analysis: HPLC vs. Electrochemical Methods
The choice between HPLC and electrochemical methods depends on the analytical problem, the nature of the analyte, and the required data quality.
Table 4: Comparison of System Suitability and Precision Checks for HPLC and Electrochemical Methods
| Aspect | HPLC | Electchemical Methods |
|---|---|---|
| Key SST Parameters | Resolution, Tailing, Theoretical Plates, Precision (RSD) of injections [93]. | Electrode stability, Reproducibility of response, Calibration slope. |
| Primary Precision Concerns | Injector precision, pump flow rate stability, column performance, detector noise [95]. | Electrode surface fouling, stability of reference electrode, stirring rate consistency. |
| Accuracy Determination | Spike recovery with placebo; comparison to certified reference material [95] [94]. | Standard addition method is common to compensate for matrix effects [94]. |
| Strengths | High separation power, universal detection (e.g., UV), robust validation guidelines [95]. | High sensitivity for electroactive species, potentially faster analysis, portable instrumentation. |
| Considerations for Selection | Ideal for complex mixtures and non-electroactive compounds. Requires more solvents and longer run times. | Ideal for specific electroactive analytes. Can be susceptible to matrix interference; electrode maintenance is critical. |
System suitability and precision checks are non-negotiable pillars of quality assurance in pharmaceutical analysis. For HPLC, the frameworks and acceptance criteria are mature, detailed, and explicitly defined in pharmacopeias like USP <621> [93] [97]. For electrochemical methods, the same rigorous principles apply, albeit with a focus on electrode-specific performance metrics. The selection between these techniques should be driven by the analyte's chemical properties, the complexity of the sample matrix, and the required sensitivity. Ultimately, a well-defined and executed validation strategy, incorporating daily system suitability testing, provides the foundation for generating reliable, defensible, and regulatory-compliant data that accelerates drug development and ensures product quality and safety.
Method Validation, Comparison, and Data-Driven Selection
In pharmaceutical research, selecting an appropriate analytical technique is fundamental to ensuring the reliability, accuracy, and regulatory compliance of drug development and quality control processes. High-Performance Liquid Chromatography (HPLC) and electrochemical methods represent two powerful classes of techniques, each with distinct advantages and applications. HPLC is renowned for its separation power and versatility, often coupled with detectors like UV or Mass Spectrometry (MS). Electrochemical methods, including dedicated electrochemical detection (ECD) coupled with HPLC (HPLC-ED) and standalone electroanalytical techniques like voltammetry, offer exceptional sensitivity for electroactive compounds [36] [30].
The choice between these techniques hinges on the specific analytical problem, the nature of the analyte, and the required performance characteristics. Increasingly, the combination of HPLC with electrochemical detection is being recognized as a highly sensitive and selective solution, particularly for specific applications in drug analysis, biomonitoring, and environmental testing [79] [36] [99]. This guide provides an in-depth examination of the core validation parameters for these methods, framed within the context of method selection for pharmaceutical analysis.
Core Validation Parameters: Definitions and Methodologies
The following parameters are universally recognized as critical for demonstrating that an analytical procedure is suitable for its intended use, as per guidelines from regulatory bodies like the International Conference on Harmonisation (ICH) [100] [101].
Linearity and Range
Linearity is the ability of a method to produce test results that are directly proportional to the concentration of the analyte in a given sample [100]. The range defines the interval between the upper and lower concentration levels for which acceptable levels of linearity, accuracy, and precision have been demonstrated [100].
- Experimental Protocol: To establish linearity, a minimum of five concentration levels are prepared across the specified range [100]. The results are analyzed using linear regression, which provides the coefficient of determination (r²), the slope of the calibration curve, and the y-intercept. The residuals (the difference between the observed and predicted values) should be randomly scattered, indicating a good fit.
- Application in Techniques: For HPLC-UV or HPLC-MS, the response is typically the peak area. In electrochemical methods, the response is the measured current (in amperometry/voltammetry) or charge (in coulometry) [36] [30]. HPLC-ED has been shown to have an enormous linear dynamic range of over six orders of magnitude, allowing detection from picomolar to micromolar concentrations [36].
Limit of Detection (LOD) and Limit of Quantitation (LOQ)
These parameters define the sensitivity of an analytical method.
- Limit of Blank (LoB): A foundational concept, the LoB is the highest apparent analyte concentration expected to be found when replicates of a blank sample (containing no analyte) are tested [102] [103]. It is calculated as:
LoB = mean_blank + 1.645 * (SD_blank), representing the 95th percentile of blank measurements [102]. - Limit of Detection (LOD): The LOD is the lowest concentration of an analyte that can be reliably distinguished from the LoB. It is a limit test, confirming the presence of the analyte, but not necessarily providing an exact quantitative value [102] [100]. The LOD can be calculated using the standard deviation of the response and the slope of the calibration curve:
LOD = 3.3 * σ / Slope[100] [103]. For techniques with background noise, a signal-to-noise ratio (S/N) of 3:1 is a common, practical determination for LOD [100]. - Limit of Quantitation (LOQ): The LOQ is the lowest concentration at which the analyte can be quantified with acceptable precision and accuracy [102] [100]. It is calculated as:
LOQ = 10 * σ / Slopeor is set at a S/N ratio of 10:1 [100] [103]. The LOQ cannot be lower than the LOD and is often at a higher concentration where predefined goals for bias and imprecision (e.g., ≤20% CV) are met [102].
Precision
Precision expresses the closeness of agreement between a series of measurements from multiple sampling of the same homogeneous sample. It is typically investigated at three levels [100]:
- Repeatability (Intra-assay Precision): Precision under the same operating conditions over a short interval. Assessed with a minimum of nine determinations (e.g., three concentrations/three replicates each) or six at 100% of the test concentration. Results are reported as % Relative Standard Deviation (%RSD) [100].
- Intermediate Precision: The agreement of results within the same laboratory under varied conditions (e.g., different days, analysts, equipment). An experimental design is used, and results are compared statistically (e.g., Student's t-test) [100].
- Reproducibility: Precision between different laboratories, typically assessed during method transfer [100].
Accuracy
Accuracy expresses the closeness of agreement between the measured value and a true or accepted reference value. It is sometimes referred to as trueness [100] [101].
- Experimental Protocol: Accuracy is established by analyzing a minimum of nine determinations over at least three concentration levels covering the specified range. Data are reported as the percent recovery of the known, spiked amount. For drug substances, accuracy can be verified by comparison to a standard reference material or a second, well-characterized method. For drug products, it is evaluated by spiking known quantities into a placebo mixture [100].
Comparative Analysis: HPLC vs. Electrochemical Methods
The table below summarizes the typical performance and experimental considerations for these validation parameters across the discussed techniques.
Table 1: Comparison of Validation Parameters for HPLC and Electrochemical Methods
| Parameter | HPLC with UV/FL Detection | HPLC with Electrochemical Detection (HPLC-ED) | Standalone Electrochemical Methods (e.g., Voltammetry) |
|---|---|---|---|
| Typical LOD/LOQ | Varies; often in ng/mL range for UV. | Very low; often in pg/mL or pmol/L range for electroactive species [36] [99]. | Low to very low; highly dependent on electrode material and technique (e.g., DPV, SWV) [30] [104]. |
| Linearity Range | Broad, typically over 2-3 orders of magnitude. | Very broad; can exceed 6 orders of magnitude [36]. | Broad linear range, but can be affected by electrode surface fouling. |
| Precision (%RSD) | Generally high (<2% for repeatability). | Can be high, but may require rigorous control of electrode surface [45]. | Good to high; pulse techniques (e.g., DPV, SWV) improve precision by minimizing capacitive current [30]. |
| Accuracy (%Recovery) | High, when specificity is confirmed. | High for electroactive analytes; recovery studies are essential [99] [104]. | High, but can be susceptible to matrix interference without adequate sample prep. |
| Key Strengths | Universal detector (UV), robust, excellent for complex mixtures. | Extreme sensitivity and selectivity for electroactive compounds, cost-effective vs. MS [36] [45]. | Rapid, portable, low-cost, minimal sample prep, ideal for real-time monitoring [79] [30]. |
| Key Challenges | Less sensitive than ECD or MS for some analytes. | Limited to electroactive compounds; electrode passivation can occur [36] [45]. | Selectivity in complex matrices can be an issue; requires electroactive analytes [30]. |
Workflow and Method Selection Logic
The following diagram illustrates the logical decision process for selecting and applying these analytical methods in pharmaceutical research.
Experimental Protocols and the Scientist's Toolkit
Detailed Protocol: Validating an HPLC-ED Method for Drug Metabolism Studies
A validated HPLC-coulometric ED method for measuring catechol-O-methyltransferase (COMT) activity serves as an excellent case study [99].
- Objective: To separate and quantify norepinephrine and its metabolite, normetanephrine, in rat liver homogenate to determine COMT enzyme activity.
- Chromatography:
- Column: C18 reversed-phase.
- Mobile Phase: 10 mM sodium dihydrogen phosphate buffer, 4 mM sodium 1-octanesulfonate (ion-pairing agent), 0.17 mM EDTA, 6% methanol, and 4% acetonitrile (pH ~4.0).
- Flow Rate: 1 mL/min.
- Run Time: 45 minutes.
- Electrochemical Detection:
- Technique: Coulometric detection.
- Cell Potential: +450 mV.
- Validation Steps:
- Linearity & Range: Standards from 100 to 2500 ng/mL were analyzed, yielding a linear calibration curve with R² > 0.99.
- LOD/LOQ: Determined using signal-to-noise or standard deviation methods, confirming adequate sensitivity for the low-concentration metabolites.
- Precision & Accuracy: Intra-day and inter-day precision (%RSD) and accuracy (% recovery) were calculated from replicate analyses of quality control samples and were found to be within acceptable limits.
- Specificity: The method successfully resolved normetanephrine from norepinephrine and other matrix components, confirmed by the inhibitor entacapone reducing only the metabolite peak [99].
The Scientist's Toolkit: Essential Reagents and Materials
Table 2: Key Research Reagent Solutions for HPLC and Electrochemical Analysis
| Item | Function & Application | Example Use Case |
|---|---|---|
| C18 Reversed-Phase Column | The stationary phase for separating compounds based on hydrophobicity. | Separation of pharmaceuticals, metabolites, and impurities [99] [45]. |
| Supporting Electrolyte | Provides ionic conductivity and controls pH in electrochemical cells. Essential for voltammetry and as a mobile phase component in HPLC-ED. | Phosphate buffer is used in the mobile phase for HPLC-ED of COMT activity [99]. |
| Ion-Pairing Reagent | Added to the mobile phase to facilitate the separation of ionic compounds on reversed-phase columns. | Sodium 1-octanesulfonate was used for the HPLC-ED analysis of catecholamines [99]. |
| Electrode Materials | The working electrode surface where the electrochemical reaction occurs. Material choice (e.g., glassy carbon, gold, mercury) dictates the applicable potential window and reactivity. | A gold electrode was used for the oxidative detection of antimicrobial agents in cosmetics [104]. Porous graphite electrodes are used for reductive detection of artemisinin [45]. |
| Standard Reference Materials | High-purity compounds used to prepare calibration standards for establishing linearity, accuracy, and LOD/LOQ. | Artesunate and dihydroartemisinin reference standards were used to validate the HPLC-ECD and LC-MS/MS methods [45]. |
The selection between HPLC and electrochemical methods is not a matter of one being universally superior to the other. Instead, it is a strategic decision based on the analytical problem's specific requirements. HPLC excels in separating complex mixtures and is a workhorse for general pharmaceutical analysis. Electrochemical methods, particularly HPLC-ED, offer unparalleled sensitivity and selectivity for electroactive compounds like catecholamines, artemisinins, and various antimicrobial agents, often at a lower cost and operational complexity than HPLC-MS [79] [36] [45]. Standalone electrochemical sensors are rapidly advancing, finding their niche in portable, wearable, and point-of-care testing devices for therapeutic drug monitoring and environmental sensing [79] [30].
A rigorous validation process, thoroughly documenting linearity, LOD, LOQ, precision, and accuracy, is paramount. This ensures that whichever technique is selected, the resulting data is reliable, reproducible, and fit-for-purpose, ultimately supporting the safety, efficacy, and quality of pharmaceutical products.
The selection of an appropriate analytical technique is a critical decision in pharmaceutical and biomedical research, directly impacting the reliability, efficiency, and cost of studies. High-Performance Liquid Chromatography coupled with Electrochemical Detection (HPLC-ECD) and Liquid Chromatography with Tandem Mass Spectrometry (LC-MS/MS) represent two powerful methodologies for the quantitative analysis of target compounds in complex matrices. This whitepaper provides a direct technical comparison of these two techniques, focusing on their core operational parameters—sensitivity and sample volume requirements—to guide researchers in making an informed method selection aligned with their project goals, whether for routine monitoring or exploratory research.
Core Technology and Principles
HPLC-ECD Fundamentals
HPLC-ECD separates analytes chromatographically and then detects them based on their inherent electroactivity—their ability to undergo oxidation or reduction reactions at a specific applied potential [105] [36]. The resultant current generated from this electron transfer is directly proportional to the analyte concentration [106]. Two primary modes of ECD are employed:
- Amperometric Detection: Involves partial electrolysis of the analyte at a solid, non-porous working electrode. This mode is characterized by low noise and offers high sensitivity, making it suitable for trace-level analysis [105] [36].
- Coulometric Detection: Aims for 100% electrolysis of the analyte using a porous electrode with a large surface area. While sometimes less sensitive than amperometry due to higher background noise, it is highly efficient and can be used in series with amperometric cells for specialized applications like the analysis of 3-nitrotyrosine [105] [36].
The technique is exceptionally sensitive for electroactive species, with a linear dynamic range often spanning more than six orders of magnitude, capable of detecting concentrations from the picomolar to the micromolar range [36] [106].
LC-MS/MS Fundamentals
LC-MS/MS combines the separation power of liquid chromatography with the high selectivity and sensitivity of mass spectrometry. After chromatographic separation, analytes are ionized (commonly via electrospray ionization), and the resulting ions are filtered and detected based on their mass-to-charge ratio (m/z) in two stages of mass analysis [45] [107]. This tandem mass spectrometry approach allows for highly specific quantification by monitoring unique precursor-product ion transitions for each analyte, even in complex biological matrices like plasma or urine [107] [108].
Direct Quantitative Comparison
The following tables summarize key performance and operational characteristics of HPLC-ECD and LC-MS/MS, drawing from direct comparisons and validation studies.
Table 1: Comparison of Sensitivity and Sample Volume Requirements
| Parameter | HPLC-ECD | LC-MS/MS | Context & Evidence |
|---|---|---|---|
| Typical Sensitivity | High (pM / pg/µL range) [109] | Very High (sub-pg/µL range) [109] | LC-MS/MS generally offers superior limits of detection. |
| Sample Volume Required | Higher (e.g., ~100-250 µL for plasma) [45] | Lower (e.g., ~1/10th of HPLC-ECD volume) [45] | A key advantage for LC-MS/MS in pediatric or small-animal studies where sample is limited [45] [108]. |
| Specific Application: Artesunate/DHA in Plasma | Performs well with standard plasma volume [45] | Requires only one-tenth the plasma volume of HPLC-ECD [45] | Direct, side-by-side method comparison study [45]. |
| Specific Application: HVA/VMA in Urine | Requires complex SPE or liquid-liquid extraction [107] | Simple "dilute-and-shoot" preparation is sufficient [107] | LC-MS/MS simplifies workflow and reduces preparation time. |
Table 2: Broader Operational and Economic Considerations
| Parameter | HPLC-ECD | LC-MS/MS |
|---|---|---|
| Selectivity | Excellent for electroactive compounds (e.g., monoamines) [109] | Excellent for broad analyte panels; can distinguish isomers [109] |
| Sample Preparation | Simple (often just filtration); optional derivatization [109] | Complex (SPE, protein precipitation, derivatization) [109] [107] |
| Typical Run Time | 5–30 minutes [109] | 15–45 minutes [109] |
| Instrument Cost | ~$45k – $80k [109] | ~$250k – $450k [109] |
| Cost per Sample | ~$2 – $5 [109] | ~$10 – $30 [109] |
| Ease of Use | User-friendly; minimal training [109] | Requires significant technical expertise [109] |
| Robustness | Requires rigorous deoxygenation, temperature control, and frequent electrode cleaning [45] | Complex operation and maintenance; sensitive to matrix effects [45] [109] |
Detailed Experimental Protocols
Protocol for Simultaneous Determination of Artesunate and Dihydroartemisinin
This protocol is adapted from a direct comparison study of HPLC-ECD and LC-MS/MS for analyzing antimalarial compounds in plasma [45].
Sample Preparation (Plasma):
- HPLC-ECD: A larger plasma volume is required. Use liquid-liquid extraction or protein precipitation to isolate artesunate (AS), dihydroartemisinin (DHA), and internal standards.
- LC-MS/MS: Only one-tenth of the plasma volume required for HPLC-ECD is needed. A similar extraction methodology is applied but scaled down.
Chromatography:
- Column: A C18 reversed-phase column is suitable for both systems.
- Mobile Phase: An optimized gradient of acetonitrile or methanol and an aqueous buffer (e.g., ammonium formate/acetate) is used for both techniques. For HPLC-ECD, the mobile phase must be thoroughly deoxygenated.
- Flow Rate: Adjusted for optimal separation on each system.
Detection:
- HPLC-ECD: Uses a porous graphite electrode in reductive mode. The applied potential is set to a value optimized for the reduction of the artemisinin endoperoxide bridge. The system requires strict temperature control and an oxygen-free flow path.
- LC-MS/MS: Uses electrospray ionization (ESI) in positive or negative mode. Detection is via Multiple Reaction Monitoring (MRM) of specific transitions for AS, DHA, and the internal standard.
Validation:
- Both methods were validated for linearity, limits of quantitation, selectivity, precision, and accuracy. The study concluded that while both methods performed well, LC-MS/MS provided a significant advantage in required plasma volume [45].
Protocol for Quantification of Urinary HVA and VMA
This protocol contrasts the traditional HPLC-ECD approach with a modern LC-MS/MS method for neurotransmitters [107].
Sample Preparation (Urine):
- HPLC-ECD: Requires solid-phase extraction (SPE) or liquid-liquid extraction to clean up the sample and remove interferences—a process that is complex and time-consuming.
- LC-MS/MS: Employs a simple "dilute-and-shoot" method. Urine is diluted with a compatible solvent (e.g., water/methanol mixture containing internal standard), vortexed, and centrifuged. The supernatant is directly injected.
Chromatography and Analysis:
- HPLC-ECD: A C18 column with an isocratic or gradient mobile phase is used, with a total run time of 10-20 minutes.
- LC-MS/MS: A C18 or similar column is used with a fast gradient. The total run time is short (e.g., 6 minutes), enabling high throughput.
Key Findings:
- The LC-MS/MS method showed high correlation with established HPLC-ECD results but offered simpler preparation, faster analysis, and high throughput, making it more suitable for clinical environments with large sample numbers [107].
Visual Guide to Technique Selection
The following workflow diagram synthesizes the core comparisons to guide researchers in selecting the most appropriate technique.
The Scientist's Toolkit: Essential Research Reagents and Materials
Table 3: Key Reagents and Materials for HPLC-ECD and LC-MS/MS Workflows
| Item | Function | Application Notes |
|---|---|---|
| Solid-Phase Extraction (SPE) Cartridges | Sample clean-up and analyte pre-concentration to remove matrix interferents. | Commonly used in complex LC-MS/MS analyses [107] and some HPLC-ECD protocols. New specialized sorbents (e.g., for PFAS or mycotoxin removal) are continuously developed [110]. |
| LC-MS/MS Internal Standards | Isotope-labeled analogs (e.g., deuterated) of the target analytes. | Correct for variability in sample preparation and ionization efficiency; essential for achieving high accuracy and precision in quantitative mass spectrometry [107] [108]. |
| Electrochemical Working Electrodes | Surface for oxidation/reduction of analytes; generates the detection signal. | Material (e.g., glassy carbon, gold, platinum) is chosen based on the target analyte and required redox potential [105] [36]. |
| High-Purity Solvents and Salts | Constituents of the mobile phase and sample preparation solutions. | Critical for minimizing background noise in both ECD (preventing electrode fouling) and MS (reducing ion suppression and source contamination) [45] [111]. |
| QuEChERS Kits | Quick, Easy, Cheap, Effective, Rugged, and Safe sample preparation. | Used for multi-analyte extraction (e.g., pesticides, mycotoxins) from food, environmental, and biological matrices, compatible with both LC-MS/MS and HPLC-ECD [110]. |
The choice between HPLC-ECD and LC-MS/MS is not a matter of one technique being universally superior, but rather of matching the technique's strengths to the specific analytical challenge. HPLC-ECD remains a powerful, cost-effective solution for targeted analysis of electroactive compounds like neurotransmitters, where its high sensitivity, operational simplicity, and low running cost are paramount. Conversely, LC-MS/MS is the unequivocal choice for applications demanding maximum sensitivity, broad multiplexing capability, and the analysis of non-electroactive species, particularly when sample volume is severely limited. For comprehensive research programs, a hybrid approach—using HPLC-ECD for high-throughput routine analysis and LC-MS/MS for method validation, discovery, and complex panels—can provide an optimal balance of efficiency, cost, and analytical power.
In the highly regulated pharmaceutical industry, the accuracy, precision, and reliability of analytical data are of utmost importance [112]. Chromatographic techniques play a pivotal role in quality control (QC), research and development (R&D), and stability studies [112]. Among these, Gas Chromatography-Mass Spectrometry (GC-MS) and High-Performance Liquid Chromatography with Electrochemical Detection (HPLC-ED) represent two powerful but fundamentally different approaches for analyzing compounds in complex matrices. The choice between these techniques is not a matter of which is superior, but rather which is the right tool for the specific analytical challenge, particularly when assessing method specificity for target analytes in the presence of potentially interfering components [112] [113].
This case study provides an in-depth technical comparison of GC-MS and HPLC-ED for evaluating specificity within complex pharmaceutical matrices. Specificity, defined as the "ability to assess unequivocally the analyte in the presence of components which may be expected to be present," is a critical validation parameter required by ICH Q2(R1) guidelines [114]. We will explore the fundamental principles, operational advantages, and specific application domains of each technique, supported by experimental data and detailed protocols for implementation.
Fundamental Techniques: Core Principles and Instrumentation
GC-MS: Separation and Mass Spectrometric Detection
GC-MS combines the separation power of gas chromatography with the identification capabilities of mass spectrometry. In GC, the mobile phase is an inert gas (e.g., helium, nitrogen, or hydrogen) that carries the vaporized sample through a column [112] [113]. Separation occurs based on a compound's volatility and its interaction with the stationary phase coated on the column's interior [113]. The critical requirement is that the analyte must be volatile and thermally stable enough to be vaporized without decomposition at the operating temperatures, which can reach up to 400°C [112].
The mass spectrometer serves as the detector, providing exceptional specificity by fragmenting the eluted compounds and measuring the mass-to-charge ratios of the resulting ions. This creates a unique fingerprint that can identify and confirm the presence of the target analyte even in complex mixtures, making GC-MS a gold standard for confirming the identity of unknown volatile peaks [112].
HPLC-ED: Liquid Separation and Electrochemical Detection
HPLC-ED utilizes a liquid mobile phase (often a mixture of organic solvents and water) to carry the sample through a column packed with a solid stationary phase [112] [113]. Separation principles can include partitioning, adsorption, ion exchange, or size exclusion, making it suitable for a broader range of compounds, including non-volatile, thermally unstable, polar, and high-molecular-weight molecules [112] [113].
The electrochemical detector measures the current resulting from the oxidation or reduction of analytes at a specific applied potential at the working electrode [115] [21]. This detection method offers extraordinary sensitivity and selectivity for compounds that are electroactive, enabling the detection of minute quantities (fmol levels) of target analytes without interference from non-electroactive matrix components [48] [21]. A key advantage is its simplicity and lower operating cost compared to mass spectrometric detectors [21].
Table 1: Core Technical Comparison of GC-MS and HPLC-ED
| Parameter | GC-MS | HPLC-ED |
|---|---|---|
| Mobile Phase | Gas (He, N₂, H₂) [112] | Liquid (solvent mixtures) [112] |
| Separation Principle | Boiling point/Polarity [112] | Polarity, ion exchange, size [112] |
| Detection Principle | Mass-to-charge ratio (MS) [112] | Oxidation/Reduction current [115] |
| Ideal Analyte Properties | Volatile, thermally stable, typically <1000 Da [112] | Electroactive, non-volatile, thermally labile [112] [21] |
| Key Specificity Mechanism | Mass spectral fingerprint [112] | Selective redox potential [21] |
Experimental Design for Specificity Assessment
Defining the Specificity Challenge
For pharmaceutical analysis, specificity must be demonstrated against several potential interferents [114]:
- Blank/Diluent Interference: The diluent should not produce a response at the retention time (RT) of the analyte or impurities.
- Placebo Interference: Excipients in a drug product (e.g., tablets, capsules) must not interfere with the quantification of the active pharmaceutical ingredient (API) or its related substances.
- Impurity Interference: Individual specified impurities must be separable from each other and from the API.
- Degradation Products: Forced degradation studies (stress testing) must show that degradation products do not interfere with the main analyte.
Sample Preparation Protocols
For GC-MS Analysis: Due to the technique's requirement for volatile analytes, sample preparation for GC-MS often involves steps to extract and sometimes derivative the target compounds. Derivatization makes polar compounds more volatile and thermally stable by masking functional groups like -OH, -COOH, and -NH₂ [21] [113]. For residual solvent analysis, static or dynamic headspace sampling is frequently employed to introduce volatile components from the sample matrix into the GC system [112].
For HPLC-ED Analysis: Sample preparation can be more straightforward but must preserve the electrochemical activity of the analytes. For biological fluids like plasma, protein precipitation or liquid-liquid extraction is commonly used [25] [45]. A significant advantage of HPLC-ED is that for some applications, such as the analysis of drugs in physiological fluids using micellar liquid chromatography, sample preparation can be minimal, allowing direct injection without prior protein separation [25].
Case Study: Quantitative Comparison and Validation Data
To illustrate the practical performance of these techniques, the following table summarizes validation data from comparative studies, including one that directly contrasts HPLC-ECD with LC-MS/MS [45].
Table 2: Performance Comparison from Validation Studies
| Validation Parameter | GC-MS Performance | HPLC-ED Performance | Comparative Findings |
|---|---|---|---|
| Linearity | Wide dynamic range [116] | Excellent linearity reported [45] | Both techniques perform well [116] [45] |
| Sensitivity (LOD/LOQ) | High sensitivity for volatiles [113] | Extraordinary sensitivity (fmol levels) [48] [21] | HPLC-ED can require larger plasma volumes [45] |
| Precision & Accuracy | Suitable for dosing validation [116] | Performs well for validation parameters [45] | Both methods can be successfully validated [116] [45] |
| Selectivity/Specificity | High via mass spectral data [112] | High via redox potential [21] | Both provide high specificity via different mechanisms |
| Key Advantage | Structural identification [112] | Low operating cost, sensitivity [21] | HPLC-ED is cost-effective; GC-MS provides definitive ID |
A specific comparative study on aminoglutethimide in nanocapsules suspension found that both GC-MS and HPLC were successful, and their validations for dosing the drug were suitable [116]. Another study comparing HPLC with electrochemical detection (HPLC-ECD) and LC-MS/MS for artesunate and dihydroartemisinin in plasma found that the HPLC-ECD method performed well in various validation parameters and showed good agreement with the LC-MS/MS method [45]. A noted advantage of the LC-MS/MS method in that study was that it required only one-tenth the plasma volume needed by the HPLC-ECD assay [45].
Experimental Workflow for Specificity Testing
The following diagram illustrates the logical decision process and experimental workflow for establishing specificity using either GC-MS or HPLC-ED.
Diagram 1: Specificity Method Development Workflow. This flowchart outlines the step-by-step experimental process for establishing method specificity, from blank analysis to forced degradation studies, with feedback loops for method optimization.
The Scientist's Toolkit: Essential Research Reagents and Materials
Successful specificity assessment requires not only the right instrumentation but also the appropriate selection of reagents, columns, and materials. The following table details key components for both GC-MS and HPLC-ED systems.
Table 3: Essential Research Reagent Solutions for Specificity Testing
| Item Category | Specific Examples & Functions | Technical Application Notes |
|---|---|---|
| GC-MS Columns | - Mid-polarity (e.g., 35%-phenyl equivalent): Workhorse for general volatiles.- Wax/PEG columns: Highly polar, for alcohols, acids, fragrances. | Choice depends on analyte polarity. Standard columns handle most residual solvents and volatile impurities [112] [113]. |
| HPLC-ED Electrodes | - Glassy Carbon (GC) Working Electrode: Standard for oxidative detection.- Porous Graphite Electrodes: For reductive mode ECD. | Glassy carbon requires weekly polishing with alumina powder for reproducibility. Reductive ECD demands rigorous deoxygenation [21] [45]. |
| HPLC-ED Mobile Phase | - Buffers (e.g., Acetate, Phosphate): Control pH for consistent analyte charge and redox potential.- Ion-Pairing Reagents (e.g., Heptanesulfonate): Enhance retention of ionic analytes [25]. | Must be HPLC-grade and degassed. Electrochemical background current is highly dependent on mobile phase composition and pH [25] [21]. |
| Derivatization Reagents | - BSTFA, MSTFA: Silylation agents for GC-MS, target -OH, -NH, -COOH groups. | Essential for analyzing polar, non-volatile compounds by GC-MS. Adds a sample preparation step and potential for by-products [21] [113]. |
| Specificity Test Solutions | - Placebo Mixture: All excipients without API.- Impurity Standards: Individual known impurities.- Forced Degradation Reagents: Acid, base, peroxide, etc. [114]. | Critical for experimental demonstration of specificity as per ICH guidelines. Stress conditions must be optimized for each API [114]. |
The assessment of specificity in complex matrices presents distinct challenges and opportunities for both GC-MS and HPLC-ED. GC-MS is the undisputed specialist for volatile and thermally stable compounds, offering unparalleled specificity through mass spectral confirmation. It is the gold standard for applications like residual solvent testing and volatile impurity profiling [112]. In contrast, HPLC-ED serves as a highly sensitive specialist for electroactive compounds, particularly those that are non-volatile, thermally labile, or lack a strong chromophore. Its exceptional sensitivity and selectivity make it invaluable for analyzing neurotransmitters like serotonin and dopamine, as well as certain pharmaceuticals like artemisinin derivatives [21] [45].
The choice between these techniques is fundamentally dictated by the physicochemical nature of the analyte and the specific requirements of the analytical problem. In a modern pharmaceutical laboratory, these techniques are not rivals but complementary tools. A deep understanding of their respective strengths, limitations, and operational requirements empowers scientists to make informed decisions, ensuring the generation of specific, reliable, and regulatory-compliant data that ultimately safeguards drug quality and patient safety.
Evaluating Cost, Speed, and Operational Complexity for High-Throughput Environments
The relentless pursuit of accelerated drug discovery and development demands analytical techniques that can keep pace with high-throughput synthesis and screening. Within pharmaceutical research, the selection of an appropriate analytical method is a critical strategic decision, balancing the competing demands of speed, cost, and operational complexity. High-Performance Liquid Chromatography (HPLC) has long been the cornerstone for quantitative analysis in pharmaceutical laboratories. However, advances in electroanalytical techniques are presenting a compelling alternative for specific applications. This technical guide provides an in-depth comparison of modern HPLC and electrochemical methods, evaluating their suitability for high-throughput environments within the context of pharmaceutical research. It synthesizes recent data and case studies to equip scientists and drug development professionals with the evidence needed to make informed method selection decisions.
Core Principles and Recent Technological Advancements
High-Performance Liquid Chromatography (HPLC)
HPLC separates components in a mixture based on their differential partitioning between a mobile and a stationary phase. Conventional HPLC is vital for characterizing critical quality attributes (CQAs) but is often hampered by long run times and low throughput [117]. Recent developments have focused on overcoming these limitations. Ultra-Fast HPLC methodologies have reduced analysis times from hours to minutes while maintaining resolution and sensitivity [117]. Key innovations include:
- Chromatography Equipment: Systems with reduced dwell volumes, high-pressure capabilities (exceeding 15,000 psi), and faster cycle times [117] [118].
- Column Innovations: Widespread adoption of short columns (e.g., 10-50 mm length) packed with small, sub-2 µm particles, enabling rapid separations [119] [118].
- Advanced Methodologies: Software-driven method development and "ballistic" gradients (using the steepest gradient slope and highest flow rates possible) significantly reduce manual effort and enhance method reliability [117] [119].
The integration of Process Analytical Technology (PAT) with rapid HPLC allows for real-time, in-line, or at-line monitoring of CQAs, which is indispensable for continuous manufacturing processes [117].
Electroanalytical Methods
Electroanalysis encompasses techniques that measure electrical properties (current, potential, charge) resulting from redox reactions of analytes at an electrode-solution interface [30]. These methods have gained traction due to their inherent simplicity, sensitivity, and low operational cost. Recent advancements are making them increasingly suitable for high-throughput settings:
- High-Throughput Instrumentation: The development of platforms like the "Legion" instrument, which features a 96-electrode array formatted to match standard microtiter plates, enables 96 individual electrochemical experiments to be conducted simultaneously and independently [120]. This represents a paradigm shift from traditional serial analysis.
- Sensor Technology: Innovations in electrode materials, particularly nanostructured electrodes and robust biosensors, have enhanced sensitivity, selectivity, and stability [30].
- Methodology: Pulse techniques like Differential Pulse Voltammetry (DPV) and Square Wave Voltammetry (SWV) are preferred for quantitative analysis as they minimize background noise and offer lower detection limits compared to cyclic voltammetry (CV) [30].
Comparative Analysis: HPLC vs. Electroanalysis
The selection between HPLC and electroanalysis requires a nuanced understanding of their performance across key operational metrics. The table below provides a structured comparison.
Table 1: Comparative Analysis of HPLC and Electroanalysis for High-Throughput Pharmaceutical Research
| Aspect | High-Performance Liquid Chromatography (HPLC) | Electroanalysis |
|---|---|---|
| Speed & Throughput | Rapid methods can reduce run times to minutes [117]. Throughput is often limited by serial analysis; a 96-well plate analysis can take 2.5 to 6.5 hours [119]. | New parallel arrays (e.g., Legion) analyze a full 96-well plate simultaneously, drastically reducing total analysis time [120]. |
| Cost | High solvent consumption and disposal costs [119]. Higher capital and maintenance costs for instrumentation [30]. | Minimal solvent use (microliter volumes); low operational cost and minimal waste [21] [30]. Generally lower cost for instrumentation and maintenance. |
| Operational Complexity | Requires skilled operation, method development, and maintenance. Complex systems with pumps, columns, and detectors [118]. | Simpler instrumentation and easier maintenance (e.g., weekly electrode polishing) [21] [30]. New arrays simplify workflow for plate-based assays. |
| Sensitivity | High sensitivity, especially with detectors like MS or FD (e.g., LODs in the ng/mL range) [121]. | Extremely high sensitivity; capable of detecting sub-picogram levels of analytes [30]. LODs can be superior for specific electroactive compounds [8]. |
| Selectivity | Excellent selectivity achieved through combination of column chemistry and detector (e.g., MS, DAD) [122]. | High selectivity for electroactive species; can be enhanced by modified electrodes or pulse techniques. May struggle with complex mixtures without separation [30]. |
| Sample Throughput | Improved via automation, short columns, and ballistic gradients, but remains inherently serial [119] [123]. | Revolutionized by parallel array technology, enabling true high-throughput screening [120]. |
| Environmental Impact | Higher solvent consumption leads to a larger environmental footprint, though "greener" methods are emerging [119]. | Low solvent consumption results in a superior greenness profile [119] [30]. |
Quantitative Performance Comparison
A direct comparison of the two techniques for quantifying octocrylene (OC) highlights their analytical performance differences [8].
Table 2: Quantitative Performance Comparison for Octocrylene Analysis [8]
| Parameter | Electroanalysis (GCS) | HPLC |
|---|---|---|
| Limit of Detection (LOD) | 0.11 ± 0.01 mg L⁻¹ | 0.35 ± 0.02 mg L⁻¹ |
| Limit of Quantification (LOQ) | 0.86 ± 0.04 mg L⁻¹ | 2.86 ± 0.12 mg L⁻¹ |
| Key Advantage | Higher sensitivity for OC | Excellent separation from complex matrices |
Experimental Protocols for High-Throughput Analysis
Protocol 1: High-Throughput HPLC for Drug Discovery Using Ultrashort Columns
This protocol is designed for maximum throughput in a discovery setting where speed is valued more than ultimate chromatographic resolution [119].
- Objective: To achieve high-throughput analysis of a single-component assay, such as acetaminophen, from a 96-well plate.
- Key Research Reagent Solutions:
- Column: XSelect HSS T3, 2.1 x 10 mm, 2.5 µm.
- Mobile Phase A: 0.1% Formic Acid in Water.
- Mobile Phase B: 0.1% Formic Acid in Acetonitrile.
- Sample: Acetaminophen in water (250 µg/mL) in a 96-well QuanRecovery Plate.
- Instrument Conditions:
- LC System: ACQUITY Premier with Binary Solvent Manager and TUV Detector.
- Flow Rate: 0.34 mL/min.
- Gradient: Ballistic gradient (specific %B per column volume optimized for speed).
- Column Temperature: 30 °C.
- Injection Volume: 1.0 µL.
- Detection: UV at 254 nm.
- Throughput Optimization Steps:
- Minimize Inter-Injection Delay: Adjust instrument method to reduce idle time.
- Set pre- and post-injection wash times to zero (if carryover is not a concern).
- Reduce air gap volumes to 0.0 µL.
- Set syringe draw rate to maximum (500 µL/min).
- Enable "load ahead" function.
- Data Analysis: Process data using software like MassLynx V4.1. The 10 mm column can analyze a 96-well plate in approximately 2.7 hours, a 60% reduction compared to a 50 mm column [119].
- Minimize Inter-Injection Delay: Adjust instrument method to reduce idle time.
Protocol 2: High-Throughput Electroanalysis Using a 96-Electrode Array
This protocol leverages parallel electrochemical cells for simultaneous measurement, ideal for screening redox properties or electrocatalytic activity [120].
- Objective: To perform simultaneous voltammetric analysis of 96 different samples or conditions.
- Key Research Reagent Solutions:
- Electrochemical Platform: "Legion" instrument or equivalent 96-channel array.
- Electrolyte: Britton-Robinson (BR) buffer, pH 6, or other suitable supporting electrolyte.
- Samples: Compounds for screening (e.g., potassium ferricyanide, drug metabolites) in a 96-well plate format.
- Instrument Conditions:
- Working Electrode: Polished glassy carbon plate.
- Quasi-Reference Counter Electrode (QRCE): Ag/AgCl or Ag/AgO in each cell.
- Technique: Differential Pulse Voltammetry (DPV).
- DPV Parameters:
- Initial Potential: -0.8 V
- Final Potential: -1.5 V
- Step Potential: +0.005 V
- Modulation Amplitude: +0.1 V
- Modulation Time: 0.02 s
- Solution Volume: 300 µL per cell.
- Procedure:
- Electrode Preparation: Prior to assembly, polish the glassy carbon working electrode sequentially with alumina slurries (from 0.3 to 0.05 µm) and sonicate in isopropyl alcohol.
- Array Assembly: Assemble the electrochemical cell array with the PEEK top plate, PDMS gasket, and electrodes.
- Sample Loading: Dispense 300 µL of each sample or standard solution into the individual cells of the array.
- Simultaneous Analysis: Run the DPV method across all 96 cells in parallel using the controlling software.
- Data Processing: Export and process current-potential data using software like Python for quantitative analysis.
Method Selection Framework
The decision between HPLC and electroanalysis is not a simple dichotomy but a strategic choice based on the analytical problem and operational context. The following workflow provides a logical pathway for this decision.
Method Selection Workflow Diagram: This chart outlines the decision-making process for selecting between electrochemical and HPLC methods based on analyte properties and operational requirements.
Essential Research Reagent Solutions
The following table details key materials and their functions for implementing the featured high-throughput protocols.
Table 3: Key Research Reagent Solutions for High-Throughput Analysis
| Item | Function in Analysis |
|---|---|
| Ultrashort HPLC Column(e.g., 2.1 x 10 mm, 2.5 µm) | Enables fast chromatographic separations by reducing column length and volume, allowing for higher flow rates and steeper gradients without excessive backpressure [119]. |
| Glassy Carbon Electrode (GCE) | A versatile working electrode for electroanalysis; provides a wide potential window, low reactivity, and a renewable surface for reproducible results [120] [8]. |
| Ballistic Gradient Solvents(e.g., 0.1% FA in Water/ACN) | Mobile phases designed for ultra-fast LC gradients, facilitating the rapid elution of analytes and shortening run times [119]. |
| Britton-Robinson (BR) Buffer | A universal buffer solution used in electroanalysis to maintain a consistent pH, which is critical for the stability of redox potentials and reaction kinetics [8]. |
| 96-Well Electrochemical Array(e.g., "Legion" Platform) | Provides a standardized footprint for parallel electrochemistry, allowing 96 independent experiments to be run simultaneously, matching high-throughput screening workflows [120]. |
The evolution of both HPLC and electroanalytical techniques is actively reshaping the landscape of high-throughput analysis in pharmaceutical research. HPLC remains the undisputed champion for applications requiring high-resolution separation of complex mixtures, with its speed continuously enhanced by hardware and column innovations. Conversely, modern electroanalysis, particularly with the advent of parallel array technology, presents a transformative alternative for specific applications, offering unparalleled throughput, superior sensitivity for electroactive species, and a more favorable cost and environmental profile. The optimal choice is not a matter of declaring one technology the universal winner, but of strategically matching the technique's inherent strengths—be it the separating power of HPLC or the rapid, parallel detection capability of electroanalysis—to the specific analytical challenge and the overarching operational goals of the research program.
In pharmaceutical research, the selection of an appropriate analytical technique is a critical determinant of a project's success. High-Performance Liquid Chromatography (HPLC) serves as a cornerstone analytical method across numerous scientific fields due to its flexibility, precision, and utility in separating, identifying, and quantifying compounds in complex mixtures [1]. Within the HPLC framework, the choice of detector becomes paramount, with electrochemical detection (ECD) offering distinct advantages for specific applications. Since no universal detector exists for HPLC, scientists must select detection technology according to the nature of the target compounds and analytical requirements [36]. This framework provides a structured approach for researchers and drug development professionals to navigate the decision-making process between electrochemical detection and other HPLC detection methodologies, primarily within pharmaceutical applications. The goal is to align analytical capabilities with project requirements, resource constraints, and desired outcomes to optimize method selection for drug discovery, development, and quality control.
Core Principles and Technical Foundations
HPLC Detection Technologies
HPLC operates on the principle of separating components in a mixture based on their differential interactions with a stationary phase and a mobile phase forced through a column at high pressure [1]. The detection system identifies and quantifies these separated compounds. Several detection technologies are available, each with unique strengths and limitations. UV-Vis detectors are the most versatile and widely used but lack specificity and may have limited sensitivity for compounds with poor chromophores [124]. Fluorescence detectors offer greater sensitivity and selectivity for appropriate analytes but require native fluorescence or derivatization [14]. Mass spectrometry (MS) provides exceptional sensitivity and selectivity with structural elucidation capabilities but involves significantly higher costs and operational complexity [1]. Electrochemical detectors measure current resulting from oxidation or reduction reactions of analytes at a specific applied potential, offering remarkable sensitivity and selectivity for electroactive compounds [36].
Fundamentals of Electrochemical Detection
Electrochemical detection for HPLC is based on the measurement of current generated when electroactive compounds undergo oxidation or reduction at a working electrode held at a controlled potential [36]. The key operational principle involves setting the working electrode potential at different values to change the electroactive compound response, recorded as sigmoidal I/V curves known as hydrodynamic voltammograms (HDVs) [36]. The main categories of electrochemical detection include:
- Amperometric Sensors: Measure current at a fixed potential; not inherently selective but selectivity can be enhanced through permeable membranes or catalytic layers [36].
- Coulometric Sensors: Aim for complete conversion of the analyte with measurement of electrical charge; electrodes are typically arranged in series [36].
- Pulsed Amperometric Detection (PAD): Particularly useful for carbohydrates and compounds that foul electrode surfaces [48].
A significant advantage of ECD is its extraordinary sensitivity, with a linear dynamic range of more than six orders of magnitude, enabling detection from concentrations as low as 10 pmol L−1 to over 500 µmol L−1 [36]. The technique is competitive with other detectors due to its versatility, specificity, and cost-effectiveness [36].
Decision Framework for Detection Method Selection
Key Selection Criteria
The selection of an appropriate HPLC detection method requires systematic evaluation of multiple technical and practical factors. The table below summarizes the core decision criteria for method selection:
Table 1: Key Criteria for HPLC Detection Method Selection
| Criterion | Electrochemical Detection | UV/Vis Detection | Fluorescence Detection | Mass Spectrometry |
|---|---|---|---|---|
| Sensitivity | Excellent for electroactive compounds (pmol-fmol levels) [21] | Moderate to Good (nanogram levels) [124] | Excellent for fluorescent compounds (femtomole levels) [14] | Exceptional (attomole-femtomole levels) [1] |
| Selectivity | High for electroactive compounds [36] | Low to Moderate [124] | High for fluorescent compounds [124] | Very High [1] |
| Compound Requirements | Must be electroactive [36] | Requires chromophore [124] | Requires fluorophore or derivatization [14] | No specific structural requirement |
| Sample Clean-up | Minimal often required [36] | Often extensive required [25] | Moderate often required [25] | Minimal often required |
| Operational Costs | Low to Moderate [21] | Low | Low to Moderate | High [124] |
| Method Development | Straightforward for known electroactive compounds [104] | Straightforward | Moderate complexity | Complex |
| Matrix Effects | Manageable with potential selection [36] | Significant | Moderate | Can be significant |
Electrochemical Detection Applicability Assessment
Electrochemical detection is particularly suitable for compounds that undergo oxidation or reduction reactions. The decision pathway for determining when to select electrochemical detection can be visualized as follows:
Method Selection Guidelines by Application
Different pharmaceutical research applications present distinct requirements that influence detector selection:
Table 2: Detection Method Recommendations by Application
| Application Area | Recommended Detection | Rationale | Typical Achievable Sensitivity |
|---|---|---|---|
| Neurotransmitter Analysis (DA, 5-HT, metabolites) | HPLC-ECD [21] | Excellent sensitivity for monoamines; direct analysis of microdialysis samples | 0.5 fmol per sample [21] |
| Pharmaceutical QC (API potency, impurities) | HPLC-UV [14] | Robustness, simplicity, adequate sensitivity for most APIs | Nanogram levels [124] |
| Pharmacokinetic Studies (drug metabolites in plasma) | LC-MS/MS [124] | Structural confirmation, unmatched sensitivity and specificity | Femtomole levels [124] |
| Carbohydrate Analysis (sugars, lactose) | HPAEC-PAD [48] | Superior sensitivity for carbohydrates without derivatization | Picomole levels [48] |
| Antimicrobial Agents in cosmetics | HPLC-ECD [104] | Better sensitivity than UV or MS for specific antimicrobials | 10-110 μg L−1 [104] |
| Stability Studies (degradation products) | HPLC-UV/DAD [25] | Peak purity assessment, identification of degradants | Nanogram levels [25] |
Experimental Protocols and Methodologies
Protocol for HPLC-ECD Method Development
Developing a robust HPLC-ECD method requires systematic optimization of both chromatographic and electrochemical parameters:
Step 1: Initial System Selection
- Column Selection: Begin with reversed-phase C18 columns (10-15 cm length, 3-5 μm particle size) for most applications [14]. For neurotransmitter analysis, consider specialized columns like C18 with specific pore sizes optimized for small molecules [21].
- Mobile Phase: Start with acetate or phosphate buffers (pH 3-5) for most oxidative applications [104]. For basic compounds, consider phosphate buffers around pH 9 [124].
- Flow Rate: Initialize at 1.0-1.5 mL/min for standard bore columns; adjust based on separation requirements [14].
Step 2: Electrochemical Parameter Optimization
- Working Electrode Selection: Glassy carbon is standard for most applications [21]; gold electrodes may be preferable for specific compounds like antimicrobial agents [104].
- Potential Optimization: Perform hydrodynamic voltammetry studies to determine optimal detection potential. Typical oxidative potentials range from +0.6 to +1.5 V vs. Ag/AgCl depending on the analyte [104].
- Cell Configuration: Amperometric flow-through cells are common; coulometric cells with porous electrodes provide higher conversion efficiencies [36].
Step 3: Selectivity and Sensitivity Optimization
- Potential Fine-Tuning: Adjust working potential to maximize signal-to-noise while minimizing interferences.
- Mobile Phase Optimization: Modify pH, buffer concentration, or organic modifier to achieve separation and detectability.
- Sample Preparation: Utilize the selectivity of ECD to minimize extensive sample clean-up [36].
Detailed Protocol: Neurotransmitter Analysis in Microdialysis Samples
This protocol exemplifies a highly specialized application where HPLC-ECD offers distinct advantages [21]:
Materials and Reagents:
- HPLC System: HPLC pump, autosampler, column oven, and electrochemical detector [21]
- Column: Reversed-phase C18 column (e.g., 150 × 3.0 mm, 3 μm particle size) [21]
- Working Electrode: Glassy carbon electrode [21]
- Reference Electrode: Ag/AgCl [21]
- Mobile Phase: 0.1 M phosphate buffer, pH 3.0-3.5, containing 0.1-0.5 mM EDTA, 1-2 mM octanesulfonic acid (ion-pairing reagent), and 6-10% methanol [21]
- Standards: Dopamine, serotonin, DOPAC, HVA, 5-HIAA standards prepared in 0.1 M perchloric acid
Procedure:
- Mobile Phase Preparation: Prepare 0.1 M phosphate buffer, adjust to pH 3.2 with phosphoric acid, add EDTA (0.3 mM), octanesulfonic acid (1.8 mM), and methanol (8%). Filter through 0.22 μm membrane and degass.
- Electrode Preparation: Polish glassy carbon working electrode with alumina slurry (0.05 μm) weekly or as needed to maintain performance [21].
- System Equilibration: Equilibrate column with mobile phase at 0.5 mL/min until stable baseline achieved (typically 1-2 hours).
- Potential Optimization: Set detection potential at +0.7 V vs. Ag/AgCl for dopamine and serotonin; adjust as needed for specific metabolites [21].
- Sample Analysis: Inject 10-20 μL of microdialysis samples directly without extraction [21].
- Data Analysis: Quantify analytes by comparing peak areas with external standards.
Validation Parameters:
- Linearity: Typically 3-4 orders of magnitude [21]
- LOD: 0.5 fmol for serotonin [21]
- LOQ: 1-2 fmol for most monoamines [21]
- Precision: <5% RSD for retention times, <10% RSD for peak areas [21]
Research Reagent Solutions and Materials
Successful implementation of HPLC-ECD methods requires specific reagents and materials optimized for electrochemical detection:
Table 3: Essential Research Reagents for HPLC-ECD
| Reagent/Material | Function | Application Notes |
|---|---|---|
| Glassy Carbon Electrode | Working electrode for oxidation/reduction reactions | Standard for most applications; requires weekly polishing with alumina [21] |
| Gold Electrode | Alternative working electrode | Preferred for specific applications like antimicrobial agent detection [104] |
| Ag/AgCl Reference Electrode | Stable reference potential | Essential for maintaining consistent applied potential [104] |
| Phosphate Buffer | Mobile phase component | Most common aqueous component; typically 10-100 mM, pH 2.5-4.0 for oxidative detection [21] |
| Octanesulfonic Acid | Ion-pairing reagent | Enhances retention of amines in reversed-phase systems [21] |
| EDTA | Mobile phase additive | Chelating agent that removes metal ions that can degrade catecholamines [21] |
| Alumina Polishing Slurry | Electrode maintenance | 0.05-0.1 μm particles for restoring electrode surface [21] |
| C18 Column | Stationary phase | 100-150 mm length, 3-5 μm particle size for most applications [14] |
Framework Implementation and Case Studies
Case Study: Antimicrobial Agents in Cosmetics
A recent study demonstrated the advantages of HPLC-ECD with a gold electrode for simultaneous determination of antimicrobial agents in cosmetics [104]. The method achieved detection limits between 10 and 110 μg L−1 for methylparaben, 4-hydroxybenzoic acid, phenoxyethanol, and methylisothiazolinone – lower than those obtained with mass spectrometry or diode-array detection [104]. This application highlights how proper detector selection based on analyte properties can yield superior sensitivity compared to more expensive alternatives.
Case Study: Neurotransmitter Analysis in Microdialysis Samples
HPLC-ECD has become the gold standard for monitoring neurotransmitters in microdialysis samples due to its ability to measure basal levels of monoamines and metabolites without need for sample derivatization [21]. The technique provides the requisite sensitivity (fmol levels) and selectivity for direct analysis of complex brain microdialysates, enabling real-time monitoring of neurotransmitter dynamics in vivo [21].
The selection between electrochemical detection and other HPLC detection technologies represents a critical decision point in pharmaceutical method development. Electrochemical detection offers exceptional sensitivity and selectivity for electroactive compounds at a relatively low operational cost, making it ideal for specific applications such as neurotransmitter monitoring, carbohydrate analysis, and determination of specific antimicrobial agents. UV detection remains the workhorse for routine pharmaceutical analysis where sensitivity requirements are moderate, while mass spectrometry provides unparalleled capabilities for structural elucidation and trace analysis when resources allow. This decision framework provides a structured approach to align analytical requirements with detector capabilities, ensuring optimal method selection based on scientific needs, practical constraints, and desired outcomes. By systematically evaluating the factors outlined in this guide, pharmaceutical researchers can make informed decisions that enhance research quality, efficiency, and productivity.
Conclusion
The choice between electrochemical and HPLC methods is not a matter of one being universally superior, but of strategic alignment with analytical goals. Electrochemical techniques offer exceptional sensitivity for electroactive compounds, often in the nanomolar to picomolar range, with minimal sample preparation. HPLC, particularly when coupled with specialized detectors like ECD or MS, provides unparalleled separation power for complex mixtures. The emerging trend of HPLC-ECD combines the strengths of both. Future directions point towards increased miniaturization, the integration of artificial intelligence for data interpretation and optimization, and the development of robust, portable sensors for point-of-care therapeutic drug monitoring. By understanding their complementary strengths and limitations, pharmaceutical scientists can leverage these powerful analytical tools to drive innovation in drug development, quality control, and clinical research, ultimately ensuring the safety and efficacy of pharmaceutical products.
References
- 1. Principles and Applications of High-Performance Liquid ... [https://biomedpharmajournal.org/vol18no2/principles-and-applications-of-high-performance-liquid-chromatography-hplc-a-review/]
- 2. How HPLC Detectors Work [https://www.thermofisher.com/us/en/home/industrial/chromatography/chromatography-learning-center/liquid-chromatography-information/hplc-system-components/how-hplc-detectors-work.html]
- 3. Chromatography Detectors Explained: UV, RI, MS, and More [https://www.pharmanow.live/pharma-manufacturing/chromatography-detector-types]
- 4. Types of HPLC Detectors [https://www.phenomenex.com/knowledge-center/hplc-knowledge-center/hplc-detectors?srsltid=AfmBOooM6IjIBj-WXar9INdoz74Y8QnFeJkoqTD-gWs93Ul9JSwgUD71]
- 5. Lesson 5: Detectors - Shodex HPLC Columns [https://shodexhplc.com/lessons/lesson-5-detectors-for-hplc/?srsltid=AfmBOor6VQKBJe5XIVSn2n4HUeehthfF2x9DMoZ63YfwQGeXzCx_JCdK]
- 6. Editorial: Recent advances in pharmaceutical analysis [https://pmc.ncbi.nlm.nih.gov/articles/PMC12491238/]
- 7. HPLC 2025 Preview: Fundamentally Speaking (Part 1) [https://www.chromatographyonline.com/view/hplc-2025-preview-fundamentally-speaking-part-1-]
- 8. Comparison of Chromatographic and Electrochemical ... [https://www.mdpi.com/2076-3417/15/10/5504]
- 9. HPLC 2025 Preview: The Road To Sustainable Analytical ... [https://www.chromatographyonline.com/view/hplc-2025-preview-the-road-to-sustainable-analytical-chemistry]
- 10. Electrochemical Analysis Methods: Potentiometry, ... [https://www.labmanager.com/electrochemical-analysis-methods-potentiometry-voltammetry-and-more-34242]
- 11. Comparison of colorimetric, spectroscopic and ... [https://pmc.ncbi.nlm.nih.gov/articles/PMC10910492/]
- 12. Amperometric and Voltammetric Sensors | Electrochemistry... | Fiveable [https://fiveable.me/electrochemistry/unit-11/amperometric-voltammetric-sensors/study-guide/ayVg8igHu1OxLaj7]
- 13. Pulsed amperometric detection: Extending the applicability ... [https://www.sciencedirect.com/science/article/pii/S0026265X25034356]
- 14. HPLC Method Development and Validation for ... [https://www.pharmtech.com/view/hplc-method-development-and-validation-pharmaceutical-analysis]
- 15. of Different Comparative Systems... | SpringerLink Performance HPLC [https://link.springer.com/chapter/10.1007/978-1-4613-2397-6_14]
- 16. Neurotransmitter Analysis: HPLC-ECD vs. LC-MS/MS [https://www.amuzainc.com/blog/hplc-ecd-vs-lc-ms-neurotransmitter-analysis/?srsltid=AfmBOoqOg9k6GnTGpMON2Fl5HL_wA0IqIKdMk1L5etDYfBvRpTo4uVw_]
- 17. HPLC-ECD (Electrochemical Detection) Fundamentals [https://www.amuzainc.com/eicom-electrochemical-detection-ecd-fundamentals/?srsltid=AfmBOoo5LjrBGFs5Lv_yg3FNSEgZkfX7R18jNNFI6v45XtT_CTA35E8a]
- 18. How Chromatography Works: Principles and Separation ... [https://www.pharmanow.live/pharma-manufacturing/chromatography-analysis-methods]
- 19. Chromatography - StatPearls - NCBI Bookshelf [https://www.ncbi.nlm.nih.gov/books/NBK599545/]
- 20. Benefits of using HPLC-ECD for Neurotransmitter Detection [https://www.amuzainc.com/blog/benefits-of-using-hplc-ecd-for-neurotransmitter-detection/?srsltid=AfmBOop5nzGj7SWBqXfHBSzAoiL9pnrdhtft6H7Nx5m3SNnlPysv47IQ]
- 21. The High-Precision Liquid Chromatography with ... [https://pmc.ncbi.nlm.nih.gov/articles/PMC10818480/]
- 22. Electrochemical HPLC Determination of Piperazine ... [https://pmc.ncbi.nlm.nih.gov/articles/PMC10831984/]
- 23. A novel high-performance liquid chromatographic assay for ... [https://www.sciencedirect.com/science/article/abs/pii/S0731708596020055]
- 24. Application of HPLC with electrochemical detection for the ... [https://www.sciencedirect.com/science/article/abs/pii/S0889157507000713]
- 25. HIGH PERFOMANCE LIQUID CHROMATOGRAPHY IN ... [https://pmc.ncbi.nlm.nih.gov/articles/PMC7250120/]
- 26. Essential Applications of HPLC in the Pharmaceutical ... [https://njlabs.com/essential-applications-of-hplc-in-the-pharmaceutical-industry/]
- 27. The Development and Full Validation of a Novel Liquid ... [https://pmc.ncbi.nlm.nih.gov/articles/PMC10631362/]
- 28. A High-Performance Liquid Chromatography with ... [https://pmc.ncbi.nlm.nih.gov/articles/PMC10453043/]
- 29. A Simple Approach to Performance Optimization in HPLC ... [https://www.chromatographyonline.com/view/simple-approach-performance-optimization-hplc-and-its-application-ultrafast-separation-development]
- 30. Electroanalysis Advances in Pharmaceutical Sciences [https://www.mdpi.com/2673-4532/6/2/12]
- 31. Advantages of an Electrochemical Method Compared to ... [https://pmc.ncbi.nlm.nih.gov/articles/PMC6151978/]
- 32. A comprehensive review on roles of electrochemical ... [https://www.sciencedirect.com/science/article/pii/S221418042500008X]
- 33. 3.4: Selecting an Analytical Method [https://chem.libretexts.org/Bookshelves/Analytical_Chemistry/Analytical_Chemistry_2.1_(Harvey)/03%3A__The_Vocabulary_of_Analytical_Chemistry/3.04%3A_Selecting_an_Analytical_Method]
- 34. Electrochemical detector for high-performance liquid ... [https://www.sciencedirect.com/science/article/abs/pii/S0021967300818488]
- 35. Comparison of colorimetric, spectroscopic and ... - PubMed [https://pubmed.ncbi.nlm.nih.gov/38059376/]
- 36. Review of the Analytical Methods Based on HPLC ... [https://www.mdpi.com/2673-4532/3/1/5]
- 37. Capillary Electrophoresis with Electrochemical Detection [https://www.sciencedirect.com/science/article/pii/S1452398125003050]
- 38. Ionic Liquids in Analytical Chemistry [https://pmc.ncbi.nlm.nih.gov/articles/PMC11912132/]
- 39. Neurotransmitter analysis using liquid chromatography ... [https://www.sciencedirect.com/science/article/abs/pii/S0731708525004613]
- 40. Benefits of using HPLC-ECD for Neurotransmitter Detection [https://www.amuzainc.com/blog/benefits-of-using-hplc-ecd-for-neurotransmitter-detection/?srsltid=AfmBOopDF5TNYJ6yBW3UPG1yfFEojnzQs-IHQ8uR-nFOAvubD8TKav-t]
- 41. Microdialysis-integrated HPLC system with dual-electrode ... [https://www.sciencedirect.com/science/article/abs/pii/S1570023224003271]
- 42. The High-Precision Liquid Chromatography with ... [https://www.mdpi.com/1420-3049/29/2/496]
- 43. ALEXYS Neurotransmitter Analyzer for Monoamines and ... [https://www.protocols.io/view/alexys-neurotransmitter-analyzer-for-monoamines-an-dyvf7w3n.html]
- 44. Microdialysate analysis of monoamine neurotransmitters [https://pubmed.ncbi.nlm.nih.gov/23522114/]
- 45. Comparison of HPLC with electrochemical detection and ... [https://www.sciencedirect.com/science/article/abs/pii/S157002320800233X]
- 46. Validation of a New HPLC-ED Method [https://pure.eur.nl/en/publications/technical-aspects-of-coenzyme-qsub10sub-analysis-validation-of-a-/]
- 47. Coenzyme Q10 Treatment Monitoring in Different Human ... [https://www.mdpi.com/2076-3921/9/10/979]
- 48. HPLC Solutions with Electrochemical Detection for Most ... [https://www.gmi-inc.com/hplc-solutions-with-electrochemical-detection-for-most-sensitive-and-selective-analysis/]
- 49. Coenzyme Q10 quantification in muscle, fibroblasts and ... [https://pubmed.ncbi.nlm.nih.gov/23592193/]
- 50. Development and validation of a green/blue UHPLC-MS ... [https://www.nature.com/articles/s41598-025-15614-4]
- 51. Voltammetric methods for electrochemical characterization ... [https://pmc.ncbi.nlm.nih.gov/articles/PMC10765968/]
- 52. Sensitive and selective electrochemical detection of ... [https://www.sciencedirect.com/science/article/abs/pii/S0003267016308479]
- 53. Determination of Artemether and Its Major Metabolite ... [https://pubmed.ncbi.nlm.nih.gov/9106051/]
- 54. Stability Indicating High-Performance Liquid ... [https://pmc.ncbi.nlm.nih.gov/articles/PMC3035892/]
- 55. Green Analytical Methods of Antimalarial Artemether ... [https://pmc.ncbi.nlm.nih.gov/articles/PMC7435840/]
- 56. Analytical Methods for Detection of Gasotransmitter Hydrogen ... [https://pmc.ncbi.nlm.nih.gov/articles/PMC8419496/]
- 57. Hydrogen Sulfide in Pharmacotherapy, Beyond the Hydrogen ... [https://pmc.ncbi.nlm.nih.gov/articles/PMC7072623/]
- 58. Emerging analytical tools for the detection of the third ... [https://www.sciencedirect.com/science/article/pii/S2090123220301028]
- 59. Pharmacology of Hydrogen Sulfide and Its Donors in ... [https://pubmed.ncbi.nlm.nih.gov/38866561/]
- 60. Planar carbon electrodes for real-time quantification of ... [https://pmc.ncbi.nlm.nih.gov/articles/PMC9850357/]
- 61. Direct electrochemical sensing of hydrogen sulfide without ... [https://pmc.ncbi.nlm.nih.gov/articles/PMC6759990/]
- 62. The determination of sulfide in seawater by flow-analysis ... [https://www.sciencedirect.com/science/article/pii/S0304420397000145]
- 63. Amperometric measurement of gaseous hydrogen sulfide ... [https://pubs.rsc.org/en/content/articlelanding/2010/ay/c0ay00338g]
- 64. Comparison of HPLC with electrochemical detection and ... [https://www.sciencedirect.com/science/article/pii/S157002320800233X]
- 65. HPLC Applications in Pharmaceuticals: Quality Control and ... [https://www.mastelf.com/hplc-applications-in-pharmaceuticals-quality-control-and-drug-development/]
- 66. Why HPLC Is Essential in the Pharmaceutical Industry [https://www.pharmanow.live/pharma-manufacturing/hplc-pharma]
- 67. ICH Q2(R2) Validation of analytical procedures [https://www.ema.europa.eu/en/ich-q2r2-validation-analytical-procedures-scientific-guideline]
- 68. A Well-Written Analytical Procedure for Regulated HPLC ... [https://www.chromatographyonline.com/view/a-well-written-analytical-procedure-for-regulated-hplc-testing]
- 69. Electrochemical Biosensors: A Prospective Insight to ... [https://www.sciencedirect.com/science/article/abs/pii/S2451910325001358]
- 70. Recent Advances in Electrochemical Biosensors for ... - PMC [https://pmc.ncbi.nlm.nih.gov/articles/PMC9775431/]
- 71. Recent developments in electrochemical sensors for the ... [https://www.sciencedirect.com/science/article/pii/S0013468625017499]
- 72. Recent Advances in Electrochemical Biosensors for ... [https://www.mdpi.com/2079-6374/15/3/151]
- 73. Peak Tailing in HPLC [https://www.elementlabsolutions.com/uk/chromatography-blog/post/peak-tailing-in-hplc]
- 74. Tailing Peaks in HPLC: A Practical Guide to Causes ... [https://uhplcs.com/tailing-peaks-in-hplc-a-practical-guide-to-causes-effects-and-solutions/]
- 75. Peak Splitting in HPLC: Causes and Solutions [https://www.sepscience.com/peak-splitting-in-hplc-causes-and-solutions-9379]
- 76. Troubleshooting Poor Peak Shape: A Complete Workflow ... [https://www.alwsci.com/news/troubleshooting-poor-peak-shape-a-complete-wo-85314072.html]
- 77. Causes of Retention Time Drift in HPLC [https://www.elementlabsolutions.com/uk/chromatography-blog/post/causes-of-retention-time-drift-in-hplc]
- 78. Retention Shifts [https://www.sepscience.com/retention-shifts-7166]
- 79. Recent advances in electrochemical paper-based ... [https://www.sciencedirect.com/science/article/pii/S0013468625014446]
- 80. Error, reproducibility and uncertainty in experiments for ... [https://www.nature.com/articles/s41467-022-34594-x]
- 81. 3D-printed electrodes for electrochemical detection of ... [https://pubs.rsc.org/en/content/articlehtml/2025/ay/d4ay02271h]
- 82. Electrochemical approaches for detecting micro and nano ... [https://www.sciencedirect.com/science/article/pii/S1452398125002573]
- 83. Editorial: Recent advances in pharmaceutical analysis [https://www.frontiersin.org/journals/chemistry/articles/10.3389/fchem.2025.1699047/full]
- 84. Tutorials on HPLC/ECD [https://antecscientific.com/support/tutorials-on-hplc-ecd/]
- 85. Development and implementation of an HPLC-ECD ... [https://pmc.ncbi.nlm.nih.gov/articles/PMC5574855/]
- 86. New electrochemical detection method in high ... [https://www.sciencedirect.com/science/article/abs/pii/S0003267001015203]
- 87. Application of Doehlert design combined with ... [https://www.sciencedirect.com/science/article/pii/S2405844025010710]
- 88. Application of Doehlert design combined with ... [https://pubmed.ncbi.nlm.nih.gov/40051863/]
- 89. Green RP-HPLC method for simultaneous quantification of ... [https://www.sciencedirect.com/science/article/pii/S2772577424000624]
- 90. Journal of Pharmaceutical and Biomedical Analysis [https://www.sciencedirect.com/science/article/abs/pii/S0731708506008053]
- 91. Versatile electrochemical device for oxygen management ... [https://www.sciencedirect.com/science/article/pii/S2666998625000237]
- 92. Highly portable electrochemical oxygen removal device for ... [https://www.sciopen.com/article/10.26599/NR.2025.94907179]
- 93. System suitability Requirements for a USP HPLC Method [https://www.mtc-usa.com/kb-article/aa-03965]
- 94. Accuracy, Precision, and Reliability of Chemical ... [https://pmc.ncbi.nlm.nih.gov/articles/PMC3026088/]
- 95. Validation of Stability-Indicating HPLC Methods for ... [https://www.chromatographyonline.com/view/validation-of-stability-indicating-hplc-methods-for-pharmaceuticals-overview-methodologies-and-case-studies]
- 96. Performance parameters for analytical method validation [https://www.sciencedirect.com/science/article/abs/pii/S0165993620301424]
- 97. Are You Sure You Understand USP <621>? [https://www.chromatographyonline.com/view/are-you-sure-you-understand-usp-621-]
- 98. Development and Validation of an HPLC Method ... [https://pmc.ncbi.nlm.nih.gov/articles/PMC6431496/]
- 99. Development and validation of a HPLC electrochemical ... [https://pubmed.ncbi.nlm.nih.gov/31109396/]
- 100. Analytical Method Validation: Back to Basics, Part II [https://www.chromatographyonline.com/view/analytical-method-validation-back-basics-part-ii]
- 101. The 6 Key Aspects of Analytical Method Validation [https://www.elementlabsolutions.com/uk/chromatography-blog/post/6-key-aspects-of-analytical-method-validation]
- 102. Limit of Blank, Limit of Detection and Limit of Quantitation [https://pmc.ncbi.nlm.nih.gov/articles/PMC2556583/]
- 103. Method Validation Essentials, Limit of Blank ... [https://www.biopharminternational.com/view/method-validation-essentials-limit-blank-limit-detection-and-limit-quantitation]
- 104. HPLC method with electrochemical detection on gold ... [https://www.sciencedirect.com/science/article/pii/S0026265X22007093]
- 105. HPLC-ECD (Electrochemical Detection) Fundamentals [https://www.amuzainc.com/eicom-electrochemical-detection-ecd-fundamentals/?srsltid=AfmBOoox8Sk4bo25_ZWdXdQzpZLaJ7lIw_E75DSoXx-pypOx9-OWMky6]
- 106. Electrochemical detection for HPLC [https://antecscientific.com/products/techniques/electrochemical-detection/]
- 107. Application of an LC–MS/MS Method for the Simultaneous ... [https://pmc.ncbi.nlm.nih.gov/articles/PMC8201085/]
- 108. Development and Validation of a New LC-MS/MS Method ... [https://www.mdpi.com/1424-8247/18/7/1028]
- 109. Neurotransmitter Analysis: HPLC-ECD vs. LC-MS/MS [https://www.amuzainc.com/blog/hplc-ecd-vs-lc-ms-neurotransmitter-analysis/?srsltid=AfmBOoocPaVVBw2aMe8h_NqHr2YHum6jVERxE7lxNT0Mint1oLOGVU6m]
- 110. New Sample Preparation Products and Accessories for ... [https://www.chromatographyonline.com/view/new-sample-preparation-products-and-accessories-for-2024-2025]
- 111. Selectivity and Sensitivity: The Electron Capture Detector ... [https://www.chromatographyonline.com/view/selectivity-and-sensitivity-the-electron-capture-detector-ecd-its-unique-inventor-james-lovelock-1919-2022-and-gaia]
- 112. Comparison Between GC and HPLC for Pharmaceutical ... [https://www.drawellanalytical.com/comparison-between-gc-and-hplc-for-pharmaceutical-analysis/]
- 113. HPLC vs GC: Choosing the Right Chromatography ... [https://www.labmanager.com/hplc-vs-gc-choosing-the-right-chromatography-technique-33689]
- 114. HOW TO PERFORM SPECIFICITY DURING METHOD ... [https://www.linkedin.com/pulse/how-perform-specificity-during-method-validation-bhaskar-napte]
- 115. 7: Electrochemical Analytical Methods [https://chem.libretexts.org/Bookshelves/Analytical_Chemistry/Supplemental_Modules_(Analytical_Chemistry)/Analytical_Sciences_Digital_Library/In_Class_Activities/Electrochemical_Methods_of_Analysis/02_Text/7%3A_Electrochemical_Analytical_Methods]
- 116. comparison of GC-MS and HPLC methods for control [https://pubmed.ncbi.nlm.nih.gov/15193720/]
- 117. Rapid High Performance Liquid Chromatography ... [https://www.sciencedirect.com/science/article/pii/S2772391725000702]
- 118. Ultrafast HPLC: Different Approaches to Increased ... [https://www.chromatographyonline.com/view/ultrafast-hplc-different-approaches-increased-throughput]
- 119. Improving Throughput and Analytical Greenness in ... [https://www.waters.com/nextgen/us/en/library/application-notes/2025/improving-throughput-and-analytical-greenness-in-pharmaceutical-discovery-using-ultrashort-hplc-columns.html?srsltid=AfmBOoq7IUGT7-3uKnVNEzxQAhnnDpjWbizHAD0n7MSng-j_m4iQnEXA]
- 120. Legion: An Instrument for High-Throughput Electrochemistry [https://pmc.ncbi.nlm.nih.gov/articles/PMC10588931/]
- 121. Eco-friendly spectrofluorimetric and HPLC-fluorescence ... [https://www.nature.com/articles/s41598-025-18325-y]
- 122. Optimization of HPLC methods for the development of quality ... [https://pmc.ncbi.nlm.nih.gov/articles/PMC12105191/]
- 123. HPLC 2025 Day 1: Automating The Analytical Laboratory [https://www.chromatographyonline.com/view/hplc-2025-day-1-automation]
- 124. High perfomance liquid chromatography in pharmaceutical ... [https://pubmed.ncbi.nlm.nih.gov/15629016/]