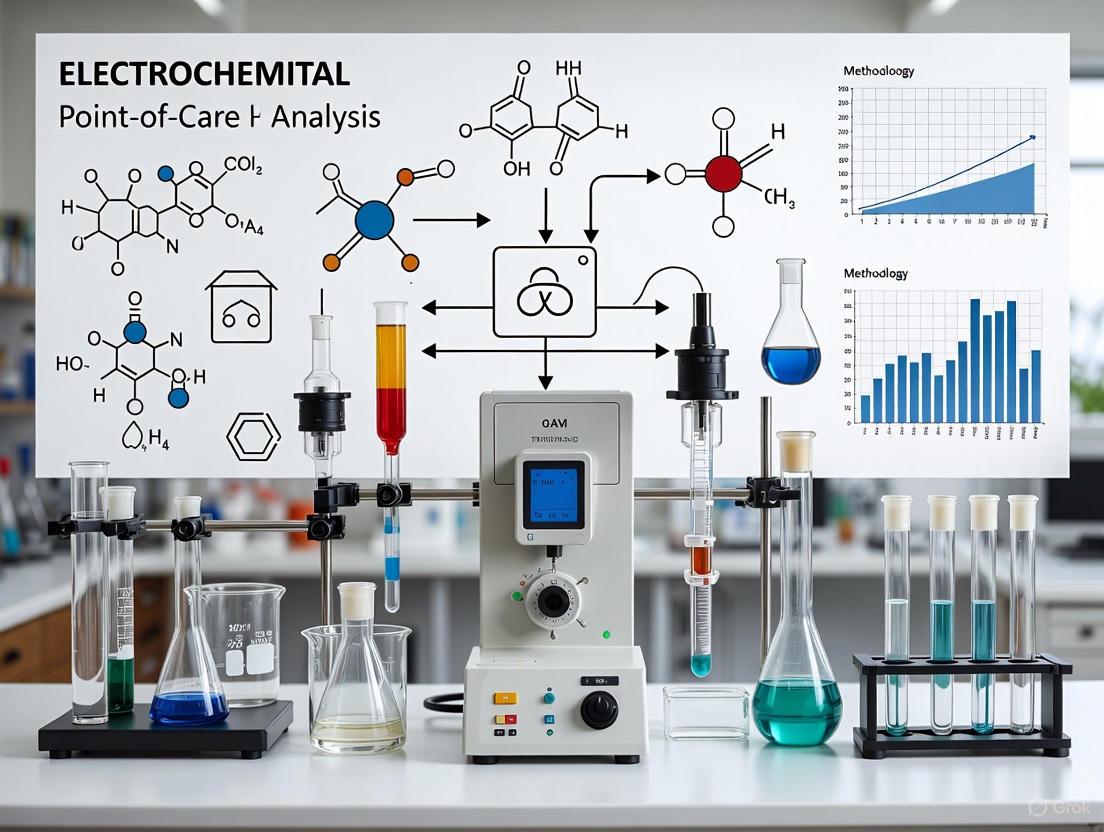
Electrochemical Point-of-Care Devices for Pharmaceutical Analysis: From Biosensors to Commercialization
This article comprehensively reviews the development and application of electrochemical devices for point-of-care (POC) pharmaceutical analysis, targeting researchers, scientists, and drug development professionals.
Electrochemical Point-of-Care Devices for Pharmaceutical Analysis: From Biosensors to Commercialization
Abstract
This article comprehensively reviews the development and application of electrochemical devices for point-of-care (POC) pharmaceutical analysis, targeting researchers, scientists, and drug development professionals. It explores the foundational principles of electrochemical sensing—including potentiometric, amperometric, and voltammetric techniques—and their integration into miniaturized POC and lab-on-chip (LOC) platforms. The scope extends to methodological applications in therapeutic drug monitoring, drug abuse detection, and proof-of-concept clinical trials, while also addressing critical troubleshooting aspects such as sensor fouling, matrix interference, and long-term stability. Furthermore, the article provides a comparative analysis of validation strategies, regulatory considerations, and the commercial viability of these technologies, synthesizing key insights to outline future trajectories for personalized medicine and decentralized clinical testing.
Principles and Evolution of Electrochemical Sensing in Pharma
Electroanalytical techniques are a class of analytical methods that study an analyte by measuring the potential (volts), current (amperes), or charge in an electrochemical cell containing the analyte [1]. These techniques have emerged as critical tools in the pharmaceutical industry, offering versatile and sensitive methods for drug analysis [2]. The core principles involve measuring electrical properties such as current, voltage, and charge resulting from interactions between the analyte and electrode under an applied voltage [2]. For point-of-care pharmaceutical analysis, these methods provide significant advantages including high sensitivity, minimal sample volume requirements, and the potential for miniaturization and integration into portable devices [3] [2].
The four primary techniques covered in this application note—potentiometry, amperometry, voltammetry, and conductometry—form the foundation for modern electrochemical analysis of pharmaceutical compounds. Their relevance to point-of-care devices stems from their ability to provide rapid, precise, and cost-effective analysis with minimal sample preparation, making them indispensable for therapeutic drug monitoring, quality control, and personalized medicine applications [2].
Comparative Analysis of Core Electroanalytical Techniques
Table 1: Core characteristics of major electroanalytical techniques
| Technique | Measured Quantity | Key Pharmaceutical Applications | Detection Limits | Key Advantages for Point-of-Care |
|---|---|---|---|---|
| Potentiometry | Potential difference between electrodes (volts) [1] | Ion-selective measurements (e.g., pH), drug concentration monitoring [3] [4] | Varies with ion-selective membrane | Miniaturization, wearable sensors, continuous monitoring [3] |
| Amperometry | Current (amperes) at fixed potential [1] [4] | Drug purity, dissolution studies, flow injection analysis [5] [6] | Nanomolar range (e.g., 10 nmol/L for methimazole) [6] | High sensitivity, rapid analysis, integration with flow systems [5] [6] |
| Voltammetry | Current as function of applied potential [1] | API detection, metabolite monitoring, impurity profiling [2] [7] | Nano-concentrations (e.g., 0.9-15×10² ng/mL for bumadizone) [7] | Detailed redox information, high selectivity with modified electrodes [2] [7] |
| Conductometry | Electrical conductance of solution [8] [4] | Titration endpoints, solubility studies, water purity assessment [8] [4] | Varies with ionic species | No indicators required, suitable for colored/turbid samples [8] |
Table 2: Recent technological advances in electroanalytical techniques
| Technique | Emerging Trends | Novel Materials/Approaches | Point-of-Care Relevance |
|---|---|---|---|
| Potentiometry | 3D-printed sensors, paper-based devices, wearable systems [3] | Ion-selective electrodes, flexible substrates, embedded systems [3] | Continuous biomarker monitoring, therapeutic drug tracking [3] |
| Amperometry | Flow injection systems, batch injection analysis [5] [6] | Boron-doped diamond electrodes, microelectrodes [6] | Automated analysis, high sample throughput [5] |
| Voltammetry | Nanomaterial-modified electrodes, pulse techniques [2] [7] | Nano-reduced graphene oxide, carbon paste electrodes, SWV/DPV [7] | Enhanced sensitivity for trace analysis, miniaturized systems [2] [7] |
| Conductometry | Electronic tongues, multi-sensor arrays [9] | Conducting polymer films, impedance spectroscopy [9] | Pattern recognition for complex samples [9] |
Detailed Experimental Protocols
Protocol 1: Potentiometric Analysis with Ion-Selective Electrodes
Principle: Potentiometry passively measures the potential difference between a reference electrode and an indicator electrode, affecting the solution very little in the process [1]. The potential difference provides a direct assessment of the sample's composition [1].
Materials:
- Reference electrode (e.g., Ag/AgCl)
- Indicator electrode (ion-selective based on target analyte)
- Potentiometer or high-impedance voltmeter
- Standard solutions for calibration
- Stirring apparatus
Procedure:
- Electrode Preparation: Condition ion-selective electrode in standard solution per manufacturer specifications. Ensure reference electrode has stable fill solution.
- Calibration: Measure potential of standard solutions across concentration range. Plot potential vs. log(concentration) to establish calibration curve.
- Sample Measurement: Immerse electrodes in sample under gentle stirring. Record stable potential reading.
- Data Analysis: Determine sample concentration from calibration curve using Nernst equation: E = E° ± (RT/nF)ln(C), where E is measured potential, E° is standard potential, R is gas constant, T is temperature, n is number of electrons, F is Faraday constant, and C is concentration.
Application Notes: For wearable potentiometric sensors, flexible substrates and solid-contact electrodes are employed for continuous monitoring of electrolytes or pharmaceuticals in biological fluids [3]. 3D printing technology offers improved flexibility and precision in manufacturing ion-selective electrodes with rapid prototyping capabilities [3].
Protocol 2: Amperometric Detection in Flow Injection Systems
Principle: Amperometry measures current resulting from electrochemical oxidation or reduction of analytes at a fixed applied potential [1] [6]. When coupled with flow injection analysis (FIA), it enables rapid, precise analyses of pharmaceutical products with high sample throughput [5].
Materials:
- Flow injection analysis system with injection valve
- Amperometric detector with flow cell
- Working electrode (e.g., boron-doped diamond, glassy carbon)
- Reference electrode (Ag/AgCl) and auxiliary electrode
- Carrier solution (appropriate buffer)
- Peristaltic pump and tubing
Procedure:
- System Setup: Install working electrode in thin-layer flow cell. Connect reference and auxiliary electrodes. Set flow rate (typically 0.5-2.0 mL/min) [6].
- Potential Optimization: Using hydrodynamic voltammetry, identify optimal detection potential that maximizes signal-to-noise ratio.
- Carrier Stream: Degas and continuously pump carrier solution (e.g., 0.1 mol/L phosphate buffer, pH 9) through system [6].
- Sample Injection: Inject sample (e.g., 20 μL loop) into carrier stream.
- Measurement: Record peak current resulting from analyte oxidation/reduction at working electrode.
- Quantification: Construct calibration curve of peak current versus concentration.
Application Notes: Boron-doped diamond electrodes (BDDE) provide advantages including low background currents, wide potential window, good resistance to fouling, and chemical stability, making them suitable for pharmaceutical analysis without requiring modification [6]. This method has been successfully applied to quantify drugs like methimazole in pharmaceutical formulations with detection limits in the nanomolar range [6].
Protocol 3: Voltammetric Analysis Using Modified Electrodes
Principle: Voltammetry involves applying a varying potential to an electrode and measuring the resulting current, revealing reduction potential and electrochemical reactivity of analytes [1]. Modified electrodes enhance sensitivity and selectivity [7].
Materials:
- Voltammetric analyzer (e.g., Metrohm computrace)
- Three-electrode system: working, reference, and auxiliary electrodes
- Graphite powder, paraffin oil, and modifiers (e.g., nano-reduced graphene oxide)
- Buffer solutions (e.g., Britton-Robinson buffer across pH range)
- Nitrogen gas for deaeration
Electrode Preparation Procedure (for nRGO-modified carbon paste electrode) [7]:
- Base Electrode: Mix 0.3 g graphite powder with 120 μL paraffin oil to form homogeneous paste. Pack into electrode body (3.0 mm diameter) with electrical connection.
- Surface Modification: Mix 5.0 mg nRGO with 50 mL dimethylformamide and sonicate for 30 minutes.
- Coating Application: Apply 20 μL nRGO solution to tip of carbon paste electrode. Allow to evaporate in open air. Repeat 3 times to form modified surface.
Analysis Procedure:
- Solution Preparation: Transfer 15 mL supporting electrolyte to voltammetric cell. Add 50 μL drug solution.
- Preconcentration: Immerse electrode with stirring for 10 seconds at applied potential (e.g., 0.4 V).
- Quiet Period: Stop stirring for 5 seconds to allow solution to become quiescent.
- Voltammogram Recording: Scan potential from 0.4 to 1.1 V at scan rate of 100 mV/s against Ag/AgCl reference electrode.
- Quantification: Use standard addition or calibration curve method with peak current.
Application Notes: Square wave voltammetry (SWV) and differential pulse voltammetry (DPV) provide enhanced sensitivity for quantitative determination compared to cyclic voltammetry, which is more suited for qualitative studies of redox behavior [2] [7]. This approach has been successfully used for bumadizone determination at nano-concentration levels in pure form, pharmaceutical preparations, and biological fluids without need for separation steps [7].
Protocol 4: Conductometric Titrations for Pharmaceutical Analysis
Principle: Conductometry measures the electrical conductivity of solutions during titrations [8]. The endpoint is determined by noting a sharp change in the conductivity of the solution shown by the intersection of lines in the graph of conductivity versus volume of titrant added [8].
Materials:
- Conductometer with conductivity cell
- Platinum electrodes (platinized to prevent polarization)
- Magnetic stirrer
- Burette for titrant addition
- Thermostat bath (as conductivity is temperature-sensitive)
Procedure:
- Cell Constant Determination: Measure conductivity of standard KCl solution to determine cell constant.
- Sample Preparation: Transfer known volume of analyte solution to titration vessel.
- Initial Measurement: Record initial conductivity of solution.
- Titration: Add titrant in small increments (0.5-1.0 mL), recording conductivity after each addition.
- Endpoint Determination: Plot conductivity versus titrant volume. Identify endpoint at intersection point of linear segments.
- Calculation: Determine analyte concentration from endpoint volume and stoichiometry.
Application Notes: Conductometric titrations are particularly advantageous for colored or turbid solutions where visual indicators fail, and they don't require specific indicators [8]. They find application in analysis of weak acids, weak bases, and mixtures of weak and strong acids [8]. The technique is also valuable for studying dissociation constants of weak acids and bases, ionic product of water, and solubility products of sparingly soluble salts [4].
Visualization of Experimental Workflows
The Scientist's Toolkit: Essential Research Reagents and Materials
Table 3: Essential research reagents and materials for electroanalytical pharmaceutical analysis
| Category | Specific Items | Function/Purpose | Application Notes | |
|---|---|---|---|---|
| Electrodes | Boron-doped diamond electrode (BDDE) [6] | Working electrode with wide potential window, low background current | Resists fouling, suitable for multiple analyses without modification [6] | |
| Nano-reduced graphene oxide (nRGO) modified electrodes [7] | Enhanced sensitivity for voltammetric detection | Increases electrode surface area, improves electron transfer [7] | ||
| Ion-selective membranes [3] | Selective recognition of target ions in potentiometry | Key component for specific analyte detection [3] | ||
| Ag/AgCl reference electrode [6] [7] | Stable reference potential | Essential for maintaining consistent potential in three-electrode systems [6] [7] | ||
| Buffer Systems | Phosphate buffers (pH 2.5-9) [6] | Supporting electrolyte with controllable pH | Maintains consistent ionic strength and pH for reproducible results [6] | |
| Britton-Robinson buffer (pH 2-12) [7] | Universal buffer for wide pH range studies | Useful for investigating pH-dependent electrochemical behavior [7] | ||
| Nanomaterials | Nano-reduced graphene oxide [7] | Electrode modifier for enhanced sensitivity | Provides large surface area and excellent electron transfer properties [7] | |
| Multi-walled carbon nanotubes [6] | Electrode modification | Enhances current response and lowers detection limits | Mentioned as alternative modifier [6] | |
| Solvents & Reagents | Methanol, dimethylformamide [7] | Solvents for standard solutions and modifier preparation | Ensures proper dissolution of analytes and modifiers [7] | |
| Paraffin oil [7] | Binder for carbon paste electrodes | Creates homogeneous paste for electrode preparation [7] | ||
| Instrumentation | Potentiostat/Galvanostat [6] [7] | Applies potential and measures current | Core instrument for voltammetric and amperometric measurements [6] [7] | |
| Flow injection analysis system [5] [6] | Automated sample introduction and processing | Enables high-throughput analysis with amperometric detection [5] [6] | ||
| Conductometer [8] | Measures solution conductivity | Essential for conductometric titrations and measurements [8] |
Electroanalytical techniques provide powerful tools for pharmaceutical analysis with particular relevance to point-of-care applications. Potentiometry, amperometry, voltammetry, and conductometry each offer unique advantages for specific analytical scenarios in drug development, quality control, and therapeutic monitoring [2].
Future advancements in these techniques are focusing on integration with emerging technologies. The incorporation of nanotechnology enhances sensitivity through materials like nano-reduced graphene oxide and boron-doped diamond [6] [7]. Artificial intelligence and machine learning are being employed for data interpretation and optimization of experimental parameters [2]. Miniaturization and development of portable, wearable sensors enable real-time monitoring of pharmaceuticals in point-of-care settings [3]. Additionally, green analytical chemistry principles are being applied to develop environmentally friendly methods with reduced solvent consumption and waste generation [7].
These advancements position electroanalysis as an indispensable component of modern pharmaceutical research and healthcare, paving the way for more efficient drug development, improved patient outcomes through personalized medicine, and enhanced quality control in pharmaceutical manufacturing [2].
The field of pharmaceutical analysis is undergoing a transformative shift from centralized laboratory testing toward decentralized, rapid point-of-care (POC) diagnostics. This paradigm shift is largely driven by advancements in the miniaturization and integration of electrochemical devices, which enable precise drug quantification at or near the patient location [10] [11]. Modern electrochemical sensors are characterized by their high sensitivity, portability, and ability to analyze complex biological matrices with minimal sample preparation, making them indispensable tools for therapeutic drug monitoring, personalized medicine, and rapid pharmaceutical screening [2] [12].
The evolution from benchtop analyzers to integrated POC systems represents a convergence of multiple technological disciplines, including microfluidics, nanomaterials science, advanced manufacturing, and digital health technologies [13] [14]. These integrated systems address critical limitations of traditional laboratory methods, which often involve lengthy turnaround times, expensive instrumentation, and requirements for specialized technical staff [11] [12]. The growing emphasis on the REASSURED criteria (Real-time connectivity, Ease of specimen collection, Affordable, Sensitive, Specific, User-friendly, Rapid and Robust, Equipment-free, and Deliverable to end-users) has established a comprehensive framework for developing next-generation POC devices that are increasingly accessible, cost-effective, and reliable for diverse healthcare settings [14].
Fundamentals of Electrochemical Sensing Platforms
Electroanalytical techniques form the cornerstone of modern POC pharmaceutical analysis, leveraging the measurement of electrical properties—current, potential, charge, and time—to detect and quantify chemical species with high precision [2]. The operational principles of these systems are based on redox reactions occurring at the electrode-solution interface when a voltage is applied, generating measurable signals proportional to analyte concentration [12].
Core Electroanalytical Techniques
Voltammetric Methods encompass several approaches vital for pharmaceutical analysis. Cyclic Voltammetry (CV) provides qualitative information about redox potentials and reaction kinetics through voltage sweeping, while Differential Pulse Voltammetry (DPV) and Square Wave Voltammetry (SWV) employ pulsed potential waveforms to minimize background current, significantly enhancing sensitivity for trace-level drug detection [2]. Potentiometric Methods measure potential without current flow, typically using ion-selective electrodes (ISEs) for specific ion detection, which is particularly valuable for pH-sensitive pharmaceutical compounds and electrolyte monitoring [2]. Amperometric Methods monitor current response at a fixed potential, offering continuous monitoring capabilities ideal for miniaturized sensors targeting specific analytes like glucose or therapeutic drugs [12].
Electrode Platforms and Materials
The sensor platform constitutes a critical component in electrochemical systems. Carbon-Based Electrodes, including Carbon Paste Electrodes (CPE), Glassy Carbon Electrodes (GCE), and Screen-Printed Carbon Electrodes (SPCE), provide versatile substrates with wide potential windows, low cost, and ease of modification [12]. Nanostructured Materials such as graphene, carbon nanotubes, metal nanoparticles, and metal-organic frameworks (MOFs) dramatically increase electroactive surface area, enhance electron transfer kinetics, and improve overall sensor sensitivity and selectivity [13] [2] [12].
Technological Advances Driving Miniaturization
Materials Innovation
Recent breakthroughs in nanomaterials have fundamentally transformed electrode design and performance characteristics. Screen-printed electrodes (SPEs) fabricated with specialized inks containing carbon, gold, or platinum enable low-cost, mass-producible, and highly sensitive platforms for in situ measurements [13]. These electrodes demonstrate exceptional modularity and flexibility, making them ideal for applications ranging from heavy-metal detection to sophisticated biosensor platforms [13]. Nanocomposite materials, including iron-based composites and graphene/SiC hybrids, have demonstrated superior sensitivity, stability, and selectivity when used for electrode modification [13]. These advanced materials facilitate the detection of low-abundance biomarkers and pharmaceutical compounds in complex biological samples, addressing a primary challenge in POC diagnostic applications [14].
Manufacturing and System Integration
Additive manufacturing techniques, particularly screen printing, have revolutionized electrode production by enabling high-volume fabrication of disposable, low-cost electrochemical sensors with excellent reproducibility [13]. Microelectromechanical Systems (MEMS) technology allows for the creation of ultra-miniature sensor elements—some with diameters below 15mm—that maintain high performance while achieving significant size reduction [15]. The integration of microfluidic components enables precise manipulation of small fluid volumes (typically microliter to nanoliter), facilitating automated sample preparation, reagent storage, and waste containment within self-contained cartridge systems [11] [16]. These "lab-on-a-chip" platforms are essential for creating sample-to-answer POC devices that require minimal user intervention [11].
Electronics and Connectivity
Modern miniaturized sensors increasingly incorporate ultra-low-power sensing modules that enable extended operation in wearable or remote monitoring applications [13]. Advanced systems such as the onsemi CEM102 + RSL15 platform demonstrate remarkably low current draws (as low as 3.5 µA) while supporting multi-electrode detection capabilities [13]. The implementation of wireless communication protocols (e.g., Bluetooth, Wi-Fi) allows seamless data transmission to smartphones, tablets, or cloud-based platforms, enabling real-time result reporting, remote expert consultation, and integration with electronic health records [10] [17]. This connectivity transforms standalone sensors into comprehensive digital health ecosystems capable of supporting clinical decision-making across diverse healthcare scenarios [14].
Application Protocols for Pharmaceutical Analysis
Protocol 1: Modified Carbon Paste Electrode for Drug Detection in Biological Fluids
Objective: To quantify pharmaceutical compounds in biological matrices (urine, serum) using nanostructure-modified carbon paste electrodes.
Materials and Reagents:
- Graphite Powder: Conductive base material for electrode formation [12]
- Paraffin Oil: Binding agent for creating paste consistency [12]
- Nanomaterial Modifiers: Multi-walled carbon nanotubes (MWCNTs), silver nanoparticles (AgNPs), or flake graphite (FG) to enhance sensitivity [12]
- Pharmaceutical Standard: Reference standard of target drug (e.g., methdilazine hydrochloride, ketoconazole) [12]
- Buffer Solutions: Phosphate buffer saline (PBS) for optimal pH control [12]
- Biological Samples: Human urine or serum samples for analysis [12]
Experimental Workflow:
Procedure:
- Electrode Preparation: Thoroughly mix graphite powder and paraffin oil (typically 70:30 ratio) in a mortar until a homogeneous paste is achieved [12].
- Modifier Incorporation: Add nanomaterial modifier (e.g., 5-10% w/w MWCNTs, AgNPs) to the graphite-paraffin mixture and mix uniformly to ensure even distribution [12].
- Electrode Packing: Pack the modified paste firmly into an electrode body (typically Teflon sleeve with electrical contact), ensuring consistent packing density [12].
- Surface Renewal: Smooth the electrode surface on weighing paper to create a fresh, reproducible working surface before each measurement [12].
- Sample Preparation: Spike biological samples (urine, serum) with known concentrations of target pharmaceutical compound. Dilute with supporting electrolyte if necessary [12].
- Electrochemical Measurement: Employ Square Wave Voltammetry (SWV) or Differential Pulse Voltammetry (DPV) parameters optimized for the specific drug analyte. Typical conditions: pulse amplitude 25-50 mV, step potential 2-10 mV, frequency 10-25 Hz [12].
- Data Analysis: Record peak currents and construct a calibration curve using standard solutions. Calculate unknown concentrations from the regression equation [12].
- Validation: Perform recovery studies by spiking samples with known drug concentrations and comparing measured values with expected values. Validate method accuracy against reference techniques like HPLC when possible [12].
Applications: This protocol is effective for detecting various pharmaceuticals including methdilazine hydrochloride in Dilosyn syrup and human urine, ketoconazole in pharmaceutical formulations, and ofloxacin in urine samples with detection limits often reaching nanomolar concentrations [12].
Protocol 2: Screen-Printed Electrode Systems for Multiplexed Drug Screening
Objective: To simultaneously detect multiple pharmaceutical compounds or metabolites using customized screen-printed electrodes.
Materials and Reagents:
- Screen-Printed Electrodes: Commercial or custom-designed SPEs with carbon, gold, or platinum working electrodes [13]
- Multiplexing Reader: Portable potentiostat capable of simultaneous multi-electrode measurements [13] [17]
- Sensor Modifiers: Molecularly imprinted polymers (MIPs), ion-selective membranes, or enzyme substrates for enhanced selectivity [12]
- Drug Panels: Standard solutions of target compounds (e.g., opioids, antibiotics, antidepressants) [17] [18]
- Buffer Systems: Appropriate physiological pH buffers for maintaining biological relevance [12]
Experimental Workflow:
Procedure:
- Electrode Selection: Choose appropriate screen-printed electrode configuration based on target analytes. Multi-electrode arrays enable parallel detection of different compounds [13].
- Surface Modification: Modify working electrodes with selective recognition elements. For Molecularly Imprinted Polymers (MIPs), polymerize in presence of target molecule template, then remove template to create specific binding cavities [12].
- Assay Configuration: Program the portable potentiostat with optimized parameters for each target drug. Typical settings include potential window specific to each drug's redox behavior, pulse parameters for SWV/DPV, and integration times [17].
- Sample Application: Apply biological sample (saliva, urine, blood) directly to the electrode surface. Minimal sample volume requirements (10-50 µL) make SPEs ideal for fingerstick blood samples or small saliva volumes [17] [18].
- Multiplexed Detection: Simultaneously monitor electrochemical signals from multiple working electrodes. Modern systems can detect 4-8 different analytes in a single run [17].
- Data Processing: Use built-in algorithms to convert raw current signals to concentration values based on pre-established calibration curves. Advanced systems employ machine learning for pattern recognition in complex samples [14].
- Connectivity Transfer: Wirelessly transmit results to connected devices or cloud-based platforms for immediate clinical decision-making and data storage [14] [17].
Applications: This protocol is particularly valuable for workplace drug screening, emergency room toxicology, and pain management monitoring, enabling simultaneous detection of amphetamines, opiates, cannabinoids, cocaine, benzodiazepines, and other pharmaceutical compounds with results in minutes [17] [18].
Performance Comparison of Miniaturized Electrochemical Platforms
Table 1: Analytical Performance of Selected Miniaturized Electrochemical Sensors for Pharmaceutical Analysis
| Electrode Platform | Analyte | Sample Matrix | Linear Range | Detection Limit | Technique | Ref |
|---|---|---|---|---|---|---|
| poly-EBT/CPE | Methdilazine HCl | Human urine, syrup | 0.1-50 μM | 0.0257 μM | SWV | [12] |
| Ce-BTC MOF/IL/CPE | Ketoconazole | Pharmaceutical, urine | 0.1-110.0 μM | 0.04 μM | DPV, CV | [12] |
| [10%FG/5%MW] CPE | Ofloxacin | Tablets, human urine | 0.60-15.0 nM | 0.18 nM | SW-AdAS | [12] |
| AgNPs@CPE | Metronidazole | Milk, tap water | 1-1000 μM | 0.206 μM | Not specified | [12] |
| MIP/CP ECL sensor | Azithromycin | Urine, serum | 0.10-400 nM | 0.023 nM | ECL | [12] |
| Screen-printed multi-panel | Opioids | Saliva, urine | Varies by drug | Varies by drug | Amperometry | [18] |
Table 2: Comparison of POC Technologies for Different Pharmaceutical Applications
| Technology Platform | Key Advantages | Analysis Time | Multiplexing Capability | Typical Applications | |
|---|---|---|---|---|---|
| Modified Carbon Paste Electrodes | Renewable surface, wide potential window, low cost | 5-15 minutes | Limited (sequential analysis) | Drug purity testing, metabolite detection, therapeutic drug monitoring | [12] |
| Screen-Printed Electrodes | Mass producible, disposable, portable | 1-5 minutes | High (parallel detection) | Workplace drug testing, emergency toxicology, pain management compliance | [13] [17] |
| Lateral Flow Assays | Equipment-free, simple operation, low cost | 5-15 minutes | Moderate (multiple test lines) | Home drug testing, initial screening, resource-limited settings | [14] [18] |
| Semiconductor Nanowire Sensors | Ultra-high sensitivity, label-free detection | <10 minutes | Moderate | Cardiac biomarker detection (troponin), low-abundance biomarkers | [16] |
| Microfluidic Integrated Sensors | Automated sample processing, minimal user intervention | 10-30 minutes | High | Complex sample analysis, multi-step assays, nucleic acid detection | [11] |
The Scientist's Toolkit: Essential Research Reagents and Materials
Table 3: Key Research Reagent Solutions for Developing POC Electrochemical Sensors
| Material/Reagent | Function | Application Examples | Key Characteristics | |
|---|---|---|---|---|
| Carbon Nanotubes (MWCNTs) | Enhance electron transfer, increase surface area | Electrode modification for antibiotic detection (e.g., ofloxacin) | High conductivity, large specific surface area, functionalizable surface | [12] |
| Metal Nanoparticles (Ag, Au) | Catalyze redox reactions, improve sensitivity | Silver nanoparticles for metronidazole detection; Gold nanoparticles for azithromycin analysis | High catalytic activity, size-tunable properties, surface plasmon resonance | [12] |
| Molecularly Imprinted Polymers (MIPs) | Provide selective recognition sites | Azithromycin detection in urine and serum | Artificial antibody-like properties, high stability, target-specific binding | [12] |
| Ionic Liquids | Improve conductivity, enhance stability | Component in Ce-BTC MOF/IL/CPE for ketoconazole detection | High ionic conductivity, low volatility, wide electrochemical window | [12] |
| Metal-Organic Frameworks (MOFs) | Create porous structures with high surface area | Ce-BTC MOF for ketoconazole sensor | Ultra-high surface area, tunable pore size, catalytic properties | [12] |
| Screen-Printing Inks | Mass production of disposable electrodes | Fabrication of portable sensors for drug abuse testing | Tunable composition, high conductivity, reproducible deposition | [13] |
| Nafion Membranes | Provide selectivity, reduce fouling | Glucose sensors in real serum samples | Cation exchange properties, biocompatibility, antifouling characteristics | [12] |
Integration with Digital Technologies and Future Perspectives
The convergence of miniaturized electrochemical sensors with digital health technologies represents the frontier of POC pharmaceutical analysis. Artificial intelligence and machine learning algorithms are increasingly being embedded into POC platforms to enhance analytical accuracy, enable complex pattern recognition, and reduce subjective result interpretation [14]. These computational approaches are particularly valuable for multiplexed assays where they can process complex datasets from multiple sensing channels simultaneously, significantly improving quantification accuracy compared to traditional multivariate regression methods [14].
The integration of convolutional neural networks (CNNs) with imaging-based POC platforms has demonstrated remarkable capabilities for automated analysis without compromising diagnostic sensitivity [14]. These advanced algorithms can optimize sensor design parameters, interpret faint test lines that challenge visual assessment, and provide quality control through real-time error detection [14]. Furthermore, the implementation of blockchain technology for secure data management and the development of robust cybersecurity measures are becoming essential considerations as POC systems increasingly connect to cloud-based health networks and electronic medical records [14] [17].
Future developments in miniaturized electrochemical sensors will likely focus on creating increasingly autonomous systems capable of continuous monitoring of therapeutic drugs in ambulatory patients. These systems will leverage energy harvesting technologies, ultra-low-power electronics, and seamless integration with wearable platforms to provide comprehensive pharmacokinetic profiles that transcend the snapshot view provided by current single-time-point measurements [10] [16]. As these technologies mature, they will fundamentally transform pharmaceutical research and clinical practice, enabling truly personalized medicine through precision dosing regimens tailored to individual metabolic responses [2] [16].
The advancement of point-of-care (POC) pharmaceutical analysis relies heavily on the integration of innovative nanomaterials and transducers to create devices that are rapid, sensitive, and deployable outside central laboratories. Electrochemical devices, in particular, have emerged as promising platforms for therapeutic drug monitoring, quality control, and personalized medicine [19]. The convergence of carbon nanotubes (CNTs), graphene, quantum dots (QDs), and screen-printed electrodes (SPEs) provides the foundational toolkit for developing next-generation sensors that meet the ASSURED (Affordable, Sensitive, Specific, User-friendly, Rapid/Robust, Equipment-free, and Deliverable to end users) criteria defined by the World Health Organization for ideal POC diagnostics [20] [21]. These nanomaterials enhance sensor performance through their superior electrocatalytic properties, large surface areas, and biocompatibility, enabling the detection of drugs at ultra-low concentrations [22]. This document outlines the key applications and provides detailed experimental protocols for employing these materials in POC electrochemical sensing of pharmaceuticals.
Nanomaterials and Transducers: Properties and Applications
Key Nanomaterials in Pharmaceutical Analysis
Table 1: Key Nanomaterials and Their Functional Properties in Pharmaceutical Analysis
| Nanomaterial | Key Properties | Role in Pharmaceutical Analysis | Exemplary Applications |
|---|---|---|---|
| Graphene & Derivatives | High electrical conductivity, large specific surface area, unique heterogeneous electron transfer rate [22]. | Electrode modifier to enhance electron transfer, increase effective surface area, and pre-concentrate analytes [23] [24]. | Detection of a wide range of drug molecules; often combined with other nanomaterials in composites [23] [22]. |
| Carbon Nanotubes (CNTs) | High electrical conductivity, chemical stability, very large surface area, capacity for functionalization [24]. | Facilitate electron transfer in redox reactions and adsorb analytes for pre-concentration [24]. | Multi-walled CNTs (MWCNTs) used in sensors for drugs like timolol maleate [24]. |
| Quantum Dots (QDs) | Semiconductor nanocrystals; size-dependent fluorescence, broad excitation, and narrow emission peaks [25]. | Fluorescent reporters in optical sensors (e.g., lateral flow immunoassays) and electro-catalysts in electrochemical sensors [20] [25]. | QD-based lateral flow immunoassays (QD-LFIA) for infectious diseases; electrochemical sensing [20]. |
| Transition Metal Chalcogenides (TMCs) | Large surface area, specific electrical features, excellent catalytic activity [22]. | Electrode modifiers to enhance sensitivity and selectivity for specific drug molecules [22]. | Nanocomposites with graphene for detecting analgesics, antibiotics, and antivirals [22]. |
Key Transducer: Screen-Printed Electrodes (SPEs)
Screen-printed electrodes are mass-produced, disposable electrochemical cells that are ideally suited for POC testing. A typical SPE integrates a three-electrode system on a plastic or ceramic substrate:
- Working Electrode: Its response is sensitive to the analyte concentration; often modified with nanomaterials [26].
- Reference Electrode: Provides a stable, known potential [26].
- Counter (Auxiliary) Electrode: Completes the electrical circuit [26].
The principal advantages of SPEs include low cost, flexibility of design, high reproducibility, and the possibility of connection to portable potentiostats for in-situ analysis [26] [24]. Their single-use nature avoids tedious cleaning procedures and minimizes cross-contamination [26].
Table 2: Performance of Selected Nanomaterial-Based Sensors in Pharmaceutical Compound Detection
| Electrode Modification | Target Pharmaceutical | Technique | Linear Range | Limit of Detection (LOD) | Citation |
|---|---|---|---|---|---|
| AuNPs/β-CD/RGO⁴ | Ciprofloxacin | DPV | Not Specified | 2.7 nM | [24] |
| Nafion/carboxylated-MWCNTs | Timolol Maleate | DPV | 1.0 nM – 20 µM | 0.7 nM | [24] |
| MWCNTs/Ag Nanoparticles | Isoxsuprine | DPV | Not Specified | 12.0 nM | [24] |
| Cu₂O-RGO | Dopamine | DPV | 0.01 – 80 µM | 6.0 nM | [24] |
| Electrochemically RGO-CB⁵ | Dopamine, Epinephrine, Paracetamol | DPV | Simultaneous detection | Not Specified | [24] |
| GQDs & AuNCs on μPAD⁶ | Pathogens (S. aureus, P. aeruginosa) | Fluorescence | Not Specified | 0.1 ng/mL | [27] |
| ¹ DPV: Differential Pulse Voltammetry; ² RGO: Reduced Graphene Oxide; ³ MWCNTs: Multi-Walled Carbon Nanotubes; ⁴ β-CD: β-cyclodextrin; ⁵ CB: Carbon Black; ⁶ μPAD: Paper-Based Analytical Device |
Experimental Protocols
Protocol 1: Fabrication of a Graphene-Based Nanocomposite Modified Screen-Printed Electrode for Drug Detection
This protocol details the modification of a commercial carbon SPE with a graphene/TMC nanocomposite for the sensitive detection of specific drug molecules.
Research Reagent Solutions:
- Commercial Carbon SPEs: Serves as the inexpensive, disposable substrate for the sensor.
- Graphene Oxide (GO) Dispersion: The precursor for creating conductive graphene layers on the electrode.
- Transition Metal Salt Precursors: (e.g., CuCl₂, ZnAc₂, MoO₃) to form the TMC component.
- Chitosan (0.5% w/v in 1% acetic acid): A biopolymer binder to form a stable composite film.
- Phosphate Buffered Saline (PBS) (0.1 M, pH 7.4): The standard electrolyte for electrochemical measurements.
- Target Drug Standard Solution: A pure standard of the analyte for sensor calibration and testing.
Procedure:
- Synthesis of Graphene/TMC Nanocomposite: a. Combine the GO dispersion with the transition metal salt precursors in an aqueous solution. b. Transfer the mixture to a Teflon-lined autoclave and heat at 120-180°C for 6-12 hours for a one-pot hydrothermal synthesis. This process simultaneously reduces GO to RGO and forms TMC nanoparticles. c. Centrifuge the resulting product, wash with deionized water and ethanol, and dry to obtain the powdered nanocomposite.
Modification of the SPE: a. Prepare an ink by dispersing 1 mg of the synthesized nanocomposite in 1 mL of chitosan solution (0.5% w/v) with the aid of 15-30 minutes of ultrasonication. b. Using a precision micropipette, deposit a precise volume (e.g., 5-10 µL) of the ink directly onto the working electrode surface of the SPE. c. Allow the modified electrode to dry at room temperature or in an oven at 40°C, forming a stable, thin film.
Electrochemical Measurement and Detection: a. Connect the modified SPE to a portable potentiostat. b. Pipette a measured volume (e.g., 50-100 µL) of the sample (standard or unknown in PBS) onto the electrode surface, covering the three-electrode system. c. Run the optimized electrochemical technique (e.g., Differential Pulse Voltammetry (DPV) or Cyclic Voltammetry (CV)). d. Quantify the drug concentration by comparing the current response (peak height) of the unknown sample to a calibration curve constructed from standard solutions.
Figure 1: Workflow for fabricating and using a nanocomposite-modified SPE.
Protocol 2: Development of a Quantum Dot-Based Lateral Flow Immunoassay (QD-LFIA)
This protocol describes the construction of a fluorescent LFIA for the sensitive, multiplexed detection of pharmaceutical targets or biomarkers, utilizing the unique optical properties of QDs.
Research Reagent Solutions:
- Nitrogen-doped Graphene QDs (GQDs) or CdSe/ZnS Core/Shell QDs: High-intensity fluorescent reporters that are conjugated to detection antibodies.
- Specific Monoclonal Antibodies: Bind to the target analyte; one is conjugated to the QD, another is immobilized on the test line.
- Nitrocellulose Membrane: The porous matrix where capillary flow and immunoreactions occur.
- Sample Pad and Absorbent Pad: Components of the lateral flow strip for sample application and waste containment.
- Conjugation Pad: The zone where the QD-antibody conjugate is stored.
- Running Buffer (e.g., PBS with BSA): Optimized buffer to facilitate sample flow and specific binding.
Procedure:
- QD-Antibody Conjugate Preparation: a. Activate the carboxyl groups on the QD surface using EDC (1-Ethyl-3-(3-dimethylaminopropyl)carbodiimide) and NHS (N-hydroxysuccinimide) chemistry. b. Mix the activated QDs with the specific detection antibody and incubate for 2 hours at room temperature. c. Purify the QD-antibody conjugate via centrifugation or gel filtration to remove unbound antibodies.
LFIA Strip Assembly: a. Dispense the capture antibody and a species-specific control antibody in discrete lines (test and control lines) onto the nitrocellulose membrane using a precision dispenser. b. Spray the purified QD-antibody conjugate onto the conjugate pad and dry. c. Assemble the strip by attaching the sample pad, conjugate pad, nitrocellulose membrane, and absorbent pad in sequential order on a backing card, with a 1-2 mm overlap between each component.
Assay Execution and Readout: a. Apply the liquid sample (e.g., urine, serum, or dissolved pharmaceutical product) to the sample pad. b. As the sample migrates, it rehydrates the QD-antibody conjugate in the conjugate pad. If the target analyte is present, it forms a complex with the conjugate. c. This complex flows to the test line, where it is captured by the immobilized antibody, generating a fluorescent signal. d. The excess conjugate continues to the control line, generating a second fluorescent signal to validate the assay function. e. The result can be visualized under a UV lamp, and quantified using a handheld fluorescence reader for higher sensitivity and objectivity. The entire process can be completed in under 30 minutes [20] [27].
Figure 2: Core steps in constructing and running a QD-based lateral flow immunoassay.
The Scientist's Toolkit
Table 3: Essential Research Reagent Solutions for Nanomaterial-Based Sensor Development
| Reagent/Material | Function/Description | Typical Application/Note |
|---|---|---|
| Screen-Printed Electrodes (SPEs) | Disposable, low-cost electrochemical cell substrates. | Ideal for portable, single-use POC devices; available with carbon, gold, or platinum working electrodes [26]. |
| Graphene Oxide (GO) & Reduced GO (RGO) | 2D carbon material with high conductivity and surface area for electrode modification. | Serves as an excellent scaffold for anchoring other nanomaterials and enhancing electron transfer [24] [22]. |
| Functionalized Carbon Nanotubes | CNTs treated with acids or other agents to introduce surface functional groups (-COOH, -OH). | Improves dispersion in solvents and provides sites for covalent attachment of biomolecules or other nanomaterials [24]. |
| Quantum Dots (CdSe/ZnS, GQDs) | Semiconductor nanocrystals used as fluorescent labels or electro-catalysts. | GQDs are explored for lower toxicity; core/shell QDs offer higher fluorescence stability [25]. |
| Chitosan | A natural biopolymer derived from chitin. | Used as a binder to form stable composite films on electrodes due to its excellent film-forming ability and biocompatibility [24]. |
| EDC & NHS | Crosslinking agents for carbodiimide chemistry. | Used to activate carboxyl groups on nanomaterials for covalent conjugation to antibodies or other biomolecules bearing amine groups [20]. |
| Nafion | A sulfonated tetrafluoroethylene-based polymer. | Used as a permselective coating to repel interfering anions (e.g., ascorbic acid) in electrochemical sensors [24]. |
| Phosphate Buffered Saline (PBS) | A buffer solution commonly used in biological research. | Serves as the standard electrolyte medium for electrochemical and immunoassay experiments. |
Point-of-Care (POC) testing refers to diagnostic analyses performed at or near the location of a patient, without the need for a centralized laboratory. This approach provides rapid, actionable results that enable immediate clinical decision-making [28]. The World Health Organization (WHO) has established the ASSURED criteria (Affordable, Sensitive, Specific, User-friendly, Rapid and robust, Equipment-free, and Deliverable to end-users) as the gold standard for ideal POC devices [28]. In pharmaceutical settings, POC technologies are revolutionizing clinical trials, therapeutic drug monitoring, and personalized treatment strategies.
Lab-on-a-Chip (LoC) devices represent the technological platform that enables miniaturized POC testing. These systems integrate one or several laboratory functions on a single integrated circuit (chip) ranging from millimeters to a few square centimeters in size to handle extremely small fluid volumes, typically from nanoliters to microliters [29]. By consolidating multiple laboratory processes such as sampling, pretreatment, reactions, separation, detection, and data analysis onto a single automated platform, LoC systems minimize reliance on bulky instrumentation and extensive manual intervention [29].
The convergence of POC requirements with LoC technological capabilities creates powerful tools for pharmaceutical applications, particularly through the integration of electrochemical sensing mechanisms that provide the sensitivity, portability, and cost-effectiveness needed for widespread adoption.
Fundamental Principles and Definitions
Core Technological Concepts
Microfluidics, the science and technology of systems that process or manipulate small amounts of fluids using channels with dimensions of tens to hundreds of micrometers, forms the foundational principle of LoC devices [29] [30]. At this scale, fluid behavior is dominated by laminar flow (smooth, orderly fluid motion), surface tension, and capillary forces, rather than the turbulent flows common in macroscopic systems [29] [30]. These principles enable precise fluid control with minimal sample volumes.
Electrochemical sensing in LoC devices typically employs a three-electrode system consisting of working, counter, and reference electrodes to quantify analytes through electrical measurements [31]. The strategic modification of electrode surfaces with nanomaterials such as graphene, metal-organic frameworks (MOFs), and transition metal dichalcogenides significantly enhances sensitivity and selectivity by increasing surface area and improving electron transfer kinetics [31].
Material Selection for Pharmaceutical LoC Applications
Material selection critically influences LoC device performance, fabrication complexity, and cost. The table below compares common materials used in LoC fabrication for pharmaceutical applications:
Table 1: Material Considerations for Lab-on-a-Chip Devices in Pharmaceutical Settings
| Material | Advantages | Limitations | Pharmaceutical Applications |
|---|---|---|---|
| Polydimethylsiloxane (PDMS) | Biocompatible, gas-permeable, optically transparent, flexible | Hydrophobic, absorbs small hydrophobic molecules, scalability challenges | Organ-on-chip models, drug interaction studies, cell culture applications [29] |
| Glass | Chemically inert, low nonspecific adsorption, optically transparent | High bonding temperature requirements, fragile nature | Nucleic acid analysis, drug delivery studies, immunoassays requiring high optical clarity [29] |
| Polymers (e.g., PMMA, PC) | Cost-effective, versatile manufacturing methods, good chemical resistance | Variable biocompatibility, may autofluoresce | Disposable diagnostic cartridges, high-throughput screening devices [29] |
| Paper | Low cost, capillary-driven flow, equipment-free operation | Limited multi-step process integration, sample volume restrictions | Simple colorimetric tests, low-complexity urinalysis [29] [30] |
| Printed Circuit Board (PCB) | Well-established manufacturing, integrated electronics, low-cost mass production | Limited channel aspect ratios, surface functionalization may be needed | Integrated nucleic acid amplification, electrochemical detection systems [32] |
Current Market Landscape and Adoption Trends
The LoC market demonstrates robust growth driven by pharmaceutical and diagnostic applications. The following table quantifies this expansion and key segmentation:
Table 2: Lab-on-a-Chip Market Analysis and Projected Growth
| Parameter | Current Market Value (2024-2025) | Projected Market Value (2032-2034) | CAGR | Dominant Segments |
|---|---|---|---|---|
| Global Market Size | USD 6.97-7.21 billion [33] [34] | USD 13.87-17.14 billion [33] [34] | 9.42-9.8% [33] [34] | - |
| Product Segment | - | - | - | Reagents & Consumables (40.3%) [34] |
| Technology | - | - | - | Microfluidics (41.7%) [33] |
| Application | - | - | - | Clinical & Diagnostics (39.2%) [33] |
| End-User | - | - | - | Hospitals & Clinics (44.5%) [33] |
| Regional Dominance | - | - | - | North America (43%) [33] |
The substantial market growth reflects several key trends impacting pharmaceutical settings:
Miniaturization and Portability: The transition toward portable diagnostic platforms minimizes sample requirements and generates results within minutes rather than hours [33]. In January 2025, Stanford University researchers demonstrated a handheld LOC device detecting multiple infectious diseases from a single blood droplet in under 20 minutes [33].
AI and IoT Integration: Major diagnostics companies are incorporating artificial intelligence and machine learning algorithms into LoC platforms to enhance real-time data analytics, automation, and biomarker detection accuracy [33] [34]. These systems can connect to hospital databases and wearable health devices, enabling predictive diagnostics and evidence-based decision making [35] [33].
Personalized Medicine Focus: LoC devices enable molecular-level diagnostics tailored to individual patients, supporting targeted therapies and precision dosing strategies [29] [33]. In March 2024, the U.S. NIH launched a $150 million program to finance LOC-based genomic testing platforms for precision healthcare [33].
Experimental Protocols for Pharmaceutical Application
Protocol: PCB-Based Nucleic Acid Amplification and Electrochemical Detection
This protocol adapts the methodology published by Scientific Reports (2025) for a Lab-on-PCB platform integrating nucleic acid amplification and electrochemical detection [32].
Principle
The system utilizes reverse transcription loop-mediated isothermal amplification (RT-LAMP) for nucleic acid amplification followed by electrochemical detection using methylene blue (MB) as a redox-active DNA intercalator. The entire process is integrated onto a disposable printed circuit board (PCB) platform, eliminating the need for complex microfluidics and optical detection systems [32].
Equipment and Reagents
Table 3: Research Reagent Solutions for PCB-Based Nucleic Acid Detection
| Item | Specification | Function/Purpose |
|---|---|---|
| PCB Chips | Custom 2-layer boards with ENIG surface finish | Device substrate with integrated heating elements and gold electrodes |
| Microcontroller | STM32G431KB or equivalent | Orchestrates heating protocols and electrochemical measurements |
| Amplification Reagents | WarmStart LAMP Kit (NEB) | Provides enzymes, buffers, and nucleotides for isothermal amplification |
| Electrochemical Probe | Methylene Blue (1 mM in PBS) | Redox-active intercalator that binds to amplified DNA products |
| SARS-CoV-2 Primers | Custom RT-LAMP primer set | Target-specific amplification for SARS-CoV-2 RNA detection |
| PDMS | Sylgard 184 | Creates fluidic chambers on PCB surfaces |
| Temperature Probes | PT100 or similar | Monitors and controls amplification temperature |
Procedure
PCB Preparation:
- Fabricate PCB slides according to design specifications with separate boards for heating and electrochemical detection.
- Apply ENIG (Electroless Nickel Immersion Gold) surface finish to ensure biocompatibility and consistent electrode performance.
- Bond PDMS fluidic chambers (8 mm diameter, 4 mm height) to PCB surfaces to create reaction wells.
Sample Preparation:
- Mix 12.5 µL of WarmStart LAMP reaction mix with 1 µL of primer set and 5 µL of sample containing target RNA (e.g., SARS-CoV-2 RNA).
- Pipette the 18.5 µL reaction mixture into the PDMS chamber on the heater PCB.
Nucleic Acid Amplification:
- Insert the heater PCB into the main control unit.
- Program the microcontroller to maintain isothermal amplification at 65°C for 45 minutes.
- Monitor temperature using the integrated resistance measurement of the heater coil.
Electrochemical Detection:
- Transfer 5 µL of amplified product to the electrochemical detection PCB.
- Add 45 µL of methylene blue solution (1 mM in PBS) to the detection chamber.
- Perform cyclic voltammetry scans from -0.1 V to -0.5 V at a scan rate of 100 mV/s.
- Measure the reduction peak current at approximately -0.27 V versus the onboard reference electrode.
Data Analysis:
- Compare reduction peak currents between test samples and negative controls.
- A significant increase in reduction current indicates successful amplification and the presence of target nucleic acids.
Technical Notes
- This system achieved detection sensitivity of 10 copies/reaction for SARS-CoV-2 RNA within 1.5 hours total processing time [32].
- The PCB approach significantly reduces cost compared to traditional microfluidic fabrication methods while maintaining analytical performance.
- The system can be adapted for other targets by modifying the primer sets, making it valuable for pharmaceutical applications including pathogen detection and genetic biomarker analysis.
Protocol: Molecularly Imprinted Polymer-Based Electrochemical Sensing
This protocol outlines the development of MIP-based electrochemical sensors for pharmaceutical compounds, adapted from recent literature [28].
Principle
Molecularly imprinted polymers (MIPs) are synthetic polymers containing specific cavities designed for target molecule recognition, functioning as "artificial antibodies." When integrated with electrochemical transducers, they create highly selective sensors for therapeutic drug monitoring and biomarker detection [28].
Procedure
Electrode Preparation:
- Polish glassy carbon electrode (GCE) with alumina slurry (0.05 µm) and rinse thoroughly with deionized water.
- Dry the electrode at room temperature under nitrogen stream.
MIP Fabrication:
- Prepare pre-polymerization solution containing functional monomer (e.g., pyrrole), cross-linker, target molecule (template), and initiator in appropriate solvent.
- Deposit the pre-polymerization mixture onto the electrode surface.
- Initiate polymerization electrochemically (e.g., cyclic voltammetry from 0 to 1.0 V for 15 cycles) or photochemically.
- Extract the template molecules by washing with appropriate solvent to create specific recognition cavities.
Electrochemical Measurement:
- Incubate the MIP-modified electrode with sample solution containing the target analyte.
- Perform electrochemical measurement using differential pulse voltammetry (DPV) or square wave voltammetry (SWV).
- Quantify the target concentration based on the change in electrochemical signal (current or potential).
Applications in Pharmaceutical Settings
- Therapeutic Drug Monitoring: MIP sensors have been developed for antibiotics, anticancer drugs, and antidepressants with detection limits reaching nanomolar concentrations [28].
- Biomarker Detection: MIP-based sensors can detect cancer biomarkers like CA 15-3 with sensitivity comparable to immunoassays but with superior stability [28].
Data Analysis and Interpretation
The integration of machine learning (ML) and artificial intelligence (AI) with LoC systems significantly enhances data analysis capabilities in pharmaceutical applications [35]. ML algorithms, particularly convolutional neural networks (CNNs) and recurrent neural networks (RNNs), can process complex electrochemical data streams to identify patterns imperceptible through traditional analysis [35].
For electrochemical LoC devices, data interpretation typically involves:
- Signal Processing: Filtering raw voltammetric data to reduce noise while preserving analytical information.
- Feature Extraction: Identifying characteristic peaks, potentials, and current values from voltammograms.
- Multivariate Analysis: Applying principal component analysis (PCA) or partial least squares (PLS) regression to handle complex datasets from multiple sensors.
- Predictive Modeling: Using supervised machine learning to correlate electrochemical signatures with analyte concentrations or disease states.
The following diagram illustrates the integrated data analysis workflow for AI-enhanced LoC systems in pharmaceutical applications:
Figure 1: AI-Enhanced Data Analysis Workflow for Pharmaceutical LoC Systems
Implementation Challenges and Regulatory Considerations
Despite their potential, LoC devices face several implementation challenges in pharmaceutical settings:
Technical and Manufacturing Hurdles
- Scalability and Manufacturing Consistency: Transitioning from lab-scale prototypes to mass production remains challenging. A June 2025 pilot project for a diabetes monitoring LoC in China faced delays due to manufacturing consistency issues and chip stability problems under varying environmental conditions [33].
- Material Limitations: While PDMS remains popular for prototyping, its tendency to absorb hydrophobic molecules limits utility for drug compound analysis [29]. Alternative materials like thermosetting polymers (e.g., epoxy resins) offer better chemical resistance but present fabrication challenges [29].
- System Integration: Seamlessly combining sample preparation, reaction, separation, and detection on a single platform remains technically demanding, particularly for complex pharmaceutical samples.
Regulatory and Validation Requirements
- Regulatory Approval Hurdles: The FDA postponed approval of a LoC-based respiratory infection test panel in July 2025 due to accuracy and cross-reactivity concerns, highlighting the stringent validation requirements for pharmaceutical and diagnostic applications [33].
- Standardization Challenges: The lack of standardized manufacturing protocols and performance validation methods creates barriers for regulatory approval and clinical adoption [29].
- Quality Control: Implementing robust quality control measures for mass-produced LoC devices requires sophisticated monitoring systems and acceptance criteria.
Future Perspectives and Emerging Applications
The future of LoC devices in pharmaceutical settings includes several promising directions:
- Organ-on-Chip Systems: These microfluidic devices simulate human organ functionality, providing more physiologically relevant models for drug toxicity testing and disease modeling [29] [30]. The FDA Modernization Act 2.0 (December 2022) now recognizes organ-on-chip data as valid for drug efficacy and safety assessment, accelerating their pharmaceutical adoption [29].
- Wearable LoC Systems: Continuous monitoring of therapeutic drugs and biomarkers through wearable LoC devices enables real-time pharmacokinetic studies and personalized dosing regimens [35].
- Advanced Materials Integration: Two-dimensional materials like MXenes, transition metal dichalcogenides, and metal-organic frameworks (MOFs) enhance sensor sensitivity and specificity through their unique electrochemical properties and high surface areas [31].
- Decentralized Clinical Trials: LoC devices facilitate remote patient monitoring and sample collection, supporting the trend toward decentralized clinical trials that improve patient access and retention while reducing costs [35].
The following diagram illustrates the strategic implementation framework for LoC devices across pharmaceutical development stages:
Figure 2: LoC Applications Across Pharmaceutical Development Stages
LoC devices represent a transformative technology for pharmaceutical applications, offering the miniaturization, portability, and analytical capabilities required for modern POC testing. The integration of electrochemical detection methods with advanced materials like MIPs and 2D nanomaterials provides the sensitivity and specificity needed for therapeutic drug monitoring and clinical diagnostics.
While challenges remain in manufacturing scalability, regulatory approval, and system integration, the ongoing convergence of LoC technology with AI analytics and advanced materials promises to further enhance their pharmaceutical utility. As these technologies mature, they will increasingly support decentralized clinical trials, personalized medicine approaches, and real-time therapeutic monitoring, fundamentally reshaping pharmaceutical research and patient care.
Advanced Sensing Methodologies and Real-World Pharmaceutical Applications
Electrochemical devices for point-of-care (POC) pharmaceutical analysis represent a paradigm shift in diagnostic technology, offering the potential for rapid, on-site therapeutic drug monitoring and diagnostics. A critical challenge in this field is the development of robust, selective, and stable recognition elements that can function reliably outside controlled laboratory environments. Biomimetic sensors, which utilize synthetic materials that mimic biological recognition systems, have emerged as promising solutions to this challenge. Among these, molecularly imprinted polymers (MIPs) have garnered significant attention as artificial receptors capable of replacing natural antibodies and enzymes in biosensing platforms [36] [28].
MIPs are synthetic polymers possessing specific recognition sites complementary to target molecules in shape, size, and functional groups. These biomimetic recognition elements offer exceptional stability, cost-effectiveness, and resistance to harsh environmental conditions compared to their biological counterparts [36]. When integrated with electrochemical transducers, MIP-based sensors combine specific recognition capabilities with the high sensitivity, portability, and rapid response of electrochemical detection methods [28]. This combination is particularly advantageous for POC pharmaceutical analysis, where it enables the selective quantification of target analytes in complex biological matrices without extensive sample preparation.
The convergence of MIP technology with nanomaterials has further accelerated the development of high-performance biomimetic sensors [37] [38]. Nanomaterials provide enhanced surface area, improved electrical conductivity, and the ability to amplify electrochemical signals, thereby addressing key limitations in traditional sensor design [39]. This application note explores the fundamental principles, fabrication protocols, and analytical applications of MIP-based biomimetic sensors, with a specific focus on their implementation in electrochemical devices for pharmaceutical analysis at the point of care.
Fundamental Principles and Sensing Mechanisms
Molecular Imprinting Technology
Molecular imprinting creates template-specific recognition sites in synthetic polymers through a process often described as "lock and key" methodology. The fundamental process involves: (1) complex formation between template molecules and functional monomers through covalent, non-covalent, or metal-ion mediated interactions; (2) polymerization with cross-linking monomers in the presence of an initiator to form a rigid polymer network; (3) template extraction to leave behind complementary cavities; and (4) recognition and rebinding of the target analyte to these cavities [36]. The selectivity of MIPs arises from the memory effect, where the three-dimensional functional matrix maintains its geometry and organization, guaranteeing the ability to rebind the target molecule with high specificity [36].
Non-covalent imprinting, which relies on electrostatic interactions, hydrogen bonding, or hydrophobic effects, is the most widely used approach due to its simplicity and versatility [36]. The binding strength of non-covalent interactions established between the template and monomers is crucial to obtaining the imprinting outcome, particularly in aqueous solutions where these interactions can be weakened [36].
Electrochemical Transduction Mechanisms
Electrochemical MIP sensors transduce the binding event between the target analyte and the imprinted cavities into a quantifiable electrical signal. The most common electrochemical detection techniques include:
- Amperometry: Measures current resulting from oxidation/reduction reactions at a constant potential, with the current directly correlating to analyte concentration [40].
- Potentiometry: Monitors potential or charge accumulation at zero current [41].
- Impedance Spectroscopy: Measures both resistance and reactance to characterize the electrical properties of the electrode-solution interface [41].
- Voltammetric Methods (including Differential Pulse Voltammetry): Apply potential scans and measure resulting currents, providing information about redox processes [42].
The "gate effect" is a frequently used sensing mechanism in MIP-based electrochemical sensors, where template binding induces morphological changes in the polymer that control the permeability of redox markers to the electrode surface [42]. Recent innovations include electro-responsive MIP nanoparticles (e-MIPs) tagged with redox probes, which combine both recognition and reporting functions, replacing traditional enzyme-mediator pairs used in biosensors [42].
Applications in Pharmaceutical Analysis
MIP-based electrochemical sensors have demonstrated exceptional performance in detecting pharmaceuticals and biomarkers relevant to therapeutic drug monitoring and clinical diagnostics. The following table summarizes the analytical performance of selected MIP-based sensors for pharmaceutical compounds:
Table 1: Performance of MIP-based Electrochemical Sensors for Pharmaceutical Analysis
| Target Analyte | Sensor Type | Linear Range | Limit of Detection | Detection Technique | Application Context |
|---|---|---|---|---|---|
| Paracetamol | e-MIP nanoparticles | 100-1000 µM | 82 µM | Differential Pulse Voltammetry | Pharmaceutical dosage monitoring |
| THC (Tetrahydrocannabinol) | e-MIP nanoparticles | - | - | Differential Pulse Voltammetry | Forensic analysis |
| Vancomycin | NanoMIPs in Nafion | - | - | Voltammetry | Therapeutic drug monitoring |
| Cocaine | NanoMIPs in PVC matrix | - | - | Potentiometry | Forensic and clinical testing |
| CA 15-3 (Cancer Biomarker) | Poly(toluidine blue) MIP | - | - | Amperometry | Breast cancer diagnostics |
| Trypsin | e-MIP nanoparticles | - | - | Differential Pulse Voltammetry | Disease biomarker detection |
The generic nature of MIP technology enables the development of sensors for diverse targets, including small molecule drugs, biomarkers, and enzymes, using similar fabrication protocols by simply replacing the template molecule during synthesis [42]. This versatility is particularly valuable for pharmaceutical applications where monitoring multiple analytes may be required.
Point-of-Care Integration
The integration of MIP-based sensors into POC devices addresses critical needs in modern healthcare by enabling decentralized testing without traditional laboratory infrastructure. According to WHO criteria, ideal POC tests should be affordable, sensitive, specific, user-friendly, rapid, robust, and equipment-free [28]. MIP-based sensors align well with these requirements due to their stability, low cost, and compatibility with miniaturized detection systems.
Lab-on-a-chip (LOC) technology further enhances the POC capabilities of MIP sensors by integrating multiple laboratory functions into miniaturized platforms. These systems combine biosensors, microfluidics, electronics, and optics to create portable diagnostic devices capable of analyzing complex samples with minimal user intervention [28]. The exceptional stability of MIPs compared to biological recognition elements makes them particularly suitable for LOC applications, where consistent performance under varying storage and operational conditions is essential.
Experimental Protocols
Solid-Phase Synthesis of Molecularly Imprinted Polymer Nanoparticles
This protocol describes the synthesis of pseudo-monoclonal MIP nanoparticles (nanoMIPs) using solid-phase synthesis, which yields high-affinity recognition elements suitable for electrochemical sensing [42].
Table 2: Required Reagents and Materials for NanoMIP Synthesis
| Reagent/Material | Specification | Function in Protocol |
|---|---|---|
| Template molecules | Pharmaceutical compound of interest | Creates specific recognition cavities |
| Functional monomers | Methacrylic acid, acrylamide, etc. | Interacts with template via functional groups |
| Cross-linker | Ethylene glycol dimethacrylate (EGDMA) | Creates rigid polymer network |
| Initiator | Azobisisobutyronitrile (AIBN) | Initiates polymerization reaction |
| Solvent | Acetonitrile, toluene, or water | Reaction medium |
| Solid support | Glass beads with immobilized template | Template immobilization for solid-phase synthesis |
| Polymerizable ferrocene derivative | Vinyl-ferrocene | Redox reporter for electroactive MIPs (e-MIPs) |
| Elution solution | Acetonitrile:water (90:10) | Extraction of high-affinity nanoparticles |
Procedure:
Immobilize the template on a solid support (e.g., glass beads) using appropriate conjugation chemistry based on the functional groups available on the template molecule.
Prepare the monomer mixture containing functional monomers, cross-linker, and initiator in the selected solvent. For electroactive MIPs (e-MIPs), include a polymerizable ferrocene derivative (e.g., vinyl-ferrocene) at this stage [42].
Add the monomer mixture to the template-immobilized solid support and initiate polymerization under controlled temperature (typically 60°C) and inert atmosphere for 12-24 hours.
Extract high-affinity nanoparticles by eluting at elevated temperature (50°C) with a suitable solvent mixture (e.g., acetonitrile:water, 90:10). This step selectively removes high-affinity nanoparticles from the solid phase.
Concentrate and characterize the eluted nanoMIPs by dynamic light scattering for size distribution and scanning electron microscopy for morphological analysis.
Verify template removal using appropriate analytical methods (e.g., HPLC, spectrophotometry) to ensure complete extraction of the template molecules.
This solid-phase synthesis approach yields nanoMIPs with diameters typically around 200-300 nm, which exhibit enhanced binding kinetics due to their high surface area-to-volume ratio [42].
Sensor Fabrication and Electrode Modification
This protocol describes the fabrication of electrochemical sensors by immobilizing MIP nanoparticles onto electrode surfaces, with specific reference to screen-printed gold electrodes (SPGE) as a representative platform.
Procedure:
Electrode pretreatment: Clean SPGEs by cycling in 0.5 M H₂SO₄ solution from 0 to +1.5 V until a stable voltammogram is obtained. Rinse thoroughly with deionized water.
Form self-assembled monolayer: Incubate the gold electrode surface with alkanethiol solution (e.g., 11-mercaptoundecanoic acid, 2 mM in ethanol) for 12 hours to form a carboxyl-terminated self-assembled monolayer [42].
Activate carboxyl groups: Treat the modified electrode with a solution of EDC (1-ethyl-3-(3-dimethylaminopropyl)carbodiimide) and sulfo-NHS (N-hydroxysuccinimide) in MES buffer (pH 5.0) for 30 minutes to activate the carboxyl groups for covalent coupling [42] [39].
Immobilize MIP nanoparticles: Incubate the activated electrode with nanoMIP solution (typically 1-2 mg/mL in appropriate buffer) for 2-4 hours, allowing covalent amide bond formation between the activated carboxyl groups and amino groups on the nanoparticle surface.
Block remaining active sites: Treat the modified electrode with ethanolamine solution (100 mM, pH 8.5) for 30 minutes to block any remaining activated carboxyl groups and minimize non-specific binding.
Wash and characterize: Rinse the finished sensor thoroughly with buffer solution and characterize using electrochemical impedance spectroscopy and cyclic voltammetry to verify successful modification.
The following diagram illustrates the complete workflow for MIP-based electrochemical sensor fabrication:
Analytical Measurement and Data Acquisition
This protocol outlines the procedure for using MIP-based electrochemical sensors to quantify target analytes in pharmaceutical samples, with specific reference to differential pulse voltammetry (DPV) as the detection method.
Procedure:
Sensor conditioning: Pre-condition the MIP-modified electrode by incubating in the measurement buffer for 15-30 minutes to stabilize the polymer matrix.
Standard curve preparation: Prepare a series of standard solutions containing known concentrations of the target analyte in appropriate buffer or simulated biological matrix.
Measurement procedure:
- Incubate the sensor with standard or sample solution for a fixed time (typically 5-15 minutes) under controlled temperature and stirring conditions.
- Rinse the sensor gently with buffer to remove unbound molecules.
- Transfer to electrochemical cell containing clean measurement buffer.
- Record DPV measurements using parameters optimized for the specific redox system (typically from -0.2 to +0.6 V with pulse amplitude of 50 mV and pulse width of 50 ms for ferrocene-based systems) [42].
Data analysis:
- Measure peak current values for each standard and sample.
- Construct a calibration curve by plotting peak current versus analyte concentration.
- Determine unknown concentrations from the calibration curve using appropriate regression analysis.
Sensor regeneration (optional): For reusable sensors, regenerate the recognition sites by washing with an appropriate regeneration solution (e.g., acetonitrile:acetic acid mixture) that disrupts template-polymer binding without damaging the imprinted cavities.
Research Reagent Solutions and Materials
The successful development and implementation of MIP-based electrochemical sensors requires specific reagents and materials optimized for biomimetic recognition and electrochemical detection. The following table details essential research reagent solutions for this field:
Table 3: Essential Research Reagents for MIP-Based Electrochemical Sensor Development
| Reagent Category | Specific Examples | Function and Application Notes |
|---|---|---|
| Functional monomers | Methacrylic acid, acrylamide, vinylpyridine | Establish interactions with template; methacrylic acid offers hydrogen bonding capability |
| Cross-linking agents | Ethylene glycol dimethacrylate (EGDMA), trimethylolpropane trimethacrylate (TRIM) | Create rigid polymer network; control porosity and stability |
| Initiation systems | Azobisisobutyronitrile (AIBN), ammonium persulfate (APS) with TEMED | Generate free radicals for polymerization under thermal or redox initiation |
| Solvents for imprinting | Acetonitrile, chloroform, dimethylformamide, water | Create optimal environment for template-monomer complex formation |
| Electrode materials | Screen-printed gold/carbon electrodes, glassy carbon, indium tin oxide (ITO) | Transducer platforms; screen-printed electrodes ideal for POC devices |
| Surface modification reagents | Alkanethiols (e.g., 11-mercaptoundecanoic acid), silanes (e.g., APTES) | Create functional interfaces for MIP immobilization on electrodes |
| Coupling agents | EDC/NHS, glutaraldehyde | Facilitate covalent immobilization of MIPs to transducer surfaces |
| Redox probes | Ferrocene derivatives, potassium ferricyanide, methylene blue | Generate electrochemical signals; can be integrated into MIP structure |
Signaling Mechanisms and Sensor Operation
The operational mechanism of electroactive MIP-based sensors involves conformational changes in the polymer matrix upon target binding, which directly affects the electron transfer efficiency of incorporated redox probes. The following diagram illustrates this signaling mechanism:
In this mechanism, the binding of the target analyte to the imprinted cavities induces swelling or conformational changes in the polymer matrix, which affects the density and accessibility of ferrocene moieties exposed on the nanoparticle surface [42]. This change in redox probe accessibility directly modulates the electron transfer efficiency between the nanoparticles and the electrode surface, generating a concentration-dependent electrochemical signal that can be quantified using voltammetric techniques.
Biomimetic sensors based on molecularly imprinted polymers represent a transformative technology for electrochemical point-of-care pharmaceutical analysis. The protocols and applications detailed in this document demonstrate the robust nature of MIPs as recognition elements that combine the specificity of biological receptors with the stability of synthetic materials. The integration of these biomimetic recognition elements with nanomaterial-enhanced electrochemical transducers creates sensing platforms capable of precise, rapid, and reliable analysis of pharmaceutical compounds in settings ranging from clinical laboratories to resource-limited environments.
The continued advancement of this technology will likely focus on enhancing multiplexing capabilities, further miniaturizing sensor platforms, and expanding the range of detectable analytes relevant to therapeutic drug monitoring and personalized medicine. As these developments progress, MIP-based electrochemical sensors are poised to play an increasingly important role in the evolving landscape of point-of-care pharmaceutical analysis.
Aptamer-Based Electrochemical Assays for High-Specificity Drug and Biomarker Detection
Aptamer-based electrochemical biosensors (AEBs) represent a transformative platform in the field of point-of-care pharmaceutical analysis, merging the molecular recognition capabilities of nucleic acid aptamers with the sensitivity and practicality of electrochemical transduction. These sensors utilize single-stranded DNA or RNA oligonucleotides, selected through the Systematic Evolution of Ligands by Exponential Enrichment (SELEX) process, as biorecognition elements that undergo binding-induced conformational changes upon interaction with specific targets [43] [44]. This molecular recognition event is subsequently converted into a quantifiable electrical signal through various electrochemical techniques, including voltammetry, amperometry, and electrochemical impedance spectroscopy [41] [45]. The significance of AEBs within point-of-care diagnostics stems from their exceptional attributes: high specificity and affinity comparable to antibodies, combined with superior stability, ease of chemical modification, and cost-effective production [44] [45]. Furthermore, their compatibility with miniaturized portable instrumentation positions them as ideal candidates for decentralized clinical testing, therapeutic drug monitoring, and personalized medicine applications [43] [46].
The operational principle of these sensors typically involves the immobilization of an aptamer sequence onto an electrode surface, often modified with a redox reporter such as methylene blue or ferrocene. Upon target binding, the aptamer undergoes a structural reorganization that alters the electron transfer efficiency between the redox tag and the electrode surface, resulting in a measurable signal change [43]. This "signal-on" or "signal-off" mechanism enables quantitative detection of targets ranging from small molecule drugs to protein biomarkers directly in complex biological matrices like blood, serum, and urine [43] [12]. Recent advancements have further enhanced AEB performance through integration with functional nanomaterials including gold nanoparticles, carbon nanotubes, graphene oxide, and metal-organic frameworks, which improve electron transfer kinetics, increase surface area for aptamer immobilization, and provide signal amplification pathways [47] [45]. The subsequent sections of this application note detail specific implementations, quantitative performance metrics, and standardized protocols to facilitate the adoption of these powerful analytical tools in pharmaceutical research and development.
Application Examples and Performance Data
Aptamer-based electrochemical sensors have demonstrated exceptional performance across diverse pharmaceutical applications, from therapeutic drug monitoring to biomarker detection. The following examples illustrate the versatility and analytical capabilities of these platforms in real-world scenarios.
Therapeutic Drug Monitoring of Vancomycin: The narrow therapeutic window of vancomycin, a critical glycopeptide antibiotic, necessitates careful plasma concentration monitoring to avoid both nephrotoxicity (at high levels) and therapeutic failure (at low levels). Traditional monitoring relies on infrequent venous blood draws analyzed via immunoassays or LC-MS, resulting in delayed dose adjustments [43]. An electrochemical aptamer-based (E-AB) sensor addressing this limitation was developed using a DNA aptamer selected against vancomycin with a dissociation constant (K_D) of approximately 0.1 μM. When configured into an E-AB platform, a truncated version of this aptamer exhibited a 120% signal change upon target saturation and completely equilibrated within 9 seconds in undiluted, flowing whole blood [43]. This sensor successfully quantified vancomycin across the clinically relevant range (6–35 μM) directly in 100 μL finger-prick blood samples, enabling calibration-free measurements accurate to within ±20% of the actual concentration [43]. Most impressively, when deployed in vivo in rat models, the sensor provided 9-second-resolved pharmacokinetic profiles and enabled closed-loop feedback control over plasma drug levels, demonstrating the potential for real-time personalized dosing [43].
Malaria Biomarker Detection: Beyond therapeutic drugs, AEBs show significant promise for infectious disease diagnosis. A representative example is a sensor developed for Plasmodium falciparum lactate dehydrogenase (PfLDH), a key malaria biomarker [48]. This sensor employed a specific DNA aptamer immobilized on a screen-printed carbon electrode, achieving detection in whole blood with minimal sample preparation. While specific performance metrics for this sensor were truncated in the available content, the development pathway highlights the applicability of AEBs for rapid, sensitive pathogen detection at the point of care, which is particularly valuable in resource-limited settings where diseases like malaria are endemic [48].
Table 1: Performance Comparison of Selected Aptamer-Based Electrochemical Sensors
| Target Analyte | Sensor Platform | Detection Technique | Linear Range | Limit of Detection (LOD) | Sample Matrix | Reference |
|---|---|---|---|---|---|---|
| Vancomycin | E-AB Sensor | Square-Wave Voltammetry | 6-35 μM | Not Specified | Whole Blood (undiluted) | [43] |
| Methdilazine Hydrochloride | poly-EBT/CPE | SWV | 0.1-50 μM | 25.7 nM | Human Urine, Syrup | [12] |
| Ketoconazole | Ce-BTC MOF/IL/CPE | DPV, CV | 0.1-110.0 μM | 0.04 μM | Pharmaceutical, Urine | [12] |
| Tetracycline | Competitive ELAA | Optical Readout | 31.6 nM - 316 μM | 21 nM | Milk | [44] |
| Sulfamethoxazole | Fe3O4/ZIF-67 /ILCPE | DPV | 0.01-520.0 μM | 5.0 nM | Urine, Water | [12] |
Table 2: Advantages and Limitations of Aptamer-Based Electrochemical Assays
| Advantage | Explanation | Impact on Pharmaceutical Analysis |
|---|---|---|
| High Specificity | Aptamers fold into unique 3D structures for precise target recognition | Reduces false positives/negatives in complex biological samples |
| Rapid Response | Fast binding kinetics and direct electrochemical transduction | Enables real-time therapeutic drug monitoring and rapid diagnostics (seconds to minutes) |
| Label-free & Calibration-free Operation | Possible with certain E-AB designs using signal normalization | Simplifies workflow, facilitates use in point-of-care settings [43] |
| Reusability & Stability | Aptamers are thermally stable and can undergo renaturation | Lower cost per test compared to antibody-based assays |
| Miniaturization Potential | Compatibility with microfabrication and screen-printing technologies | Enables development of portable, wearable, and implantable sensors |
| Challenge | Explanation | Current Mitigation Strategies |
| Matrix Effects | Complex biofluids can cause nonspecific binding or signal interference | Sample dilution, surface passivation, drift correction algorithms (e.g., KDM [43]) |
| Aptamer Degradation | Susceptibility to nuclease degradation in biological samples | Use of chemically modified nucleotides (e.g., 2'-F, 2'-O-methyl, LNA) [45] |
| Signal Drift | Gradual change in baseline signal during prolonged use | Kinetic differential measurements, reference electrodes, periodic calibration |
| Limited Shelf Life | Degradation of sensor components over time | Improved immobilization chemistries, stable packaging materials |
| Regulatory Hurdles | Stringent validation requirements for clinical devices | Rigorous performance testing in intended use matrices, standardization of manufacturing |
Detailed Experimental Protocols
Protocol 1: Fabrication of a Vancomycin-Detecting E-AB Sensor
This protocol details the construction of an electrochemical aptamer-based sensor for vancomycin monitoring in biological samples, adapted from published procedures [43].
Principle: A vancomycin-specific DNA aptamer, modified with a redox reporter (methylene blue) at its 3' end and a thiol group at its 5' end, is self-assembled onto a gold wire electrode. Binding of vancomycin induces a conformational change in the aptamer, altering the electron transfer efficiency between the methylene blue and the electrode surface, which is detected via square-wave voltammetry.
Materials:
- Aptamer Sequence: Thiol-modified 5'-/ThioMC6-D/XXXXXXX-3'-MB, where XXXXXXX represents the vancomycin-binding sequence (exact sequence available in [43] supplementary information)
- Electrodes: Gold wire working electrode (diameter: 250 μm), Pt wire counter electrode, Ag/AgCl reference electrode
- Chemical Reagents: 6-Mercapto-1-hexanol (MCH), Tris-EDTA buffer, potassium phosphate buffer, vancomycin standard
- Equipment: Potentiostat, flow cell system, square-wave voltammetry capability
Procedure:
- Electrode Pretreatment: Clean the gold wire electrode by cycling in 0.5 M H₂SO₄ (-0.3 to +1.5 V vs. Ag/AgCl) until a stable cyclic voltammogram is obtained. Rinse thoroughly with deionized water.
- Aptamer Immobilization: Incubate the pretreated electrode in 1 μM thiolated aptamer solution in Tris-EDTA buffer for 1 hour at room temperature to form a self-assembled monolayer.
- Surface Passivation: Treat the aptamer-modified electrode with 1 mM MCH solution for 15 minutes to displace non-specifically adsorbed aptamers and create a well-ordered monolayer resistant to nonspecific binding.
- Sensor Conditioning: Place the functionalized electrode in a flow cell and condition with relevant biological buffer (e.g., artificial serum or phosphate-buffered saline) until a stable square-wave voltammetry signal is achieved.
- Measurement: Perform square-wave voltammetry measurements in buffer or flowing whole blood. Acquire voltammograms at multiple frequencies (e.g., 10-1000 Hz). The change in peak current is proportional to vancomycin concentration.
- Data Analysis: Use the kinetic differential method (KDM) for drift correction by taking the difference between sensor responses measured at two different square-wave frequencies [43].
Technical Notes:
- Sensor regenerability: The sensor can typically be regenerated with a mild denaturant wash for multiple uses.
- For calibration-free operation, utilize the strong frequency dependence of E-AB signaling to produce a "nonresponsive" current that corrects for sensor-to-sensor variation [43].
- The truncated aptamer version (4 base pairs removed from stem) provides optimal binding-induced conformational change.
Protocol 2: Competitive Enzyme-Linked Aptamer Assay (ELAA) for Tetracycline Detection
This protocol describes a competitive assay format for detection of small molecules like tetracycline in complex matrices such as milk [44].
Principle: Biotinylated aptamer is immobilized on a neutravidin-coated microplate. Tetracycline in the sample competes with tetracycline-enzyme conjugate (TC-HRP) for binding sites on the aptamer. After washing, substrate is added, and the resulting signal is inversely proportional to the tetracycline concentration in the sample.
Materials:
- Aptamer: 76-mer DNA aptamer with 3'-biotin modification
- Assay Reagents: Neutravidin, tetracycline-HRP conjugate, tetracycline standards, TMB substrate, stop solution
- Buffers: Coating buffer (e.g., carbonate-bicarbonate, pH 9.6), assay/wash buffer (McIlvaine buffer with Na₂EDTA)
- Equipment: Microplate reader, microplate washer
Procedure:
- Plate Coating: Coat microplate wells with 100 μL neutravidin solution (0.5 μg/mL in coating buffer) overnight at 4°C.
- Plate Blocking: Wash wells 3 times with wash buffer and block with 200 μL of 1% BSA for 1 hour at room temperature.
- Aptamer Immobilization: Add 100 μL of biotinylated aptamer (0.0188 μg/mL in assay buffer) to each well and incubate for 1 hour at room temperature.
- Competitive Binding: Add 50 μL of standard or sample followed by 50 μL of TC-HRP (0.5 μg/mL) to each well. Incubate for 1 hour at room temperature.
- Detection: Wash wells 5 times with wash buffer. Add 100 μL TMB substrate and incubate for 15-30 minutes in the dark.
- Signal Measurement: Stop the reaction with 50 μL stop solution (e.g., 1 M H₂SO₄) and measure absorbance at 450 nm.
Technical Notes:
- Optimal assay conditions for this aptamer were obtained without monovalent ions (Na⁺) and without Mg²⁺ ion in the assay buffer [44].
- Thermal denaturation (heating at 95°C for 10 min followed by rapid cooling) of the DNA aptamer before immobilization may improve consistency.
- The average R.S.D. across the standard curve should be less than 2.5% with recoveries around 101.8% from milk media [44].
The Scientist's Toolkit: Research Reagent Solutions
Table 3: Essential Research Reagents for Aptamer-Based Electrochemical Assay Development
| Reagent Category | Specific Examples | Function in Assay Development | Key Considerations |
|---|---|---|---|
| Aptamer Sequences | Vancomycin DNA aptamer [43]; Tetracycline DNA/RNA aptamers [44] | Target recognition element | Select based on affinity (K_D), specificity, and conformational change upon binding |
| Electrode Materials | Gold wire; Screen-printed carbon electrodes (SPCE); Glassy carbon electrodes (GCE) | Signal transduction platform | Choose based on required sensitivity, cost, and disposability needs |
| Surface Modification Reagents | Thiol linkers (e.g., MCH); Biotin-Neutravidin system; Carbodiimide crosslinkers | Aptamer immobilization | Critical for controlling probe orientation and density; minimizes nonspecific binding |
| Redox Reporters | Methylene Blue; Ferrocene; Hexaammineruthenium(III) chloride | Electron transfer mediators | Select based on redox potential and compatibility with biological matrices |
| Nanomaterial Enhancers | Gold nanoparticles (AuNPs); Carbon nanotubes (CNTs); Graphene oxide | Signal amplification | Improve electron transfer kinetics and increase surface area for probe immobilization [47] [45] |
| Blocking Agents | Bovine Serum Albumin (BSA); Casein; Salmon Sperm DNA | Minimize nonspecific binding | Essential for assays in complex matrices like blood, serum, or milk |
| Buffer Components | Tris-EDTA; Phosphate buffers; McIlvaine buffer (for tetracycline) | Maintain optimal assay conditions | Ionic strength and composition can significantly impact aptamer folding and binding [44] |
Visual Workflows and Signaling Mechanisms
The following diagrams illustrate key operational principles and experimental workflows for aptamer-based electrochemical assays.
E-AB Sensor Signaling Mechanism
Competitive ELAA Workflow
Therapeutic Drug Monitoring and Pharmacokinetic Studies in Biological Fluids
Therapeutic Drug Monitoring (TDM) is a critical component of personalized medicine, enabling dose optimization to maximize therapeutic efficacy while minimizing adverse effects [49]. Traditionally reliant on invasive blood sampling and centralized laboratory analysis using techniques like Liquid Chromatography with tandem Mass Spectrometry (LC-MS/MS) [50], TDM is undergoing a transformative shift. The field is moving toward point-of-care (POC) testing, driven by advancements in electrochemical sensors and biosensors [51] [12]. These devices offer a compelling alternative: rapid, cost-effective analysis with the potential for miniaturization and portability, facilitating real-time drug monitoring in various biological fluids [52] [49]. This protocol details the application of these advanced electrochemical devices for pharmaceutical analysis in a research context, framing them within the broader thesis of developing next-generation POC diagnostic tools.
Application Notes
Current Landscape and Technological Need
Conventional TDM practice is a multi-day process involving clinic sampling, centralized lab analysis, and delayed result reporting, which hinders the ability to make prompt dose adjustments [49]. This is particularly problematic for drugs with narrow therapeutic windows or variable pharmacokinetics, such as antiseizure medications, antibiotics, and biologics [49] [53]. Electrochemical sensors address these limitations by providing a platform for rapid, decentralized analysis. Their advantages include high sensitivity, low cost, minimal sample volume requirements, and compatibility with complex matrices like serum, saliva, and urine [12] [2] [49]. The market for POC testing, which includes these electrochemical platforms, shows a positive growth trend, underscoring the clinical demand for such technologies [52].
Key Challenges in Biofluid Analysis
A primary challenge for electrochemical sensing in biological fluids is matrix complexity. Biofluids such as blood, serum, and saliva contain numerous interfering components (proteins, salts, cells) that can foul electrode surfaces, increase background noise, and reduce analyte signal, compromising sensor accuracy and reliability [49]. To combat this, research focuses on two key strategies:
- Electrode Modification and Signal Amplification: Using nanostructured materials to increase the electroactive surface area and enhance electron transfer.
- Electrode Passivation: Employing coatings to minimize non-specific adsorption of interfering species (fouling) [49].
The Promise of Point-of-Care Monitoring
The integration of electrochemical sensors into POC devices promises to revolutionize TDM by enabling frequent, multi-timepoint monitoring at or near the patient [52]. This facilitates a closed-loop, personalized TDM cycle (Figure 1), allowing for dose individualization based on a patient's unique pharmacokinetic profile. The use of non-invasive or minimally invasive biofluids like saliva, sweat, and urine further enhances patient compliance and enables richer pharmacokinetic data sets [54] [49].
Experimental Protocols
Protocol 1: Fabrication of a Modified Carbon Paste Electrode for Drug Detection
This protocol describes the preparation of a carbon paste electrode (CPE) modified with multi-walled carbon nanotubes (MWCNTs) for the sensitive detection of ofloxacin in urine, based on methodologies from recent literature [12]. CPEs are widely used due to their large electroactive surface area, low cost, and ease of modification.
3.1.1 Materials
- Graphite powder
- Paraffin oil
- Multi-walled carbon nanotubes (MWCNTs)
- Nitric acid (HNO₃) and Sulfuric acid (H₂SO₄) for MWCNT functionalization
- Ofloxacin standard
- Phosphate buffer saline (PBS, 0.1 M, pH 7.4) as supporting electrolyte
- Mortar and pestle
- Electrochemical cell (e.g., 10 mL vial)
- Potentiostat/Galvanostat
3.1.2 Procedure
- Functionalization of MWCNTs: To increase surface oxygen-containing groups (-COOH, -OH) and improve dispersion, treat MWCNTs with a 3:1 (v/v) mixture of H₂SO₄ and HNO₃ for 4-6 hours under sonication. Afterwards, wash thoroughly with deionized water until neutral pH is achieved and dry in an oven at 60°C [12].
- Fabrication of MWCNT-Modified CPE: In a mortar, thoroughly mix 70% graphite powder, 20% functionalized MWCNTs, and 10% paraffin oil (w/w) until a homogeneous paste is formed. Pack the resulting paste firmly into a suitable electrode body (e.g., a Teflon sleeve with an electrical contact). Smooth the surface against a clean paper sheet to ensure a flat, shiny finish [12].
- Electrochemical Measurement:
- Prepare ofloxacin standards in PBS and/or synthetic urine in the concentration range of 0.60 to 15.0 nM.
- Place the modified electrode into the electrochemical cell containing the analyte solution along with a platinum wire counter electrode and an Ag/AgCl reference electrode.
- Perform Square-Wave Voltammetry (SWV) using the following typical parameters: potential range from 0.2 to 1.2 V (vs. Ag/AgCl), frequency of 15 Hz, amplitude of 25 mV, and step potential of 5 mV.
- Record the oxidation peak current of ofloxacin. The current is proportional to the concentration of the analyte [12].
3.1.4 Validation
- Sensitivity and Limit of Detection (LOD): This specific method achieved an exceptionally low LOD of 0.18 nM for ofloxacin [12].
- Selectivity: Evaluate potential interference from common metabolites or structurally similar drugs by adding them to the analyte solution and observing signal change.
- Reproducibility: Fabricate and test at least three independent electrodes to calculate the relative standard deviation (RSD) of the sensor response.
Protocol 2: Electrochemical Detection of Antibiotics in Serum
This protocol outlines a general approach for detecting antibiotics like ketoconazole in serum using a modified electrode, adapted from recent sensor designs [12]. Analysis in serum is challenging due to high protein content, necessitating robust electrode modification.
3.2.1 Materials
- Cerium-based Metal-Organic Framework (Ce-BTC MOF)
- Ionic Liquid (IL)
- Graphite powder and paraffin oil (for CPE base)
- Ketoconazole standard
- Drug-free human serum
- Acetonitrile (for protein precipitation)
- Centrifuge
- Electrochemical cell and Potentiostat
3.2.2 Procedure
- Sensor Fabrication (Ce-BTC MOF/IL/CPE): Prepare a carbon paste by mixing graphite powder, Ce-BTC MOF, and Ionic Liquid in a 68:30:2 (w/w/w) ratio with paraffin oil. Pack into an electrode body as in Protocol 1 [12].
- Sample Pre-treatment (Protein Precipitation): To mitigate fouling, mix 100 µL of serum sample with 300 µL of acetonitrile. Vortex for 1 minute and centrifuge at 10,000 rpm for 10 minutes. Collect the clear supernatant and dilute it 1:1 with PBS (0.1 M, pH 7.4) before analysis [49].
- Electrochemical Detection:
- Transfer the prepared sample to the electrochemical cell.
- Using the Ce-BTC MOF/IL/CPE, perform Differential Pulse Voltammetry (DPV) with parameters optimized for ketoconazole: potential range 0.4 to 1.0 V, modulation amplitude 50 mV, step potential 5 mV, and modulation time 50 ms.
- The oxidation peak current is measured for quantification [12].
3.2.3 Validation
- Calibration: A calibration curve for ketoconazole in processed serum showed a linear range of 0.1–110.0 µM with an LOD of 0.04 µM and a sensitivity of 0.1342 µA µM⁻¹ [12].
- Recovery Test: Spike drug-free serum with known concentrations of ketoconazole (low, medium, high). The accuracy is confirmed if the measured concentration, calculated from the calibration curve, is within ±15% of the spiked value.
- Stability: The stability of the modified electrode can be assessed by measuring its response to a standard solution over a period of 2-4 weeks.
Data Presentation
Performance of Selected Electrochemical Sensors for TDM
Table 1: Performance metrics of recently reported electrochemical sensors for pharmaceutical drug detection.
| Electrode / Modification | Analyte (Matrix) | Method | Linear Dynamic Range | Limit of Detection (LOD) | Ref |
|---|---|---|---|---|---|
| poly(EBT)/CPE | Methdilazine HCl (Urine, Syrup) | SWV | 0.1 - 50 µM | 0.0257 µM | [12] |
| [10%FG/5%MW] CPE | Ofloxacin (Urine, Tablets) | SW-AdAS | 0.60 - 15.0 nM | 0.18 nM | [12] |
| Ce-BTC MOF/IL/CPE | Ketoconazole (Pharmaceutical, Urine) | DPV | 0.1 - 110.0 µM | 0.04 µM | [12] |
| AgNPs/CPE | Metronidazole (Milk, Tap Water) | - | 1 - 1000 µM | 0.206 µM | [12] |
| MIP/CP ECL Sensor | Azithromycin (Urine, Serum) | ECL | 0.10 - 400 nM | 0.023 nM | [12] |
Abbreviations: CPE: Carbon Paste Electrode; poly(EBT): poly(Eriochrome Black T); FG: Flake Graphite; MW: Multi-walled Carbon Nanotubes; MOF: Metal-Organic Framework; IL: Ionic Liquid; AgNPs: Silver Nanoparticles; MIP: Molecularly Imprinted Polymer; ECL: Electrochemiluminescence; SWV: Square-Wave Voltammetry; SW-AdAS: Square-Wave Adsorptive Anodic Stripping; DPV: Differential Pulse Voltammetry.
Correlation of Drug Levels in Blood and Alternative Biofluids
Table 2: Suitability of alternative biofluids for TDM based on correlation with blood/serum levels.
| Biofluid | Advantages | Disadvantages | Example Drugs with Good Correlation |
|---|---|---|---|
| Saliva | Non-invasive collection, correlates with free (active) drug concentration in plasma [49]. | Variable pH and viscosity, potential for oral contamination. | Antiseizure medications (e.g., Phenytoin, Carbamazepine) [49] |
| Urine | Non-invasive, readily available in large volumes. | Drug concentrations reflect clearance, not active plasma levels; requires normalization to creatinine. | - |
| Sweat | Continuous, non-invasive secretion. | Low analyte concentration, variable secretion rates, collection can be cumbersome. | - |
| Dried Blood Spots (DBS) | Micro-sampling (<50 µL), stable at room temperature, easy transport [50]. | Hematocrit effect can bias results, requires precise punching. | Beta-lactam antibiotics (Ampicillin) [50] |
The Scientist's Toolkit
Table 3: Essential research reagents and materials for developing electrochemical TDM sensors.
| Item | Function / Application | Example Use Case |
|---|---|---|
| Carbon Paste Electrode (CPE) | A versatile and renewable base electrode with a large electroactive surface area. | Bulk electrode material for creating modified sensors [12]. |
| Multi-walled Carbon Nanotubes (MWCNTs) | Nanomaterial used to modify electrodes; increases surface area and enhances electron transfer, boosting sensitivity. | Signal amplification in ofloxacin detection [12]. |
| Metal-Organic Frameworks (MOFs) | Highly porous crystalline materials used for electrode modification; can pre-concentrate the analyte at the electrode surface. | Used in Ce-BTC MOF/IL/CPE for ketoconazole sensing [12]. |
| Ionic Liquids (ILs) | Salts in liquid state used as binders/modifiers; improve conductivity and stability of composite electrodes. | Component in Ce-BTC MOF/IL/CPE to enhance performance [12]. |
| Molecularly Imprinted Polymers (MIPs) | Synthetic polymers with tailor-made recognition sites for a specific analyte; impart high selectivity to the sensor. | Used in an electrochemiluminescence sensor for azithromycin [12]. |
| Screen-Printed Electrodes (SPEs) | Disposable, planar electrodes mass-produced for single-use; ideal for portable POC devices. | Platform for commercial POC sensor development [12] [49]. |
| Phosphate Buffered Saline (PBS) | A common supporting electrolyte; maintains a stable pH and ionic strength during electrochemical measurement. | Standard medium for preparing analyte solutions and calibration standards [12]. |
Workflow and System Diagrams
Electrochemical POC TDM Workflow
This diagram illustrates the end-to-end process from sample collection to clinical decision, highlighting the role of electrochemical sensors in enabling rapid, point-of-care therapeutic drug monitoring.
Core-Shell Sensor Architecture
This diagram depicts a typical architecture of an advanced electrochemical sensor, showing common modifications to the base electrode that enhance sensitivity and resist fouling in complex biofluids.
Disposable Solid-State Sensors for Drugs of Abuse Screening
Disposable solid-state sensors represent a transformative advancement in the field of point-of-care (POC) pharmaceutical analysis, enabling rapid, on-site screening for drugs of abuse. These sensors are predominantly based on electrochemical detection principles and leverage screen-printing technology to create inexpensive, portable, and user-friendly analytical devices [55] [56]. Their development is largely driven by the need to move analytical capabilities from centralized laboratories to the field, providing results in a timely manner that can lead to immediate intervention in settings such as roadside testing, workplaces, and emergency medical care [55] [57]. The global POC drug abuse testing market, valued at USD 1.47 billion in 2024 and projected to reach USD 2.13 billion by 2032, reflects the significant impact and adoption of these technologies [57]. This application note details the operating principles, experimental protocols, and key applications of these sensors within the broader context of developing electrochemical devices for POC analysis.
Sensor Technologies and Signaling Mechanisms
Disposable solid-state sensors for drug screening primarily utilize electrochemical signaling mechanisms. The core of these sensors is a screen-printed electrode (SPE) system, which typically integrates a working electrode, a reference electrode, and a counter electrode on a single, inert substrate [56]. The working electrode is often fabricated from carbon-based inks, such as graphene, or other materials, and serves as the transduction platform [58].
Table 1: Major Sensor Types for Drug Abuse Screening
| Sensor Type | Working Principle | Key Advantages | Commonly Detected Drugs | Limitations |
|---|---|---|---|---|
| Electrochemical [55] | Measures electrical current/voltage changes from drug-mediated redox reactions. | High sensitivity & specificity, rapid response, portability, quantitative results. | Cocaine, Cannabinoids, MDMA, Methamphetamine [55] [58] | Susceptible to matrix effects; may require surface modification. |
| Optical [55] | Detects changes in light properties (absorbance, fluorescence) upon drug binding. | High sensitivity, potential for multiplexing. | Various drugs of abuse. | Can require sophisticated instrumentation; potential interference. |
| Colorimetric [55] | Relies on visual color change due to a chemical reaction with the target drug. | Simplicity, cost-effectiveness, rapid results. | Amphetamines, Opiates, Cannabinoids [57] | Lower sensitivity and specificity compared to other methods. |
A prominent trend is the integration of advanced materials and recognition elements to enhance sensor performance. For instance, screen-printed graphene electrodes (SPGEs) are gaining traction due to graphene's large specific surface area and outstanding electrical conductivity, which boost sensor sensitivity [58]. Furthermore, Molecularly Imprinted Polymers (MIPs) are artificial receptors that create specific cavities complementary to a target molecule, offering excellent stability and selectivity as alternatives to biological recognition elements like antibodies [28].
The signaling pathway for a mediated electrochemical sensor, used for detecting methamphetamine, is illustrated below.
Diagram Title: Mediated Electrochemical Detection Pathway.
Experimental Protocols
Fabrication of a Screen-Printed Graphene Electrode (SPGE) for MDMA Detection
This protocol is adapted from a study demonstrating a highly sensitive and disposable sensor for 3,4-methylenedioxymethamphetamine (MDMA) [58].
I. Materials and Reagents
- Substrate: Polyester or ceramic slides.
- Conductive Inks: Graphene-based ink for the working and counter electrodes; Ag/AgCl ink for the reference electrode.
- Electrochemical Cell: Portable potentiostat for measurement.
- Chemicals: MDMA standard, phosphate buffer saline (PBS, 0.1 M, pH 7.4), other supporting electrolytes.
II. Procedure
- Design and Stencil Preparation: Create a stencil design that defines the three-electrode layout (working, reference, counter) on the substrate.
- Screen-Printing:
- Place the stencil over the substrate.
- Apply the graphene ink through the stencil to form the working and counter electrodes.
- Cure the ink according to the manufacturer's specifications (e.g., 60°C for 30 minutes).
- Apply the Ag/AgCl ink to form the reference electrode and cure.
- Insulation: Apply an insulating layer to define the exact active surface area of the electrodes and prevent short-circuiting.
- Quality Control: Perform cyclic voltammetry in a standard redox probe (e.g., 1 mM Potassium ferricyanide) to verify electrode functionality and consistency.
Sensor Modification and Detection of Methamphetamine in Saliva
This protocol outlines a mediated approach for detecting methamphetamine directly in undiluted saliva, showcasing application in a complex biological matrix [59].
I. Materials and Reagents
- Sensor: Disposable screen-printed carbon electrode (SPCE).
- Mediator: N,N′-(2-nitro-1,4-phenylene)-dibenzenesulfonamide (OX1006).
- Buffer: Carbonate buffer (0.1 M, pH 10.8).
- Sample: Authentic saliva sample (collected with consent).
- Apparatus: Potentiostat equipped with galvanostatic and square-wave voltammetry functions.
II. Procedure
- Sensor Preparation:
- Prepare a porous overlayer (e.g., a small piece of filter paper or membrane).
- Deposit a precise volume (e.g., 5 µL) of OX1006 mediator solution (1 mg/mL in pH 10.8 buffer) onto the overlayer and allow it to dry completely.
- Secure the dried mediator overlayer over the working electrode of the SPCE.
- Sample Analysis:
- Apply 50 µL of the saliva sample onto the sensor, ensuring the overlayer is fully saturated.
- Allow the mediator to dissolve and diffuse for 10 seconds (open circuit).
- Apply a galvanostatic oxidation step: 800 nA for 5-10 seconds to generate the oxidized form of the mediator.
- Immediately perform a double square-wave voltammetry (SWV) scan, typically from +0.6 V to -0.2 V vs. the onboard reference.
- Record the reduction peak current at around -0.06 V, which is attributed to the reduced form of the mediator-MAMP adduct.
- Data Analysis:
- Quantify the methamphetamine concentration by comparing the reduction peak current to a calibration curve constructed from standard solutions.
Table 2: Key Parameters for Methamphetamine Detection in Saliva [59]
| Parameter | Specification |
|---|---|
| Detection Technique | Galvanostatic Oxidation + Double Square Wave Voltammetry |
| Response Time | ~55 seconds |
| Lower Detection Limit | 400 ng/mL |
| Linear Range | Reported up to 50 µg/mL |
| Sample Volume | 50 µL |
| Sample Matrix | Undiluted saliva |
The Scientist's Toolkit: Essential Research Reagents and Materials
Table 3: Key Reagent Solutions for Sensor Development
| Item Name | Function/Brief Explanation | Example Use Case |
|---|---|---|
| Screen-Printed Graphene Electrodes (SPGEs) [58] | Disposable transduction platform; provides high conductivity and surface area. | Core sensing element for direct electrochemical detection of MDMA. |
| Molecularly Imprinted Polymer (MIP) [28] | Synthetic, stable artificial antibody that confers high selectivity to the sensor. | Coating on SPCEs for selective detection of specific biomarkers or drugs. |
| Mediator (e.g., OX1006) [59] | Electron shuttle that facilitates the indirect detection of non-electroactive analytes. | Enables the detection of methamphetamine via a measurable adduct. |
| Monolithic µ-SPE Sorbent [58] | Porous polymer material for solid-phase extraction; removes interferences and pre-concentrates the analyte. | Integrated into pipette tips for clean-up and enrichment of MDMA from urine before analysis. |
| Portable Potentiostat | Instrument for applying controlled potentials/currents and measuring electrochemical signals. | Essential for all electrochemical measurements in lab and field settings. |
Disposable solid-state sensors are indispensable tools for the rapid and decentralized screening of drugs of abuse. Their utility in forensic, clinical, and public health settings is already significant and continues to grow with technological advancements. Future developments are likely to focus on multiplexing capabilities (detecting multiple drugs simultaneously), integration with smartphone-based readers for data analysis and reporting, and the use of artificial intelligence to interpret complex results and minimize false positives/negatives [57] [28]. Furthermore, the expansion of these testing platforms into emerging markets and their adaptation for continuous monitoring via wearable formats represent the next frontier in POC pharmaceutical analysis [57] [60]. The ongoing refinement of these sensors ensures they will remain at the forefront of efforts to combat substance abuse through swift and accurate detection.
Integration with Microfluidics and Wearable Formats for Continuous Monitoring
The convergence of electrochemical sensing, microfluidic engineering, and flexible electronics is revolutionizing point-of-care (POC) pharmaceutical analysis and therapeutic drug monitoring. These integrated systems enable non-invasive, continuous measurement of biomarkers and drugs directly at the site of patient care, moving beyond traditional single-timepoint laboratory testing [61] [62]. By leveraging miniatured channels for precise fluid handling and wearable conformable platforms for comfortable skin integration, these technologies provide real-time pharmacological data that can inform personalized treatment regimens and dynamic therapeutic interventions [63] [64]. This document outlines key application areas, detailed experimental protocols, and technical considerations for developing and implementing these advanced bioanalytical systems within pharmaceutical research and clinical practice, framed within the broader context of electrochemical device development for POC pharmaceutical analysis.
Application Notes
Integrated microfluidic-electrochemical wearable platforms have demonstrated significant potential across multiple pharmaceutical and clinical application areas. The table below summarizes three key application domains with corresponding technical approaches and validated performance metrics.
Table 1: Application Domains for Wearable Microfluidic- Electrochemical Sensors
| Application Domain | Target Analytes/Biomarkers | Technical Approach | Key Performance Metrics | References |
|---|---|---|---|---|
| Sweat-Based Therapeutic Monitoring & Hydration Management | pH, Chloride, Sodium, Sweat Rate/Loss | Fabric-based microfluidics with integrated electrochemical (PANI/FCC WE, Ag/AgCl RE) and colorimetric sensing arrays | pH sensitivity: 75.15 mV/pH (range 2-9); Chloride: Colorimetric; Continuous wireless operation | [64] [65] |
| Metabolic Disorder & Cystic Fibrosis Diagnostics | Chloride ions (CF diagnosis), Glucose, Lactate | Microfluidic sweat sampling with electrochemical detection; Ag/AgCl electrodes for chloride quantification | CF Diagnostic Range: <40 mM (normal) to >60 mM (CF positive); High correlation with standard clinical assays | [64] |
| Real-Time Hydation & Heat Stress Monitoring | Whole-Body Sweat Loss, Sodium Concentration, Skin Temperature, Thermal Flux | Electrochemical/Biophysical Sensing (EBS) device with impedance-based sweat volume/concentration measurement, haptic feedback | Haptic alerts at 500 mL sweat loss and >2% body weight loss; Operational in 40-65°C, 80-100% humidity | [65] |
Key Technical Advantages
The integration of microfluidics with wearable formats addresses several critical challenges in continuous biochemical monitoring:
- Minimized Evaporation & Contamination: Micro-sized channels enable rapid sampling and efficient fluid transport to sensor surfaces while preventing sweat evaporation and external contamination, even with small sample volumes (microliters) [64] [65].
- Precision Fluid Handling: Laminar flow characteristics at the microscale enable reproducible sample delivery and mixing, while microfluidic architectures prevent sweat re-absorption into the skin, enhancing measurement accuracy [63] [64].
- Multi-Modal Sensing Capability: The combination of electrochemical and colorimetric detection modalities within a single microfluidic platform enables analysis of multiple biomarkers from a single sample collected at one physical location [64].
Experimental Protocols
Protocol: Fabrication of a Textile-Based Microfluidic Wearable Sensor for Sweat pH and Chloride Monitoring
This protocol details the construction of a flexible, fabric-based microfluidic sensor for simultaneous electrochemical pH detection and colorimetric chloride analysis, adapted from published research [64].
Materials and Reagents
Table 2: Essential Research Reagent Solutions and Materials
| Item Name | Function/Application | Specifications/Notes |
|---|---|---|
| Carbon Cloth (CC) | Conductive fabric substrate for working electrode | Bleached and scoured; ~10 µm diameter fibers [64] |
| Aniline Monomer | Electropolymerization to form PANI sensing layer | Purified via distillation prior to use [64] |
| Polyvinyl Butyral (PVB) Membrane | Matrix for solid-state reference electrode (Ag/AgCl) | Provides stable reference potential [64] |
| Polydimethylsiloxane (PDMS) | Microfluidic channel fabrication | Flexible, biocompatible elastomer |
| Silver/Silver Chloride (Ag/AgCl) Ink | Reference electrode formation | Screen-printed or deposited on carbon cloth |
| Sulfuric Acid (H₂SO₄) | Chemical functionalization of carbon cloth | Creates rough surface for improved PANI adhesion [64] |
| Potassium Chloride (KCl) | Electrolyte for electrochemical cell | Analytical grade |
Step-by-Step Procedure
Part A: Functionalization of Carbon Cloth and PANI Working Electrode Fabrication
- Carbon Cloth Pre-Treatment: Cut carbon cloth to desired electrode dimensions (e.g., 10mm x 5mm). Clean ultrasonically in ethanol for 10 minutes, then in deionized water for 10 minutes. Dry at 60°C for 1 hour.
- Acid Functionalization: Immerse the cleaned carbon cloth in 0.5 M H₂SO₄ solution for 4 hours at room temperature to create surface carboxylic acid groups. Rinse thoroughly with deionized water and dry.
- Electropolymerization of PANI: Using a standard three-electrode system (Pt counter electrode, Ag/AgCl reference electrode), immerse the functionalized carbon cloth (working electrode) in a 0.1 M aniline solution prepared in 1.0 M H₂SO₄. Perform cyclic voltammetry between -0.2 V and +0.9 V for 15 cycles at a scan rate of 50 mV/s to deposit the PANI film.
- Electrode Conditioning: Rinse the PANI/FCC electrode with deionized water and cycle in a clean 1.0 M H₂SO₄ solution (10 cycles, same CV parameters) to stabilize the electroactive film.
Part B: Solid-State Reference Electrode (Ag/AgCl@CC) Fabrication
- Silver Deposition: Screen-print or electrodeposit a silver layer onto a separate piece of carbon cloth.
- Chloridation: Anodize the silver layer in a 0.1 M FeCl₃ solution for 30 minutes to form the Ag/AgCl layer.
- PVB Coating: Dip-coat the Ag/AgCl electrode in a 5% w/v solution of PVB in ethanol and allow to dry, forming a stable membrane.
Part C: Microfluidic Device Assembly and Sensor Integration
- PDMS Channel Fabrication: Fabricate a ~240 µm tall microfluidic channel using soft lithography or laser machining of a PDMS slab. Include an inlet port for sweat entry and an exit port.
- Textile Integration: Bond the PDMS microfluidic channel to a treated fabric substrate using oxygen plasma treatment (30 seconds, 100 W) followed by immediate contact and mild heating (70°C for 10 minutes).
- Sensor Embedding: Integrate the PANI/FCC working electrode and Ag/AgCl@CC reference electrode at the base of the microfluidic channel, ensuring direct contact with the fluidic path.
- Electronic Interfacing: Connect the electrodes to a reusable flexible printed circuit board (PCB) containing signal conditioning, processing, and Bluetooth Low Energy (BLE) circuitry for wireless data transmission to a smartphone.
The following workflow diagram illustrates the key fabrication and integration steps:
Protocol: Analytical Validation and On-Body Testing
Laboratory Calibration
- pH Sensor Calibration: Connect the assembled wearable sensor to a potentiostat. Expose the microfluidic channel to standard buffer solutions (pH 2-9) and record the open-circuit potential (OCP) of the PANI electrode vs. the Ag/AgCl reference electrode. Plot potential (mV) vs. pH to determine sensitivity (mV/pH) using linear regression.
- Chloride Colorimetric Calibration: For colorimetric chloride detection, introduce standard NaCl solutions (e.g., 10-100 mM) into the microchannel. Capture images of the colorimetric sensor zone using a smartphone camera after 2 minutes of reaction. Convert the image to CIELAB color space and plot the b* value (blue-yellow component) against chloride concentration to generate a calibration curve [66].
On-Body Performance Evaluation
- Ethics and Preparation: Obtain approval from the institutional review board (IRB). Recruit healthy human subjects and obtain informed consent.
- Sensor Deployment: Clean the ventral forearm skin with isopropanol and deionized water. Adhere the sensor to the skin, ensuring the inlet port has good contact.
- Exercise Protocol: Subjects engage in moderate-intensity exercise (e.g., stationary cycling at 60% max heart rate) for 30-45 minutes to induce sweat.
- Data Collection: Record real-time pH data wirelessly via the smartphone application. Simultaneously, capture images of the colorimetric chloride sensor at 5-minute intervals for post-processing.
- Data Analysis: Correlate sensor data with gold-standard bench-top measurements (e.g., ion chromatography for chloride, pH meter for pH) from sweat samples collected from adjacent sites.
The Scientist's Toolkit
Table 3: Essential Research Reagent Solutions for Microfluidic Wearable Sensor Development
| Category | Item | Critical Function |
|---|---|---|
| Electrode Materials | Carbon Cloth (CC) | Flexible, conductive fabric substrate for working electrode [64] |
| Ag/AgCl Ink | Formulation for stable reference electrode [64] | |
| Polyaniline (PANI) | Electrochromic polymer for pH sensing [64] | |
| Microfluidics | PDMS | Silicone elastomer for flexible, biocompatible microchannels |
| Thermoplastic Polyurethane (TPU) | Polymer for durable, flexible microfluidic layers [65] | |
| Skin-Adhesive Hydrogel | Creates water-tight seal for sweat collection from skin [65] | |
| Electronic Components | Bluetooth Low Energy (BLE) Module | Enables wireless data transmission to mobile devices [64] [65] |
| Flexible Printed Circuit Board (PCB) | Provides mechanical flexibility for wearable comfort [64] | |
| Haptic Feedback Motor | Provides vibratory alerts for threshold crossing [65] | |
| Data Processing | CIELAB Color Model | Color space for quantitative analysis of colorimetric signals [66] |
| Partial Least Squares (PLS) Regression | Multivariate analysis for correlating sensor data with analyte concentration [66] |
System Architecture and Data Flow
The successful operation of an integrated microfluidic wearable sensor relies on a coordinated sequence of physical sampling, signal transduction, and data processing. The following diagram illustrates this integrated system architecture and information flow path from biomarker to user-interpretable result.
Overcoming Technical Hurdles in Sensor Design and Commercialization
Addressing Sensor Fouling and Stability in Complex Biological Matrices
Sensor fouling and instability in complex biological matrices represent significant challenges in developing reliable electrochemical devices for point-of-care (POC) pharmaceutical analysis. When sensors are exposed to biological fluids such as blood, serum, or interstitial fluid, the nonspecific adsorption of proteins, cells, and other biomolecules can degrade performance through reduced sensitivity, selectivity, and response time, ultimately shortening sensor lifespan [67]. This application note details proven strategies and protocols to mitigate these issues, focusing on material selection, surface engineering, and validation methodologies relevant to pharmaceutical research settings.
Stability of Sensor Anchoring chemistries
The choice of molecular anchors used to immobilize recognition elements on electrode surfaces significantly impacts sensor stability. A comparative study of alkanethiol self-assembled monolayers (SAMs) revealed substantial differences in performance under storage and stress conditions [68].
Table 1: Performance Comparison of Sensor Anchoring Chemistries
| Anchor Type | Electron Transfer Rate (s⁻¹) | Signal Retention after 50 Days (Aqueous Storage) | Stability to Thermocycling | Key Characteristics |
|---|---|---|---|---|
| Flexible Trihexylthiol (Letsinger-type) | 40-70 | ~75% | Excellent | Enhanced packing, superior stability |
| Rigid Adamantane Trihexylthiol | 40-70 | <40% | Poor | Rigid structure, similar to monothiol |
| Six-Carbon Monothiol (C6-MH) | 40-70 | <40% | Poor | Poor packing, limited stability |
| Eleven-Carbon Monothiol (C11-MH) | ~4-7 | N/A | N/A | Stable but sluggish electron transfer |
Antifouling Nanomaterials for Sensor Protection
Nanomaterials offer unique physicochemical properties that can confer biofouling resistance while maintaining sensing functionality. The following table summarizes key nanomaterials and their mechanisms of action [67].
Table 2: Antifouling Nanomaterials for Sensor Applications
| Nanomaterial Class | Antifouling Mechanism | Advantages | Limitations |
|---|---|---|---|
| Graphene & Graphene Oxide | Hydrophobicity; Functional group-mediated hydrophilicity; Nanochannel separation | Large surface area; High conductivity; Tunable surface chemistry | Potential nanoparticle aggregation |
| Carbon Nanotubes | sp³ hybridization protection; Large surface area | Enhanced electron transfer; Mechanical strength | Potential cytotoxicity concerns |
| Gold & Silver Nanoparticles | Surface modification with antifouling polymers; Catalytic activity | Biocompatibility; Easy functionalization | May require protective coatings |
| Metal Oxide Nanoparticles (e.g., NiO, Co₃O₄) | Catalytic activity; Polymer composite integration | High stability; Enzyme-mimicking properties | Limited inherent antifouling |
| Polymeric Nanocomposites (e.g., PEG, zwitterionic polymers) | Hydrophilic barrier; Repulsive hydration forces | High biocompatibility; Protein repellence | Potential delamination issues |
Experimental Protocols
Protocol: Fabrication of SAM-Based Electrochemical Sensors
This protocol describes the fabrication of electrochemical DNA (E-DNA) sensors using thiol-based self-assembled monolayers, adapted from published procedures [68].
Research Reagent Solutions:
- Thiol-modified DNA probes: 5'-thiol-TGG ATC GGC GTT TTA TT-(CH₂)₆-Methylene Blue-3' (1 µM in 6X SSC)
- Tris(2-carboxyethyl)phosphine hydrochloride (TCEP): 10 mM in DI water (reducing agent)
- 6-Mercapto-1-hexanol (MCH): 3 mM in DI water (backfilling co-adsorbate)
- 6X SSC Buffer: 90 mM sodium citrate, 0.9 M NaCl, pH 7.0
Procedure:
- Probe Reduction: Incubate thiol-modified DNA probes in 10 mM TCEP solution for 1 hour at room temperature in the dark to reduce disulfide bonds.
- Electrode Preparation: Clean gold rod electrodes (2 mm diameter) with piranha solution (Caution: Highly corrosive), followed by rinsing with distilled, deionized water and drying under nitrogen stream.
- SAM Formation: Incubate cleaned electrodes in the reduced DNA probe solution (1 µM in 6X SSC) for 30 minutes at room temperature in the dark.
- Backfilling: Transfer electrodes to 3 mM 6-mercapto-1-hexanol solution for 1 hour to form a mixed monolayer and remove nonspecifically adsorbed DNA.
- Rinsing and Storage: Rinse fabricated sensors thoroughly with DI water and store in 6X SSC buffer at room temperature until use.
Protocol: Assessment of Sensor Stability and Antifouling Performance
Research Reagent Solutions:
- Fetal Calf Serum: 50% in 6X SSC buffer (complex biological matrix)
- Target DNA Sequence: 200 nM in 6X SSC (5'-AAT AAA ACG CCG ATC CA-3')
- Mismatch DNA Sequence: 200 nM in 6X SSC (5'-AAT AAA ATA TCG ATC CA-3')
Procedure:
- Initial Performance Assessment:
- Interrogate sensors using AC voltammetry (25 mV amplitude, 50 Hz frequency, -0.1 V to -0.5 V vs. Ag/AgCl)
- Record background current in 6X SSC buffer
- Challenge with 200 nM target DNA for ~5 minutes
- Measure signal suppression after hybridization
- Regenerate sensor with 30-second DI water wash
Stability Testing:
- Aqueous Storage: Store sensors in 6X SSC buffer at room temperature, measuring background current every 3 days and target response on days 0, 25, and 50
- Thermal Stress Testing: Subject sensors to thermocycling (95°C for 25s, 55°C for 30s, 75°C for 55s) for 9 cycles, measuring performance every other cycle
- Complex Matrix Testing: Challenge sensors with 200 nM target in 50% fetal calf serum, comparing performance to buffer measurements
Data Analysis:
- Calculate percentage signal retention relative to day 0 measurements
- Determine specificity by comparing response to fully complementary vs. mismatch targets
- Assess regenerability by measuring signal recovery after water wash
Protocol: Sensor Cleaning and Maintenance
Adapted from general sensor maintenance guidelines, these procedures help restore fouled sensors [69].
Research Reagent Solutions:
- Mild Detergent Solution: 1% laboratory-grade detergent in DI water
- Isopropyl Alcohol Solution: 70% in DI water
- Hydrochloric Acid Solution: 10% in DI water (for stubborn deposits)
- Compatible Solvent: Chemically appropriate for specific fouling layer
Procedure:
- Initial Assessment:
- Deactivate associated chemical feed pumps or valves before maintenance
- Identify fouling type through visual inspection and performance metrics
Cleaning by Fouling Type:
- Soft Coatings: Gently rinse with water using a squirt bottle, wiping softly with a clean, non-abrasive cloth or paper towel. Use mild detergent if necessary
- Hard Coatings: Apply a chemically compatible solvent, selecting the mildest solvent capable of dissolving the buildup within 1-2 minutes
- Oily/Organic Coatings: Use a suitable detergent or solvent approved for the sensor's material
- Calcium and Mineral Scales: Use a mild acidic solution specifically designed for scale removal. Avoid harsh abrasives
Post-Cleaning Validation:
- Rinse thoroughly with appropriate buffer
- Recalibrate sensor according to manufacturer specifications
- Verify performance with standard solutions
Workflow and Signaling Pathways
Sensor Fouling Mitigation Workflow: This diagram outlines the comprehensive approach to addressing sensor fouling, from initial design to maintenance protocols. The process begins with strategic material selection, including anchor chemistry and antifouling coatings, proceeds through fabrication and validation, and incorporates continuous monitoring with appropriate cleaning interventions when fouling is detected.
Biofouling Impact Pathways: This diagram illustrates the mechanisms by which complex biological matrices lead to sensor performance degradation. Components from biological samples adsorb to the sensor surface, forming a fouling layer that directly impacts key performance parameters including sensitivity, selectivity, signal-to-noise ratio, and operational lifespan.
The Scientist's Toolkit: Research Reagent Solutions
Table 3: Essential Reagents for Fouling-Resistant Sensor Development
| Reagent/Material | Function | Application Notes |
|---|---|---|
| Trihexylthiol Anchors | Enhanced SAM stability | Flexible Letsinger-type provides superior stability vs. rigid adamantane |
| 6-Mercapto-1-hexanol | Backfilling co-adsorbate | Reduces nonspecific adsorption; improves probe orientation |
| Polyethylene Glycol | Antifouling coating | Hydrophilic barrier; protein repellent; biocompatible |
| Zwitterionic Polymers | Antifouling coating | Strong hydration layer; oxidative resistance |
| Functionalized Graphene Oxide | Nanomaterial coating | Tunable hydrophilicity; nanochannel separation |
| Tris(2-carboxyethyl)phosphine | Disulfide reduction | Maintains thiol groups for SAM formation |
| Galactose Oxidase in Redox Polymer | Enzyme biosensor matrix | Poly(MPC) capping layer blocks interferents [70] |
| Cerium-doped MoS₂ Nanoflowers | Neurological biomarker detection | High surface area (220 m²/g); peroxidase-like activity [70] |
Strategies for Enhancing Selectivity and Minimizing False Positives
In the development of electrochemical point-of-care (POC) devices for pharmaceutical analysis, the strategic enhancement of selectivity and the minimization of false positives are paramount. False positives, wherein a test incorrectly indicates the presence of an analyte, can lead to misdiagnosis, unnecessary treatments, and a loss of confidence in the technology [71]. For POC devices used in drug development and therapeutic monitoring, such inaccuracies can compromise patient safety and clinical decision-making. This document outlines key strategies, application notes, and detailed protocols to address these challenges, providing a framework for researchers and scientists to build more robust and reliable electrochemical biosensors.
A multi-faceted approach is essential for enhancing sensor selectivity. The following table summarizes the primary strategies, their underlying principles, and their specific roles in reducing false positive rates.
Table 1: Core Strategies for Enhancing Selectivity and Minimizing False Positives
| Strategy | Principle | Role in Minimizing False Positives | Typical Implementation in Electrochemical Sensors |
|---|---|---|---|
| Biomarker Combination & 'Believe-the-Negative' Rule [72] | Requires positivity on a second, confirmatory biomarker test in addition to the initial standard test. | Dramatically reduces the false positive fraction (rFPF) by adding a stringent confirmatory step, potentially with only a minimal loss in sensitivity (rTPR). | Using a panel of specific biomarkers (e.g., cardiac troponin I and T) in a multi-plexed sensor to confirm a result. |
| Advanced Material Interfaces [73] | Utilizes nanomaterials and modified electrodes to enhance specificity of the recognition event. | Improves specificity by reducing non-specific adsorption and increasing the fidelity of the biorecognition element-analyte interaction. | Employing molecularly imprinted polymers (MIPs), metal-organic frameworks (MOFs), or graphene derivatives (e.g., NG, GQDs) on the working electrode. |
| Signal Processing & Threshold Calibration [74] | Involves fine-tuning the algorithm and threshold for a positive signal based on validation studies. | Prevents spurious, low-intensity signals from being classified as a positive result, directly lowering the false positive rate. | Implementing Jaro-Winkler or Levenshtein string matching for data; setting an optimal similarity score threshold for signal positivity. |
| Secondary Identifier Validation [74] | Uses additional data points (beyond the primary signal) to validate a potential positive match. | Cross-references other immutable identifiers to rule out false matches caused by similar, but not identical, entities. | Incorporating spatial or temporal data (e.g., sample origin, patient ID) to contextualize the electrochemical readout. |
| Stringent Sampling & Quality Control [71] | Implements rigorous protocols to prevent sample contamination and degradation. | Addresses root causes of false positives like cross-contamination and reagent failure at the pre-analytical stage. | Using automated sample preparation; regular calibration of potentiostats; using synthetic negative controls. |
Detailed Experimental Protocols
Protocol: Evaluating a Combination Test with a Continuous Biomarker
This protocol is designed to assess whether a novel, continuous biomarker (e.g., free PSA) can improve the specificity of an established standard test (e.g., total PSA) when used in a "believe-the-negative" combination rule [72].
1. Application Note: This methodology is critical for validating new electrochemical assays intended to reduce unnecessary follow-ups in a screening context. It allows for the formal statistical evaluation of the trade-off between preserved sensitivity and gained specificity.
2. Experimental Workflow:
3. Materials & Reagents:
- Sample Set: Banked serum or plasma samples from a cohort with verified disease status.
- Standard Test A Kit: Established test (e.g., commercial ELISA for total PSA).
- Novel Biomarker Test B Components: Reagents for the electrochemical assay (e.g., antibody-functionalized screen-printed electrode (SPE) for free PSA) [73].
- Electrochemical Workstation: Potentiostat with capability for voltammetry or amperometry.
- Reference Electrode, Counter Electrode: Ag/AgCl reference electrode, Platinum counter electrode (if not integrated into SPE) [75].
4. Step-by-Step Procedure:
1. Initial Screening: Perform the standard test (Test A) on all available samples in the cohort. Record the results as positive or negative based on the established clinical cutoff.
2. Sub-Population Selection: Identify all samples that tested positive with Test A. This group forms the study population for the subsequent steps, as disease status is typically only verified for these individuals in a screen-positive design [72].
3. Novel Biomarker Analysis: For each Test A-positive sample, perform the novel electrochemical assay (Test B). Given that Test B is a continuous marker, run the assay and record the quantitative signal (e.g., peak current in µA). It is critical to perform these assays in a blinded manner regarding the final disease status.
4. Disease Status Verification: Obtain the definitive disease status (D for diseased, D̄ for non-diseased) for all Test A-positive subjects, typically via a gold-standard method like histological biopsy.
5. Data Analysis:
* For a pre-defined threshold t of the continuous Test B, classify a sample as combination-positive if (Test A = +) AND (Test B ≥ t).
* Calculate the Relative True Positive Rate (rTPR) as: (Number of D+ with combination +) / (Number of all D+) [72].
* Calculate the Relative False Positive Rate (rFPR) as: (Number of D̄+ with combination +) / (Number of all D̄+) [72].
* Vary the threshold t across the range of possible Test B values and recalculate rTPR and rFPR for each threshold.
6. rROC Curve Construction: Plot the calculated rTPR values on the y-axis against the corresponding rFPR values on the x-axis for all thresholds t. This is the Relative Receiver Operating Characteristic (rROC) curve, which visualizes the diagnostic trade-off of the combination test across all possible thresholds for the novel biomarker [72].
Protocol: Minimizing False Positives via Sensor Surface Engineering
This protocol details the modification of a working electrode with a nanocomposite to create a highly specific recognition interface, thereby reducing non-specific binding and cross-reactivity.
1. Application Note: Surface engineering is a foundational strategy to enhance selectivity. This protocol utilizes a chitosan/MWCNT nanocomposite doped with a molecularly imprinted polymer (MIP) to create cavities specific to the target pharmaceutical analyte, significantly reducing interference from structural analogs [73].
2. Experimental Workflow:
3. Research Reagent Solutions:
Table 2: Essential Materials for Sensor Surface Engineering
| Item | Function/Description | Role in Enhancing Selectivity |
|---|---|---|
| Glassy Carbon Electrode (GCE) | A common working electrode substrate with a wide potential window and good conductivity. | Provides a clean, reproducible surface for modification. |
| Chitosan (Chi) | A natural biopolymer known for its film-forming ability and biocompatibility. | Serves as a dispersing agent for nanomaterials and a matrix for MIP formation, preventing non-specific adsorption. |
| Multi-Walled Carbon Nanotubes (MWCNTs) | Nanomaterials that enhance electrical conductivity and provide a high surface area. | Increases sensor sensitivity and amplifies the specific signal over background noise. |
| Methacrylic Acid (MAA) | A functional monomer for MIP synthesis. | Forms reversible complexes with the template molecule (analyte) during polymerization, creating specific binding sites. |
| Ethylene Glycol Dimethacrylate (EGDMA) | A cross-linking agent for MIP synthesis. | Stabilizes the polymer matrix and locks the specific binding cavities in place after template removal. |
| Target Analyte (e.g., specific drug) | Serves as the template molecule during MIP formation. | Creates complementary cavities in the polymer that are highly selective for the analyte, rejecting similarly structured molecules. |
4. Step-by-Step Procedure: 1. Electrode Pretreatment: Polish the surface of a Glassy Carbon Electrode (GCE) with successive grades of alumina slurry (e.g., 1.0, 0.3, and 0.05 µm) on a microcloth. Rinse thoroughly with deionized water and ethanol, and dry under a nitrogen stream. 2. Nanocomposite Preparation: Disperse a known quantity of MWCNTs in a 0.5% (w/v) chitosan solution (prepared in 1% acetic acid) via ultrasonication for 30-60 minutes to form a homogeneous suspension. 3. Electrode Modification: Drop-coat a precise volume (e.g., 5-10 µL) of the Chi-MWCNT suspension onto the clean GCE surface and allow it to dry at room temperature, forming the base layer. 4. MIP Formation: Prepare a polymerization mixture containing the target analyte (template), methacrylic acid (monomer), ethylene glycol dimethacrylate (crosslinker), and an initiator (e.g., AIBN) in a suitable solvent. Drop-coat this mixture onto the Chi-MWCNT/GCE. Initiate polymerization thermally or photochemically. 5. Template Extraction: Soak the polymerized electrode in a washing solution (e.g., methanol:acetic acid mixture) to thoroughly leach out the template molecules. This leaves behind specific recognition cavities complementary in size, shape, and functional groups to the target analyte. 6. Electrochemical Detection: Integrate the modified electrode into a standard three-electrode cell. Using voltammetry (e.g., DPV or SWV), measure the electrochemical signal (e.g., peak current) of the analyte in standard solutions and real samples. 7. Quality Control and False Positive Check: Always run negative controls in parallel. This includes analyzing samples that are known to be free of the target analyte but may contain common interferents (e.g., metabolites, structurally similar drugs). A well-engineered sensor will show no significant signal with these controls, confirming minimal cross-reactivity and false positives [71].
The Scientist's Toolkit: Key Research Reagent Solutions
Table 3: Essential Reagents and Materials for Electrochemical POC Pharmaceutical Analysis
| Category / Item | Specific Examples | Critical Function |
|---|---|---|
| Electrode Substrates | Screen-Printed Electrodes (SPEs), Glassy Carbon Electrode (GCE), Gold Electrode (GE) [73] [75] | Provide the solid support for the sensing interface; SPEs are low-cost and disposable, ideal for POC. |
| Nanomaterials | Multi-Walled Carbon Nanotubes (MWCNTs), Graphene Quantum Dots (GQDs), Metal-Organic Frameworks (MOFs), Gold Nanostructures (AuNS) [73] | Enhance electron transfer, increase active surface area, and can be functionalized for specific recognition. |
| Biorecognition Elements | Specific Antibodies, Molecularly Imprinted Polymers (MIPs), Aptamers, Enzymes (e.g., SOx) [73] | Confer high selectivity by binding specifically to the target pharmaceutical analyte. |
| Polymers & Matrices | Chitosan (Chi), Polyaniline (PANI), Polypyrrole (PPy), Nafion [73] [75] | Immobilize recognition elements, prevent fouling, and reject interferents. |
| Electrochemical Techniques | Differential Pulse Voltammetry (DPV), Electrochemical Impedance Spectroscopy (EIS), Amperometry [75] | Provide the measurement principle for transducing the biorecognition event into a quantifiable electrical signal. |
Improving Long-Term Storage Stability and Reproducibility for Mass Production
For point-of-care electrochemical biosensors in the pharmaceutical industry, achieving long-term storage stability and mass production reproducibility is paramount. These devices, which often rely on biological recognition elements like enzymes or antibodies integrated with electrochemical transducers, must maintain their analytical performance from manufacture through deployment to final use. Instability during storage can lead to reduced sensor sensitivity, loss of specificity, and altered pharmacokinetic profiles, ultimately compromising diagnostic accuracy and therapeutic monitoring reliability. This document outlines standardized protocols and application notes to address these critical challenges, ensuring that electrochemical point-of-care devices remain stable, functional, and reproducible throughout their intended shelf life.
Key Factors Affecting Storage Stability
The complex structure of biosensing components can deteriorate under suboptimal conditions. The table below summarizes the primary factors influencing the long-term stability of electrochemical biosensors and their biological recognition elements.
Table 1: Critical Factors Influencing the Storage Stability of Electrochemical Pharmaceutical Sensors
| Factor | Impact on Stability | Consequence for Sensor Performance |
|---|---|---|
| Temperature & Storage Conditions [76] | Denaturation, aggregation, and irreversible loss of bioactivity of enzymes/antibodies at non-optimal temperatures. | Reduced binding affinity, loss of catalytic activity, and altered electrochemical signal. |
| pH and Buffer Composition [76] | Accelerated deamidation, oxidation, or aggregation near the protein's isoelectric point (pI). | Shift in calibration curves, signal drift, and decreased functional yield. |
| Repeated Freeze-Thaw Cycles [76] [77] | Ice crystal formation causing protein unfolding and aggregation; cell lysis in biological samples. | Loss of biorecognition element integrity, increased baseline noise, and batch-to-batch variability. |
| Moisture & Light Exposure [76] | Hydrolysis of sensitive components and light-induced oxidation of aromatic residues (e.g., tryptophan). | Loss of specificity, increased background signal, and shortened shelf life. |
| Contamination [76] | Microbial growth or introduction of proteases that degrade biological elements. | Complete functional failure, safety issues, and unreliable results. |
Experimental Protocols for Stability Assessment
Protocol for Real-Time Stability Testing
Objective: To determine the shelf life of electrochemical biosensors under recommended storage conditions.
Materials:
- Biosensor batches from mass production.
- Controlled temperature storage units (-80°C, -20°C, 4°C, 25°C).
- Standardized analyte solutions at known concentrations.
- Potentiostat/Galvanostat for electrochemical measurements.
Methodology:
- Aliquoting and Storage: Divide a single, homogeneous production batch of sensors into multiple groups. Store these groups at different, precisely controlled temperatures (e.g., -80°C, -20°C, 4°C, and 25°C) and humidity conditions [76] [77].
- Time-Point Sampling: At predetermined intervals (e.g., 0, 1, 3, 6, 9, 12, 18, 24 months), retrieve a subset of sensors from each storage condition.
- Functional Testing: Using a standardized assay protocol (e.g., Cyclic Voltammetry or Differential Pulse Voltammetry in the presence of a target analyte), measure the electrochemical response of each sensor [2]. Key performance indicators (KPIs) include:
- Sensitivity (slope of the calibration curve).
- Limit of Detection (LOD).
- Signal Reproducibility (Percent Coefficient of Variation, %CV).
- Data Analysis: Plot KPIs against storage time for each condition. The shelf life is defined as the time point at which a key KPI (e.g., sensitivity) falls below a pre-defined acceptance threshold (e.g., 80% of initial value).
Protocol for Assessing Electrode Fouling and Performance
Objective: To evaluate the physical and chemical stability of the electrode surface and its impact on signal reproducibility.
Materials:
- Stored and fresh biosensors.
- Electrochemical cell and potentiostat.
- Phosphate buffer saline (PBS), pH 7.4.
- Redox probe solution (e.g., 5mM Potassium Ferricyanide/K Ferrocyanide in PBS).
Methodology:
- Pre-Test Electrode Characterization: For sensors retrieved at each time point, perform Cyclic Voltammetry (CV) in the redox probe solution. Record the peak-to-peak separation (ΔEp) and the peak current [2].
- Functional Assay: Perform the intended electrochemical assay for the sensor (e.g., amperometric detection of an analyte).
- Post-Test Electrode Characterization: Repeat step 1 in a fresh redox probe solution.
- Data Analysis: Compare the pre- and post-assay CV results. An increase in ΔEp or a decrease in peak current indicates electrode fouling or degradation, which contributes to signal loss and irreproducibility over time [2].
Data Presentation and Analysis
Quantitative data from stability studies should be summarized clearly for easy comparison and trend analysis.
Table 2: Exemplary Data from a Long-Term Stability Study of a Glucose Biosensor Stored at 4°C
| Storage Time (Months) | Sensitivity (nA/mM) | % Initial Sensitivity | LOD (mM) | Inter-Sensor %CV (n=10) |
|---|---|---|---|---|
| 0 (Initial) | 125.5 | 100.0% | 0.02 | 4.5% |
| 3 | 122.1 | 97.3% | 0.02 | 5.1% |
| 6 | 118.3 | 94.3% | 0.03 | 6.8% |
| 9 | 105.6 | 84.1% | 0.05 | 9.5% |
| 12 | 95.8 | 76.3% | 0.07 | 12.3% |
Workflow Visualization
The following diagram illustrates the integrated workflow for developing, testing, and validating the storage stability of electrochemical point-of-care devices.
Stability testing workflow for electrochemical sensors.
The Scientist's Toolkit: Research Reagent Solutions
The following table details essential materials and reagents critical for ensuring the stability and performance of electrochemical biosensors.
Table 3: Essential Research Reagents for Biosensor Stabilization and Analysis
| Reagent / Material | Function / Purpose | Application Notes |
|---|---|---|
| Stabilizing Buffer Systems (e.g., Histidine, Citrate, Phosphate) [76] | Maintains optimal pH, prevents aggregation and chemical degradation (deamidation, oxidation) of biological recognition elements. | Use at slightly acidic to neutral pH (5.0–7.0); compatibility with the electrode surface must be validated. |
| Cryoprotectants (e.g., Trehalose, Sucrose, Glycerol) [76] | Protects proteins from denaturation and aggregation during freezing by forming a stabilizing glassy matrix. | Glycerol (10-50%) for frozen storage; sugars like trehalose are ideal for lyophilized formulations. |
| Lyophilization Protectors | Enables room-temperature storage by removing water and forming a stable solid cake, greatly extending shelf life. | Often used in combination with cryoprotectants like trehalose. |
| Electrochemical Redox Probes (e.g., Ferricyanide, RuHex) [2] | Monitors the integrity and cleanliness of the electrode surface before and after stability tests. | Used in Cyclic Voltammetry to detect fouling; a key QC tool for reproducibility. |
| Size-Exclusion Chromatography (SEC) [76] | Detects and quantifies protein aggregation, a key indicator of instability, in biorecognition elements. | A critical quality control (QC) method for release and stability testing of sensor components. |
Challenges in Biomolecule Immobilization and Activity Retention
The effective immobilization of biomolecules such as enzymes, antibodies, and nucleic acids onto solid surfaces is a foundational step in developing advanced electrochemical devices for point-of-care (POC) pharmaceutical analysis [78]. These immobilized biomolecules serve as the critical recognition elements in biosensors, enabling the specific and sensitive detection of analytes ranging from disease biomarkers to therapeutic drug concentrations [79]. Retaining the biological activity of these molecules after immobilization remains a significant challenge, as uncontrolled adsorption or improper chemical attachment can lead to denaturation, steric hindrance, or unfavorable orientation, ultimately compromising device performance [78] [80]. Within the framework of POC pharmaceutical applications—including therapeutic drug monitoring, personalized dosing, and quality control—maintaining this activity is paramount for ensuring the accuracy, reliability, and clinical utility of these analytical platforms [62] [81]. This document outlines the principal challenges associated with biomolecule immobilization and provides detailed protocols designed to maximize activity retention for researchers and drug development professionals.
Key Challenges in Activity Retention
The process of transferring a biomolecule from its native aqueous environment to a synthetic solid surface introduces several factors that can diminish its activity. The following table summarizes the primary challenges and their impacts on biomolecule function.
Table 1: Key Challenges in Biomolecule Immobilization and Their Impact on Activity
| Challenge | Impact on Immobilized Biomolecule | Consequence for Biosensor Performance |
|---|---|---|
| Denaturation at Surface [78] | Loss of tertiary structure and active site conformation. | Reduced catalytic efficiency (enzymes) or binding affinity (antibodies). |
| Random Orientation [80] | Active sites or binding domains may be blocked or facing away from the solution. | Lowers the density of accessible functional molecules, decreasing signal. |
| Steric Hindrance [82] | Reduced accessibility of the substrate or analyte to the active site. | Slower response times and lower apparent sensitivity. |
| Leaching [82] | Physical detachment of the biomolecule from the support. | Gradual loss of signal and device-to-device variability, reducing shelf-life. |
| Nonspecific Binding (NSB) [78] | Adsorption of non-target molecules to the sensor surface. | Increased background noise, false positives, and reduced specificity. |
Overcoming these challenges requires a deliberate selection of both the immobilization methodology and the underlying support material. The choice often involves a compromise between the binding strength and the risk of compromising the biomolecule's native structure.
Table 2: Comparison of Common Immobilization Methods
| Immobilization Method | Binding Force/Mechanism | Advantages | Disadvantages | Relative Activity Retention |
|---|---|---|---|---|
| Physical Adsorption [78] [80] | Hydrophobic, ionic, van der Waals interactions. | Simple, no chemical modification required. | Weak binding, prone to leaching and random orientation. | Low to Moderate |
| Covalent Binding [82] [78] | Formation of covalent bonds (e.g., amide, ether). | Stable, durable immobilization; resistant to leaching. | Risk of denaturation; requires specific functional groups. | Moderate to High |
| Affinity Binding [80] | High-specificity interactions (e.g., biotin-streptavidin). | Controlled, oriented immobilization; high activity retention. | Requires genetic or chemical tagging of the biomolecule. | High |
| Entrapment/Encapsulation [82] [78] | Physical confinement within a polymer matrix or gel. | Protective environment; minimal chemical modification. | Mass transfer limitations for substrate/analyte. | Moderate |
| Cross-Linking [82] | Bifunctional reagents link biomolecules to each other. | Carrier-free; high biomolecule density. | Can lead to rigidification and loss of activity. | Variable |
Detailed Experimental Protocols
Protocol 1: Covalent Immobilization with Oriented Affinity Tags
This protocol describes a method for the oriented covalent immobilization of recombinant proteins onto an electrode surface, leveraging affinity tags to maximize the accessibility of active sites. This approach is particularly suited for developing highly sensitive electrochemical immunosensors [80].
Workflow Overview:
Materials:
- Gold disk working electrode (2 mm diameter)
- Self-Assembled Monolayer (SAM) solution: 2 mM 11-mercaptoundecanoic acid (11-MUA) in absolute ethanol.
- Coupling buffer: 0.1 M MES, pH 6.0.
- Activation reagents: 0.4 M N-ethyl-N'-(3-dimethylaminopropyl)carbodiimide (EDC) and 0.1 M N-hydroxysuccinimide (NHS) in coupling buffer.
- Streptavidin solution: 50 µg/mL in PBS, pH 7.4.
- Biotinylated protein (e.g., antibody or enzyme) of interest.
- Blocking solution: 1% (w/v) Bovine Serum Albumin (BSA) in PBS.
- Electrochemical cell and potentiostat.
Procedure:
- Electrode Preparation: Clean the gold electrode via immersion in piranha solution (3:1 v/v H₂SO₄:H₂O₂) for 5 minutes. (Caution: Piranha solution is highly corrosive and must be handled with extreme care.) Rinse thoroughly with Milli-Q water and absolute ethanol.
- SAM Formation: Incubate the clean electrode in the 11-MUA solution for 12 hours at room temperature to form a carboxylic acid-terminated SAM. Rinse with ethanol and water to remove physically adsorbed thiols.
- Surface Activation: Place the electrode in the electrochemical cell containing the EDC/NHS activation solution. Incubate for 30 minutes with gentle agitation to convert terminal carboxyl groups to amine-reactive NHS esters. Rinse with coupling buffer.
- Streptavidin Immobilization: Pipette 50 µL of the streptavidin solution onto the activated electrode surface. Incubate in a humidified chamber for 2 hours. The primary amines of streptavidin will form stable amide bonds with the NHS-esters.
- Blocking: Rinse the electrode with PBS. Apply 100 µL of 1% BSA blocking solution for 1 hour to passivate any remaining reactive sites and minimize nonspecific binding.
- Target Protein Capture: Incubate the streptavidin-functionalized electrode with a solution of the biotinylated target protein (e.g., 10 µg/mL in PBS) for 1 hour. The high-affinity biotin-streptavidin interaction ensures oriented immobilization.
- Validation: Characterize the modified electrode after each step using Electrochemical Impedance Spectroscopy (EIS) in a 5 mM [Fe(CN)₆]³⁻/⁴⁻ solution. A successful modification is indicated by a progressive increase in charge transfer resistance (Rₑₜ).
Protocol 2: Formation of Cross-Linked Enzyme Aggregates (CLEAs)
This protocol outlines the preparation of carrier-free Cross-Linked Enzyme Aggregates (CLEAs), which offer high volumetric activity and stability, making them ideal for incorporation into POC biosensors or flow reactors for pharmaceutical analysis [82].
Workflow Overview:
Materials:
- Enzyme solution (e.g., Glucose Oxidase, Horseradish Peroxidase) in a suitable buffer.
- Precipitant: Saturated ammonium sulfate solution or cold acetone.
- Cross-linker: 2.5% (v/v) glutaraldehyde solution.
- Base buffer: 0.1 M sodium phosphate buffer, pH 7.0.
- Quenching solution: 1 M Tris-HCl, pH 8.0.
- Centrifuge and vortex mixer.
Procedure:
- Enzyme Precipitation: Add 1 mL of the enzyme solution to 4 mL of cold precipitant (e.g., acetone at -20°C) dropwise while vortexing. Continue mixing for 1 hour at 4°C to form a fine precipitate or aggregate.
- Cross-Linking: Centrifuge the suspension at 10,000 × g for 10 minutes. Discard the supernatant and resuspend the pellet in 5 mL of base buffer. Add glutaraldehyde to a final concentration of 0.5% (v/v). Incubate the mixture for 2-4 hours at 4°C with gentle shaking.
- Quenching and Washing: Stop the cross-linking reaction by adding 0.5 mL of Tris-HCl quenching solution and incubating for 15 minutes. Centrifuge the CLEAs and wash the pellet three times with base buffer to remove residual cross-linker and soluble protein.
- Storage: Resuspend the final CLEA product in a storage buffer (e.g., with 10% glycerol) at 4°C.
- Characterization:
- Activity Assay: Perform a standard activity assay (e.g., for Glucose Oxidase, measure the production of H₂O₂ from glucose using a colorimetric peroxidase-coupled reaction). Compare the activity of the CLEAs to an equivalent amount of free enzyme.
- Stability Test: Incubate free enzyme and CLEAs at 40°C and measure residual activity over time. CLEAs typically demonstrate significantly enhanced operational and storage stability [82].
The Scientist's Toolkit: Essential Research Reagents
The following table lists key reagents and materials critical for successful biomolecule immobilization, as featured in the protocols above and the broader literature.
Table 3: Key Research Reagents for Biomolecule Immobilization
| Reagent/Material | Function/Application | Key Considerations |
|---|---|---|
| Glutaraldehyde [82] | Homobifunctional cross-linker for amine-amine coupling. | Economical and effective, but can be toxic and may reduce activity if not optimized. |
| EDC/NHS [83] | Carbodiimide chemistry for activating carboxyl groups to form amide bonds. | Gold standard for covalent immobilization; requires careful control of pH and reaction time. |
| Streptavidin/Biotin [80] | High-affinity pair for oriented immobilization. | Enables precise control over orientation; requires biotinylation of the target biomolecule. |
| Self-Assembled Monolayers (SAMs) [78] | Well-ordered surfaces for controlled biomolecule attachment. | Provides a tunable interface (e.g., carboxyl, amine-terminated) for subsequent chemistry. |
| Chitosan [83] | Natural polysaccharide polymer for entrapment and adsorption. | Biocompatible, hydrophilic, and can enhance enzyme stability after immobilization. |
| Magnetic Nanoparticles [82] | Support for creating magnetic CLEAs (m-CLEAs). | Facilitates easy separation and recovery of the biocatalyst from the reaction mixture using a magnet. |
The successful development of robust electrochemical devices for POC pharmaceutical analysis is intrinsically linked to the effective resolution of biomolecule immobilization challenges. The choice of strategy—whether covalent, affinity-based, or carrier-free—must be guided by the specific application and the nature of the biomolecule. The protocols provided here for oriented covalent immobilization and CLEA formation offer two distinct, high-performance pathways that prioritize the retention of biological activity. By adhering to these detailed methodologies and leveraging the essential reagents outlined, researchers can enhance the sensitivity, stability, and reproducibility of their biosensing platforms, thereby accelerating the transition of these technologies from the laboratory to the clinic and point-of-care settings.
Navigating Matrix Effects in Blood, Plasma, Urine, and Saliva
Matrix effects represent a critical challenge in the development of robust bioanalytical methods, particularly for point-of-care (POC) electrochemical pharmaceutical analysis. These effects refer to the alteration of analyte signal caused by all components of a sample other than the target analyte itself, leading to ion suppression or enhancement in mass spectrometry and similar interference in electrochemical detection [84] [85]. In quantitative analysis, matrix effects can significantly impact method accuracy, precision, and sensitivity, potentially resulting in erroneous clinical decisions if not properly addressed [86] [84]. The complexity of biological matrices—including blood, plasma, urine, and saliva—introduces numerous interfering substances such as phospholipids, proteins, salts, metabolites, and exogenous compounds that can co-migrate or co-elute with target analytes [84] [87].
Understanding and mitigating matrix effects is particularly crucial for electrochemical devices intended for POC pharmaceutical analysis, where simplified sample preparation and rapid analysis are essential. The non-invasive nature of saliva sampling makes it increasingly attractive for TDM, though its matrix composition presents unique challenges [88]. Similarly, blood, plasma, and urine each contain distinct interfering components that must be considered during method development. This application note provides a comprehensive framework for assessing, quantifying, and mitigating matrix effects across these biological matrices to ensure reliable analytical performance for POC electrochemical devices.
Matrix Effect Characterization Across Biological Matrices
Comparative Matrix Composition and Interferents
Different biological matrices present distinct challenges for electrochemical analysis due to their unique compositions. The table below summarizes key characteristics and major interferents across common matrices.
Table 1: Matrix Composition and Major Interfering Components in Common Biological Matrices
| Matrix | Key Characteristics | Major Interfering Components | Impact on Electrochemical Analysis |
|---|---|---|---|
| Blood | Complex cellular components; high protein content; viscous [60] | Hemoglobin, white blood cells, platelets, electrolytes, glucose [60] | Biofouling of electrode surfaces; interference with electron transfer; high viscosity affects mass transport |
| Plasma/Serum | Acellular but protein-rich; less viscous than whole blood [84] | Phospholipids, proteins (albumin, globulins), urea, lipids, bilirubin [84] [87] | Protein adsorption on electrode surfaces; signal suppression/enhancement; reduced sensitivity |
| Urine | Variable ionic strength; high salt content; metabolic byproducts [87] | Urea, creatinine, uric acid, electrolytes, medications, metabolites [87] | High salt content affects conductivity; competing redox reactions; variable pH affects analyte stability |
| Saliva | Less complex than blood; variable viscosity; food contaminants [88] | Mucin, enzymes (amylase, lysozyme), bacteria, food residues, blood from gingival bleeding [88] | Mucous components cause biofouling; enzymatic degradation of analytes; variable collection effects results |
Quantitative Assessment of Matrix Effects
Matrix effects can be quantitatively assessed using the Matrix Factor (MF), which is calculated by comparing the analyte response in a biological matrix to the response in a neat solution [86] [84]. The IS-normalized MF provides a more reliable measure of net matrix effect when using internal standards. The following table presents acceptable criteria for matrix effect evaluation based on international guidelines.
Table 2: Matrix Effect Assessment Criteria and Acceptance Limits Based on International Guidelines
| Assessment Parameter | Calculation Method | Acceptance Criteria | Applicable Guidelines |
|---|---|---|---|
| Absolute Matrix Factor (MF) | Peak area in post-extracted matrix / Peak area in neat solution [84] | CV ≤ 15% across different matrix lots; Ideal MF = 0.75-1.25 [84] | CLSI C62A, FDA Bioanalytical Method Validation [86] |
| IS-normalized MF | MFanalyte / MFIS [86] [84] | CV ≤ 15%; Value close to 1.0 indicates effective compensation [84] | ICH M10, EMA Guidelines [86] |
| Pre-extraction Spike Accuracy | (Measured concentration/Nominal concentration) × 100% [84] | Bias within ±15% of nominal concentration [84] | ICH M10, FDA Bioanalytical Method Validation [86] |
Experimental Protocols for Matrix Effect Assessment
Post-Extraction Spiking Method for Quantitative Assessment
The post-extraction spiking method, initially described by Matuszewski et al., remains the gold standard for quantitative matrix effect assessment [86] [84]. This protocol can be adapted for electrochemical sensor characterization with the following steps:
Sample Preparation:
Spiking Protocol:
- Divide each processed blank matrix extract into two aliquots
- Spike one aliquot with target analyte at low and high QC concentrations (representing the lower and upper ends of the calibration range)
- Prepare corresponding neat solutions in mobile phase or buffer at identical concentrations
- For electrochemical applications, include a fixed concentration of internal standard if used
Analysis and Calculation:
- Analyze all samples using the intended electrochemical method (e.g., DPV, EIS, amperometry)
- Calculate absolute MF for each matrix lot and concentration: MF = Peak response in matrix / Peak response in neat solution
- For methods using IS, calculate IS-normalized MF: IS-normalized MF = MFanalyte / MFIS
- Determine precision (CV%) of MF across different matrix lots [86] [84]
Interpretation:
- MF < 1 indicates signal suppression; MF > 1 indicates signal enhancement
- CV > 15% across matrix lots suggests significant variable matrix effects
- IS-normalized MF close to 1.0 with CV ≤ 15% indicates effective compensation by IS
Figure 1: Workflow for Post-Extraction Spiking Matrix Effect Assessment
Standard Addition Method for Endogenous Analytes
For endogenous analytes where blank matrix is unavailable, the standard addition method provides an effective approach for matrix effect compensation [87]:
Sample Preparation:
- Divide the sample into four or five equal aliquots
- Leave one aliquot unspiked (native sample)
- Spike the remaining aliquots with increasing known concentrations of analyte standard
- Ensure all aliquots undergo identical processing
Analysis and Calculation:
- Analyze all aliquots using the electrochemical method
- Plot signal response versus added analyte concentration
- Extrapolate the linear regression to the x-axis to determine native concentration
- The slope of the standard addition curve reflects the matrix effect magnitude
Validation:
- Compare results with those obtained using matrix-matched calibration
- Assess linearity (R² > 0.98) of standard addition curve
- Determine accuracy by spiking recovery experiments
Mitigation Strategies for Matrix Effects
Sample Preparation Optimization
Effective sample preparation is the first line of defense against matrix effects. The following table compares common techniques for different biological matrices.
Table 3: Sample Preparation Methods for Matrix Effect Mitigation in Different Biological Matrices
| Technique | Mechanism | Effectiveness by Matrix | Limitations |
|---|---|---|---|
| Protein Precipitation | Denatures and removes proteins | Effective for plasma/serum; Moderate for blood; Limited for urine/saliva | Incomplete removal of phospholipids; May not eliminate small molecule interferents [84] |
| Liquid-Liquid Extraction | Partitioning based on solubility | High for plasma; Moderate for blood, urine, saliva | May not recover polar analytes; Requires optimization of organic solvents [87] |
| Solid-Phase Extraction | Selective retention based on chemistry | High for all matrices when optimized | More expensive; Requires method development; Cartridge variability [84] |
| Dilution | Reduces concentration of interferents | Moderate for all matrices if sensitivity allows | Limited application for low concentration analytes; May not eliminate specific interferents [87] |
| Centrifugation/Filtration | Removes particulate matter | Essential for blood; Important for saliva [88] | Does not remove dissolved interferents; Membrane adsorption possible |
Sensor Surface Modifications
Advanced sensor surface modifications can significantly reduce matrix effects in electrochemical detection:
Antifouling Coatings:
- Implement hydrophilic polymers (PEG, zwitterionic materials) to minimize protein adsorption
- Use blocking agents (BSA, casein) to passivate non-specific binding sites
- Apply conducting polymers (PEDOT, polypyrrole) with built-in antifouling properties
Size-Exclusion Membranes:
- Incorporate Nafion coatings to exclude negatively charged interferents
- Use porous membranes with controlled molecular weight cut-off
- Implement multilayer coatings with selective permeability
Nanomaterial-Enhanced Surfaces:
- Utilize carbon nanotubes or graphene with tailored functionalization
- Employ metal-organic frameworks (MOFs) for selective preconcentration
- Implement molecularly imprinted polymers (MIPs) for enhanced selectivity [28]
Figure 2: Decision Pathway for Matrix Effect Mitigation Strategies
Internal Standard Selection
The use of appropriate internal standards is critical for compensating residual matrix effects:
Stable Isotope-Labeled Internal Standards:
- Gold standard for mass spectrometry applications
- Exhibit nearly identical chemical properties and matrix effects as analytes
- Often unavailable or expensive for novel pharmaceutical compounds
Structural Analogues:
- More readily available than SIL-IS
- Must share similar physicochemical properties with analyte
- Should elute/migrate close to but be resolvable from analyte
Electronic Internal Standards:
- Particularly relevant for electrochemical sensors
- Compounds with similar redox properties but distinct peak potentials
- Should experience similar fouling effects as target analyte
The Scientist's Toolkit: Essential Research Reagents and Materials
Table 4: Essential Research Reagents and Materials for Matrix Effect Assessment and Mitigation
| Category | Specific Items | Function/Application | Key Considerations |
|---|---|---|---|
| Sample Collection | Sarstedt Salivette tubes [88], EDTA/lithium heparin blood collection tubes, sterile polypropylene containers [88] | Standardized sample collection across matrices | Container materials may adsorb analytes; anticoagulants can cause interference |
| Sample Preparation | Phospholipid removal plates, molecular weight cut-off filters, protein precipitation reagents (ACN, MeOH), SPE cartridges (C18, mixed-mode) [84] [87] | Removal of matrix interferents prior to analysis | Select sorbent chemistry based on analyte properties; optimize solvent composition |
| Internal Standards | Stable isotope-labeled analogs, structural analogues, electronic internal standards [84] [87] | Compensation of matrix effects during quantification | SIL-IS should co-elute with analyte; structural analogs should have similar properties |
| Sensor Materials | Carbon nanotubes, graphene oxide, gold nanoparticles, molecularly imprinted polymers [28] [89], antifouling coatings (PEG, zwitterionic polymers) | Enhanced selectivity and reduced fouling in electrochemical sensors | Functionalization chemistry affects performance; stability under biological conditions |
| Buffer Components | Phosphate buffered saline, ammonium formate, formic acid, ion-pairing reagents | Mobile phase preparation for separation methods | Buffer composition affects ionization and separation; compatibility with detection method |
Matrix effects present significant challenges for reliable POC electrochemical pharmaceutical analysis across all biological matrices. A systematic approach to assessment and mitigation is essential during method development and validation. The protocols outlined in this application note provide a comprehensive framework for characterizing matrix effects in blood, plasma, urine, and saliva, with specific adaptation for electrochemical platforms. By implementing appropriate sample preparation strategies, sensor surface modifications, and internal standardization, researchers can develop robust analytical methods that deliver accurate and precise results despite the complexities of biological matrices. Regular monitoring of matrix effects throughout method application remains crucial, particularly when analyzing samples from diverse populations or pathological conditions that may alter matrix composition.
Validation Strategies, Performance Metrics, and Market Translation
Analytical validation provides the foundational evidence that an analytical procedure is suitable for its intended purpose, ensuring the generation of reliable, accurate, and reproducible data. For electrochemical devices designed for point-of-care (POC) pharmaceutical analysis, rigorous validation is paramount. It bridges the gap between a conceptual biosensor and a trusted tool for critical decision-making in drug development and therapeutic monitoring [90] [91]. This document outlines the core principles and practical protocols for validating key performance parameters—sensitivity, specificity, the Limit of Detection (LOD), and the Limit of Quantification (LOQ)—within the context of modern POC electrochemical platforms.
The drive towards miniaturized, rapid diagnostics has positioned electrochemical biosensors as a cornerstone of POC technology. These sensors leverage the high sensitivity, specificity, and miniaturization potential of electrochemical transducers, combined with biological recognition elements such as enzymes, antibodies, or aptamers [91]. Their operational principle involves measuring electrical signals (current, potential, impedance) generated from the specific interaction between a target analyte and a biorecognition element immobilized on the electrode surface [91]. Before such a device can be deployed, however, its analytical performance must be thoroughly characterized to comply with regulatory standards and ensure data integrity [92] [90].
Core Principles of Analytical Validation
Defining the Validation Parameters
In analytical method validation, sensitivity, specificity, LOD, and LOQ are critical components that collectively define the operational scope and reliability of a method.
Sensitivity and Specificity: In a validation context, sensitivity refers to the ability of the method to detect the target analyte with a high true positive rate, while specificity is its capacity to correctly distinguish the analyte from other interfering components in the sample matrix [90]. For electrochemical biosensors, specificity is often engineered through the selective binding of immobilized biorecognition elements (e.g., antibodies, aptamers) [91].
Limit of Detection (LOD) and Limit of Quantification (LOQ): The LOD is the lowest concentration of an analyte that can be reliably detected by the method, though not necessarily quantified with precision. In contrast, the LOQ is the lowest concentration that can be quantitatively determined with acceptable levels of accuracy and precision [92]. These parameters are mathematically defined based on the standard deviation of the response (σ) and the slope of the calibration curve (S):
- LOD = (3.3 × σ) / S
- LOQ = (10 × σ) / S [92]
These formulae are universally applicable, requiring experimental determination of the standard deviation of the blank or low-concentration samples and the slope from the calibration curve.
The Role of Validation in Point-of-Care Pharmaceutical Analysis
The integration of advanced materials like molecularly imprinted polymers (MIPs) into electrochemical sensors has enhanced their chemical stability and selectivity for POC applications [93]. Validating these sophisticated systems ensures they meet the "ASSURED" criteria (Affordable, Sensitive, Specific, User-friendly, Rapid and robust, Equipment-free, and Deliverable to end-users) ideal for POC devices [52]. A thoroughly validated method guarantees that results obtained from a portable, perhaps non-invasively operated device (using biofluids like sweat, saliva, or interstitial fluid) are as credible as those from a central laboratory, thereby facilitating their adoption in pharmaceutical research and clinical diagnostics [91].
Experimental Protocols and Methodologies
This section provides detailed, step-by-step protocols for determining the key validation parameters.
Protocol for Determining LOD and LOQ
This protocol follows established guidelines like the CLSI EP17-A2, which is used for evaluating the detection capability of clinical laboratory measurement procedures [94].
Step 1: Determine the Limit of Blank (LoB).
- Prepare two blank samples (a sample matrix without the analyte).
- Using a single reagent batch, measure each blank sample five times per day over three consecutive days, for a total of 30 measurements.
- Calculate the mean and standard deviation of the blank responses. The LoB is typically defined as the mean blank response + 1.645 times the standard deviation of the blank (for a one-sided 95% confidence interval) [94].
Step 2: Determine the Limit of Detection (LOD).
- Prepare two samples with analyte concentrations near the estimated LOD.
- Analyze each sample five times per day over three consecutive days (total of 30 measurements) using a single reagent batch.
- Calculate the mean and standard deviation (σ) of the responses. The LOD can be confirmed as the concentration where the signal-to-noise ratio is approximately 3:1 or calculated using the formula: LOD = LoB + 1.645×(SD of low-level sample) [94]. The classic formula LOD = (3.3 × σ) / S is also widely used, where σ is the standard deviation of the response and S is the slope of the calibration curve [92].
Step 3: Determine the Limit of Quantification (LOQ).
- Prepare a series of samples at concentrations ranging from the LOD to higher multiples of it (e.g., 2x, 3x, 5x LOD).
- Analyze each sample with multiple replicates (e.g., five times per day over three days).
- Calculate the mean, standard deviation, and precision (Coefficient of Variation, CV) for each concentration.
- Plot the CV against the concentration. The LOQ is the lowest concentration at which an acceptable precision (e.g., CV ≤ 20% for bioanalytical methods) is achieved [94]. This can also be calculated as LOQ = (10 × σ) / S [92].
Protocol for Establishing Sensitivity and Specificity
Sensitivity (Diagnostic Sensitivity):
- This is assessed using clinical or spiked samples with known disease states or analyte concentrations.
- The number of true positives (TP) and false negatives (FN) are determined by comparing the test results against a gold-standard reference method.
- Sensitivity is calculated as: [TP / (TP + FN)] × 100% [94].
Specificity (Analytical and Diagnostic):
- Analytical Specificity (Selectivity): Test the method with samples containing potentially interfering substances (e.g., metabolites, structurally similar compounds, excipients in drug products). The method should show no significant response (cross-reactivity) to these interferents. For chromatographic methods, specificity is demonstrated by the baseline resolution of the analyte peak from other components [90].
- Diagnostic Specificity: Test the method with true negative samples (samples confirmed to not contain the analyte). The number of true negatives (TN) and false positives (FP) are determined. Specificity is calculated as: [TN / (TN + FP)] × 100% [94].
For Electrochemical Biosensors:
- Specificity is inherently tied to the biorecognition element. It is validated by testing the sensor against a panel of interfering molecules that are likely to be present in the sample matrix. A highly specific sensor will show a negligible signal for interferents compared to the target analyte [91].
Accuracy and Precision Assessment
Accuracy: The closeness of agreement between the test result and the true value.
- Protocol: Evaluate using a minimum of nine determinations over a minimum of three concentration levels covering the specified range (e.g., 80%, 100%, 120% of the target concentration). Accuracy is reported as percent recovery of the known, spiked amount [90].
Precision: The closeness of agreement between a series of measurements from multiple sampling of the same homogeneous sample.
- Repeatability (Intra-assay Precision): Assessed by multiple injections (n≥5) of the same sample preparation by one analyst on the same instrument on the same day. Expressed as Relative Standard Deviation (RSD) [90].
- Intermediate Precision: Assessed by having different analysts perform the test on different days or with different instruments to establish the method's robustness [90].
The diagram below illustrates the logical relationship and workflow between these core validation parameters.
Data Presentation and Analysis
The following table consolidates the key validation parameters, their definitions, and typical acceptance criteria for a quantitative analytical method in a pharmaceutical context, such as an HPLC assay for a drug product [90].
Table 1: Key Analytical Validation Parameters and Typical Acceptance Criteria
| Parameter | Definition | Typical Acceptance Criteria (e.g., for HPLC Assay) |
|---|---|---|
| Accuracy | Closeness of test results to the true value. | Recovery: 98.0–102.0% for API [90] |
| Precision | Degree of scatter among repeated measurements. | RSD < 2.0% for assay (repeatability) [90] |
| Specificity | Ability to assess the analyte unequivocally in the presence of interferences. | No interference from placebo, impurities, or degradants; peak purity confirmed [90] |
| LOD | Lowest detectable concentration of analyte. | Signal-to-Noise ratio ≥ 3:1 [92] [90] |
| LOQ | Lowest quantifiable concentration with accuracy and precision. | Signal-to-Noise ratio ≥ 10:1; Accuracy 80–120%, Precision RSD ≤ 20% [92] [90] |
| Linearity | Ability to obtain results proportional to analyte concentration. | Correlation coefficient (r) > 0.999 [90] |
| Range | Interval between the upper and lower concentration of analyte. | From LOQ to 120% of test concentration (for assay) [90] |
Exemplary Data from Clinical Validation Studies
High-sensitivity cardiac troponin I (hs-cTnI) assays provide a robust real-world example of rigorous validation in a clinical POC context. The table below summarizes validation data from a study evaluating such an assay, demonstrating the application of these parameters [94].
Table 2: Exemplary Validation Data from a High-Sensitivity Troponin I Assay Study
| Validation Parameter | Result / Strategy | Performance Outcome |
|---|---|---|
| LOD / Strategy | Rule-out NSTEMI if hs-cTnI (0h) < LOD (2 ng/L) | 100% Sensitivity, 14.0% PPV [94] |
| Single Cut-off | Rule-out NSTEMI if hs-cTnI (0h) < 99th URL | Lower sensitivity compared to algorithms [94] |
| 0/1 h Algorithm | Combines 0h concentration and 1h absolute change | High diagnostic performance [94] |
| 0/2 h Algorithm | Combines 0h concentration and 2h absolute change | Best overall: 89.0% Accuracy, 93.3% Sensitivity, 73.68% F1-score [94] |
| LOQ Precision | Imprecision (CV) at the LOQ and 99th URL | CV < 10% at the 99th percentile URL (requirement for hs-cTnI assays) [94] |
The Scientist's Toolkit: Essential Reagents and Materials
Successful development and validation of an electrochemical POC sensor require specific reagents and materials. The following table details these key components.
Table 3: Essential Research Reagent Solutions for Electrochemical Biosensor Validation
| Item | Function in Validation |
|---|---|
| Biorecognition Elements (Enzymes, Antibodies, Aptamers) | Provide the foundational specificity of the sensor by binding selectively to the target analyte [91]. |
| Electrode Materials (Gold, Carbon, ITO, Screen-printed electrodes) | Serve as the solid support and transducer. Their modification is crucial for signal generation and immobilization of biorecognition elements [91]. |
| Chemical Linkers (e.g., NHS/EDC, glutaraldehyde) | Enable the covalent immobilization of biorecognition elements onto the electrode surface, enhancing stability and reproducibility [91]. |
| Standard/Calibrator Solutions | Solutions of the analyte with known, precise concentrations. Essential for constructing calibration curves to determine S, σ, LOD, LOQ, linearity, and accuracy [90]. |
| Synthetic/Artificial Sample Matrix | A placebo or simulated body fluid (e.g., artificial sweat, synthetic urine) used for spiking experiments to validate method accuracy, specificity, and LOD/LOQ in a controlled matrix [90]. |
| Redox Probes (e.g., [Fe(CN)₆]³⁻/⁴⁻) | Used in electrochemical impedance spectroscopy (EIS) or cyclic voltammetry (CV) to characterize electrode surface modification and functionality [91]. |
Analytical validation is a non-negotiable discipline that transforms a prototype sensor into a scientifically and regulatorily credible tool. For electrochemical POC devices in pharmaceutical analysis, a structured approach to assessing sensitivity, specificity, LOD, and LOQ—as outlined in the protocols and frameworks above—is critical. The ongoing advancements in biosensing, driven by innovations in materials science and microfluidics, continue to push the boundaries of detection. Adherence to rigorous validation principles ensures that these innovative devices not only achieve groundbreaking sensitivity but also deliver the accuracy and reliability required to make informed decisions in drug development and patient care.
Phase 0 trials, also known as exploratory Investigational New Drug (IND) studies, represent a strategic approach in early drug development designed to expedite the clinical evaluation of new molecular entities [95]. Established through regulatory guidance from the U.S. Food and Drug Administration (FDA) in 2006, these trials bridge the critical transition from preclinical research to traditional phase I clinical testing [96] [97]. Unlike conventional clinical trials, Phase 0 studies administer subtherapeutic doses of investigational compounds to limited human participants (typically 10-15) for a short duration (usually ≤7 days) with no therapeutic or diagnostic intent [95] [96]. The primary objective is to gather essential human pharmacokinetic (PK) and pharmacodynamic (PD) data before committing substantial resources to large-scale clinical development [97].
The strategic value of Phase 0 trials lies in their potential to enhance drug development efficiency amid rising costs and declining success rates. Traditional drug development consumes 10-15 years and costs exceeding $1 billion, with approximately 75% of costs associated with failures in early developmental stages [95]. Phase 0 approaches address this inefficiency by providing a mechanism for early candidate selection and elimination of non-promising compounds, thereby reducing late-stage attrition rates [98] [97]. By obtaining human data earlier in the development process, researchers can make more informed "go/no-go" decisions, potentially saving years of development time and millions of dollars [99].
Regulatory Framework and Trial Design
International Regulatory Guidelines
The conduct of Phase 0 trials operates under well-defined international regulatory frameworks. The International Conference on Harmonisation (ICH) M3 guidance outlines five distinct approaches for exploratory clinical trials, creating a continuum of permissible human exposure levels with corresponding preclinical requirements [97]. These approaches range from single microdose studies (≤100 μg) requiring minimal preclinical testing, to repeated pharmacologic dose studies (<14 days) demanding more extensive safety evaluation [97]. This graduated framework enables sponsors to match the preclinical investment to the planned human exposure, optimizing resource allocation.
Table 1: ICH M3 Guidelines for Exploratory Clinical Trials
| Parameter | Approach 1 (Microdosing) | Approach 2 (Multiple Microdoses) | Approaches 3-5 (Pharmacologic Doses) |
|---|---|---|---|
| Dose Definition | ≤1/100th of NOAEL and ≤1/100th of pharmacologically active dose | Same as Approach 1 | Starting at subtherapeutic dose, moving into anticipated therapeutic range but <½ NOAEL |
| Cumulative Dose | 100 μg | 500 μg | Not applicable (dose-limited by NOAEL) |
| Dosing Regimen | Single dose (could be divided) | Up to 5 doses | Multiple doses for <14 days |
| Preclinical Toxicology | 14-day extended single-dose toxicity | 7-day repeated-dose toxicity | 14-day repeated-dose toxicity in rodent and non-rodent |
| Genotoxicity Studies | Not recommended (SAR included if available) | Same as Approach 1 | Ames assay + chromosomal damage test |
Phase 0 Trial Design Considerations
Phase 0 trials employ various designs tailored to specific developmental objectives. Common designs include: (1) Target modulation studies that demonstrate drug effects on intended molecular targets in human tissue; (2) Candidate selection studies that compare multiple structurally similar analogs to identify the most promising candidate for development; (3) PK-PD correlation studies that establish relationships between drug exposure and biological effects to inform combination therapy development; and (4) Microdose imaging studies that evaluate biodistribution and target engagement using novel imaging technologies [95].
An optimal Phase 0 candidate exhibits specific characteristics, including a development pathway heavily dependent on PD endpoints, a wide therapeutic window anticipated from preclinical data, target modulation achievable at nontoxic doses within short exposure periods (≤7 days), and availability of validated PD assays capable of demonstrating drug effects with limited sample size [95]. Compounds meeting these criteria stand to benefit most from the Phase 0 approach, particularly targeted therapies where successful development depends on demonstrating precise molecular effects.
Methodological Approaches and Applications
Microdosing and Imaging Strategies
Phase 0 trials employ microdosing (typically 1/100th of the pharmacologically active dose or a maximum of 100 micrograms) to evaluate drug behavior in humans with minimal risk [99]. These studies utilize advanced analytical technologies such as positron emission tomography (PET) and accelerator mass spectrometry (AMS) to track drug distribution and metabolism at subtherapeutic concentrations [98] [96]. In Phase 0 imaging studies, investigational compounds are labeled with radionuclides or fluorescent dyes, allowing researchers to visualize and quantify drug uptake in target tissues through molecular imaging techniques [99]. This approach provides critical data on biodistribution, target engagement, and pharmacokinetics directly in the intended patient population, enabling early assessment of a drug's ability to reach its site of intended action [100].
The cassette microdosing approach represents another innovative application, wherein multiple drug candidates are administered simultaneously to healthy volunteers or patients [98]. This method allows direct comparison of the pharmacokinetic profiles of several compounds in parallel, significantly accelerating candidate selection while reducing animal and human testing requirements [98] [97]. For instance, Kusuhara et al. employed cassette microdosing to compare the pharmacokinetics of newly discovered aromatase inhibitors in healthy Japanese subjects, demonstrating the utility of this approach for efficient candidate prioritization [98].
Pharmacodynamic Assessment in Patients
A distinctive advantage of Phase 0 trials is their ability to evaluate pharmacodynamic effects directly in the target patient population, unlike traditional Phase I trials that typically enroll healthy volunteers [100]. This approach is particularly valuable for diseases with unique physiological barriers, such as glioblastoma, where the blood-brain barrier significantly impacts drug delivery [101]. Phase 0 trials in neuro-oncology have administered investigational agents during the "window" between diagnosis and scheduled surgery, followed by collection of tumor tissue to directly measure drug concentrations and PD effects [101]. This design provides unprecedented insight into drug behavior at the disease site, enabling researchers to confirm target engagement before proceeding to larger efficacy trials.
Table 2: Comparative Analysis of Phase 0 vs. Traditional Phase I Trials
| Parameter | Phase 0 Trials | Traditional Phase I Trials |
|---|---|---|
| Primary Objective | PK/PD assessment, proof-of-concept, candidate selection | Safety, tolerability, maximum tolerated dose determination |
| Participant Population | Target patients or healthy volunteers (5-15 participants) | Primarily healthy volunteers (∼80 participants) |
| Dose Level | Microdose or subtherapeutic pharmacologic dose | Therapeutic doses escalating to maximum tolerated dose |
| Duration | ≤7 days (typically single dose) | Weeks to months |
| Manufacturing Requirements | GLP material often sufficient to start | GMP material mandatory |
| Typical Timeline | 10-14 months | 2-3 years |
| Preclinical Requirements | Reduced toxicology testing | Full toxicology package |
| Regulatory Pathway | Exploratory IND | Traditional IND |
Phase 0 Experimental Protocols
Protocol 1: Microdose Imaging Study for Target Engagement Assessment
4.1.1 Objective To evaluate the biodistribution, pharmacokinetics, and target tissue engagement of a novel therapeutic agent (TRK-Inh-01) in patients with solid tumors using positron emission tomography (PET) imaging.
4.1.2 Background This protocol implements a Phase 0 microdosing approach as described by Lappin and Garner [98], utilizing carbon-14 labeling and accelerator mass spectrometry (AMS) to track drug distribution. The study design follows FDA exploratory IND guidance [96] and aligns with previous successful implementations in oncology drug development [95].
4.1.3 Materials and Reagents
- Investigational Product: TRK-Inh-01 (14C-labeled), GLP-grade, 100 μg maximum dose
- Imaging Agent: [18F]FDG for metabolic assessment (optional)
- Analytical Standards: TRK-Inh-01 reference standard, internal standards for MS
- Sample Collection: EDTA blood collection tubes, urine collection containers, tissue biopsy kits
- Analytical Instruments: PET/CT scanner, liquid chromatography-AMS system, liquid scintillation counter
4.1.4 Methodology
- Participant Selection: Recruit 10 patients with TRK-positive solid tumors accessible for biopsy. Key inclusion criteria: confirmed TRK expression, planned surgical resection, adequate organ function.
- Dosing Administration: Administer single microdose of 14C-labeled TRK-Inh-01 (100 μg) intravenously over 30 minutes.
- PET Imaging Acquisition:
- Perform baseline PET/CT imaging prior to dosing
- Conduct serial PET scans at 1, 4, 24, and 48 hours post-dose
- Acquire dynamic PET imaging for first 60 minutes post-injection
- Reconstruct images using ordered-subset expectation maximization algorithm
- Biological Sample Collection:
- Collect serial blood samples (5 mL) pre-dose and at 0.25, 0.5, 1, 2, 4, 8, 24, 48, and 72 hours post-dose
- Collect total urine output over 0-24 and 24-72 hour intervals
- Obtain tumor and normal tissue samples during scheduled surgical resection (6-8 hours post-dose)
- Sample Processing and Analysis:
- Process plasma by centrifugation at 1500×g for 10 minutes at 4°C
- Homogenize tissue samples in 3 volumes of phosphate buffer (pH 7.4)
- Extract analytes using solid-phase extraction cartridges
- Analyze 14C concentration in all samples using AMS
- Perform metabolite profiling using LC-AMS with gradient elution
- Data Analysis:
- Calculate standard PK parameters (Cmax, Tmax, AUC, t1/2) from plasma concentration data
- Determine tissue-to-plasma ratios for tumor and normal tissues
- Generate time-activity curves from PET imaging data
- Correlative analysis of tumor drug concentration with TRK expression levels
4.1.5 Endpoint Evaluation Primary endpoints: (1) Tumor uptake of TRK-Inh-01 measured by PET SUVmax; (2) Tumor-to-plasma ratio based on AMS analysis. Secondary endpoints: (1) Metabolic stability in plasma; (2) Relationship between tumor drug concentration and target expression.
Protocol 2: Electrochemical Simulation of Hepatic Metabolism
4.2.1 Objective To establish an electrochemical system for simulating Phase I hepatic metabolism of voriconazole using screen-printed electrodes (SPE), enabling rapid prediction of human metabolic profiles.
4.2.2 Background This protocol adapts methodology from recent pharmaceutical electroanalysis research [102] [2], utilizing electrochemical oxidation to generate and characterize drug metabolites. The approach provides a complementary method to traditional human liver microsome assays with advantages in speed and cost-effectiveness.
4.2.3 Materials and Reagents
- Electrochemical Cells: Screen-printed electrodes (carbon, FePc-modified, MXene-modified)
- Pharmaceutical Compound: Voriconazole reference standard (≥98% purity)
- Electrolyte Solutions: Phosphate buffer (0.1 M, pH 7.4), acetate buffer (0.1 M, pH 5.0)
- Analytical Standards: Voriconazole N-oxide, 4-hydroxyvoriconazole
- Chromatography: UHPLC system with C18 column (100 × 2.1 mm, 1.7 μm)
- Detection: Q-TOF mass spectrometer with electrospray ionization source
4.2.4 Methodology
- Electrode Preparation:
- Activate carbon SPEs by cycling in 0.5 M H2SO4 from 0 to +1.5 V (10 cycles)
- Modify selected electrodes with iron phthalocyanine (FePc) by drop-casting 5 μL of 2 mM FePc solution in DMF
- Dry modified electrodes under nitrogen atmosphere for 2 hours
- Electrochemical Metabolism Simulation:
- Prepare 1 mM voriconazole solution in phosphate buffer (0.1 M, pH 7.4)
- Apply potential sweep from 0 to +1.2 V vs. Ag/AgCl at scan rate of 50 mV/s
- Perform bulk electrolysis at constant potential of +0.9 V for 60 minutes
- Maintain solution temperature at 37°C with continuous stirring
- Sample Workup:
- Terminate electrolysis and transfer solution to centrifugal filter units (3 kDa MWCO)
- Concentrate samples under nitrogen stream at 40°C
- Reconstitute in 100 μL methanol:water (1:1, v/v) for LC-MS analysis
- Metabolite Separation and Identification:
- Inject 5 μL sample onto UHPLC system maintained at 40°C
- Apply gradient elution: 5-95% acetonitrile in water (0.1% formic acid) over 15 minutes
- Operate MS in positive ionization mode with mass range 50-600 m/z
- Fragment precursor ions using collision energies of 10-40 eV
- Data Processing:
- Identify potential metabolites by mass defect filtering (±50 mDa)
- Confirm structures by comparison with authentic standards where available
- Perform semi-quantification based on peak area relative to internal standard
4.2.5 Endpoint Evaluation Primary endpoints: (1) Correlation between electrochemical and HLM metabolite profiles; (2) Identification of major oxidative metabolites. Secondary endpoints: (1) Optimization of electrode material for specific metabolic reactions; (2) Prediction of in vivo metabolic stability.
Integration with Electrochemical Analysis Platforms
Advanced Electroanalytical Techniques for Pharmaceutical Analysis
Electroanalysis has emerged as a powerful tool in pharmaceutical research, offering high sensitivity, minimal sample requirements, and capacity for real-time monitoring [2]. These attributes align perfectly with the objectives of Phase 0 development, particularly in assessing drug metabolism and pharmacokinetic properties. Modern electroanalytical techniques including voltammetry, amperometry, and potentiometry enable researchers to study redox behavior of drug molecules, simulate metabolic pathways, and detect low concentrations of analytes in complex biological matrices [2].
Recent innovations in electrode materials have significantly enhanced electrochemical capabilities for pharmaceutical analysis. Nanostructured electrodes, particularly those modified with phthalocyanines or two-dimensional materials like MXene, demonstrate improved catalytic properties and expanded electrochemical windows [102] [103]. These advanced materials facilitate more efficient simulation of oxidative metabolic reactions, potentially serving as complementary approaches to traditional liver microsome and hepatocyte assays during early drug screening [102]. The integration of computational chemistry with electrochemical sensor design further optimizes molecular recognition elements, creating highly specific detection systems for targeted biomarker analysis [103].
Point-of-Care Electrochemical Devices
The development of portable electrochemical point-of-care (POC) testing devices represents a significant advancement with potential applications across the drug development continuum [2] [103]. These miniaturized systems, often based on screen-printed electrode technology, enable rapid analysis of drug concentrations and biomarkers in clinical settings [103]. For Phase 0 trials, such devices could facilitate real-time therapeutic monitoring or PD biomarker assessment, providing immediate data to inform developmental decisions.
Research Reagent Solutions for Electrochemical Analysis
| Reagent/Category | Example Products | Primary Function |
|---|---|---|
| Screen-Printed Electrodes | Carbon SPEs, Gold SPEs, FePc-modified SPEs | Provide customizable, disposable electrode platforms for electrochemical analysis |
| Electrode Modifiers | MXene dispersions, Phthalocyanine complexes, Molecularly imprinted polymers | Enhance sensitivity, selectivity, and catalytic properties of electrode surfaces |
| Electrochemical Cells | Miniaturized 3-electrode cells, Flow-through cells | Enable controlled electrochemical experiments with minimal sample volumes |
| Redox Mediators | Ferrocene derivatives, Methylene blue, Hexaammineruthenium(III) chloride | Facilitate electron transfer in complex biological matrices |
| Buffer Systems | Phosphate buffers (pH 7.4), Acetate buffers (pH 5.0) | Maintain physiological relevance in electrochemical simulations |
Molecularly imprinted polymers (MIPs) represent another innovation with particular relevance to Phase 0 studies. These synthetic recognition elements can be designed for specific binding to drug molecules or biomarkers, creating highly selective sensors when combined with electrochemical transducers [103]. Recent paradigm shift designs in MIP development utilize computational chemistry to optimize pre-polymerization complexes, significantly enhancing recognition efficiency for specific targets such as disease biomarkers [103]. This approach enables development of highly specific sensors capable of operating in complex biological fluids, potentially supporting PD endpoint assessment in early clinical trials.
Strategic Implementation and Decision Framework
Go/No-Go Decision Making
The primary strategic value of Phase 0 trials lies in their capacity to inform critical development decisions before substantial resources are committed to large-scale clinical testing [97] [99]. A well-executed Phase 0 study provides human data that enhances candidate selection confidence, potentially reducing the high failure rates characteristic of traditional drug development [95]. The decision framework following Phase 0 investigation typically centers on PK and PD outcomes, with promising candidates demonstrating favorable tissue distribution, target engagement, and pharmacokinetic profiles [95].
The economic rationale for Phase 0 implementation is compelling. Traditional preclinical and Phase I programs require investments of €5-15 million, whereas Phase 0 trials typically cost €400,000-1.2 million, representing significant potential savings through early elimination of non-viable candidates [99]. This "de-risking" mechanism is particularly valuable for biotech companies and investors, as positive Phase 0 data increases the probability of success in later clinical trials by 73% [99]. Furthermore, Phase 0 approaches can reduce development timelines by 12-24 months compared to traditional pathways, accelerating time to market for promising therapeutics [100] [99].
Application in Specific Therapeutic Areas
Phase 0 approaches have demonstrated particular utility in therapeutic areas with unique developmental challenges, such as neuro-oncology. For glioblastoma (GBM), where over 91% of Phase III trials fail and the average duration from Phase II to Phase III completion is 7.2 years, Phase 0 and window-of-opportunity trials provide a mechanism to rapidly assess blood-brain barrier penetration and target modulation before committing to large-scale studies [101]. These trials leverage the period between diagnosis and scheduled surgery to administer investigational agents, followed by tissue collection during resection to directly measure drug effects in the tumor microenvironment [101].
The window-of-opportunity trial design represents an evolution of the Phase 0 concept, incorporating therapeutic intent through administration of higher, potentially active doses for limited durations [101]. This approach maintains the key advantages of traditional Phase 0 studies—including rapid evaluation and early decision-making—while providing preliminary efficacy signals that can inform subsequent trial design. The successful application of these approaches in challenging disease areas demonstrates their potential to enhance development efficiency across multiple therapeutic domains, particularly for molecularly targeted agents where establishing proof-of-mechanism in human tissue is critical for developmental success [101] [95].
Phase 0 proof-of-concept trials represent a transformative approach to drug development, offering a strategic methodology for streamlining the transition from preclinical discovery to clinical evaluation. By providing early human pharmacokinetic and pharmacodynamic data through limited human exposure studies, Phase 0 approaches enable more informed candidate selection and resource allocation, potentially reducing late-stage attrition rates that have plagued traditional development pathways. The integration of advanced analytical technologies, including molecular imaging and electrochemical analysis platforms, further enhances the information yield from these studies, creating unprecedented opportunities for early assessment of drug behavior in humans.
As drug development grows increasingly complex and costly, the implementation of innovative approaches like Phase 0 trials becomes essential for sustaining pharmaceutical innovation. The established regulatory frameworks, validated methodologies, and accumulating evidence of successful application across therapeutic areas provide a solid foundation for broader adoption of these strategies. Future advances in analytical technologies, particularly in miniaturized electrochemical sensors and point-of-care testing devices, will likely expand further the utility and applications of Phase 0 approaches, cementing their role as a cornerstone of efficient, evidence-driven drug development.
The selection of an appropriate analytical technique is a cornerstone of pharmaceutical research and development, directly impacting the accuracy, efficiency, and cost-effectiveness of drug analysis. This is particularly critical in the emerging field of point-of-care (POC) diagnostic devices, where the ideal method must balance sensitivity, speed, and portability [93] [2]. Electrochemical methods, spectrophotometry, and chromatography represent three foundational pillars of pharmaceutical analysis, each with distinct strengths and operational paradigms.
This application note provides a structured comparison of these techniques, framing them within the context of developing electrochemical devices for point-of-care pharmaceutical analysis. We summarize their key characteristics, provide detailed experimental protocols for quantifying a model analyte, and present a decision framework to guide researchers in selecting the most suitable method for their specific application, with a special focus on the needs of decentralized, rapid testing.
The table below summarizes the core performance characteristics and practical considerations of electrochemical, spectrophotometric, and chromatographic methods, drawing from comparative studies and recent reviews [104] [105].
Table 1: Comparative Analysis of Pharmaceutical Analytical Techniques
| Feature | Electrochemical Methods | Spectrophotometric Methods | Chromatographic Methods (e.g., HPLC) |
|---|---|---|---|
| Typical Sensitivity & Dynamic Range | Nanomolar (nM) to Picomolar (pM) [104] | Micromolar (µM) to Milligram (mg) range [104] [106] | Micromolar (µM) to Nanomolar (nM) [104] |
| Analysis Time | Seconds to minutes (real-time monitoring possible) [2] | Minutes (including reaction incubation) [104] | Minutes to tens of minutes per sample [104] |
| Cost & Accessibility | Low-cost instrumentation; highly suitable for miniaturization [93] [2] | Low-cost, widely available instruments [107] [108] | High-cost instrumentation and maintenance [105] |
| Sample Volume | Microliters (µL) [2] | Milliliters (mL) [104] | Microliters (µL) for injection [104] |
| Key Advantages | High sensitivity, portability, cost-effectiveness, minimal sample prep, real-time analysis [93] [2] | Simplicity, cost-effectiveness, high throughput, suitability for colored analytes [105] [108] | High selectivity, ability to separate complex mixtures, well-established validation protocols [104] [109] |
| Primary Limitations | Susceptibility to electrode fouling; can be less selective for complex mixtures without sensor modification [2] | Generally requires chromophores; limited for analyzing complex mixtures without separation [105] | Expensive, requires skilled operators, not portable, often uses large volumes of organic solvents [105] |
Experimental Protocols for Hydrogen Sulfide Quantification
The following section provides detailed methodologies for quantifying Hydrogen Sulfide (H₂S), an endogenous gasotransmitter with therapeutic potential, using each technique. This direct comparison of protocols for the same analyte highlights the practical differences in their execution [104].
Electrochemical Protocol: Voltametric Technique
Principle: This method measures the current generated by the oxidation or reduction of H₂S at an electrode surface under an applied voltage [2].
Workflow:
Materials & Reagents:
- Lazar Sulfide Electrode (Shelf Scientific): The working electrode for signal detection [104].
- Sodium Salicylate, Ascorbic Acid, NaOH: Components of the antioxidant buffer to stabilize sulfide and prevent oxidation [104].
- Sodium Hydrogen Sulfide (NaSH): Standard H₂S donor for calibration [104].
Procedure:
- DAOB Preparation: Prepare a Diluted Antioxidant Buffer (DAOB) by a four-fold dilution of a stock antioxidant buffer (containing sodium salicylate, ascorbic acid, and NaOH) with deionized water. No heating is required for the DAOB [104].
- Standard Solution Preparation: Prepare a 1000 µM stock solution of NaSH in DAOB. This stock is stable under refrigeration for up to 30 days. Create a series of standard solutions (e.g., from 0.1 µM upwards) by dilution with DAOB [104].
- Electrode Calibration: Soak the sulfide electrode in the lowest standard (e.g., 0.1 µM) for 30 minutes. Rinse with deionized water and record a baseline measurement in fresh DAOB. Subsequently, measure the stabilized signal (mV) for each standard solution from the lowest to the highest concentration [104].
- Sample Measurement: Introduce the unknown sample and record the stabilized mV reading.
- Quantification: Construct a calibration curve by plotting the signal (mV) against the concentration (µM) of the standards. Use the resulting regression equation to determine the concentration of H₂S in the unknown sample [104].
Spectrophotometric Protocol: Colorimetric Technique
Principle: This method relies on the reaction of H₂S with N,N-diethyl-p-phenylenediamine and ferric chloride (FeCl₃) in an acidic medium to form methylene blue, a colored compound quantified by its absorbance [104].
Workflow:
Materials & Reagents:
- N,N-diethyl-p-phenylenediamine: The primary amine for dye formation [104].
- Ferric Chloride (FeCl₃): Oxidizing agent that catalyzes the formation of methylene blue [104].
- Hydrochloric Acid (HCl): Provides the acidic medium required for the reaction [104].
- Microplate Reader: Instrument to measure absorbance of the colored complex in a 96-well plate [104].
Procedure:
- Mixed Diamine Reagent Preparation: Add 33 µL of N,N-diethyl-p-phenylenediamine to 10 mL of 7.2 M hydrochloric acid to prepare the diamine solution. In a separate container, dissolve 48 mg of FeCl₃ in 10 mL of 1.2 M hydrochloric acid. Mix the two solutions to form the final mixed diamine reagent. Store refrigerated [104].
- Standard Solution Preparation: Prepare a stock solution of NaSH in a suitable medium like Simulated Tear Fluid (STF) or Phosphate-Buffered Saline (PBS), pH 7.4. Prepare a series of standard solutions by dilution [104].
- Colored Complex Formation: Add 20 µL of the mixed diamine reagent to 1 mL of each standard or unknown sample. Vortex the mixture and let it stand undisturbed for 10 minutes at room temperature to allow for full color development [104].
- Absorbance Measurement: Transfer 200 µL of the solution to a 96-well plate. Measure the absorbance at a wavelength of 671 nm using a microplate reader [104].
- Quantification: Construct a calibration curve by plotting absorbance against the concentration of the standards. Use the regression equation to calculate the H₂S concentration in the unknown sample [104].
Chromatographic Protocol: HPLC with Post-Column Derivatization
Principle: This method separates H₂S from other compounds via HPLC, followed by post-column reaction with the diamine reagent to form methylene blue, which is detected optically [104].
Workflow:
Materials & Reagents:
- HPLC System with C-18 Column: For the high-resolution separation of analytes [104].
- PDA UV-Vis Detector: Detects the eluting colored complex [104].
- Acetonitrile & Ammonium Formate: Components of the mobile phase for isocratic elution [104].
- Mixed Diamine Reagent: Same reagent as used in the spectrophotometric method for derivatization [104].
Procedure:
- Standard Solution Preparation: Prepare NaSH standard solutions in the concentration range of 0.04 to 5.60 µg/mL using STF or PBS as the solvent [104].
- Post-Column Derivatization: Add 100 µL of the mixed diamine reagent to a 5-ml aliquot of the standard or sample solution after it elutes from the HPLC column. Shake the mixture vigorously and let it stand for 10 minutes [104].
- Chromatographic Separation & Detection: Inject a 20-µL aliquot of the derivatized solution into the HPLC system. Use an Alltech C-18 column (150 mm × 4.6 mm, 5 µm) with an isocratic mobile phase of acetonitrile and 15 mM ammonium formate (70:30, v/v) at a flow rate of 1.2 ml/min. The total run time is 6 minutes, with H₂S eluting at approximately 3.3 minutes. Detect the analyte using a Photo-Diode Array (PDA) UV-Vis detector set at 670 nm [104].
- Quantification: Construct a calibration curve by plotting the peak area against the concentration of the standards to quantify the H₂S in unknown samples [104].
The Scientist's Toolkit: Essential Research Reagents
The following table lists key reagents and their functions in the featured H₂S quantification experiments [104].
Table 2: Key Research Reagents for H₂S Quantification
| Reagent / Material | Function in the Assay |
|---|---|
| Sodium Hydrogen Sulfide (NaSH) | Standard, fast-releasing H₂S donor used for preparing calibration standards. |
| Simulated Tear Fluid (STF) / PBS | Aqueous media simulating physiological conditions for release and quantification studies. |
| N,N-diethyl-p-phenylenediamine | Reacts with H₂S in the presence of an oxidizer to form the methylene blue chromophore. |
| Ferric Chloride (FeCl₃) | Oxidizing agent that catalyzes the reaction between sulfide and the diamine reagent. |
| Antioxidant Buffer (Sodium Salicylate, Ascorbic Acid) | Stabilizes sulfide in standard solutions by preventing its oxidation, ensuring accurate quantification. |
| C-18 HPLC Column | Stationary phase for chromatographic separation of the derivatized H₂S from other components. |
The choice between electrochemical, spectrophotometric, and chromatographic methods is not a matter of identifying a single superior technique, but rather of matching the method to the specific analytical problem. As summarized in this application note, electrochemical methods are unparalleled for point-of-care pharmaceutical analysis due to their superior sensitivity, rapid response, low cost, and innate potential for miniaturization into portable and wearable sensors [104] [93] [2].
Spectrophotometry remains a robust, simple, and cost-effective solution for routine quality control of formulations where sensitivity requirements are less stringent [108]. Chromatography is the established reference technique for highly complex mixtures requiring definitive separation and quantification [109]. The ongoing integration of nanotechnology and artificial intelligence with electroanalysis is poised to further enhance the sensitivity and intelligence of the next generation of point-of-care diagnostic devices, solidifying its role as a cornerstone of modern pharmaceutical research and personalized medicine [2].
Regulatory Pathways and Commercialization Challenges beyond Glucose Monitoring
The field of point-of-care (POC) testing is experiencing significant transformation, moving beyond the established domain of glucose monitoring toward sophisticated pharmaceutical and clinical applications. The global POC testing market, valued at USD 42 billion in 2024, is projected to reach USD 82 billion by 2034, growing at a compound annual growth rate (CAGR) of 7% [46]. This expansion is largely driven by the rising prevalence of chronic and infectious diseases, technological advancements in diagnostic platforms, and increasing investment in research and development. Electrochemical sensors, known for their high sensitivity, rapid response, and cost-effectiveness, are at the forefront of this evolution, enabling the detection of a diverse range of analytes, including therapeutic drugs, antibodies, and specific biomarkers, directly at the patient's location [110].
However, the journey from innovative research to commercial success for these advanced electrochemical devices is fraught with challenges. Developers must navigate a complex regulatory landscape, overcome significant scientific barriers, and address commercialization hurdles specific to novel diagnostic platforms. This document outlines the critical regulatory pathways, details major commercialization challenges, and provides standardized experimental protocols for developing electrochemical sensors for pharmaceutical analysis at the point of care, providing researchers and drug development professionals with a practical framework for advancing their technologies toward clinical application.
Regulatory Pathways for Electrochemical POC Devices
Navigating the regulatory landscape is a critical step in the commercialization of any medical device. The requirements vary by region but share common principles focused on safety and efficacy.
Regional Regulatory Frameworks
United States (FDA) The U.S. Food and Drug Administration (FDA) classifies medical devices into three risk-based categories:
- Class I: Low-risk devices (e.g., manual stethoscopes) subject to general controls.
- Class II: Moderate-risk devices (e.g., most POC diagnostic devices, including electrochemical sensors) requiring special controls, such as performance standards and post-market surveillance.
- Class III: High-risk devices (e.g., implantable sensors) requiring pre-market approval (PMA) to demonstrate safety and effectiveness [111].
For electrochemical POC devices, which typically fall under Class II, the 510(k) premarket notification pathway is most common, requiring demonstration of substantial equivalence to a legally marketed predicate device. The FDA also provides specific guidelines for software integration, data encryption, and wireless connectivity, which are increasingly relevant for modern, connected POC devices [111].
European Union (EU) In the European Union, the Medical Device Regulation (MDR) and In Vitro Diagnostic Regulation (IVDR) govern medical devices. These regulations raise the bar for clinical evidence, post-market surveillance, and device traceability. A key requirement is the implementation of a Unique Device Identification (UDI) system to enhance tracking throughout the device lifecycle [111].
Global Harmonization The International Medical Device Regulators Forum (IMDRF) works toward creating consistency in regulatory requirements across different countries. However, many countries—particularly in parts of Asia and Africa—still have developing regulatory systems, which can complicate global market access [111]. Emerging regulations, such as the EU's Artificial Intelligence Act (scheduled for 2026), will also directly impact AI-powered biosensors, requiring developers to assess algorithmic risk, especially for devices that provide treatment recommendations [111].
Strategic Regulatory Considerations
- Pre-Submission Meetings: Engaging with regulatory bodies (e.g., FDA) early via pre-submission meetings can provide valuable feedback on testing requirements and data needs.
- Quality Management Systems (QMS): Implementation of a QMS compliant with regulations (e.g., ISO 13485) is mandatory for manufacturing and is routinely audited by regulatory agencies.
- Real-World Evidence (RWE): Regulators are increasingly accepting RWE to support device performance, especially for post-market studies and for devices targeting rare diseases. The EU's DARWIN project is an example of an initiative collecting real-world data from wearables to support faster approvals [111].
Diagram: Regulatory Pathway for POC Devices. The process varies based on device risk classification (Class I, II, or III). PMA: Pre-Market Approval; QMS: Quality Management System.
Commercialization Challenges and Strategic Solutions
The path to a successful commercial electrochemical POC device is complex. Beyond regulatory hurdles, developers face multiple scientific, technical, and market-related challenges.
Key Commercialization Challenges
Table 1: Key Commercialization Challenges and Potential Mitigation Strategies
| Challenge Category | Specific Challenge | Potential Mitigation Strategy |
|---|---|---|
| Scientific & Technical | Lack of general methods to obtain receptors for a broad range of targets [112] | Utilize functional nucleic acids (DNAzymes, aptamers) obtained via SELEX [112] |
| Difficulty transducing selective binding into different signals [112] | Employ modular sensor designs with standardized transduction components [112] | |
| Limited sensor selectivity in complex real-world samples (e.g., blood) [112] | Implement sample processing steps and leverage multi-parameter sensing to identify false positives | |
| Tunable dynamic range to match application thresholds [112] | Incorporate engineered biomolecular components (e.g., aptamers, enzymes) with tunable affinity [112] | |
| Regulatory & Validation | Stringent and evolving regulatory frameworks [46] [111] | Engage in early and frequent dialogue with regulators; utilize "regulatory sandboxes" where available [111] |
| Costly and lengthy clinical validation, especially for multi-analyte sensors [111] | Design multi-site validation studies early; leverage real-world evidence (RWE) where accepted by regulators [111] | |
| Market & Business | High cost of product development and manufacturing [46] | Pursue public-private partnerships and explore tiered pricing models for different markets [111] |
| Reimbursement uncertainty and variability across regions [111] | Conduct early Health Technology Assessments (HTAs) to demonstrate value to payers [111] | |
| Data privacy, security, and ethical concerns for connected devices [111] | Integrate robust encryption and cybersecurity features by design; ensure transparent data policies [111] |
A significant scientific barrier is the lack of general methods to obtain receptors for novel targets. While antibodies are commonly used, they can be difficult to generate for toxic or small-molecule targets and may suffer from stability issues. A promising solution involves the use of Functional Nucleic Acids (FNAs), such as aptamers, DNAzymes, and aptazymes, which can be selected in vitro via the SELEX (Systematic Evolution of Ligands by EXponential enrichment) process to bind a wide array of targets with high affinity and specificity [112]. Furthermore, integrating sensors with digital health platforms (e.g., Bluetooth/Wi-Fi for syncing with Electronic Health Records) is a major trend that enhances clinical utility but introduces challenges related to data security and interoperability that must be addressed [46] [111].
Experimental Protocols for Sensor Development and Validation
This section provides a detailed, step-by-step protocol for developing and validating an electrochemical aptamer-based sensor for the detection of a target analyte, such as a specific antibiotic or cardiac biomarker.
Protocol: Fabrication of a Nanomaterial-Modified Electrochemical Aptasensor
1. Objective To fabricate a sensitive and selective electrochemical sensor by immobilizing a target-specific DNA aptamer onto a nanostructured electrode surface for the quantitative detection of a model pharmaceutical analyte.
2. Research Reagent Solutions & Materials
Table 2: Essential Research Reagents and Materials
| Item | Function/Description | Example Supplier/Product |
|---|---|---|
| Screen-Printed Carbon Electrode (SPCE) | Disposable, portable, and cost-effective electrochemical transducer. | Metrohm AG, Mettler-Toledo [113] |
| Nanostructured Carbon Material | Enhances electrode surface area and electron transfer kinetics (e.g., Graphene, Carbon Nanotubes). | Sigma-Aldrich (Thermo Fisher) [110] |
| Thiol- or Amino-Modified DNA Aptamer | The biological recognition element that binds the target with high specificity. | Integrated DNA Technologies |
| Crosslinker Chemistry | Facilitates covalent attachment of the aptamer to the electrode (e.g., EDC/NHS for carboxyl groups). | Thermo Fisher Scientific [114] |
| Electrochemical Probe | A redox molecule that generates a measurable current signal (e.g., Methylene Blue, Ferricyanide). | Sigma-Aldrich |
| Blocking Agent | Reduces non-specific binding on the electrode surface (e.g., Bovine Serum Albumin - BSA). | Rockland Immunochemicals [114] |
| Buffer Salts | Maintain stable pH and ionic strength for biomolecule stability and reactions (e.g., PBS, Tris-HCl). | Bio-Rad Laboratories [114] |
3. Step-by-Step Procedure
Step 1: Electrode Pretreatment
- Clean the working electrode surface of the SPCE by performing 10 cycles of Cyclic Voltammetry (CV) in a 0.1 M H₂SO₄ solution from 0 V to +1.0 V (vs. Ag/AgCl reference) at a scan rate of 100 mV/s.
- Rinse thoroughly with deionized water and dry under a gentle stream of nitrogen gas.
Step 2: Electrode Modification with Nanomaterials
- Prepare a 1 mg/mL dispersion of graphene oxide (GO) in deionized water and sonicate for 30 minutes to achieve a homogeneous suspension.
- Drop-cast 5 µL of the GO suspension onto the pre-treated working electrode area and allow it to dry at room temperature.
- Electrochemically reduce the GO to reduced graphene oxide (rGO) by performing 5 cycles of CV in 0.1 M phosphate buffer saline (PBS, pH 7.4) from -0.8 V to -1.5 V at 50 mV/s. This step enhances the conductivity of the nanomaterial layer.
Step 3: Aptamer Immobilization
- Activate the carboxyl groups on the rGO surface by incubating the electrode with a mixture of 20 mM EDC (1-ethyl-3-(3-dimethylaminopropyl)carbodiimide) and 50 mM NHS (N-hydroxysuccinimide) in MES buffer (pH 5.5) for 30 minutes.
- Rinse the electrode with PBS to remove excess EDC/NHS.
- Incubate the electrode with 20 µL of a 1 µM solution of amino-modified DNA aptamer in PBS for 2 hours at room temperature. The amino group on the aptamer will covalently bind to the activated carboxyl groups on the electrode.
- Rinse with PBS to remove any unbound aptamer.
Step 4: Surface Blocking
- To minimize non-specific adsorption, incubate the modified electrode with 1% (w/v) BSA in PBS for 30 minutes.
- Rinse gently with PBS. The sensor is now ready for use.
Diagram: Aptasensor Fabrication Workflow. The process involves electrode preparation, nanomaterial modification, biorecognition layer immobilization, and analytical measurement.
Protocol: Analytical Validation of the Electrochemical Sensor
1. Objective To assess the key analytical performance metrics of the fabricated sensor, including sensitivity, selectivity, and reproducibility.
2. Step-by-Step Procedure
Step 1: Calibration Curve and Sensitivity (LOD/LOQ)
- Prepare a series of standard solutions of the target analyte in a relevant matrix (e.g., buffer or spiked serum) across a concentration range (e.g., 1 pM to 100 nM).
- For each standard, incubate the sensor with the solution for a fixed time (e.g., 10 minutes).
- Perform Square Wave Voltammetry (SWV) in a solution containing a redox probe (e.g., 5 mM Ferricyanide). SWV parameters: potential range from -0.5 V to +0.5 V, amplitude 25 mV, frequency 15 Hz.
- Plot the peak current (or the change in peak current, ΔI) versus the logarithm of the analyte concentration.
- Calculate the Limit of Detection (LOD) as 3.3σ/S and the Limit of Quantification (LOQ) as 10σ/S, where σ is the standard deviation of the blank response and S is the slope of the calibration curve.
Step 2: Selectivity Testing
- Incubate the sensor with solutions of potential interfering substances that may be present in the real sample (e.g., structurally similar drugs, common serum proteins, or ions) at concentrations significantly higher than the target analyte.
- Measure the sensor response and compare it to the response from the target analyte. A robust sensor should show minimal signal change from interferents.
- For aptamer-based sensors, a negative control using a scrambled nucleotide sequence can be used to confirm the specificity of the response.
Step 3: Reproducibility and Stability
- Fabricate at least five independent sensors (n=5) following the same protocol.
- Measure the response of each sensor to the same concentration of the target analyte (e.g., at the midpoint of the dynamic range).
- Calculate the relative standard deviation (RSD) of the responses to determine inter-sensor reproducibility.
- To assess stability, store the fabricated sensors at 4°C and measure their response to a standard analyte solution over several days or weeks to determine the shelf life.
The Scientist's Toolkit: Key Reagents and Instrumentation
Successful development of electrochemical POC devices relies on a suite of specialized reagents and instruments.
Table 3: Key Instrumentation for Research and Development
| Instrument Category | Key Function | Example Models/Suppliers |
|---|---|---|
| Potentiostat/Galvanostat | Core instrument for applying potentials and measuring currents in electrochemical experiments. | Palmsens, Metrohm Autolab, Biologic VSP series [113] |
| Screen-Printer | For in-house fabrication of low-cost, disposable electrodes. | MPM-SPM series, DEK Horizon series |
| Electrochemical Meters | Portable, often handheld devices for specific measurements (pH, conductivity, specific ions). | Hanna Instruments, Thermo Fisher Scientific, Mettler-Toledo [113] |
| Ion Chromatographs | For separation and detection of ionic species, useful for characterizing sensor environments. | Thermo Fisher Scientific, Metrohm AG [113] |
The advancement of electrochemical devices beyond glucose monitoring represents a significant opportunity to revolutionize point-of-care pharmaceutical analysis and personalized medicine. While the market potential is substantial, success hinges on a strategic approach that simultaneously addresses the multifaceted scientific, regulatory, and commercial challenges. The integration of novel recognition elements like functional nucleic acids, coupled with advanced nanomaterials and strategic regulatory planning, provides a clear path forward. By adhering to rigorous development and validation protocols, such as those outlined in this document, researchers and developers can enhance the translational potential of their technologies, ultimately contributing to a new generation of decentralized, accessible, and reliable diagnostic tools.
The integration of electrochemical devices into point-of-care (POC) pharmaceutical analysis represents a paradigm shift in diagnostic medicine. Point-of-care testing (POCT) is defined as clinical laboratory testing conducted close to the site of patient care, where the result can lead to an immediate change in patient management [62]. The evolution of these technologies, guided by the World Health Organization's ASSURED criteria (Affordable, Sensitive, Specific, User-friendly, Rapid and robust, Equipment-free, and Deliverable to end-users), is revolutionizing how researchers and clinicians approach infectious disease and cancer diagnostics [62] [14]. This application note explores groundbreaking case studies within the framework of electrochemical biosensing, detailing specific experimental protocols and analytical performance data to guide research and development professionals in pharmaceutical sciences.
Electrochemical POCT Platform Fundamentals
Electrochemical biosensors are analytical devices that combine a biological recognition element with an electrochemical transducer to produce a quantifiable signal proportional to the concentration of a target analyte [60]. Their relevance to pharmaceutical analysis stems from their fast response, minimal reagent consumption, high selectivity, and customizability for specific biomarkers [60] [115].
The core components of these systems include:
- Bioreceptors: Antibodies, aptamers, enzymes, or nucleic acids that provide specificity for the target biomarker.
- Transducer Platform: The electrode system, often enhanced with nanomaterials, that converts the biological binding event into a measurable electrical signal.
- Data Interpretation: Increasingly powered by machine learning (ML) algorithms to enhance sensitivity, accuracy, and multiplexing capabilities [14].
Table 1: Core Components of Electrochemical POCT Devices for Diagnostic Applications
| Component Category | Specific Examples | Function in the Diagnostic System |
|---|---|---|
| Bioreceptors | Anti-CEA antibodies, Anti-IL-6 aptamers, PSA-binding peptides | Provide high specificity by binding exclusively to the target biomarker (e.g., cancer antigen, inflammatory cytokine). |
| Transducer Materials | Screen-printed carbon electrodes (SPCEs), Gold nanoparticles (AuNPs), Carbon nanotubes (CNTs), Graphene oxides | Facilitate electron transfer and signal amplification; nanomaterials increase the active surface area and enhance sensitivity. |
| Signal Measurement | Amperometry, Voltammetry (DPV, SWV), Electrochemical Impedance Spectroscopy (EIS) | Quantify the electrochemical change (current, potential, impedance) resulting from the biomarker-bioreceptor interaction. |
Case Study 1: Multiplexed Detection of Inflammatory Biomarkers for Infectious Disease Triage
Background and Research Question
Rapid triage of patients with suspected severe infections requires differentiating between general inflammation and specific pathogens. A 2022 study demonstrated a disposable electrochemical POC sensor for the simultaneous quantification of key pro-inflammatory cytokines, IL-6 and TNF-α, which are critically elevated in severe bacterial infections and sepsis [60]. This addresses the need for a rapid test to guide antibiotic therapy and avoid misuse.
Experimental Protocol
1. Sensor Fabrication and Modification:
- Substrate: Start with commercially available screen-printed carbon electrodes (SPCEs).
- Nanomaterial Functionalization: Drop-cast a suspension of carboxylated multi-walled carbon nanotubes (MWCNTs) onto the working electrode surface. Dry at room temperature.
- Bioreceptor Immobilization: Covalently immobilize specific capture antibodies against IL-6 and TNF-α onto the MWCNT/SPCE platform using EDC/NHS cross-linking chemistry. Wash thoroughly to remove unbound antibodies.
- Blocking: Incubate the electrode with a solution of Bovine Serum Albumin (BSA) to block non-specific binding sites.
2. Sample Analysis and Measurement:
- Incubation: Apply 50 µL of the patient sample (e.g., serum, saliva) or standard solution to the modified electrode surface. Incubate for 15 minutes to allow antigen-antibody binding.
- Washing: Rinse the electrode with a clean buffer solution to remove unbound materials.
- Signal Generation: Incubate with a secondary antibody labeled with an enzymatic tag (e.g., Horseradish Peroxidase - HRP). The addition of an enzymatic substrate (e.g., TMB/H₂O₂) generates an electrochemical reaction.
- Detection: Use square wave voltammetry (SWV) to measure the reduction current of the enzymatic product. The measured current is directly proportional to the concentration of the target cytokine [60].
The following workflow diagram illustrates the experimental and data analysis process:
Key Results and Data Analysis
The developed sensor demonstrated performance comparable to laboratory-based tests but at the point-of-care.
Table 2: Analytical Performance of the Electrochemical Cytokine Sensor
| Performance Parameter | IL-6 | TNF-α |
|---|---|---|
| Detection Limit | 0.5 pg/mL | 1.0 pg/mL |
| Linear Range | 1 - 500 pg/mL | 2 - 400 pg/mL |
| Total Assay Time | < 25 minutes | < 25 minutes |
| Sample Volume | 50 µL | 50 µL |
Machine Learning Integration: A supervised learning model, specifically a Support Vector Machine (SVM), was trained using the voltammetric data from known samples to accurately classify the severity of inflammation based on the multiplexed cytokine profile, reducing false positives/negatives [14].
Lessons for Researchers
- Nanomaterial Choice is Critical: The use of MWCNTs significantly amplified the electrochemical signal, enabling the detection of clinically relevant low-abundance cytokines.
- Multiplexing is Feasible: Careful selection of antibody pairs and electrode design allows for simultaneous detection without cross-talk.
- ML Enhances Diagnostic Power: Integrating ML for data interpretation moves beyond simple concentration measurement to provide diagnostic classification, adding significant clinical utility.
Case Study 2: Electrochemical Profiling of Cancer Biomarkers for Early Detection
Background and Research Question
The early detection of cancer drastically improves patient survival. A prominent research focus has been the development of a low-cost electrochemical immunoassay for the sensitive detection of Carcinoembryonic Antigen (CEA), a key protein biomarker for colorectal, lung, and breast cancers [60]. The goal was to create a platform suitable for deployment in primary care settings or pharmacies.
Experimental Protocol
1. Sensor Fabrication using a Competitive Assay Format:
- Electrode Modification: Electrodeposit gold nanoparticles (AuNPs) onto a carbon electrode to create a high-surface-area, conductive platform.
- Probe Immobilization: Chemisorb a specific CEA-binding aptamer sequence, terminated with a thiol group, onto the AuNP surface.
- Signal Tag Preparation: Pre-incubate a known concentration of CEA protein with a fixed concentration of an enzyme label (e.g., Glucose Oxidase - GOx). The CEA and labeled CEA compete for the limited aptamer binding sites.
2. Sample Measurement via Amperometry:
- Competitive Incubation: Expose the aptamer-functionalized sensor to the prepared mixture of sample and labeled CEA. Incubate for 20 minutes.
- Washing: Rinse the electrode to remove unbound material.
- Amperometric Measurement: Transfer the electrode to a buffer solution containing glucose. The bound GOx catalyzes the oxidation of glucose, and the resulting current is measured at a constant potential using amperometry. The measured current is inversely proportional to the concentration of CEA in the sample, as more native CEA blocks the binding of the enzyme-labeled CEA [60].
The competitive assay format and associated signaling pathway are summarized below:
Key Results and Data Analysis
The competitive assay format provided excellent sensitivity for CEA, suitable for detecting clinically significant levels.
Table 3: Performance Metrics of the Electrochemical CEA Aptasensor
| Performance Parameter | Result |
|---|---|
| Detection Limit | 0.05 ng/mL |
| Linear Range | 0.1 - 200 ng/mL |
| Assay Time | < 30 minutes |
| Detection Method | Amperometry (at +0.6 V vs. Ag/AgCl) |
| Clinical Correlation (R²) | >0.98 with reference ELISA |
Data Analysis: The platform was integrated with a cloud-based data analysis system. A random forest ML algorithm was employed to analyze the amperometric data from a panel of sensors, compensating for inter-sample matrix effects and improving the accuracy of CEA quantification across a diverse set of patient samples [14].
Lessons for Researchers
- Assay Format Flexibility: Competitive assays are highly effective for detecting small molecules and can be adapted for proteins when paired with high-affinity aptamers.
- Aptamers as Robust Bioreceptors: DNA/RNA aptamers offer advantages over antibodies, including better stability and easier modification, making them ideal for POC applications.
- Cloud Connectivity is Key: The use of ML in the cloud for data processing allows for the use of simpler, lower-cost hardware at the point of care while maintaining high analytical rigor.
The Scientist's Toolkit: Essential Research Reagents and Materials
Successful development of electrochemical POCT devices relies on a specific set of high-quality reagents and materials.
Table 4: Essential Research Reagent Solutions for Electrochemical POCT Development
| Reagent/Material | Function/Application | Example from Case Studies |
|---|---|---|
| Screen-Printed Electrodes (SPCEs) | Low-cost, disposable, mass-producible sensor substrates. The foundational platform for the assay. | Used as the base transducer in the cytokine sensor and CEA aptasensor [60]. |
| Functional Nanomaterials | Enhance electrical conductivity and surface area; amplify the detection signal. | Multi-walled carbon nanotubes (MWCNTs), gold nanoparticles (AuNPs), graphene oxides [60]. |
| Specific Bioreceptors | Provide molecular recognition and binding specificity for the target analyte. | Monoclonal antibodies (vs. IL-6/TNF-α), DNA/RNA aptamers (vs. CEA) [60]. |
| Enzymatic Labels & Substrates | Generate a measurable electrochemical signal upon biorecognition. | Horseradish Peroxidase (HRP) with TMB/H₂O₂; Glucose Oxidase (GOx) with glucose [60]. |
| Cross-linking Chemistry | Covalently immobilize bioreceptors onto the electrode surface to ensure stability. | EDC (1-Ethyl-3-(3-dimethylaminopropyl)carbodiimide) and NHS (N-Hydroxysuccinimide) [60]. |
These case studies underscore the transformative potential of electrochemical point-of-care devices in modernizing pharmaceutical analysis and diagnostics. The success stories in infectious disease and cancer detection highlight several universal lessons: the importance of thoughtful sensor design, the signal-amplifying power of nanomaterials, and the growing role of machine learning in transforming raw sensor data into clinically actionable information. For researchers and drug development professionals, mastering these interdisciplinary tools—spanning electrochemistry, materials science, and data analytics—is no longer optional but essential for driving the next wave of diagnostic innovation. The future of POCT lies in the continued convergence of these fields, leading to smarter, more connected, and more accessible diagnostic solutions that can be delivered directly to the patients who need them.
Conclusion
Electrochemical devices for point-of-care pharmaceutical analysis represent a paradigm shift towards decentralized, rapid, and personalized diagnostics. The integration of advanced nanomaterials, biomimetic recognition elements, and miniaturized systems has enabled highly sensitive and specific detection of pharmaceuticals and biomarkers in complex biological samples. However, the journey from a research prototype to a commercially viable product necessitates overcoming significant challenges in sensor stability, reproducibility, and regulatory approval. Future progress hinges on interdisciplinary collaboration to refine material design, leverage artificial intelligence for data analysis, and validate these technologies in large-scale clinical trials. The continued evolution of these systems promises to profoundly impact drug development pipelines, therapeutic monitoring, and global health outcomes by making sophisticated analytical power accessible at the point of need.
References
- 1. Electroanalytical methods [https://en.wikipedia.org/wiki/Electroanalytical_methods]
- 2. Electroanalysis Advances in Pharmaceutical Sciences [https://www.mdpi.com/2673-4532/6/2/12]
- 3. New trends in potentiometric sensors: From design to ... [https://pubmed.ncbi.nlm.nih.gov/39893726/]
- 4. Electro-Analytical Methods of Analysis [https://lab-training.com/electro-analytical-methods/]
- 5. Fast and Accurate Analysis of Drugs Using Amperometry ... [https://www.sciencedirect.com/science/article/abs/pii/S0022354915323686]
- 6. A simple and fast flow injection amperometry for the ... [https://pmc.ncbi.nlm.nih.gov/articles/PMC10262230/]
- 7. emphasizing green, white, and blue analytical approaches [https://www.nature.com/articles/s41598-024-69518-w]
- 8. Conductometry (Pharmaceutical analysis) | PPTX [https://www.slideshare.net/slideshow/conductometry-pharmaceutical-analysis-250927520/250927520]
- 9. Conductometric Method - an overview [https://www.sciencedirect.com/topics/chemistry/conductometric-method]
- 10. Current and Future Challenges in Point-of-Care Technologies [https://pmc.ncbi.nlm.nih.gov/articles/PMC4848045/]
- 11. Molecular point-of-care testing technologies: Current status ... [https://www.sciencedirect.com/science/article/pii/S2950160125000063]
- 12. Recent advances in electrochemical sensors and biosensors ... [https://pmc.ncbi.nlm.nih.gov/articles/PMC10262219/]
- 13. Top 3 Trends Transforming Electrochemical Consumables ... [https://www.msesupplies.com/blogs/access-by-email/top-3-trends-transforming-electrochemical-consumables-sensors-in-2025?srsltid=AfmBOorbdTwU4ldQFakDz-rQkK-Qai91G8ixgGLrsrpNAopBWwSApubq]
- 14. Machine learning in point-of-care testing: innovations, ... [https://www.nature.com/articles/s41467-025-58527-6]
- 15. Miniature Electrochemical CO Sensor Market [https://www.futuremarketinsights.com/reports/miniature-electrochemical-co-sensor-market]
- 16. Point-of-Care Technologies for the Advancement of Precision ... [https://pmc.ncbi.nlm.nih.gov/articles/PMC5003165/]
- 17. Global Point-of-Care (POC) Drug Abuse Testing Market ... [https://www.databridgemarketresearch.com/reports/global-point-of-care-poc-drug-abuse-testing-market?srsltid=AfmBOoo_d16-QWCEyf8qTieIIqohlNUsxtl7MXXvF1RxhFLsP8mk7Cma]
- 18. Point-of-Care Opioid Testing Market [https://www.futuremarketinsights.com/reports/point-of-care-opioid-testing-market]
- 19. Nanomaterials in point-of-care diagnostics: Bridging the ... [https://www.sciencedirect.com/science/article/abs/pii/S034403382400596X]
- 20. Quantum Dot-Based Lateral Flow Immunoassay as Point-of ... [https://pmc.ncbi.nlm.nih.gov/articles/PMC9497919/]
- 21. Advances in nanomaterials and their applications in point of ... [https://pmc.ncbi.nlm.nih.gov/articles/PMC7127209/]
- 22. Unravelling the potential of Graphene/Transition metal ... [https://www.sciencedirect.com/science/article/abs/pii/S0026265X25005028]
- 23. Advances in analysis of pharmaceuticals by using ... [https://pubmed.ncbi.nlm.nih.gov/35618680/]
- 24. Development of Carbon Nanostructured Based ... [https://brieflands.com/journals/ijpr/articles/126252]
- 25. Quantum Dots: An Emerging Tool for Point-of-Care Testing [https://www.mdpi.com/2072-666X/11/12/1058]
- 26. Screen-printed electrodes [https://en.wikipedia.org/wiki/Screen-printed_electrodes]
- 27. Detection of pathogens using graphene quantum dots and ... [https://www.sciencedirect.com/science/article/abs/pii/S092540052200466X]
- 28. A review of point-of-care (POC) and lab-on-chip (LOC) ... [https://www.sciencedirect.com/science/article/abs/pii/S000326702500474X]
- 29. Lab on chip for medical and clinical applications [https://pubs.rsc.org/en/content/articlehtml/2025/sd/d5sd00096c]
- 30. Microfluidics in 2025: Applications, Trends & How It Work [https://eden-microfluidics.com/news-events/microfluidics-overview/]
- 31. A Review on Recent Trends and Future Developments in ... [https://pmc.ncbi.nlm.nih.gov/articles/PMC10882602/]
- 32. Lab-on-PCB with integrated DNA amplification and ... [https://www.nature.com/articles/s41598-025-12364-1]
- 33. Lab-on-a-Chip Market Size to Surpass USD 17.14 Bn ... [https://www.cervicornconsulting.com/lab-on-a-chip-market]
- 34. Lab on Chip Market Size, Trends & Forecast, 2025-2032 [https://www.coherentmarketinsights.com/industry-reports/lab-on-chip-market]
- 35. POC Sensor Systems and Artificial Intelligence—Where We ... [https://pmc.ncbi.nlm.nih.gov/articles/PMC12467669/]
- 36. Imprinting Technology in Electrochemical Biomimetic ... [https://pmc.ncbi.nlm.nih.gov/articles/PMC5375809/]
- 37. Nanomaterials-based biosensor and their applications [https://www.sciencedirect.com/science/article/pii/S2405844023071372]
- 38. Nanomaterials in Biosensors: Fundamentals and Applications [https://pmc.ncbi.nlm.nih.gov/articles/PMC7152100/]
- 39. Electrochemical biosensors: perspective on functional ... [https://biomaterialsres.biomedcentral.com/articles/10.1186/s40824-019-0181-y]
- 40. Electrochemical detection techniques in biosensor ... [https://www.sciencedirect.com/science/article/pii/B9780128164914000024]
- 41. Electrochemical Biosensors - Sensor Principles and ... [https://pmc.ncbi.nlm.nih.gov/articles/PMC3663003/]
- 42. Generic sensor platform based on electro-responsive ... [https://www.nature.com/articles/s41378-020-00193-3]
- 43. Electrochemical Aptamer-Based Sensors for Improved ... [https://pmc.ncbi.nlm.nih.gov/articles/PMC6886665/]
- 44. Sensitivity and Selectivity on Aptamer-Based Assay [https://pmc.ncbi.nlm.nih.gov/articles/PMC3324139/]
- 45. Advances in aptamer-based electrochemical biosensors for ... [https://pubs.rsc.org/en/content/articlehtml/2025/nh/d5nh00368g?page=search]
- 46. Point of Care Testing Market Share Forecasts 2025-2034 [https://www.gminsights.com/industry-analysis/point-of-care-testing-market]
- 47. Modern designs of electrochemical sensor for accurate ... [https://www.sciencedirect.com/science/article/abs/pii/S0254058425002342]
- 48. An aptamer-based electrochemical sensor for the ... [https://www.sciencedirect.com/science/article/pii/S0956566325000260]
- 49. Progress on Electrochemical Sensing of Pharmaceutical ... [https://www.mdpi.com/2227-9040/11/8/467]
- 50. A Laboratory Protocol for Routine Therapeutic Drug ... [https://www.mdpi.com/2079-6382/14/4/390]
- 51. Electrochemical nanosensors in therapeutic ... [https://www.sciencedirect.com/science/article/pii/S0013468625009119]
- 52. Point-of-care testing: a critical analysis of the market and ... [https://www.frontiersin.org/journals/lab-on-a-chip-technologies/articles/10.3389/frlct.2024.1394752/full]
- 53. Therapeutic Drug Monitoring of Biologics: Current Practice, ... [https://pubmed.ncbi.nlm.nih.gov/40087239/]
- 54. Point-of-Care Diagnostics: Recent Developments in a ... [https://pmc.ncbi.nlm.nih.gov/articles/PMC5793870/]
- 55. Sensors in the Detection of Abused Substances in Forensic ... [https://pmc.ncbi.nlm.nih.gov/articles/PMC10745465/]
- 56. Disposable Screen Printed Electrochemical Sensors: Tools for ... [https://pmc.ncbi.nlm.nih.gov/articles/PMC4118360/]
- 57. Global Point-of-Care (POC) Drug Abuse Testing Market ... [https://www.databridgemarketresearch.com/reports/global-point-of-care-poc-drug-abuse-testing-market?srsltid=AfmBOooZqsLIJg4O9kqgbYAUe_VjJiQ6OlqqD88QWMQbAtTiYk2Ucrhe]
- 58. Highly sensitive and disposable screen-printed graphene ... [https://www.sciencedirect.com/science/article/abs/pii/S0026265X24003461]
- 59. Disposable screen printed sensor for the electrochemical ... [https://bmcchem.biomedcentral.com/articles/10.1186/s13065-016-0147-2]
- 60. Point-of-care electrochemical testing of biomarkers involved in ... [https://pmc.ncbi.nlm.nih.gov/articles/PMC9472196/]
- 61. Microfluidic technologies for wearable and implantable ... [https://pubs.rsc.org/en/content/articlelanding/2025/lc/d5lc00499c]
- 62. Point-of-Care Testing - StatPearls - NCBI Bookshelf [https://www.ncbi.nlm.nih.gov/books/NBK592387/]
- 63. Advances in Integration, Wearable Applications, and Artificial ... [https://pmc.ncbi.nlm.nih.gov/articles/PMC10222806/]
- 64. Wearable, fabric-based microfluidic systems with ... [https://www.sciencedirect.com/science/article/abs/pii/S1385894724104706]
- 65. Wearable microfluidic biosensors with haptic feedback for ... [https://www.nature.com/articles/s41746-025-01466-9]
- 66. Investigation into the predictive performance of colorimetric ... [https://jast-journal.springeropen.com/articles/10.1186/s40543-021-00271-9]
- 67. Biofouling-resistant nanomaterials for non-enzymatic ... [https://pmc.ncbi.nlm.nih.gov/articles/PMC12020842/]
- 68. Improving the Stability and Sensing of Electrochemical ... - PMC [https://pmc.ncbi.nlm.nih.gov/articles/PMC3956047/]
- 69. A Guide to Sensor Maintenance and Cleaning [https://www.watertechusa.com/sensor-care-and-cleaning]
- 70. Electrochemical (Bio-) Sensors in Biological Applications ... [https://www.mdpi.com/2079-6374/15/11/746]
- 71. The Implications of False Positives in Diagnostic Testing [https://www.apbiocode.com/false-positives/]
- 72. Methods for Assessing Improvement in Specificity when a ... [https://pmc.ncbi.nlm.nih.gov/articles/PMC2802069/]
- 73. Recent advancements in novel electrochemical sensors for ... [https://www.sciencedirect.com/science/article/pii/S2949771X25000027]
- 74. How to Minimize False Positives in AML Screening [https://www.flagright.com/post/how-to-minimize-false-positives-in-aml-screening]
- 75. Electrochemical method of analysis | PDF [https://www.slideshare.net/slideshow/electrochemical-method-of-analysis-31352857/31352857]
- 76. How to Ensure Antibody Stability During Long-Term Storage [https://precisionantibody.com/how-to-ensure-antibody-stability-during-long-term-storage/]
- 77. Assessing the impact of long‐term storage on the quality and ... [https://pmc.ncbi.nlm.nih.gov/articles/PMC11558192/]
- 78. Immobilized Biomolecule - an overview [https://www.sciencedirect.com/topics/engineering/immobilized-biomolecule]
- 79. Biosensor-Integrated Drug Delivery Systems as New ... [https://pmc.ncbi.nlm.nih.gov/articles/PMC9496590/]
- 80. Biomolecule immobilization in biosensor development [https://pubmed.ncbi.nlm.nih.gov/18855745/]
- 81. Point-of-Care Pharmaceutical Manufacturing & Precision ... [https://www.nist.gov/programs-projects/point-care-pharmaceutical-manufacturing-precision-medicine]
- 82. Advances and Challenges in the Development of Immobilized ... [https://pmc.ncbi.nlm.nih.gov/articles/PMC11997919/]
- 83. Recent Advances in Immobilization Strategies for ... [https://link.springer.com/article/10.1007/s12209-020-00234-y]
- 84. Assessment of matrix effect in quantitative LC-MS bioanalysis [https://pmc.ncbi.nlm.nih.gov/articles/PMC11352789/]
- 85. Matrix Effect Assessment via Matrix Matching Strategy ... [https://www.sciencedirect.com/science/article/abs/pii/S0003267025010864]
- 86. Systematic Assessment of Matrix Effect, Recovery, and ... [https://pmc.ncbi.nlm.nih.gov/articles/PMC12613129/]
- 87. Strategies for the Detection and Elimination of Matrix ... [https://www.chromatographyonline.com/view/strategies-detection-and-elimination-matrix-effects-quantitative-lc-ms-analysis]
- 88. Saliva as a matrix for therapeutic drug monitoring and disease ... [https://pmc.ncbi.nlm.nih.gov/articles/PMC12241277/]
- 89. Advanced Electrochemical Sensors for Rapid and Sensitive ... [https://pmc.ncbi.nlm.nih.gov/articles/PMC12467939/]
- 90. Validation of Stability-Indicating HPLC Methods for ... [https://www.chromatographyonline.com/view/validation-of-stability-indicating-hplc-methods-for-pharmaceuticals-overview-methodologies-and-case-studies]
- 91. Electrochemical biosensors for point-of-care testing [https://link.springer.com/article/10.1007/s42242-024-00301-6]
- 92. Understanding LOD and LOQ in Analytical Method Validation [https://www.linkedin.com/posts/fares-adham-elnemr-1b0301312_lod-vs-loq-understanding-the-difference-activity-7363746753809969153--Id-]
- 93. A review of point-of-care (POC) and lab-on-chip (LOC) ... [https://pubmed.ncbi.nlm.nih.gov/40316385/]
- 94. Clinical performance validation and four diagnostic ... [https://www.nature.com/articles/s41598-025-99273-5]
- 95. Phase 0 clinical trials in oncology new drug development - PMC [https://pmc.ncbi.nlm.nih.gov/articles/PMC3088951/]
- 96. Phase 0 Clinical Trials: Conceptions and Misconceptions [https://pmc.ncbi.nlm.nih.gov/articles/PMC7185299/]
- 97. Strategic, feasibility, economic, and cultural aspects of phase 0 approaches: Is it time to change the drug development process in order to increase productivity? - PMC [https://pmc.ncbi.nlm.nih.gov/articles/PMC9199889/]
- 98. Phase 0/microdosing approaches: time for mainstream application in drug development? | Nature Reviews Drug Discovery [https://www.nature.com/articles/s41573-020-0080-x]
- 99. Phase 0 clinical trial - TRACER [https://www.tracercro.com/phase-0-clinical-trial/]
- 100. 5 differences between Phase 1 0 in drug development [https://www.tracercro.com/resources/blogs/5-differences-between-phase-1-0-in-drug-development/]
- 101. Glioma drug development benefits from emerging phase 0 and window-of-opportunity trial paradigm | Cell Communication and Signaling | Full Text [https://biosignaling.biomedcentral.com/articles/10.1186/s12964-025-02408-4]
- 102. Electrochemical Simulation of Phase I Hepatic Metabolism ... [https://pmc.ncbi.nlm.nih.gov/articles/PMC10674253/]
- 103. An electrochemical point-of-care testing device for specific ... [https://www.sciencedirect.com/science/article/abs/pii/S0956566324006511]
- 104. Comparison of colorimetric, spectroscopic and ... [https://pmc.ncbi.nlm.nih.gov/articles/PMC10910492/]
- 105. Recent spectrophotometric and electroanalytical methods ... [https://link.springer.com/article/10.1007/s43994-023-00051-8]
- 106. Simple spectrophotometric methods for the quantitative ... [https://pmc.ncbi.nlm.nih.gov/articles/PMC12560461/]
- 107. A green and sustainable UV spectrophotometric approach ... [https://pubs.rsc.org/en/content/articlelanding/2025/ay/d5ay00446b]
- 108. Innovative spectrophotometric methods for the analysis of ... [https://www.nature.com/articles/s41598-025-25067-4]
- 109. Selected new approaches and future perspectives in liquid ... [https://www.sciencedirect.com/science/article/pii/S0928098725001009]
- 110. Recent Advances in Electrochemical Sensors for the ... [https://pmc.ncbi.nlm.nih.gov/articles/PMC12563010/]
- 111. Navigating the Regulatory Landscape for Biosensors in ... [https://www.azosensors.com/article.aspx?ArticleID=3173]
- 112. Overcoming Major Barriers to Developing Successful Sensors ... [https://pmc.ncbi.nlm.nih.gov/articles/PMC9197978/]
- 113. Electrochemical Instruments Market Analysis Report 2025-2032 [https://industryresearchmarket.com/analysis-report/electrochemical-instruments-market-intelligence/]
- 114. Next-Generation ELISA (ELISA 2.0) Market Research ... [https://www.insightaceanalytic.com/report/next-generation-elisa-market/3241]
- 115. Analytical techniques in pharmaceutical analysis: A review [https://www.sciencedirect.com/science/article/pii/S1878535213001056]