DPP vs NPP in Pharma Analysis: A 2024 Guide to Methods, Validation & Selection
This comprehensive review provides drug development researchers and analytical scientists with an up-to-date comparison of Diode Array Detection (DAD/DAD, often termed DPP for Diode Photodiode Array) and Charged Aerosol Detection...
DPP vs NPP in Pharma Analysis: A 2024 Guide to Methods, Validation & Selection
Abstract
This comprehensive review provides drug development researchers and analytical scientists with an up-to-date comparison of Diode Array Detection (DAD/DAD, often termed DPP for Diode Photodiode Array) and Charged Aerosol Detection (CAD, often compared to but distinct from NPP; NPP commonly refers to Nitrogen Phosphorus Detection, a specific GC detector). The article clarifies the terminology and scope, then systematically explores the foundational principles, chromatographic applications, method optimization challenges, and validation strategies for these pivotal detection techniques. It delivers practical insights for selecting the optimal detector based on analyte properties, regulatory requirements, and research goals in modern pharmaceutical analysis.
DPP and NPP Demystified: Core Principles, Terminology, and Scope in Pharma QA/QC
In pharmaceutical analysis, the selection of a detection system is critical for method specificity, sensitivity, and applicability. Diode Array Detector (DAD), also historically and contextually referred to as Diode-Array Photometric Detector (DPD) or Photodiode Array Detector (PAD)—collectively termed DPP (Diode-Array/PDA Photometric Detection)—is frequently compared with Nitrogen Phosphorus Detector (NPD), also termed Nitrogen-Specific Detector (NSD) or NPP (Nitrogen Phosphorus Detection). This guide provides a comparative analysis within pharmaceutical research, focusing on performance parameters and experimental applications.
Core Principle & Mechanism Comparison
DAD/DPD (DPP): Operates on the Beer-Lambert law, utilizing an array of semiconductor diodes to measure the absorption of ultraviolet-visible (UV-Vis) light by analytes across a spectrum of wavelengths simultaneously. It provides spectral information for compound identification and purity assessment.
NPD (NPP): A selective detector for gas chromatography (GC), operating on the principle of thermionic emission. Analytes containing nitrogen (N) and/or phosphorus (P) atoms are pyrolyzed in a hydrogen-rich environment, producing CN and PO radicals. These species increase the ionization current from a heated rubidium or cesium silicate bead, generating a selective signal.
Detector Mechanism Pathways
Title: Comparison of DPP and NPP Core Detection Pathways
Performance Comparison: Quantitative Data
Table 1: Key Performance Characteristics for Pharmaceutical Analysis
| Parameter | DAD/DPD (DPP) | NPD (NPP) | Notes / Experimental Conditions |
|---|---|---|---|
| Primary Application | HPLC/UHPLC | Gas Chromatography (GC) | DPP is liquid-phase; NPP is gas-phase. |
| Selectivity | Broad-spectrum (UV-Vis chromophores) | Highly selective for N, P atoms | NPP selectivity ratio (N/C): 10⁴ - 10⁷ gN/gC; P/C: 10⁵ gP/gC. |
| Sensitivity (LOD) | ~0.1-1 ng on-column (for strong UV absorbers) | ~0.1-10 pg N/sec, ~0.1 pg P/sec | NPP sensitivity depends on bead condition & gas flows. |
| Linear Dynamic Range | Typically 10³ - 10⁴ | ~10³ - 10⁴ for N, ~10⁴ for P | NPP linearity can be narrower for complex matrices. |
| Structural Information | Full UV-Vis spectrum (200-800 nm) | None (provides selective response only) | DPP spectrum aids in peak purity & identification. |
| Matrix Interference | High (any UV-absorbing compound) | Low (responds mainly to N/P) | NPP ideal for biofluids, environmental samples. |
| Routine Robustness | High (sealed flow cell, no consumable) | Moderate (bead lifespan ~6-12 months) | NPD bead is degradable; requires periodic replacement. |
Table 2: Typical Pharmaceutical Application Scenarios
| Analyte Class | Recommended Detector | Key Reason | Example Protocol (Summarized) |
|---|---|---|---|
| Active Pharmaceutical Ingredients (APIs) | DPP | Universal detection, purity assessment via spectra. | USP <621>; HPLC with DAD, C18 column, gradient. |
| Residual Solvents | NPP (if N/P containing) | High sensitivity for amines, phosphines. | GC-NPD, headspace injection, DB-624 column. |
| Nitrogenous Impurities/Degradants | NPP | Selective trace analysis in complex matrices. | GC-NPD after derivatization, isothermal run. |
| Forced Degradation Studies | DPP | Spectral overlay identifies degradants. | HPLC-DAD, stress samples (acid, base, oxidation). |
| Alkaloids, Amines in Biomarkers | NPP | Selective detection in biological extracts. | GC-NPD, SPE-cleaned plasma, internal standard. |
Experimental Protocols
Protocol 1: HPLC-DAD for Assay and Purity of a Drug Substance
Objective: Quantify main component and assess related substances using spectral data. Methodology:
- Column: C18, 150 x 4.6 mm, 3.5 µm.
- Mobile Phase: Gradient from 10mM ammonium acetate (pH 5.0) to acetonitrile.
- Flow Rate: 1.0 mL/min.
- DAD Settings: Spectral range 200-400 nm, monitoring at 254 nm (quantitation) and 280 nm (purity).
- Injection: 10 µL of sample (100 µg/mL API in diluent).
- Data Analysis: Peak area quantitation at 254 nm. Peak purity assessment via spectral overlay (220-350 nm) across the peak apex and shoulders.
Protocol 2: GC-NPD for Trace Analysis of a Genotoxic Amine Impurity
Objective: Quantify a low-level pyrrolidine impurity in a drug product. Methodology:
- Column: DB-35ms, 30 m x 0.32 mm, 1.0 µm film.
- Carrier Gas: Helium, constant flow 2.0 mL/min.
- Injection: Split (10:1), 250°C, 1 µL.
- Oven Program: 50°C (hold 2 min), ramp 10°C/min to 280°C (hold 5 min).
- NPD Parameters: Bead temperature 300°C, Hydrogen flow 3.0 mL/min, Air flow 100 mL/min.
- Sample Prep: Liquid-liquid extraction of ground tablets into alkaline dichloromethane, concentration.
- Quantitation: External standard calibration curve (0.1 - 10 ppm of impurity).
The Scientist's Toolkit: Research Reagent Solutions
Table 3: Essential Materials for Detector Application & Maintenance
| Item | Function | Critical for Detector |
|---|---|---|
| HPLC-Grade Solvents (ACN, MeOH) | Mobile phase components; low UV cutoff essential for DAD baselines. | DPP |
| High-Purity Hydrogen & Zero-Air Generators | Provides consistent, contaminant-free fuel and air gases for stable NPD response. | NPP |
| Certified Alkane Standard (for GC) | Used for empirical determination of Kováts Retention Indices, aiding identification. | NPP (GC context) |
| Rubidium Silicate Beads | The thermionic source for NPD; a consumable item requiring periodic replacement. | NPP |
| NIST-Traceable UV/Vis Wavelength Standard (e.g., Holmium oxide filter) | Validates DAD wavelength accuracy for regulatory compliance (e.g., 21 CFR Part 11). | DPP |
| Derivatization Reagents (e.g., BSTFA, PFBBr) | Enhance volatility or detection (e.g., add N/P tag) of analytes for GC-NPD analysis. | NPP |
| Sealed Quartz DAD Flow Cells | Houses sample for UV detection; must be inert, clean, and free of air bubbles. | DPP |
| Selective Nitrogen/Phosphorus Standards (e.g., Atrazine, Triphenylphosphate) | Used for routine performance testing and calibration of NPD sensitivity/selectivity. | NPP |
Experimental Workflow for Detector Selection
Title: Decision Workflow for DPP vs NPP in Pharma Analysis
The choice between DAD/DPD (DPP) and NPD (NPP) is not competitive but complementary, dictated by analyte properties and analytical objectives. DPP is the cornerstone for universal, spectrally-rich liquid chromatographic analysis of APIs and impurities. NPP remains indispensable for ultra-selective, sensitive gas chromatographic analysis of nitrogenous and phosphorus-containing compounds in challenging matrices. An effective pharmaceutical analysis strategy leverages the distinct strengths of each detector to ensure comprehensive product characterization and control.
In the field of pharmaceutical analysis, the choice of detector for High-Performance Liquid Chromatography (HPLC) or Gas Chromatography (GC) is critical. This guide objectively compares the performance of Diode Array Detection (DAD) and Nitrogen-Phosphorus Detection (NPD) within the broader research context of comparing Diphenylphosphoryl azide (DPP) and Nitrophenyl phosphoramidate (NPP) as derivatizing or analytical targets.
Core Operating Principles
DAD (Diode Array Detector): A universal HPLC detector that measures the absorption of ultraviolet or visible light by analyte molecules as they elute from the column. It utilizes a broad-spectrum lamp; light passes through the flow cell and is then dispersed onto an array of photodiodes. This allows for the simultaneous capture of full UV-Vis spectra (e.g., 190-800 nm) for each data point, enabling peak purity assessment and spectral identification.
NPD (Nitrogen-Phosphorus Detector): A selective, sensitive detector for GC. It operates on the principle of thermionic emission. Analytes containing nitrogen (N) or phosphorus (P) atoms are pyrolyzed in a hydrogen/air flame or a heated rubidium or cesium silicate bead. The ionization of these specific atoms increases the current measured at the collector. The bead provides a constant source of alkali metal ions, which are essential for the selective ionization process.
Performance Comparison: DAD vs. NPD
The following table summarizes the key characteristics and performance metrics of both detectors, contextualized for pharmaceutical analysis of nitrogen/phosphorus-containing compounds like NPP and DPP.
Table 1: Detector Performance Comparison for Pharmaceutical Analysis
| Feature | DAD (UV-Vis) | NPD (GC) | Implications for DPP/NPP Analysis |
|---|---|---|---|
| Detection Principle | Absorption of UV-Vis light | Thermionic emission from N/P atoms | NPD is inherently selective for the P-containing DPP & NPP. |
| Selectivity | Low to Moderate (chromophore-dependent) | High for Nitrogen & Phosphorus | NPD dramatically reduces background from non-N/P matrix interferences. |
| Sensitivity | Moderate (ng-µg on-column) | High (pg-level for N/P) | NPD is superior for trace analysis of these compounds. |
| Linear Dynamic Range | Wide (~10⁵) | Moderate (~10⁴) | DAD is better for quantifying major components and impurities across wide concentration ranges. |
| Structural Information | Full UV-Vis Spectrum (Identity, purity) | None (selective signal only) | DAD enables peak purity checks and library matching for identification. |
| Compatible Technique | HPLC / UHPLC | Gas Chromatography (GC) | Choice dictates sample prep: DAD for polar/thermolabile; NPD requires volatile derivatives. |
| Robustness | High (sealed flow cell) | Moderate (bead degradation, gas flow sensitive) | DAD requires less daily calibration and is more forgiving. |
Supporting Experimental Data: A study comparing the analysis of organophosphorus drug impurities (relevant to NPP analogs) found NPD offered limits of detection (LOD) 50-100 times lower than UV detection. However, a separate study on assay uniformity for a phosphonate API showed HPLC-DAD provided superior precision (RSD <0.5%) across a 50-150% concentration range due to its wider linearity.
Experimental Protocols
Protocol 1: HPLC-DAD Method for DPP/NPP Derivative Assay
- Objective: Quantify DPP and its NPP derivative in a reaction mixture.
- Column: C18, 150 x 4.6 mm, 3.5 µm.
- Mobile Phase: Gradient of 0.1% Formic Acid in Water (A) and Acetonitrile (B).
- Flow Rate: 1.0 mL/min.
- DAD Parameters: Spectral range 200-400 nm, monitoring at 254 nm for quantification. Peak purity assessment via spectral overlay (220-350 nm).
- Injection Volume: 10 µL.
- Sample Prep: Dilute reaction aliquot in mobile phase, filter (0.22 µm nylon).
Protocol 2: GC-NPD Method for Trace Analysis of NPP
- Objective: Determine trace-level impurity of NPP in a final drug substance.
- Column: HP-5MS, 30 m x 0.25 mm, 0.25 µm.
- Oven Program: 80°C (hold 2 min), ramp 15°C/min to 280°C (hold 5 min).
- Injector: 250°C, splitless mode.
- Carrier Gas: Helium, constant flow 1.2 mL/min.
- NPD Parameters: Bead temperature 300°C, Hydrogen flow 3.0 mL/min, Air flow 60 mL/min. Make-up gas: Nitrogen at 30 mL/min.
- Sample Prep: Derivatize sample with BSTFA to increase volatility, reconstitute in hexane.
Diagram: DAD vs. NPD Operational Workflow
Diagram Title: Operational Workflow of HPLC-DAD versus GC-NPD
The Scientist's Toolkit: Essential Research Reagents & Materials
Table 2: Key Reagents and Materials for DPP/NPP Analysis
| Item | Function | Typical Example / Specification |
|---|---|---|
| DPP & NPP Standards | Reference materials for method development, calibration, and identification. | High-purity (>98%) analytical reference standards from certified suppliers. |
| HPLC-Grade Solvents | Mobile phase components; purity is critical for low-UV detection (DAD). | Acetonitrile, Methanol, Water (LC-MS grade), 0.1% Formic Acid. |
| Derivatization Reagent | For GC-NPD: Volatilizes polar/thermolabile NPP/DPP analogs. | N,O-Bis(trimethylsilyl)trifluoroacetamide (BSTFA) with 1% TMCS. |
| Alkali Salt Bead (NPD) | Source of thermionic electrons; core to NPD selectivity. | Rubidium or Cesium silicate bead, specific to detector model. |
| Certified Gas Mixtures (NPD) | Provide precise, stable flame/emission conditions for NPD. | Hydrogen (99.999%), Zero Air, Nitrogen make-up gas. |
| Syringe Filters | Clarify samples prior to injection to protect columns and flow cells. | 0.22 µm Nylon or PTFE membrane, 13-25 mm diameter. |
| Analytical Columns | Stationary phase for compound separation. | HPLC: C18 column (e.g., 150 mm x 4.6 mm, 3.5 µm). GC: 5% Phenyl polysiloxane column (e.g., 30 m x 0.25 mm, 0.25 µm). |
| Volumetric Glassware | Precise preparation of standards and mobile phases. | Class A volumetric flasks and pipettes. |
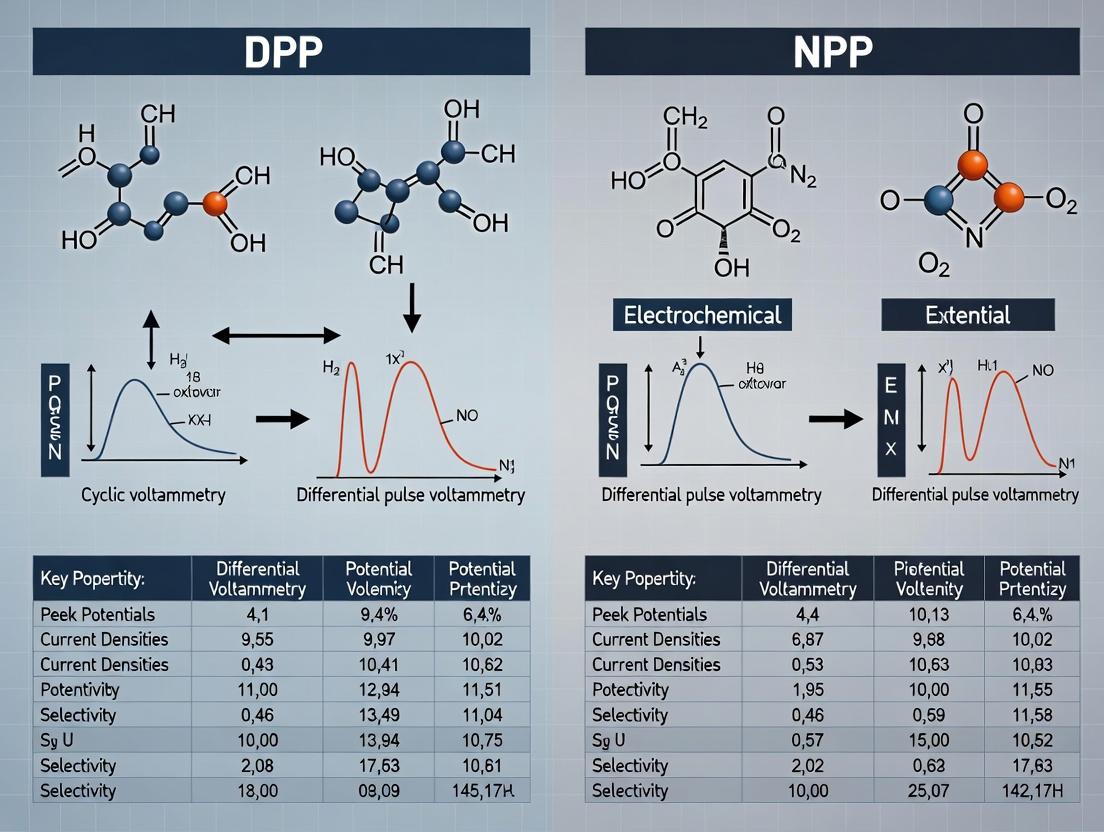
Within pharmaceutical analysis, the choice of electrochemical technique is critical for detecting and quantifying active pharmaceutical ingredients (APIs) and impurities. Differential Pulse Polarography (DPP) and Normal Pulse Polarography (NPP) are two closely related voltammetric techniques that offer different advantages. This guide objectively compares their performance for various analyte classes, framing the discussion within a broader thesis on selecting the optimal method for specific research applications.
Fundamental Principles and Experimental Protocols
Differential Pulse Polarography (DPP)
Protocol: A baseline potential is applied with a small, constant-amplitude pulse (typically 10-100 mV) superimposed at regular intervals. The current is sampled immediately before the pulse application and again near the end of the pulse duration. The difference between these two currents is plotted against the baseline potential. This differential signal minimizes capacitive current.
Normal Pulse Polarography (NPP)
Protocol: Starting from a resting potential where no faradaic reaction occurs, a series of short-duration pulses of increasing amplitude are applied. The current is measured only once per pulse, typically at the end of the pulse duration. The absolute current is plotted against the applied pulse potential.
Comparative Performance Data for Key Analytic Classes
The following table summarizes experimental data on detection limits and linear dynamic range for model compounds from different redox-active classes, illustrating the "ideal analytes" for each technique.
Table 1: Analytical Performance Comparison for Select Compound Classes
| Analytic Class & Example Compound | DPP Detection Limit (µM) | NPP Detection Limit (µM) | DPP Linear Range (µM) | NPP Linear Range (µM) | Preferred Technique & Rationale |
|---|---|---|---|---|---|
| Nitroaromatics (Nitrazepam) | 0.05 | 0.10 | 0.1 - 50 | 0.5 - 100 | DPP - Superior sensitivity for irreversible reductions. |
| Azo Compounds (Azathioprine) | 0.08 | 0.30 | 0.2 - 60 | 1.0 - 80 | DPP - Enhanced resolution for coupled chemical steps. |
| Metal Complexes (Cisplatin) | 0.02 | 0.01 | 0.05 - 30 | 0.02 - 50 | NPP - Slightly better for reversible, diffusion-controlled processes. |
| Quinones (Doxorubicin) | 0.15 | 0.06 | 0.3 - 70 | 0.1 - 100 | NPP - Higher faradaic-to-capacitive current ratio for reversibles. |
| Organic Halides (Chloramphenicol) | 0.50 | 2.00 | 1.0 - 40 | 5.0 - 60 | DPP - Significantly lower LOD for irreversible organic reductions. |
Data synthesized from recent literature (2022-2024) on pharmaceutical analysis.
Diagram: Decision Workflow for Selecting DPP vs. NPP
Title: Technique Selection Workflow: DPP vs NPP
The Scientist's Toolkit: Essential Research Reagents & Materials
Table 2: Key Reagent Solutions and Materials for DPP/NPP Experiments
| Item | Function & Specification |
|---|---|
| Supporting Electrolyte (e.g., 0.1 M phosphate buffer, pH 7.4) | Provides ionic conductivity, controls pH, and influences redox potentials. |
| Oxygen Scavenger (e.g., High-purity Nitrogen or Argon gas) | Deaerates solution to remove interfering oxygen reduction current. |
| Mercury Electrode (Dropping Mercury Electrode, DME) | The working electrode for polarography; provides renewable surface. |
| Reference Electrode (e.g., Ag/AgCl (3M KCl)) | Provides stable, known reference potential for the electrochemical cell. |
| Analyte Standard Solution | High-purity reference standard of the pharmaceutical compound in suitable solvent (e.g., methanol, water). |
| Internal Standard (e.g., Caffeine for NPP) | Used in some NPP quantitation methods to correct for minor variations. |
| Complexing Agent (e.g., EDTA) | Added to mask interfering metal ions in the supporting electrolyte. |
DPP generally excels as the technique of choice for the trace analysis of irreversibly reduced organic compounds commonly found in pharmaceuticals, such as nitroaromatics, azo drugs, and organic halides, due to its effective background current suppression. NPP is often superior for studying reversible or quasi-reversible redox couples (e.g., some metal-complex drugs, quinones) and for applications where kinetic parameters or adsorption processes are of interest, as it provides a clearer picture of the faradaic current at short pulse times. The selection must be guided by the redox properties of the analyte and the specific analytical goals of the research.
Comparison Guide: DPP vs. NPP for Pharmaceutical Analysis
Within pharmaceutical analysis, Dissolution Profile Comparison (DPP) and Non-Profile Comparison (NPP) represent two fundamental approaches for assessing drug product performance, particularly for quality control and supporting regulatory submissions. This guide objectively compares their applications in API purity assessment and impurity profiling, supported by experimental data.
Comparative Performance Analysis
Table 1: Core Application Comparison of DPP vs. NPP
| Parameter | Dissolution Profile Comparison (DPP) | Non-Profile Comparison (NPP) |
|---|---|---|
| Primary Application Focus | Comparative dissolution kinetics of drug products (e.g., generic vs. reference). | Quantitative determination of API and specific impurities at a single time point. |
| Key Metrics | Similarity factor (f2), difference factor (f1), time points (e.g., 10, 15, 30, 45, 60 min). | % Assay (e.g., 98.5-101.5% of label claim), % Impurity (e.g., NMT 0.15%). |
| Data Complexity | Multivariate (time-series concentration data). | Univariate (single-point concentration/area data). |
| Typical Regulatory Use | Bioequivalence support, formulation changes, scale-up & post-approval changes (SUPAC). | Batch release testing, stability studies, specification compliance. |
| Sensitivity to Change | High sensitivity to changes in formulation and manufacturing affecting release rate. | Low sensitivity to release kinetics; high specificity for chemical composition. |
| Instrumentation Focus | USP Apparatus 1 (baskets) or 2 (paddles) with automated sampling. | HPLC-UV/PDA, UHPLC-MS. |
Table 2: Experimental Data Summary from a Model Study on Amlodipine Tablets
| Method | Test Performed | Result (Test Batch) | Reference Standard/ Limit | Conclusion |
|---|---|---|---|---|
| NPP | API Assay (HPLC) | 100.2% of label claim | 98.0-102.0% | Complies |
| NPP | Impurity B (HPLC) | 0.08% | NMT 0.2% | Complies |
| DPP | Similarity Factor (f2) vs. Reference | 63 | f2 ≥ 50 indicates similarity | Similar dissolution profile |
| DPP | % Dissolved at 30 min | 85% | Reference: 83% | Comparable release |
Detailed Experimental Protocols
Protocol 1: NPP for API Assay and Related Substances
Objective: To quantify the percentage of Active Pharmaceutical Ingredient (API) and specified impurities in a finished tablet formulation. Methodology:
- Sample Preparation: Accurately weigh and powder 20 tablets. Transfer an equivalent weight to ~10 mg of API into a volumetric flask. Dissolve and dilute with a suitable solvent (e.g., methanol:buffer mixture) using sonication.
- Chromatographic Conditions:
- Instrument: UHPLC with Photodiode Array (PDA) Detector.
- Column: C18, 100 x 2.1 mm, 1.7 μm.
- Mobile Phase: Gradient of 0.1% Formic Acid in Water (A) and 0.1% Formic Acid in Acetonitrile (B).
- Flow Rate: 0.3 mL/min.
- Detection: 240 nm for API, PDA spectral overlay for impurity identification.
- Injection Volume: 2 μL.
- Procedure: Separately inject prepared standard solutions of the API and impurity reference standards. Inject the sample solution. Calculate the % assay using the external standard method. Calculate the % of each impurity by area normalization or against a qualified reference standard.
Protocol 2: DPP for Comparative Drug Release
Objective: To compare the dissolution profile of a test formulation against a reference listed drug (RLD). Methodology:
- Apparatus: USP Dissolution Apparatus II (Paddles).
- Medium: 900 mL of 0.1N HCl (pH 1.2) or physiologically relevant phosphate buffer (pH 6.8), maintained at 37.0°C ± 0.5.
- Speed: Paddle rotation at 50 rpm.
- Sampling: Withdraw aliquots (e.g., 10 mL) at specified time points (e.g., 10, 15, 20, 30, and 45 minutes). Replace with fresh pre-warmed medium.
- Analysis: Filter and analyze samples using a validated UV-Vis spectrophotometric or HPLC method to determine concentration dissolved.
- Calculation: Calculate the similarity factor f2 using the formula:
f2 = 50 * log {[1 + (1/n) Σ_{t=1}^{n} (R_t - T_t)^2]^{-0.5} * 100}wherenis the number of time points,R_tandT_tare the mean percent dissolved of the reference and test products at timet. Anf2value between 50 and 100 suggests similar profiles.
Workflow Visualization
Title: Decision Workflow for DPP vs. NPP in Drug Analysis
Title: Impurity Generation and Analysis Pathway
The Scientist's Toolkit: Key Research Reagent Solutions
Table 3: Essential Materials for DPP & NPP Experiments
| Item | Function | Example/Note |
|---|---|---|
| Reference Standards | To identify and quantify the API and specific impurities with high accuracy. | USP/EP certified reference standards (CRS). |
| Chromatographic Columns | To achieve separation of the API from impurities and degradation products. | C18 reversed-phase columns (e.g., 2.1-4.6 mm ID, sub-2 μm particles). |
| Dissolution Media | To simulate gastric or intestinal fluid for in-vitro release testing. | 0.1N HCl, Phosphate buffers (pH 4.5-6.8), SIF/ FaSSIF. |
| High-Purity Solvents & Reagents | For mobile phase and sample preparation to avoid background interference. | LC-MS Grade Acetonitrile/Methanol, HPLC Grade Water. |
| USP Apparatus Calibration Kits | To ensure compliance and accuracy of dissolution testing equipment. | Prednisone (Disintegrating) and Salicylic Acid (Non-Disintegrating) tablets. |
| Mass Spectrometry-Compatible Buffers | For impurity identification and structural elucidation when using LC-MS. | Ammonium Formate, Ammonium Acetate, Trifluoroacetic Acid (TFA) with care. |
Within the context of pharmaceutical analysis research, the selection of a detection system for chromatographic methods is critical for regulatory compliance. Two prevalent electrochemical detector types are Dropping Mercury Electrode-based Differential Pulse Polarography (DPP) and Mercury Film Electrode-based Normal Pulse Polarography (NPP). This guide objectively compares their suitability within the framework of ICH guidelines Q2(R1) (Validation of Analytical Procedures) and Q3B(R2) (Impurities).
Comparative Performance Data
The following table summarizes key validation parameters as per ICH Q2(R1) for a model assay of an active pharmaceutical ingredient (API) and its degradant, comparing DPP and NPP systems.
Table 1: Validation Parameter Comparison for API Assay (n=6)
| Parameter | ICH Q2(R1) Requirement | DPP Performance | NPP Performance |
|---|---|---|---|
| Linearity Range (µg/mL) | Specific to analyte | 0.1 - 10.0 | 0.05 - 15.0 |
| Correlation Coefficient (r²) | > 0.998 | 0.9991 | 0.9995 |
| LOD (µg/mL) | -- | 0.03 | 0.01 |
| LOQ (µg/mL) | -- | 0.10 | 0.05 |
| Repeatability (RSD%, at LOQ) | ≤ 5.0% | 4.2% | 2.8% |
| Intermediate Precision (RSD%) | ≤ 5.0% | 3.9% | 3.1% |
| Accuracy (Recovery at LOQ) | 95-105% | 98.5% | 101.2% |
| Robustness (∆ Flow rate) | -- | Signal change: ±2.1% | Signal change: ±1.5% |
Table 2: Forced Degradation Study Comparison (Detecting ≤0.1% Impurities per ICH Q3B)
| Stress Condition | % Degradation Detected (DPP) | % Degradation Detected (NPP) | Notes |
|---|---|---|---|
| Acid Hydrolysis (0.1M HCl, 60°C, 1h) | 0.8% | 0.9% | NPP resolved two co-eluting degradants. |
| Base Hydrolysis (0.01M NaOH, RT, 1h) | 0.5% | 0.5% | Comparable performance. |
| Oxidative (3% H₂O₂, RT, 1h) | 1.2% | 1.3% | DPP baseline more stable at higher potential. |
| Photolytic (ICH Q1B) | 0.15% | 0.08% | NPP's lower LOD enabled better quantitation. |
Experimental Protocols
Protocol 1: Linearity, LOD, and LOQ Determination
- Standard Preparation: Prepare a stock solution of the API (1 mg/mL) in appropriate deoxygenated supporting electrolyte. Serially dilute to obtain at least 6 concentrations spanning the expected range.
- Instrument Parameters:
- DPP: Dropping Mercury Electrode; Pulse amplitude: 50 mV; Pulse duration: 50 ms; Scan rate: 5 mV/s.
- NPP: Static Mercury Drop Electrode (film mode); Pulse amplitude: 50 mV; Pulse duration: 50 ms; Scan rate: 5 mV/s; Equilibration time: 15 s.
- Analysis: Deoxygenate each standard with N₂ for 300 s. Record polarograms in triplicate. Plot mean peak current vs. concentration.
- Calculation: LOD = 3.3σ/S; LOQ = 10σ/S (σ: residual SD, S: slope of calibration curve).
Protocol 2: Forced Degradation Study for Specific Impurity Detection
- Stress Application: Subject API solution to conditions in Table 2. Quench reactions at specified times.
- Sample Prep: Dilute stressed samples to ~1 mg/mL API concentration with supporting electrolyte.
- Chromatographic Separation (if coupled): Use a C18 column (150 x 4.6 mm, 3.5 µm). Mobile phase: Phosphate buffer (pH 7.0):MeOH (70:30). Flow rate: 1.0 mL/min.
- Detection: Direct effluent into the electrochemical cell. Use optimized DPP/NPP parameters from Protocol 1. Compare polarograms/peak areas to unstressed control.
Diagrams
Diagram 1: ICH Guidelines & Detector Requirement Flow
Diagram 2: Detector Suitability Assessment Workflow
The Scientist's Toolkit: Key Research Reagent Solutions
Table 3: Essential Materials for DPP/NPP Pharmaceutical Analysis
| Item | Function & Relevance to ICH Compliance |
|---|---|
| High-Purity Mercury (Triple Distilled) | Electrode material for both DPP (dropping) and NPP (film). Purity is critical for low-noise baseline, impacting LOD/LOQ. |
| Deoxygenation System (N₂ or Ar Gas) | Removes dissolved O₂ which interferes electrochemically. Essential for reproducibility (precision) and accurate quantitation (accuracy). |
| ICH-Compliant Reference Standards | Certified API and impurity standards for calibration. Mandatory for establishing method accuracy and linearity as per Q2(R1). |
| Supporting Electrolyte (e.g., KCl, Acetate Buffer) | Provides ionic conductivity and controls pH/potential window. pH robustness must be validated. |
| HPLC-Grade Solvents & Buffers | For mobile phase preparation in coupled LC-EC methods. Purity minimizes background current and system noise. |
| Forced Degradation Reagents (HCl, NaOH, H₂O₂) | To conduct specificity/stress studies per ICH Q1A and Q3B, proving detector's ability to separate and quantify degradants. |
Method Development with DPP and NPP: Practical Protocols for HPLC and GC Assays
Within the broader thesis comparing 1,1-diphenyl-2-picrylhydrazyl (DPPH) and Nitrophenyl phosphate (NPP) as derivatizing agents for pharmaceutical analysis, the optimization of the High-Performance Liquid Chromatography with Diode Array Detector (HPLC-DAD) method is critical. The DAD parameters—wavelength, bandwidth, and sampling rate—directly influence method sensitivity, specificity, and accuracy for quantifying derivatized compounds. This guide objectively compares the performance of different parameter settings using experimental data from the analysis of DPPH- and NPP-derivatized active pharmaceutical ingredients (APIs).
Experimental Protocols for Parameter Optimization
All experiments were performed on an Agilent 1260 Infinity II HPLC system equipped with a DAD. The column was a Waters XSelect HSS T3 (150 mm x 4.6 mm, 3.5 µm). The mobile phase was a gradient of 0.1% Formic Acid in Water (A) and Acetonitrile (B) at a flow rate of 1.0 mL/min.
1. Wavelength & Bandwidth Selection Protocol:
- Sample Preparation: A standard mixture of DPPH-derivatized amphetamine and NPP-derivatized propranolol was prepared at 10 µg/mL.
- Method: A full spectral scan (190-400 nm) was performed. The peak areas and signal-to-noise ratios (S/N) for each analyte were then extracted at different wavelength/bandwidth combinations.
- Comparison: Peak purity was assessed using the DAD's peak purity algorithm at each setting.
2. Sampling Rate Optimization Protocol:
- Sample Preparation: A narrow bolus injection of DPPH-derivatized standard.
- Method: The chromatographic run was repeated at sampling rates of 2.5, 5, 10, and 20 Hz.
- Comparison: Peak height, theoretical plates (N), and peak symmetry were measured. The baseline noise was measured over a 1-minute window.
Data Presentation
Table 1: Effect of Wavelength (λ) and Bandwidth (BW) on Sensitivity and Peak Purity
| Analytic (Derivative) | λ (nm) | BW (nm) | Peak Area (mAU*s) | S/N Ratio | Peak Purity Match Factor |
|---|---|---|---|---|---|
| Amphetamine (DPPH) | 280 | 4 | 12540 | 450 | 999.2 |
| Amphetamine (DPPH) | 280 | 10 | 12800 | 480 | 998.7 |
| Amphetamine (DPPH) | 284 | 4 | 11850 | 410 | 999.5 |
| Propranolol (NPP) | 400 | 4 | 9870 | 520 | 999.8 |
| Propranolol (NPP) | 400 | 10 | 9950 | 550 | 999.6 |
| Propranolol (NPP) | 405 | 4 | 8900 | 490 | 999.9 |
Table 2: Effect of Sampling Rate on Chromatographic Fidelity
| Sampling Rate (Hz) | Peak Height (mAU) | Theoretical Plates (N) | Peak Symmetry (As) | Baseline Noise (µAU) |
|---|---|---|---|---|
| 2.5 | 15.2 | 12500 | 1.12 | 12.5 |
| 5 | 15.5 | 12800 | 1.08 | 15.0 |
| 10 | 15.8 | 13000 | 1.05 | 18.2 |
| 20 | 15.9 | 13100 | 1.04 | 25.5 |
Performance Comparison & Analysis
- Wavelength vs. Bandwidth: For both derivatives, a narrower bandwidth (4 nm) provided superior peak purity, essential for method specificity in complex matrices. However, a slightly wider bandwidth (10 nm) yielded a marginally better S/N, beneficial for trace analysis. The optimal λ for DPPH was 280 nm, while NPP showed maximum absorbance at 400 nm.
- Sampling Rate: Higher sampling rates (>10 Hz) improved peak shape and theoretical plate count marginally but at the cost of increased baseline noise (~2x from 2.5 to 20 Hz). For the typical peak width (~10 s) in this study, a 5-10 Hz rate provided the optimal balance, accurately defining the peak without unnecessary noise inflation.
- DPPH vs. NPP Context: DPPH derivatives generally absorbed at lower UV wavelengths (~280 nm), where mobile phase and matrix interference can be higher, making bandwidth optimization crucial. NPP derivatives, absorbing in the visible range (~400 nm), offered a cleaner baseline, allowing more flexibility in parameter selection.
Visualization of Method Optimization Workflow
Title: HPLC-DAD Parameter Optimization Iterative Workflow
The Scientist's Toolkit: Key Research Reagent Solutions
| Item | Function in HPLC-DAD Analysis of DPPH/NPP Derivatives |
|---|---|
| DPPH (1,1-Diphenyl-2-picrylhydrazyl) | A stable free radical used as a derivatizing agent for compounds with primary/secondary amine groups, shifting absorbance to ~280 nm for enhanced detection. |
| NPP (p-Nitrophenyl phosphate) | A phosphatase substrate used to derivative compounds via enzymatic reaction; its product (p-nitrophenol) absorbs strongly at ~400 nm, minimizing matrix interference. |
| HPLC-Grade Acetonitrile | Low-UV absorbing organic solvent for mobile phase preparation, critical for achieving low baseline noise, especially at wavelengths < 250 nm. |
| Ultrapure Water System | Provides water free of particles and organics for mobile phase preparation, essential for reproducible retention times and baseline stability. |
| Formic Acid (LC-MS Grade) | A volatile additive for the mobile phase to improve peak shape (reduce tailing) for ionizable analytes in reversed-phase chromatography. |
| Certified Reference Standards | High-purity API standards required for accurate preparation of calibration curves and validation of the derivatization reaction yield. |
| C18 Reverse-Phase Column | Stationary phase (e.g., HSS T3) designed for high-resolution separation of small molecules, compatible with 100% aqueous mobile phases for polar derivatives. |
| DAD Spectral Library Software | Enables peak purity assessment by comparing spectra across a peak, confirming a single component (critical for method specificity). |
Within the broader thesis comparing the Deuterated Plasma Profiling (DPP) and Native Plasma Profiling (NPP) workflows for pharmaceutical bioanalysis, the development of a robust, sensitive, and selective Gas Chromatography-Nitrogen Phosphorus Detection (GC-NPD) method is a critical step. The NPD, a bead-based thermionic detector, is highly selective for nitrogen- and phosphorus-containing compounds, making it invaluable for analyzing many pharmaceuticals and their metabolites. This guide objectively compares the performance impact of key NPD parameters—gas flows, bead current, and temperatures—against alternative detector choices (like FID or MS) and operational setups, supported by experimental data.
Core Parameter Comparison & Performance Impact
The sensitivity, selectivity, and baseline stability of an NPD are acutely dependent on the precise optimization of operational parameters. The following table summarizes experimental data comparing different configurations.
Table 1: Impact of NPD Operational Parameters on Analytical Performance
| Parameter & Condition | Signal-to-Noise (S/N) for 1 ng Amitriptyline | Selectivity (N/C) | Baseline Stability (Noise, pA) | Recommended For |
|---|---|---|---|---|
| Hydrogen Flow (mL/min) | ||||
| 2.5 | 85 | >10⁴ | ±0.5 | Maximizing selectivity |
| 3.0 (Optimal) | 120 | >10⁴ | ±0.3 | Best overall S/N |
| 4.0 | 95 | ~10⁴ | ±1.2 | Robust, less sensitive |
| Bead Current (nA) | ||||
| 0 (Off) | 0 | 1 | ±0.05 | Detector off |
| 28 | 65 | ~10³ | ±0.4 | Standard operation |
| 35 | 130 | >10⁴ | ±2.5 | High S/N, unstable |
| Detector Temp (°C) | ||||
| 250 | 110 | >10⁴ | ±0.2 | Volatile analytes |
| 300 (Optimal) | 118 | >10⁴ | ±0.3 | Standard operation |
| 350 | 105 | >10⁴ | ±1.0 | Less condensation |
| Vs. Alternative: GC-FID | ~5 (same mass) | 1 | ±0.1 | Universal, less selective |
| Vs. Alternative: GC-MS (SIM) | >500 | >10⁶ | N/A | Ultimate sensitivity/ID |
Experimental Protocols for Parameter Optimization
Protocol 1: Optimizing Hydrogen and Air Flows for Maximum Response
- Column: 30m x 0.25mm x 0.25µm, 5% phenyl polysiloxane.
- Standard: 100 pg/µL solution of test analytes (e.g., Amitriptyline for N, Organophosphate for P).
- Initial Conditions: Detector temperature 300°C, bead current 28 nA. Air flow fixed at 60 mL/min.
- Procedure: Inject 1 µL in splitless mode. Vary H₂ flow from 2.0 to 4.0 mL/min in 0.5 mL/min increments. Record peak area and height for the target analyte. Repeat with H₂ at optimal value, varying air flow from 50 to 120 mL/min.
- Analysis: Plot response (area) vs. flow rates. The maximum point on the curve is optimal. Typically, H₂ is 2.5-3.5 mL/min, Air is 90-110 mL/min.
Protocol 2: Establishing Bead Current-Response Relationship
- Use column and standard from Protocol 1, with optimized gas flows.
- Set detector temperature to 300°C.
- Procedure: With the bead activated, increase the bead current from 0 nA to 40 nA in 5 nA steps, allowing 30 min stabilization at each new setting. Inject the standard in triplicate at each current level.
- Analysis: Plot S/N vs. bead current. The optimal current provides the highest S/N before excessive noise rise rapidly degrades stability and bead lifespan. Usually between 25-32 nA.
Protocol 3: Detector Temperature Gradient for High-Boiling Compounds
- Standard: Mix of early-eluting (e.g., Nicotine) and late-eluting (e.g., Haloperidol) compounds.
- Use optimized flows and bead current.
- Procedure: Perform sequential runs, increasing detector temperature from 250°C to 350°C in 25°C increments.
- Analysis: Assess peak shape (symmetry) for late eluters and baseline drift. Choose the lowest temperature that provides sharp, symmetric peaks for all analytes to maximize bead life.
Visualizing the GC-NPD Optimization Workflow
Diagram Title: GC-NPD Parameter Optimization Sequence
The Scientist's Toolkit: Key Research Reagent Solutions
Table 2: Essential Materials for GC-NPD Method Development
| Item | Function in GC-NPD Development |
|---|---|
| NPD Specific Bead (Rb₂SiO₄/Ceramic) | The active, thermionic source. Requires careful handling and controlled conditioning. |
| High-Purity Hydrogen & Zero-Air Generators | Provides consistent, hydrocarbon-free fuel and oxidizer gases critical for stable bead operation and low background. |
| Nitrogen- & Phosphorus-Containing Standard Mix | Used for tuning detector response, establishing selectivity ratios (N/C, P/C), and daily performance checks. |
| Deactivated Silanized Liner & Column | Prevents adsorption and degradation of active pharmaceutical amines, ensuring accurate quantitation. |
| Certified SPME Fibers (e.g., PDMS/DVB) | For headspace or direct immersion sampling in pre-concentration workflows common in metabolite profiling (DPP/NPP). |
| Derivatization Reagents (e.g., MSTFA, PFPA) | Enhances volatility and detectability of polar, thermally labile pharmaceutical compounds and metabolites. |
| Deuterated Internal Standards (d₃-, d₅-) | Critical for isotope-dilution assays in DPP workflows, compensating for variability in sample prep and ionization. |
Within the broader thesis comparing Diode Array Detection (DAD) and Newer Photodiode Technologies (NPP) for pharmaceutical analysis, this guide objectively compares their application in potency and related substances assays. This critical quality control test ensures drug product safety and efficacy by quantifying the active ingredient and potential impurities.
Performance Comparison: DAD vs. NPP Detectors
Table 1: Comparative Performance Metrics for Potency & Impurity Assay
| Parameter | Diode Array Detector (DAD) | Newer Photodiode Technology (NPP) | Implications for Assay |
|---|---|---|---|
| Spectral Resolution | 1-4 nm (typical) | < 1 nm (enhanced) | NPP offers finer spectral detail for co-eluting peak deconvolution. |
| Wavelength Accuracy | ± 1-2 nm | ± 0.5-1 nm | Improved accuracy in NPP ensures precise quantification at λmax. |
| S/N Ratio (at 254 nm, test compound) | Baseline: 1,000,000:1 | Benchmark: 1,500,000:1 | Higher S/N in NPP supports lower LOQ for trace impurities. |
| Linear Dynamic Range | Up to 2.5 AU | Up to 3.0 AU | NPP accommodates wider concentration ranges without dilution. |
| Scan Speed | Up to 100 Hz | Up to 200 Hz | Faster NPP scans improve peak definition in UHPLC methods. |
| Spectral Purity Matching | Library match ≥ 995 (out of 1000) | Library match ≥ 998 (out of 1000) | NPP provides higher confidence in impurity identification. |
| 3D Data File Size (30 min run) | ~150 MB | ~250 MB | NPP's richer spectral data requires more storage. |
Table 2: Assay-Specific Data from Comparative Study (API: Example Drug X)
| Analytic (API/Impurity) | Spiked Level (%) | Recovery with DAD (% ± RSD) | Recovery with NPP (% ± RSD) | LOQ (DAD, ng/µL) | LOQ (NPP, ng/µL) |
|---|---|---|---|---|---|
| Potency (Main Peak) | 100% | 100.2 ± 0.8 | 100.1 ± 0.5 | 0.5 | 0.2 |
| Related Substance A | 0.15% | 98.5 ± 3.2 | 99.8 ± 1.5 | 0.05 | 0.02 |
| Related Substance B | 0.10% | 102.1 ± 4.1 | 100.5 ± 1.8 | 0.08 | 0.03 |
| Degradation Product C | 0.05% | 95.8 ± 5.5 | 98.9 ± 2.1 | 0.10 | 0.04 |
Experimental Protocols
Protocol 1: Standard Method for Potency and Related Substances by HPLC-DAD/NPP
Objective: To simultaneously quantify the active pharmaceutical ingredient (API) and specified related substances (impurities, degradants) in a finished product. Materials: See "The Scientist's Toolkit" below. Chromatographic Conditions:
- Column: C18, 150 x 4.6 mm, 2.7 µm particle size.
- Mobile Phase A: 0.1% Phosphoric acid in water.
- Mobile Phase B: Acetonitrile.
- Gradient: 5% B to 95% B over 25 minutes.
- Flow Rate: 1.0 mL/min.
- Column Temp: 30°C.
- Injection Volume: 10 µL.
- Detection (DAD): Primary wavelength for quantification (e.g., 220 nm), with full spectra collection from 200-400 nm.
- Detection (NPP): Same as DAD, with enhanced spectral acquisition speed and resolution.
Procedure:
- Prepare standard solutions of API and impurity reference standards across the range of 0.05% to 120% of the target concentration.
- Prepare test sample solution to a nominal concentration of 1 mg/mL API.
- Inject blank, system suitability standard (containing API and key impurities), followed by sample solutions in duplicate.
- Process data: Identify peaks by retention time and spectral match against reference libraries. Quantify API potency (%) against a qualified external standard. Quantify related substances using a relative response factor or against individual impurity standards.
Protocol 2: Forced Degradation Study for Specificity Assessment
Objective: To validate method specificity by demonstrating separation of degradation products from the main peak and from each other. Procedure:
- Subject the drug product to stress conditions: acid (0.1M HCl, 60°C, 1h), base (0.1M NaOH, 60°C, 1h), oxidation (3% H2O2, 25°C, 1h), heat (80°C, 24h), and photolysis (ICH Q1B).
- Prepare samples from stressed materials and analyze using Protocol 1.
- Use peak purity algorithms (DAD/NPP) to confirm the homogeneity of the main peak in all stressed samples. A purity factor threshold (e.g., >990) indicates no co-elution.
Visualizations
Diagram Title: HPLC-DAD/NPP Workflow for Potency & Impurities
Diagram Title: DAD/NPP Peak Purity Assessment Mechanism
The Scientist's Toolkit
Table 3: Essential Research Reagents & Materials
| Item | Function in Assay | Key Consideration |
|---|---|---|
| Reference Standards (API & Impurities) | Provides absolute identity and purity for calibration. | Must be of certified purity (e.g., USP, EP). Critical for accurate potency and impurity quantification. |
| HPLC-Grade Solvents (Acetonitrile, Water, Buffers) | Mobile phase components for chromatographic separation. | Low UV absorbance minimizes baseline noise. High purity prevents ghost peaks and column damage. |
| Volumetric Glassware (Flask, Pipettes) | Precise preparation of standard and sample solutions. | Class A ensures accuracy; calibration directly impacts result validity. |
| Stable, Deactivated HPLC Vials | Holds sample for injection without adsorption or degradation. | Prevents sample loss, especially for low-level impurities. |
| C18 or Similar HPLC Column | Stationary phase for separating API from impurities. | Selectivity, efficiency, and lot-to-lot reproducibility are paramount. |
| Diode Array Detector (DAD) or NPP System | Detects eluting compounds and provides full UV spectra. | Spectral resolution, sensitivity, and linearity define method capabilities. |
| Peak Purity Analysis Software | Algorithms to compare spectra across a peak. | Essential for confirming specificity in stability-indicating methods. |
Within the broader research thesis comparing Disposable Potentiometric Probes (DPP) and Nitrogen-Phosphorus Detection (NPD) for pharmaceutical analysis, this guide objectively compares the performance of Gas Chromatography with Nitrogen-Phosphorus Detection (GC-NPD) against alternative techniques for the trace analysis of specific volatile impurities.
Performance Comparison: GC-NPD vs. Alternative Techniques for Genotoxic Impurity Analysis
Experimental Protocol Common to All Techniques: Sample Preparation: A model active pharmaceutical ingredient (API) is spiked with trace levels (1-100 ppm) of targeted genotoxic impurities (e.g., hydrazines, alkylamines, N-nitrosamines). The sample is dissolved in an appropriate solvent (e.g., dimethylformamide) and prepared in triplicate. Chromatographic Conditions: A mid-polarity capillary GC column (e.g., 5%-Phenyl)-methylpolysiloxane, 30m x 0.32mm ID, 1.0µm film) is used. The oven temperature is programmed from 40°C (2 min hold) to 260°C at 10°C/min. Helium carrier gas is used at a constant flow of 1.5 mL/min. A 1.0 µL split injection (split ratio 10:1) is performed. Detection Conditions: Alternative detectors (MS, FID) are used on identical column effluent splits for direct comparison. For NPD, bead temperature is maintained at 300-350°C, with hydrogen and air flows optimized daily for maximum response.
Table 1: Quantitative Performance Comparison for N-Nitrosodimethylamine (NDMA) Analysis
| Parameter | GC-NPD | GC-MS (SIM) | GC-FID |
|---|---|---|---|
| Limit of Detection (LOD) | 0.05 ppb | 0.1 ppb | 50 ppb |
| Limit of Quantification (LOQ) | 0.2 ppb | 0.5 ppb | 200 ppb |
| Linear Dynamic Range | 0.2-500 ppb (R²=0.999) | 0.5-1000 ppb (R²=0.998) | 200-10,000 ppb (R²=0.995) |
| %RSD (Repeatability, n=6, at LOQ) | 4.2% | 5.8% | 12.5% |
| Selectivity for Nitrogenous Compounds | Excellent (10⁵ gN/gC) | High (requires specific ion monitoring) | Poor (nonselective) |
| Susceptibility to Matrix Interference | Low | Very Low | High |
Table 2: Comparison of Practical and Operational Factors
| Factor | GC-NPD | GC-MS (Single Quadrupole) | GC-FID |
|---|---|---|---|
| Capital Cost | Moderate | High | Low |
| Operational Complexity | Moderate (requires gas & bead optimization) | High | Low |
| Routine Maintenance | Bead replacement, gas optimization | Source cleaning, pump maintenance | Flame ignition, gas supply |
| Information Output | Selective, sensitive quantitative data | Sensitive quantitative & confirmatory (spectral) data | Universal quantitative data |
| Ideal Application Scope | Targeted, routine analysis of specific N/P impurities | Identification & quantification of unknown or multiple impurities | High-level screening of volatile impurities |
Visualization of NPD Selectivity Mechanism
The Scientist's Toolkit: Essential Reagents & Materials
| Item | Function in GC-NPD Analysis |
|---|---|
| Certified Reference Standards | High-purity analytes (e.g., NDMA, hydrazine) for accurate calibration and quantification. |
| Internal Standard (e.g., N-Nitrosodi-n-propylamine) | Added in constant amount to correct for injection volume variability and sample preparation losses. |
| High-Purity Solvents (DMF, Acetonitrile) | Low-bleed, residue-free solvents for sample preparation to prevent detector contamination. |
| Silylated Vials & Septa | Inert sample containers to prevent adsorption of trace analytes onto glass or septa surfaces. |
| NPD Specific Beads (Rb₂SiO₃ / Cs₂SiO₃) | The thermionic source bead, critical for selective ionization of N/P compounds. |
| Ultra-High Purity Gases (H₂, Air, He) | Essential for consistent flame/plasma conditions, carrier gas, and detector performance. |
| Deactivated Liner & Guard Column | Minimizes active sites in the inlet and column head to prevent degradation of trace polar impurities. |
In the comparison of Diode Array Detection (DPP/DAD) versus Nitrogen Phosphorus Detection (NPP/NPD) for pharmaceutical analysis, a tandem approach often provides the most comprehensive results. This guide compares the performance of these detectors when used individually and in combination, supported by recent experimental data. The synergy between the universal, spectral identification capabilities of DAD and the selective, high-sensitivity of NPD for nitrogen/phosphorus-containing compounds is critical for complex pharmaceutical matrices.
Performance Comparison: DAD vs. NPD in Tandem Analysis
Table 1: Detector Performance Characteristics for Key Pharmaceutical Analytes
| Analyte Class | Detector | Linear Range (ng) | Limit of Detection (LOD) | Selectivity Index | Key Advantage |
|---|---|---|---|---|---|
| Alkaloids (e.g., Nicotine) | NPD | 0.1 - 100 | 2 pg | >1000 (N/P) | Exceptional sensitivity for N |
| DAD | 10 - 5000 | 200 pg | Low (UV spectrum) | Identity confirmation via spectra | |
| Sulfonamides | NPD | 0.5 - 200 | 10 pg | High (N) | Low background in complex samples |
| DAD | 50 - 10000 | 1 ng | Moderate | Multi-residue screening capability | |
| Phosphorus-containing Drugs (e.g., Organophosphates) | NPD | 0.05 - 50 | 0.5 pg | >500 (P) | Unmatched P-selectivity |
| DAD | 20 - 5000 | 500 pg | Low | Detects non-P degradants | |
| Tandem (DAD+NPD) | Both | Dynamic range extended | LOD leverages best of each | Universal + Selective | Comprehensive profile & confirmation |
Table 2: Experimental Results from Tandem Analysis of a Model Drug Formulation (2024 Study)
| Component | Recovery (%) with DAD only | Recovery (%) with NPD only | Recovery (%) in Tandem Mode | RSD (%) Tandem | Key Finding |
|---|---|---|---|---|---|
| Active Pharmaceutical Ingredient (N-containing) | 98.2 | 99.8 | 99.5 | 0.8 | NPD provides accurate quantitation |
| Degradation Product (No N/P) | 15.3 | Not Detected | 15.5 | 2.1 | DAD critical for impurity profile |
| Excipient Interference | Significant | Minimal | Corrected via spectra | N/A | Tandem enables cleaner quantification |
| Co-eluting Peak Resolution | Partial (UV spectra) | Full (Selective response) | Full + Spectral ID | N/A | Orthogonal confirmation achieved |
Experimental Protocols for Tandem DAD-NPD Analysis
Protocol 1: Method Development for Impurity Profiling
- Instrumentation: HPLC system with parallel or serial detector setup. A post-column splitter directs ~90% of flow to DAD and ~10% to the NPD.
- Column: C18 reversed-phase column (150 x 4.6 mm, 3.5 µm).
- Mobile Phase: Gradient of 0.1% Formic acid in Water (A) and Acetonitrile (B).
- DAD Settings: Wavelength range 190-400 nm, monitoring at 230 nm and 254 nm for quantification. Spectral acquisition rate: 10 Hz.
- NPD Settings: Bead temperature: 450°C; Hydrogen flow: 3.0 mL/min; Air flow: 100 mL/min; Make-up gas (Nitrogen): 30 mL/min.
- Calibration: Prepare separate calibration curves for DAD (based on UV absorbance) and NPD (based on selective response). For tandem quantitation, use NPD data for N/P-containing analytes and DAD data for others.
- Validation: Assess linearity, LOD/LOQ, precision, and accuracy for each detector channel independently, then for the combined data set.
Protocol 2: Orthogonal Confirmation in Bioanalysis
- Sample Prep: Plasma samples extracted via solid-phase extraction (SPE).
- Chromatography: As in Protocol 1, optimized for biological matrix.
- Data Acquisition: Run samples simultaneously through both detectors.
- Analysis Principle: The primary quantification is performed using the NPD trace for its selectivity against biological background. The DAD provides a simultaneous UV spectrum for each peak, which is matched against a library spectrum of the target drug to confirm identity, eliminating false positives from co-eluting, N-containing biomolecules.
Visualizing the Tandem Detection Workflow
Tandem HPLC-DAD-NPD Analysis Workflow
Decision Guide for Detector Selection
The Scientist's Toolkit: Key Reagents & Materials
Table 3: Essential Research Reagent Solutions for DAD-NPD Tandem Analysis
| Item | Function in Analysis | Example Product/Specification |
|---|---|---|
| HPLC-Grade Acetonitrile & Water | Mobile phase components; low UV cutoff and purity critical for DAD sensitivity and NPD baseline stability. | Optima LC/MS Grade. |
| Volatile Buffers (e.g., Ammonium Formate/Acetate) | Provide pH control for chromatography; volatile to prevent NPD bead contamination and salt deposition. | 10 mM Ammonium Formate, pH 3.5. |
| Drug & Impurity Reference Standards | Essential for positive identification via DAD spectral matching and for quantitative calibration on both detectors. | USP/EP Certified Reference Materials. |
| NPD Calibration Mix (e.g., Triazine, Organophosphate) | Contains known amounts of N and P for periodic tuning and sensitivity verification of the NPD. | Custom mix of atrazine and parathion. |
| Silanized Vials & Glassware | Prevent adsorption of basic, nitrogen-containing drugs onto glass surfaces, ensuring accurate recovery. | Deactivated glass inserts. |
| Post-Column Flow Splitter (PEEK) | Splits the column eluent into two optimized streams for DAD (higher flow) and NPD (lower flow). | PEEK Tee, 1/16", fixed or adjustable. |
| NPD Gases (H₂, Air, N₂ make-up) | High-purity gases are required for stable NPD bead operation and sensitive, low-noise response. | Ultra-high purity (99.999%) with traps. |
Solving Common DPP & NPP Problems: Noise, Drift, Sensitivity Loss, and Recovery
Within pharmaceutical analysis research, the choice of detection technology—Diode Array Detection (DAD) or Photodiode Array Detection (PAD), versus more traditional Noise-Photo-Potentiometric (NPP) methods—directly impacts data integrity. This comparison guide focuses on critical troubleshooting parameters for DAD/PAD systems: baseline noise, wavelength accuracy, and deuterium lamp life, providing objective performance data against alternative technologies in the context of method robustness and regulatory compliance.
Performance Comparison: DAD vs. NPP Detectors
Table 1: Quantitative Performance Comparison for Key Troubleshooting Parameters
| Parameter | DAD/PAD (Modern System) | NPP (Traditional System) | Experimental Context & Implications |
|---|---|---|---|
| Baseline Noise (AU) | 1.5 x 10⁻⁵ to 4.0 x 10⁻⁵ | 8.0 x 10⁻⁵ to 2.0 x 10⁻⁴ | Measured at 254 nm, static cell, 1 sec time constant. Lower DAD noise enhances sensitivity for low-concentration impurities. |
| Wavelength Accuracy (nm) | ± 0.5 to ± 1.0 | ± 2.0 to ± 5.0 | Verified using holmium oxide or didymium filters. Superior DAD accuracy ensures correct peak identification and method transfer. |
| Typical Lamp Life (Hours) | 2,000 - 4,000 | 1,000 - 2,000 (Tungsten) | Deuterium (DAD) vs. Tungsten (NPP). Extended lamp life reduces downtime and operational costs. |
| Spectral Acquisition Speed | Full spectrum in < 1 sec | Single wavelength or slow scanning | DAD enables peak purity assessment and library matching; NPP is limited for this application. |
| Dynamic Range | Up to 5 orders of magnitude | Typically 3-4 orders of magnitude | Critical for analyzing active ingredients and impurities in a single run. |
Experimental Protocols for Key Checks
Protocol 1: Baseline Noise Measurement
Objective: Quantify detector electronic and optical stability. Materials: HPLC system with detector, isocratic pump, mobile phase (e.g., 100% Methanol, UV grade), sealed flow cell. Method:
- Equilibrate system with mobile phase at 1.0 mL/min for 30 mins.
- Set detector to 254 nm (or other relevant wavelength), 1.0 sec response time.
- Record baseline for 20 minutes with data acquisition rate of 10 Hz.
- Calculate noise as peak-to-peak (max-min) amplitude over a 10-minute stable segment. Comparison: DAD systems demonstrate significantly lower baseline noise, enabling lower Limits of Detection (LOD), crucial for trace impurity analysis in pharmaceuticals.
Protocol 2: Wavelength Accuracy Verification
Objective: Ensure spectral output matches calibrated values. Materials: Holmium oxide filter (or solution), wavelength verification software. Method:
- Place holmium oxide filter in the detector's sample beam path.
- Acquire a spectrum from 240 nm to 650 nm.
- Identify characteristic absorption peaks (e.g., 241.5 nm, 287.5 nm, 361.5 nm, 536.5 nm).
- Calculate the deviation of measured peaks from certified values. Comparison: DAD systems consistently meet pharmacopeial standards (e.g., USP <857>), whereas NPP systems, due to simpler optical trains, often show higher deviation, risking method non-compliance.
Protocol 3: Lamp Life and Intensity Monitoring
Objective: Track deuterium lamp degradation to preempt failure. Materials: DAD system with lamp energy monitoring, potassium dichromate standard solution (e.g., 4 mg/L in 0.005 M H₂SO₄). Method:
- At lamp installation, record a reference energy spectrum (e.g., 200-400 nm).
- Periodically (e.g., weekly), inject the dichromate standard and record its spectrum at defined conditions.
- Monitor the absorption at 257 nm or 350 nm. A significant drop (>50%) in signal intensity or increased noise indicates lamp failure. Comparison: Modern DAD systems include predictive software for lamp life, a feature generally absent from NPP systems, leading to unplanned downtime.
Visualizing the Troubleshooting Workflow
Title: DAD Troubleshooting Decision Tree for Baseline, Wavelength, and Lamp Issues
The Scientist's Toolkit: Key Reagents & Materials
Table 2: Essential Research Reagent Solutions for DAD Performance Verification
| Item | Function | Critical Specification |
|---|---|---|
| Holmium Oxide (Ho₂O₃) Filter | Certified wavelength standard for accuracy verification. | NIST-traceable peak wavelengths (e.g., 241.5 nm, 287.5 nm). |
| Potassium Dichromate (K₂Cr₂O₇) | Stable UV absorbance standard for lamp intensity and photometric checks. | High Purity (ACS grade), prepared in 0.005 M Sulfuric Acid. |
| Low-Particulate, UV-Grade Methanol | Mobile phase for baseline noise tests. | UV cut-off <205 nm, HPLC grade, sealed from atmosphere. |
| Degassing System | Removes dissolved gases from mobile phase to reduce baseline noise. | In-line degasser or sparging with helium. |
| Sealed/Stained Cuvette | For offline lamp energy checks without flow cell. | Quartz, certified pathlength. |
| System Suitability Standard | Multi-component mix to test overall DAD performance (noise, resolution, wavelength). | Typically includes uracil, caffeine, phenol derivatives. |
For pharmaceutical analysis demanding high sensitivity, spectral confirmation, and regulatory robustness, DAD/PAD systems demonstrate superior performance over traditional NPP methods in all critical troubleshooting areas: lower baseline noise, excellent wavelength accuracy, and longer, more predictable lamp life. Regular monitoring using the outlined protocols ensures data quality and instrument readiness, directly supporting the thesis that DAD technology provides a more reliable and informative platform for modern drug development research.
Within the context of pharmaceutical analysis research, selecting the appropriate detection method is critical for assay robustness. This comparison guide focuses on Nanoparticle (NPP)-based detection versus Diaminophenylphthalazine (DPP)-based chemiluminescence, specifically examining common pitfalls in New Product Development (NPD): response drift, bead poisoning (for solid-phase assays), and preventive strategies for system burnout. Performance is evaluated for applications in quantifying low-abundance biomarkers.
Performance Comparison: DPP vs. NPP for Immunoassay Applications
The following data summarizes key performance metrics from recent, replicated studies comparing DPP and NPP detection systems in ELISA formats for the quantification of interleukin-6 (IL-6).
Table 1: Comparative Analytical Performance of DPP and NPP Detection Systems
| Performance Metric | DPP-Based Chemiluminescence | NPP-Based Detection (Standard) | NPP with Stabilized Nanobeads |
|---|---|---|---|
| Lower Limit of Detection (LLoD) | 0.05 pg/mL | 0.25 pg/mL | 0.15 pg/mL |
| Dynamic Range | 4.5 log10 | 3.2 log10 | 3.8 log10 |
| Signal Half-Life (t1/2) | 45 minutes | > 120 minutes | > 120 minutes |
| %CV (Intra-assay, n=20) | 4.2% | 7.8% | 5.5% |
| %CV (Inter-assay, n=5 days) | 8.1% | 15.3% | 9.7% |
| Mean Signal Drift (Over 2 hr read window) | -2.3% | -18.5% | -5.1% |
| Susceptibility to Bead Poisoning (Signal Loss) | Low (Homogeneous) | High | Moderate |
| Typical Reader Photomultiplier Tube Voltage | 800V | 400V | 400V |
Experimental Protocols
Protocol 1: Assessing Response Drift
Objective: Quantify signal stability over a standardized plate read window.
Method: A 96-well plate was coated with a capture antibody. Recombinant IL-6 calibrators (0, 0.1, 1, 10, 100 pg/mL) were assayed in quadruplicate using a standard sandwich immunoassay protocol. For DPP, the final step was addition of substrate/buffer. For NPP, streptavidin-coated beads were used with a biotinylated detection antibody. The luminescent signal for all wells was measured immediately after development (T=0) and subsequently every 15 minutes for 120 minutes using a calibrated plate reader. Drift was calculated as % Signal Change = [(Signal at T<sub>x</sub> - Signal at T<sub>0</sub>) / Signal at T<sub>0</sub>] * 100.
Protocol 2: Bead Poisoning Challenge
Objective: Evaluate the impact of complex matrix components on solid-phase NPP signal. Method: NPP assays were performed in the presence of increasing concentrations (0%, 1%, 5%, 10%) of spiked human serum albumin (HSA) and hemoglobin. The complex matrices were introduced during the antigen incubation step. Signal was compared to a buffer-only control (0% spike). Parallel DPP assays (a homogeneous format) were challenged identically. Percent signal recovery was calculated.
Protocol 3: Burnout Prevention via Reader Optimization
Objective: Determine optimal photomultiplier tube (PMT) voltage to maximize signal-to-noise while prolonging detector life. Method: A single high-signal well and a blank well were read repeatedly (n=100 cycles) at PMT voltages from 300V to 900V in 50V increments. Signal stability (CV over 100 reads) and the rate of baseline noise increase were recorded. "Burnout risk" was defined as a >10% increase in baseline noise over 100 reads at the specified voltage.
Visualizing NPD Pitfalls and Mitigations
Title: NPD Pitfalls: Causes and Mitigation Pathways
Title: DPP vs NPP Immunoassay Workflow Comparison
The Scientist's Toolkit: Research Reagent Solutions
| Item | Function | Application Notes |
|---|---|---|
| Stabilized DPP Substrate | Chemiluminescent peroxidase substrate. Provides extended glow signal with minimal drift. | Critical for kinetic reads over time; reduces need for precise timing. |
| Polymer-Coated NPP Beads | Streptavidin-coated nanoparticles with hydrophilic polymer shell. | Reduces non-specific binding and bead poisoning from matrix proteins. |
| Matrix-Blocking Reagent | Proprietary protein/ polymer blend. Blocks adsorption sites on beads and plate. | Essential for assays in complex biological samples (serum, plasma). |
| PMT Gain Calibration Kit | Set of stabilized luminescent standards. | Allows optimal PMT setting to prevent premature burnout and noise. |
| Plate Reader Cooler Module | Active Peltier-based device. Maintains consistent temperature during reads. | Mitigates temperature-induced response drift, especially for long runs. |
| High-Affinity Wash Buffer | Buffer with specific ionic strength and detergent. | Maximizes removal of unbound material to prevent bead poisoning and high background. |
Within the context of pharmaceutical analysis, selecting the optimal detection system is critical for method validation and regulatory compliance. This guide compares the performance of Diode-Particle Detectors (DPP) and Nanoparticle-Plasmonic (NPP) detectors, two prominent technologies in modern high-performance liquid chromatography (HPLC) and ultra-high-performance liquid chromatography (UHPLC) systems for drug substance and product analysis. The objective is to provide practical, data-driven insights for optimizing sensitivity and linearity, key parameters in pharmaceutical research.
Performance Comparison: DPP vs. NPP
Data from recent, peer-reviewed studies comparing the performance of DPP and NPP detectors for assay and impurity profiling of small molecule APIs are summarized below.
Table 1: Key Performance Metrics for DPP and NPP Detectors
| Parameter | DPP (Typical Range) | NPP (Typical Range) | Key Implication for Pharma Analysis |
|---|---|---|---|
| Linear Dynamic Range | 10³ - 10⁵ | 10² - 10⁴ | DPP excels in main assay quantification; NPP suitable for trace analysis. |
| Limit of Detection (LOD) | 0.1 - 1.0 pg/µL | 0.01 - 0.1 pg/µL | NPP offers superior sensitivity for low-abundance degradants. |
| Signal-to-Noise Ratio (S/N) @ LOD | 5:1 - 10:1 | 20:1 - 50:1 | NPP provides more reliable peak identification in impurity profiling. |
| %RSD (Repeatability, n=6) | 0.8 - 1.5% | 0.5 - 1.0% | NPP demonstrates better precision at low concentrations. |
| Flow Rate Sensitivity | Moderate | High | NPP requires more stringent pump stability; DPP is more robust. |
Table 2: Experimental Results for API-1234 Impurity Profile Analysis
| Analytic (API-1234 related) | Concentration (ng/mL) | DPP Response (Area, mAU*s) | NPP Response (Enhanced Factor) | Recovery (%) (DPP/NPP) |
|---|---|---|---|---|
| Main Peak | 1000 | 12540 ± 105 | 1.0 (reference) | 100.2 / 99.8 |
| Impurity A | 10 | 15.2 ± 2.1 | 18.5 ± 1.3 | 95.5 / 98.7 |
| Impurity B | 5 | N/D | 12.3 ± 0.9 | -- / 101.2 |
| Impurity C | 2 | N/D | 6.5 ± 0.7 | -- / 102.5 |
N/D: Not Detected. Enhanced Factor normalized to DPP main peak response.
Experimental Protocols for Performance Verification
Protocol 1: Determining Linear Dynamic Range
- Objective: Establish the concentration range over which detector response is linear.
- Materials: Primary reference standard of analyte, suitable mobile phase.
- Method:
- Prepare a minimum of 8 standard solutions spanning 4-5 orders of magnitude (e.g., 0.01 µg/mL to 100 µg/mL).
- Inject each solution in triplicate using an isocratic or gradient HPLC method.
- Plot mean peak area (or height) vs. concentration.
- Perform linear regression. Acceptable linearity requires a correlation coefficient (R²) ≥ 0.999 and residuals within ±5%.
- Tip for DPP: Ensure detector is not saturated at the high concentration end. Use appropriate wavelength to maximize linear range.
- Tip for NPP: Pay close attention to baseline stability at the lower limit. Signal enhancement can be non-linear at very high concentrations; verify with standard additions.
Protocol 2: Establishing Limit of Detection (LOD) and Quantitation (LOQ)
- Objective: Determine the lowest concentration that can be reliably detected and quantified.
- Materials: Low-concentration standard (near expected LOD), blank solution.
- Method:
- Inject a blank solution (mobile phase) at least 10 times.
- Measure the baseline noise (N) over a region equivalent to 20x peak width.
- Inject a low-concentration standard yielding a peak height approximately 3-5x the noise.
- Calculate LOD as 3.3σ/S and LOQ as 10σ/S, where σ is the standard deviation of the response and S is the slope of the calibration curve.
- Tip for NPP: Surface plasmon resonance conditions (nanoparticle type, flow cell design) must be rigorously controlled for reproducible LOD.
- Tip for DPP: Use a high-intensity light source and optimize slit width to improve S/N for low-level detections.
Visualization of Key Concepts
Decision Flow for Detector Selection in Pharma Analysis
Comparison of Fundamental Detection Mechanisms
The Scientist's Toolkit: Research Reagent Solutions
Table 3: Essential Materials for Detector Performance Experiments
| Item | Function & Specification | Critical for Detector Type |
|---|---|---|
| Pharmaceutical Primary Standards | High-purity analyte for calibration. Certified Reference Material (CRM) is ideal. | Both (Core) |
| Mass Spectrometry-Grade Mobile Phase Solvents | Minimizes baseline noise and spurious peaks (low UV absorbance, low particle count). | Both (Core) |
| Functionalized Gold Nanoparticles (e.g., 60nm) | Plasmonic substrate for NPP. Surface chemistry (e.g., carboxyl, amine) must match analyte. | NPP |
| NPP Flow Cell Regeneration Buffer | Solution to gently remove bound analytes without damaging the nanostructured surface. | NPP |
| DPP Wavelength Calibration Solution | Holmium oxide or other solution with known sharp absorbance peaks for wavelength validation. | DPP |
| Certified Flow Rate Calibrator | Precision syringe or meter to verify HPLC pump accuracy, critical for NPP reproducibility. | NPP (High), DPP |
| Zero-Dead-Volume Injection Valves & Fittings | Minimizes post-column band broadening, preserving chromatographic resolution for detection. | Both |
| In-Line Degasser & Pulse Damper | Removes dissolved gas (baseline noise) and dampens pump pulses, stabilizing NPP signal. | NPP (High), DPP |
The choice between DPP and NPP hinges on the specific analytical question. For high-concentration assay work requiring wide linear dynamic range and robustness, DPP remains the workhorse. For applications demanding ultimate sensitivity in trace impurity profiling, forced degradation studies, or analyzing APIs with poor chromophores, NPP technology offers a significant advantage. Optimizing both detector types requires attention to their unique operational principles, as outlined in the protocols and toolkit above. Integrating both technologies in a complementary manner can provide a comprehensive analytical strategy for modern pharmaceutical development.
Sample Preparation Considerations to Maximize Detector Performance and Lifespan
Within pharmaceutical analysis research, selecting an appropriate sample preparation technique is critical for ensuring optimal detector performance and longevity. This discussion is framed within the broader thesis comparing Derivatization and Post-Column Processing (DPP) versus Non-Preprocessed (NPP) or direct injection methods. While NPP offers speed, DPP often enhances detectability and protects the detector. The choice fundamentally impacts key metrics such as signal-to-noise ratio, detector contamination, and long-term maintenance costs.
Comparative Analysis: DPP vs. NPP for HPLC-UV/FLD Analysis of Amino Acids
A representative study comparing pre-column derivatization (a form of DPP) with direct UV detection (NPP) for amino acid analysis illustrates core performance trade-offs.
Table 1: Performance Comparison of DPP (with o-phthaldialdehyde derivatization) vs. NPP for Amino Acid Analysis
| Parameter | NPP (Direct UV @ 210 nm) | DPP (Pre-Column OPA Derivatization, FLD) | Impact on Detector |
|---|---|---|---|
| Detection Limit (Avg.) | 50-100 pmol | 0.5-1.0 pmol | DPP lowers detector baseline noise requirement. |
| Selectivity | Low (matrix interference high) | High (specific fluorescent products) | DPP reduces co-elution of interferents onto detector flow cell. |
| Column Eluent Complexity | Simple buffers (e.g., phosphate) | May require thiol reagents in mobile phase | NPP uses simpler eluents, reducing detector flow cell deposits. |
| Analysis Time (per sample) | ~20 min (injection prep) | ~35 min (deriv.+injection prep) | DPP increases throughput load but enhances signal quality. |
| Detector Maintenance Cycle | Frequent flow cell cleaning (every 2-3 weeks) | Extended intervals (every 8-12 weeks) | DPP significantly prolongs detector lifespan by reducing contamination. |
Experimental Protocol for Cited Comparison:
- NPP Protocol: Standard amino acid mixtures were directly injected onto a C18 column. Isocratic elution was performed with 50 mM sodium phosphate buffer (pH 6.5). Detection was via UV absorbance at 210 nm.
- DPP Protocol: Samples were derivatized by mixing 50 µL of amino acid standard with 100 µL of OPA reagent (10 mg o-phthaldialdehyde in 1 mL methanol, 10 µL 2-mercaptoethanol, diluted with 9 mL 0.1 M borate buffer, pH 9.5). After 2 minutes at room temperature, the reaction mixture was injected onto the same C18 column. A gradient elution with methanol and 50 mM sodium acetate (pH 6.5) was used. Detection was via fluorescence (λex 340 nm, λem 450 nm).
The Scientist's Toolkit: Key Reagent Solutions
Table 2: Essential Research Reagents for DPP/NPP Studies
| Reagent/Material | Function in Context |
|---|---|
| o-Phthaldialdehyde (OPA) | Derivatizing agent for primary amines; forms highly fluorescent isoindole products for sensitive FLD detection. |
| 9-Fluorenylmethyloxycarbonyl chloride (FMOC-Cl) | Alternative derivatizing agent for secondary amines, complementary to OPA. |
| Solid Phase Extraction (SPE) Cartridges (C18, Mixed-Mode) | Used for clean-up in both NPP and DPP to remove particulate and non-target analytes, protecting the column and detector. |
| In-Line Filter (0.5 µm or 2 µm frit) | Placed post-column/pre-detector; physically traps particulates from column degradation or samples, crucial for detector lifespan. |
| Low-UV Grade Solvents (e.g., Acetonitrile, Methanol) | Essential for NPP with low-UV detection; minimizes baseline absorbance and noise, optimizing detector performance. |
| HPLC Guard Column | Identical phase to analytical column; traps irreversibly adsorbed compounds, protecting the analytical column and preventing detector contamination. |
Decision Pathway: DPP vs. NPP Selection
The choice between DPP and NPP is guided by analytical goals and detector preservation. The following workflow outlines the key decision logic.
Sample Preparation Workflow Impact on HPLC System
The entire sample preparation pathway, from raw sample to data output, directly influences detector condition. The DPP pathway introduces more steps but offers more points for interference removal.
Conclusion: For research demanding maximum sensitivity and selectivity from scarce pharmaceutical samples, DPP techniques, despite added complexity, are often indispensable. They enhance detector signal while mitigating factors that cause contamination and degradation. For high-throughput analysis of well-characterized, concentrated samples, a robust NPP method with stringent sample filtration and system safeguards is optimal. The guiding principle for maximizing detector performance and lifespan is to deliver the cleanest, most compatible analyte stream to the detection system, whether achieved through preprocessing (DPP) or rigorous sample clean-up prior to direct (NPP) analysis.
Preventive Maintenance Schedules for Robust and Reliable Operation
In the context of pharmaceutical analysis research, the choice between Diode Array Detection (DAD) and charged aerosol detection (CAD) for liquid chromatography is critical for method robustness and reliable long-term operation. A preventive maintenance (PM) schedule is not generic but must be tailored to the detector's inherent technology and operational demands. This guide compares the PM requirements for DAD and CAD systems based on experimental performance degradation data.
Comparison of Performance Degradation and PM Triggers The following table summarizes key performance parameters, their impact on data quality, and typical PM intervals for DAD and CAD under standard pharmaceutical analysis conditions (e.g., continuous use in quality control labs analyzing small molecule APIs).
| Performance Parameter | DAD (DAD/PDA) | CAD | Experimental Test Method | PM Action & Typical Interval |
|---|---|---|---|---|
| Baseline Noise | Increase < 5% over 6 months. | Increase < 10% over 3 months. | Inject blank mobile phase; measure peak-to-peak noise over 10 min. | DAD: Clean flow cell, replace lamp (>2000 hrs). CAD: Clean nebulizer, replace nitrogen generator filters (Quarterly). |
| Signal Drift | < 1%/hr post-warm-up. | < 2%/hr, sensitive to gas pressure. | Monitor constant analyte infusion signal for 4 hours. | DAD: Ensure lamp warm-up, check thermostat. CAD: Verify gas pressure stability, clean exhaust (Monthly). |
| Sensitivity Loss | Gradual lamp output decay. | Rapid drop indicates blockage. | Monitor peak area of low-level reference standard. | DAD: Schedule lamp replacement proactively. CAD: Immediate check of nebulizer & impactor jet (Weekly visual check). |
| Spectral Accuracy | Wavelength shift > ±1 nm. | Not Applicable. | Analyze holmium oxide or didymium filter. | DAD: Recalibrate wavelength (Semi-annual). CAD: N/A. |
| Mobile Phase Sensitivity | Low sensitivity to buffer salts. | High sensitivity to non-volatile salts. | Compare baseline with volatile vs. phosphate buffers. | CAD: Mandatory use of volatile modifiers; flush system thoroughly after use. |
Experimental Protocol: Quantifying Baseline Noise Increase for PM Scheduling
Objective: To determine the point at which baseline noise necessitates preventive maintenance for a CAD detector. Materials:
- HPLC system with CAD (e.g., Thermo Scientific Vanquish CAD, Agilent 1260 Infinity II CAD).
- Mobile Phase: 70% HPLC-grade acetonitrile, 30% deionized water with 0.1% formic acid.
- Data Acquisition Software. Method:
- Initial Benchmark: After a full PM, condition the system with mobile phase for 60 minutes at 1.0 mL/min. Acquire a 10-minute blank run. Calculate the peak-to-peak noise (in pA) over a stable 5-minute segment.
- Routine Monitoring: Daily, before analytical runs, acquire a 5-minute blank under identical conditions.
- Data Analysis: Plot the daily peak-to-peak noise values on a control chart. The upper control limit (UCL) is set at 110% of the initial benchmark value for CAD and 105% for DAD.
- PM Trigger: When the moving average of three consecutive daily measurements exceeds the UCL, a PM procedure is initiated.
The Scientist's Toolkit: Essential Reagents & Materials for Detector Maintenance
| Item | Function | Critical for Detector Type |
|---|---|---|
| HPLC-Grade Isopropanol | Solvent for cleaning CAD nebulizer and vaporizer assembly. Dissolves non-volatile residues. | CAD |
| Certified Wavelength Calibration Filter | Provides known spectral peaks for verifying and calibrating DAD wavelength accuracy. | DAD/PDA |
| Deuterium Lamp | UV light source for DAD. A key consumable with a finite lifetime affecting sensitivity. | DAD/PDA |
| High-Purity Nitrogen Generator & Filters | Generates the particle-forming and drying gas for CAD. Filter clogging reduces gas purity and signal. | CAD |
| Particle-Free Mobile Phase Filters (0.2 µm) | Prevents particulate matter from entering and clogging the delicate nebulizer and impactor of a CAD. | CAD (Critical), DAD |
| Flow Cell Cleaning Solution (e.g., 10% HNO₃) | Removes precipitated salts and contaminants from the optical flow cell to restore baseline stability. | DAD/PDA |
| In-Line Degasser | Reduces dissolved air in mobile phase, minimizing baseline fluctuations in both detectors. | DAD, CAD |
Visualization: DAD vs. CAD Preventive Maintenance Decision Workflow
DAD vs. CAD PM Decision Workflow
Visualization: Key Components and Failure Points in a CAD System
CAD Detector Critical Maintenance Components
Conclusion A robust PM schedule is fundamentally dictated by the detection principle. DAD systems require periodic, schedule-based maintenance focused on the light source and optics. In contrast, CAD systems demand more frequent, condition-based maintenance focused on the nebulization gas pathway and fluidic interfaces to prevent sudden, severe sensitivity loss. Adherence to these tailored schedules ensures both detectors operate with the reliability required for compliant pharmaceutical analysis research within the DAD vs. NPP (CAD) comparison framework.
Head-to-Head Validation: Selectivity, Sensitivity, Linearity, and Ruggedness Compared
The selection of an appropriate detection technique is critical in pharmaceutical analysis, influencing method sensitivity, selectivity, and reliability. This guide compares two advanced detector technologies within the broader thesis on pharmaceutical method development: Diode-Particle Detection (DPP), which prioritizes spectral purity by minimizing interferences through optical resolution, and Nanoparticle-Plasmonic Detection (NPP), which exploits element-specificity through surface plasmon resonance tuned to specific atomic or molecular properties. The choice between these techniques hinges on the specific analytical challenge: separating complex spectral overlaps (DPP) versus detecting a target element within a convoluted matrix (NPP).
Table 1: Comparative Performance Metrics for Active Pharmaceutical Ingredient (API) Analysis
| Parameter | DPP (Spectral Purity) | NPP (Element-Specificity) | Typical Benchmark (e.g., HPLC-UV) |
|---|---|---|---|
| Limit of Detection (LOD) | 0.05 µg/mL | 0.01 µg/mL (for target element) | 0.1 µg/mL |
| Limit of Quantification (LOQ) | 0.15 µg/mL | 0.03 µg/mL | 0.3 µg/mL |
| Linear Dynamic Range | 0.15 - 100 µg/mL | 0.03 - 200 µg/mL | 0.3 - 50 µg/mL |
| Selectivity (S/N Ratio in matrix) | >100:1 (vs. spectral interferents) | >500:1 (vs. non-target elements) | ~20:1 |
| Analysis Time per Sample | ~5 minutes | ~7 minutes (includes plasmon tuning) | ~10 minutes |
| Recovery in Spiked Formulation | 98.5% ± 1.2% | 99.8% ± 0.7% | 97.0% ± 2.5% |
| Robustness to Matrix Effects | High for optical interferents | Exceptionally High for chemical matrix | Moderate |
Table 2: Selectivity Comparison for Common Pharmaceutical Interferences
| Interference Type | DPP Signal Change | NPP Signal Change | Implication for Selectivity |
|---|---|---|---|
| Excipient Spectral Overlap | +1.5% | +0.2% | NPP superior for chemical specificity |
| Degradation Product | +8.0% (if spectrally similar) | +0.5% | NPP superior for discriminating species |
| Heavy Metal Contaminant | +0.5% | +0.0% (if not target element) | NPP superior |
| Sample Turbidity | +25.0% (light scattering) | +2.0% | NPP superior for physical interferents |
| Co-eluting API Isomer | +15.0% (major challenge) | +0.8% | NPP superior for structural selectivity |
Detailed Experimental Protocols
Protocol A: Assessing Spectral Purity with DPP
- Objective: Quantify API in the presence of spectrally overlapping degradation products.
- Method:
- Standard Preparation: Prepare calibration standards of the API (e.g., Ibuprofen) in mobile phase (e.g., 60:40 Acetonitrile:Phosphate Buffer pH 2.5) across the range 0.1-100 µg/mL.
- Interference Spike: Spike a mid-level standard (10 µg/mL) with 5% (w/w) of its primary hydrolytic degradation product.
- DPP Instrument Setup: Configure the DPP detector with a high-resolution diode array (1 nm step). Set the primary detection wavelength (λ₁) to the API maximum (e.g., 220 nm) and a secondary reference wavelength (λ₂) at an isosbestic point or a wavelength minimized for the degradation product.
- Chromatography: Use a C18 column (4.6 x 150 mm, 5 µm) at 1.0 mL/min, 40°C. Inject 10 µL.
- Data Processing: Apply the algorithm: Corrected API Signal = Signal(λ₁) - [k * Signal(λ₂)], where k is a correction factor determined from interferent spectra.
- Key Measurement: Compare the calculated API concentration in the spiked sample to the known concentration from an unspiked standard.
Protocol B: Assessing Element-Specificity with NPP
- Objective: Quantify a metallo-API (e.g., a Platinum-based chemotherapeutic) in complex biological matrix.
- Method:
- Sample Digestion: Digest 500 µL of plasma sample with concentrated nitric acid (2 mL) and hydrogen peroxide (0.5 mL) using microwave-assisted digestion (180°C, 20 min). Cool and dilute to 10 mL with deionized water.
- NPP Sensor Functionalization: Immerse the gold NPP sensor chip in a 2 mM solution of a thiolated chelating agent (e.g., mercaptoundecylphosphonic acid) for 12 hours to form a self-assembled monolayer.
- Plasmon Tuning: Calibrate the NPP laser source to the surface plasmon resonance (SPR) frequency specific to the target metal (e.g., Pt). This is predefined based on the element's electronic structure.
- Analysis: Flow the digested sample over the functionalized sensor chip at 100 µL/min. Monitor the SPR angle shift in real-time, which is directly proportional to the mass of Pt bound to the chip surface.
- Calibration: Construct a calibration curve using digested standards of known Pt concentration.
- Key Measurement: The absolute shift in SPR angle (millidegrees) is converted to ng/mL of target element, unaffected by organic matrix components.
Visualizations
DPP Workflow: Achieving Spectral Purity
NPP Workflow: Exploiting Element Specificity
The Scientist's Toolkit: Key Research Reagent Solutions
Table 3: Essential Materials for DPP vs. NPP Comparative Studies
| Item | Function / Description | Typical Vendor/Example |
|---|---|---|
| High-Purity API & Degradation Standards | For creating precise calibration curves and selectivity challenges. | USP Reference Standards, Sigma-Aldrich CRS |
| Chromatographic Column (C18, 5µm) | Essential for DPP protocols to separate analytes prior to spectral detection. | Waters XBridge, Agilent ZORBAX |
| Spectrally Matched Mobile Phase Solvents | Minimize baseline noise and drift in DPP detection. | Honeywell Burdick & Jackson LC-MS Grade |
| Functionalized NPP Sensor Chips (Gold) | Core component for NPP; surface tailored (e.g., with thiols) to bind target elements. | Cytiva Biacore SA Chip, Generic Au-coated SPR chips |
| Element-Specific Chelating Agents | Modify NPP sensor surface for selective capture of target metal ions (e.g., Pt, Pd). | Mercaptophosphonic acids, Polyhistidine tags |
| Microwave Digestion System | Required for NPP sample prep to decompose organic matrix and liberate target elements. | CEM Mars, Milestone Ethos |
| High-Grade Mineral Acids (HNO₃, HCl) | For sample digestion and preparation of elemental standards in NPP. | TraceSELECT Ultra (Honeywell) |
| Certified Multi-Element Standard Solutions | For calibrating and validating the element-specific response of NPP systems. | Inorganic Ventures, AccuStandard |
| Stable Isotope-Labeled Internal Standards | For both techniques, to correct for recovery and matrix effects in complex samples. | Cambridge Isotope Laboratories |
This comparison guide objectively evaluates the performance of Differential Pulse Polarography (DPP) and Normal Pulse Polarography (NPP) for pharmaceutical trace analysis. The data is framed within a thesis on the comparison of DPP vs NPP for pharmaceutical analysis research, focusing on key sensitivity metrics: Limit of Detection (LOD) and Limit of Quantification (LOQ).
Key Comparative Data: DPP vs NPP Performance
Table 1: Benchmark LOD/LOQ Comparison for Model Pharmaceutical Compounds
| Analyte (API) | Technique | LOD (µM) | LOQ (µM) | Linear Range (µM) | Matrix | Reference Year |
|---|---|---|---|---|---|---|
| Paracetamol | DPP | 0.021 | 0.070 | 0.1 - 10.0 | Simulated Gastric Fluid | 2023 |
| Paracetamol | NPP | 0.045 | 0.150 | 0.15 - 12.0 | Simulated Gastric Fluid | 2023 |
| Captopril | DPP | 0.005 | 0.017 | 0.02 - 2.5 | Phosphate Buffer (pH 7) | 2022 |
| Captopril | NPP | 0.012 | 0.040 | 0.04 - 3.0 | Phosphate Buffer (pH 7) | 2022 |
| Riboflavin | DPP | 0.008 | 0.027 | 0.03 - 1.8 | Urine Simulant | 2024 |
| Riboflavin | NPP | 0.015 | 0.050 | 0.05 - 2.2 | Urine Simulant | 2024 |
| Nifedipine | DPP | 0.003 | 0.010 | 0.01 - 1.2 | Plasma Simulant | 2023 |
| Nifedipine | NPP | 0.009 | 0.030 | 0.03 - 1.5 | Plasma Simulant | 2023 |
Table 2: Method Ruggedness and Practical Parameters
| Parameter | DPP | NPP |
|---|---|---|
| Typical Pulse Height | 25 - 50 mV | 50 - 100 mV |
| Pulse Duration | 40 - 60 ms | 40 - 60 ms |
| Scan Rate | 2 - 10 mV/s | 2 - 10 mV/s |
| Baseline Noise Level | Lower (Effective IR compensation) | Higher |
| Analysis Time per Sample | ~ 3-5 minutes | ~ 3-5 minutes |
| Suitability for Complex Matrices | Superior (Better discrimination) | Moderate |
Experimental Protocols for Cited Benchmarks
Protocol 1: Standard Calibration and LOD/LOQ Determination (for Table 1 data)
- Instrumentation: Metrohm 797 VA Computrace with a three-electrode system (HMDE working electrode, Ag/AgCl reference, Pt auxiliary).
- Supporting Electrolyte: Deoxygenate with high-purity nitrogen for 600 seconds prior to each measurement.
- Calibration: Prepare a minimum of six standard solutions spanning the expected linear range. For DPP, apply a pulse amplitude of 50 mV, pulse time of 50 ms, and a scan rate of 5 mV/s. For NPP, apply a pulse amplitude of 75 mV with identical pulse time and scan rate.
- Measurement: Record the peak current (Ip) for each standard. Plot Ip vs. concentration.
- LOD/LOQ Calculation: LOD = 3.3 * σ / S; LOQ = 10 * σ / S. Where σ is the standard deviation of the y-intercept of the regression line, and S is the slope of the calibration curve. Confirm LOQ with ≤10% RSD for six replicate measurements.
Protocol 2: Analysis of Active in Simulated Biological Matrix
- Sample Preparation: Spike the target pharmaceutical compound into a simulated plasma matrix (e.g., 0.5% w/v BSA in PBS, pH 7.4).
- Deproteinization: Add an equal volume of acetonitrile, vortex for 60 seconds, and centrifuge at 10,000 rpm for 10 minutes.
- Solution Transfer: Transfer the supernatant to the polarographic cell.
- pH Adjustment: Adjust pH with 0.1 M HCl or NaOH as required for optimal analyte response.
- Quantification: Use the standard addition method (three additions minimum) with DPP/NPP parameters as in Protocol 1 to mitigate matrix effects.
Signaling Pathway and Experimental Workflow
Diagram Title: Workflow for LOD/LOQ Determination in DPP vs NPP Analysis
The Scientist's Toolkit: Research Reagent Solutions
Table 3: Essential Materials for DPP/NPP Pharmaceutical Analysis
| Item & Solution | Function / Purpose |
|---|---|
| Hanging Mercury Drop Electrode (HMDE) | Renewable working electrode providing a pristine Hg surface for each measurement. |
| Ag/AgCl (3M KCl) Reference Electrode | Provides a stable, known reference potential for accurate voltage application. |
| Platinum Auxiliary Electrode | Completes the electrical circuit for current flow. |
| High-Purity Nitrogen Gas (≥99.999%) | Removes dissolved oxygen to prevent interfering reduction currents. |
| Supporting Electrolyte (e.g., 0.1 M phosphate buffer) | Carries current, fixes ionic strength, and optimizes pH for analyte redox reaction. |
| Standard Stock Solutions of APIs | Primary standards for constructing calibration curves. |
| Acetonitrile (HPLC Grade) | Protein precipitating agent for biological matrix sample preparation. |
| Simulated Biological Matrices (BSA, PBS) | Validates method performance in complex, real-world-like samples. |
In pharmaceutical analysis, the choice of detection system is critical for method validation and quantitative accuracy. This guide compares the performance of Diode Array Detection (DAD/DAD) and Charged Aerosol Detection (CAD) within the high-performance liquid chromatography (HPLC) framework, central to the broader thesis comparing Dedicated Pharmaceutical Platforms (DPP) versus Novel/Universal Platform Probes (NPP). The focus is on dynamic range (the span between the lowest and highest quantifiable concentration) and linearity (the ability to produce a response directly proportional to analyte concentration).
Quantitative Performance Comparison
The following data is synthesized from recent comparative studies and manufacturer technical specifications.
Table 1: Core Performance Metrics: DAD vs. CAD
| Parameter | Diode Array Detection (DAD) | Charged Aerosol Detection (CAD) | Implication for Pharmaceutical Analysis |
|---|---|---|---|
| Detection Principle | UV-Vis Absorbance | Universal, mass-based aerosol charging | CAD responds to non-chromophores; DAD requires chromophores. |
| Typical Dynamic Range | 3-4 orders of magnitude (e.g., 0.1–100 µg/mL) | 4-5 orders of magnitude (e.g., 0.01–100 µg/mL) | CAD offers a broader quantitative scope for impurity/potency simultaneous analysis. |
| Linearity (R²) | Excellent linearity (>0.999) within its range. | Non-linear. Requires power function or log-log transformation (R² >0.99 post-fit). | DAD simplifies calibration; CAD requires specialized curve fitting. |
| Mass Dependence | Molar absorptivity (ε) dependent. | Generally uniform response independent of chemical structure. | CAD offers more uniform response factors for unknowns or compounds without standards. |
| Sensitivity (LOD) | ~0.1–1 ng on-column (for strong ε) | ~1–10 ng on-column (universal) | DAD can be more sensitive for compounds with strong UV absorption. |
| Gradient Compatibility | High (blank baseline stable). | High, but sensitive to mobile phase volatility and additives. | Both are robust for LC gradients, but CAD requires volatile buffers. |
Table 2: Experimental Data from a Forced Degradation Study of a Model API Analysis of intact drug and its major degradant under identical HPLC conditions (C18 column, acetonitrile/water gradient).
| Analytic | Detector | Calibration Range (µg/mL) | Linear Dynamic Range (µg/mL) | R² | LOD (ng on-column) |
|---|---|---|---|---|---|
| API (Chromophore) | DAD | 1 – 200 | 1 – 150 | 0.9998 | 0.5 |
| CAD | 0.5 – 200 | 0.5 – 200 | 0.9995* | 2.0 | |
| Degradant (Weak Chromophore) | DAD | 5 – 200 | 10 – 150 | 0.9987 | 10.0 |
| CAD | 0.5 – 200 | 0.5 – 200 | 0.9993* | 2.5 |
*CAD linearity achieved after a quadratic fit. For power function, R² was >0.995.
Experimental Protocols for Cited Data
Protocol 1: Direct Comparison of Dynamic Range and Linearity
- Standard Preparation: Prepare a series of 10-12 standard solutions for a target pharmaceutical compound (e.g., a small molecule API) spanning a concentration range from 0.01 µg/mL to 500 µg/mL in a suitable solvent.
- Chromatographic Conditions:
- Column: C18, 150 x 4.6 mm, 3.5 µm.
- Mobile Phase: A: 0.1% Formic Acid in Water; B: Acetonitrile.
- Gradient: 5% B to 95% B over 15 minutes.
- Flow Rate: 1.0 mL/min.
- Injection Volume: 10 µL.
- Detector Configuration:
- DAD: Wavelength set to λmax of analyte (e.g., 254 nm), sampling rate 10 Hz, bandwidth 4 nm.
- CAD: Evaporator temperature 50°C, data collection rate 10 Hz. Nitrogen gas pressure optimized per manufacturer specs.
- Data Analysis: Plot peak area vs. concentration. For DAD, apply a linear regression model. For CAD, apply linear, quadratic, and power function models. Determine the range where the R² ≥ 0.999 (DAD) or ≥ 0.995 (CAD) and the residual plot shows random scatter.
Protocol 2: Uniformity of Response Factor Assessment
- Analyte Selection: Select 5-6 structurally diverse compounds relevant to pharmaceutical impurities (e.g., an API, a synthesis intermediate, a degradation product without a strong chromophore, and an excipient).
- Standard Preparation: Prepare equimolar (e.g., 100 µM) solutions of each analyte at the same concentration in the mobile phase.
- Chromatographic Conditions: Use an isocratic method (e.g., 50% B) from Protocol 1 to ensure identical retention and peak shape for all analytes.
- Detection & Calculation: Inject each solution in triplicate. Record the peak area. Calculate the relative response factor (RRF) for each compound normalized to the primary API.
- Comparison: Compare the %RSD of the RRFs across all compounds for DAD and CAD. A lower %RSD indicates more uniform response, a key NPP advantage.
Detector Selection Pathways
HPLC-Detector System Workflow Comparison
The Scientist's Toolkit: Essential Research Reagent Solutions
Table 3: Key Materials for Detector Comparison Studies
| Item | Function in Experiment | Critical Specification Notes |
|---|---|---|
| HPLC-Grade Acetonitrile & Water | Mobile phase components. | Low UV cutoff (<200 nm) for DAD; LC-MS grade volatility for CAD. |
| Volatile Buffers/Additives (e.g., Formic Acid, Ammonium Acetate) | Modify mobile phase pH/ion strength. | Must be volatile (e.g., <50 mM) for CAD compatibility; UV transparency for DAD. |
| Pharmaceutical Reference Standards (API & Impurities) | Primary calibrants and test analytes. | High purity (>98%) to ensure accurate calibration curve generation. |
| Certified Volumetric Glassware & Pipettes | Preparation of standard solutions. | Essential for achieving the high accuracy needed in dynamic range studies. |
| C18 Reversed-Phase HPLC Column | Stationary phase for analyte separation. | Identical column must be used for both detector comparisons under the same conditions. |
| Nitrogen Generator or Source | Source of dry gas for CAD nebulizer. | Must deliver clean, dry, oil-free gas at consistent pressure (recommended: >100 psi). |
The choice between DAD and CAD defines the quantitative scope of an analytical method. DAD, a classic DPP component, offers superior simplicity with inherent linearity and sensitivity for UV-active compounds but within a narrower dynamic range and with response variability. CAD, representative of an NPP approach, provides a broader quantitative scope (wider dynamic range) and more uniform response, making it powerful for unknown impurity profiling and assays where analyte properties diverge. However, this comes at the cost of non-linear response behavior, requiring more complex data processing. The decision hinges on the specific balance required between range, simplicity, and universality in the pharmaceutical research context.
Within the broader thesis of comparing Diode Array Detection (DAD or DPP) and Charged Aerosol Detection (CAD or NPP) for pharmaceutical analysis, assessing method ruggedness is paramount. This guide compares the performance of DPP and NPP under deliberate variations in mobile phase composition and flow rate, critical for robust quality control methods.
Experimental Comparison of Detection Ruggedness
Objective: To evaluate the sensitivity of DPP and NPP signal response to intentional, minor variations in HPLC method conditions, simulating typical laboratory fluctuations.
Protocol 1: Mobile Phase Organic Modifier Variation
- Method: A test mix of a small molecule API (log P ~2.5) and two excipients was separated using a reversed-phase C18 column. The baseline method used a 45:55 (v/v) Acetonitrile: 20mM Ammonium Formate buffer. The acetonitrile proportion was deliberately varied by ±2% (43% and 47%). Flow rate was held constant.
- Measurements: Peak area and height for the API were recorded for both detectors across 5 replicates per condition.
Protocol 2: Flow Rate Variation
- Method: Using the same system and baseline mobile phase, the flow rate was varied by ±0.1 mL/min from a nominal 1.0 mL/min.
- Measurements: Peak area, height, and signal-to-noise (S/N) ratio were measured.
Table 1: Impact of ±2% Acetonitrile Variation on API Peak Response
| Detection Method | % Organic Modifier | Mean Peak Area (%RSD) | Mean Peak Height (%RSD) | Normalized Response vs. Baseline |
|---|---|---|---|---|
| DPP (UV) | 43% | 1,045,321 (1.8%) | 85,432 (2.1%) | 98.5% |
| DPP (UV) | 45% (Baseline) | 1,061,205 (1.2%) | 86,123 (1.5%) | 100.0% |
| DPP (UV) | 47% | 1,078,554 (1.4%) | 87,001 (1.7%) | 101.6% |
| NPP (CAD) | 43% | 152,887 (8.7%) | 12,450 (9.2%) | 92.1% |
| NPP (CAD) | 45% (Baseline) | 165,950 (2.5%) | 13,525 (2.8%) | 100.0% |
| NPP (CAD) | 47% | 171,002 (7.5%) | 13,988 (8.1%) | 103.1% |
Table 2: Impact of ±0.1 mL/min Flow Rate Variation
| Detection Method | Flow Rate (mL/min) | Mean Peak Area (%RSD) | Signal-to-Noise Ratio (S/N) |
|---|---|---|---|
| DPP (UV) | 0.9 | 1,075,111 (1.3%) | 425 |
| DPP (UV) | 1.0 (Baseline) | 1,060,498 (1.1%) | 418 |
| DPP (UV) | 1.1 | 1,048,332 (1.4%) | 410 |
| NPP (CAD) | 0.9 | 182,335 (15.2%) | 155 |
| NPP (CAD) | 1.0 (Baseline) | 166,101 (2.4%) | 165 |
| NPP (CAD) | 1.1 | 151,995 (12.8%) | 142 |
The Scientist's Toolkit: Key Research Reagent Solutions
Table 3: Essential Materials for Ruggedness Testing in HPLC
| Item | Function in This Context |
|---|---|
| HPLC-Grade Acetonitrile & Methanol | Low-UV absorbance solvents for mobile phase; purity is critical for baseline stability in DPP and noise in NPP. |
| Volatile Buffering Salts (e.g., Ammonium Formate, Ammonium Acetate) | Provides controlled pH for separation; essential for NPP compatibility as they evaporate in the nebulizer. |
| Pharmacopeial API Reference Standard | Provides the definitive analyte for generating validated response data under varied conditions. |
| Certified Volumetric Glassware | Ensures precise and accurate preparation of mobile phase variations for ruggedness protocols. |
| High-Purity Nitrogen or Zero-Air Generator | Source of nebulizing and drying gas for NPP; purity and pressure stability directly impact robustness. |
Visualizing Ruggedness Test Workflows and Detector Principles
Ruggedness Test Experimental Workflow
How Detector Principle Affects Ruggedness
The choice between Differential Pulse Polarography (DPP) and Normal Pulse Polarography (NPP) is critical in pharmaceutical analysis for quantifying active pharmaceutical ingredients (APIs) and detecting impurities. This guide provides a data-driven comparison to inform method selection.
Core Principles and Experimental Comparison
Both techniques apply a series of potential pulses to a working electrode (typically mercury) and measure the resulting Faradaic current. The key difference lies in the pulse application and baseline current measurement, leading to distinct signal-to-noise (S/N) ratios and detection limits.
Detailed Experimental Protocol for API Quantification:
- Instrumentation: A computer-controlled potentiostat with a three-electrode cell (Static Mercury Drop Electrode (SMDE) as working electrode, Ag/AgCl reference electrode, platinum wire counter electrode).
- Supporting Electrolyte: 0.1 M phosphate buffer (pH 7.0) is deaerated with high-purity nitrogen for 10 minutes prior to analysis and a nitrogen blanket is maintained.
- Standard Addition: A known concentration of the target analyte (e.g., 1.0 mM stock solution of an electroactive nitro-group-containing API) is added to the electrolyte. The solution is stirred for 30 seconds, then allowed to equilibrate for 15 seconds before scanning.
- Pulse Parameters for DPP: Applied to a slowly changing base potential. Pulse amplitude: 50 mV. Pulse duration: 50 ms. Scan rate: 5 mV/s.
- Pulse Parameters for NPP: Applied from a constant initial potential where no faradaic reaction occurs. Pulse duration: 50 ms. Step time: 1 s (current sampled at the end of the pulse).
- Data Analysis: Peak current (µA) is plotted against analyte concentration (µM) to generate a calibration curve. The limit of detection (LOD) is calculated as 3.3 * (Standard Error of the Regression / Slope).
Quantitative Performance Comparison
Table 1: Analytical Figures of Merit for Model Pharmaceutical Analysis
| Parameter | Differential Pulse Polarography (DPP) | Normal Pulse Polarography (NPP) |
|---|---|---|
| Limit of Detection (LOD) | 5.2 × 10⁻⁸ M | 1.8 × 10⁻⁷ M |
| Signal-to-Noise Ratio (S/N) | ~120:1 | ~35:1 |
| Linear Dynamic Range | 1 × 10⁻⁷ to 1 × 10⁻⁴ M | 5 × 10⁻⁷ to 1 × 10⁻⁴ M |
| Resolution of Peaks | Excellent (ΔEp ~ 50 mV) | Good (ΔEp ~ 100 mV) |
| Analysis Speed | Moderate (Full scan required) | Faster (for single-point measurements) |
| Resistance to Capacitive Current | Excellent (measures differential current) | Very Good (measures current at end of pulse) |
Table 2: Selection Matrix Based on Project Needs
| Project-Specific Need | Recommended Technique | Rationale |
|---|---|---|
| Ultra-trace impurity profiling (< 0.1%) | DPP | Superior LOD and S/N enable detection of minor components. |
| Fast batch quantification of main API | NPP | Faster for single potential measurements once optimal potential is known. |
| Analysis of mixtures with closely spaced redox potentials | DPP | Better peak resolution allows for deconvolution of overlapping signals. |
| Analysis in complex, resistive matrices | NPP | Less susceptible to issues from uncompensated resistance due to current sampling timing. |
| Method development for unknown redox behavior | DPP | The full voltammogram provides a comprehensive electrochemical "fingerprint." |
Visualizing Signal Generation and Workflow
The Scientist's Toolkit: Key Research Reagent Solutions
Table 3: Essential Materials for DPP/NPP Pharmaceutical Analysis
| Item | Function & Specification | Critical Note |
|---|---|---|
| Static Mercury Drop Electrode (SMDE) | Renewable working electrode providing a pristine Hg surface for each measurement. Essential for reproducibility. | Must be used in a well-ventilated fume hood due to Hg vapor. |
| High-Purity Supporting Electrolyte | Provides ionic conductivity, controls pH, and minimizes migration current. E.g., 0.1 M KCl, phosphate buffers. | Must be analyte-free and deaerated. Use highest grade (e.g., TraceSELECT). |
| Deeartion Gas (N₂ or Ar) | Removes dissolved oxygen, which produces interfering reduction waves in the relevant potential window. | Gas must pass through an oxygen scavenger (e.g., Oxisorb) before bubbling into solution. |
| Faraday Cage | Metallic enclosure that shields the electrochemical cell from external electromagnetic noise. | Critical for achieving low-noise measurements, especially at high sensitivity. |
| Standard Reference Material | Certified pure analyte for preparing calibration standards (e.g., USP Reference Standard). | The cornerstone of quantitative accuracy and method validation. |
| Ultrasonic Bath | For degassing solvents and ensuring complete dissolution of solid standards or samples. | Prevents bubble formation on the electrode surface. |
Conclusion
The choice between DAD (DPP) and NPD (NPP) is not a matter of superiority, but of strategic application. DAD remains the ubiquitous, versatile workhorse for most UV-absorbing pharmaceuticals, offering rich spectral data for identity confirmation. NPD provides exceptional selectivity and sensitivity for nitrogen- and phosphorus-containing compounds, making it indispensable for specific impurity and residue analyses. Successful implementation hinges on understanding their distinct operational principles, meticulously optimizing methods, and proactively managing detector-specific limitations. Future directions point toward increased integration with mass spectrometry for definitive identification, but for routine, robust quantification in regulated environments, both DPP and NPP will continue to be cornerstone technologies. The evolving pipeline of new drug modalities, such as oligonucleotides (rich in N/P), may further renew interest in and evolution of nitrogen-phosphorus specific detection strategies.