Cyclic Voltammetry in Modern Research: From Fundamental Principles to Cutting-Edge Applications in Drug Development and Energy Science
This article provides a comprehensive overview of cyclic voltammetry (CV), a powerful electrochemical technique essential for researchers, scientists, and drug development professionals.
Cyclic Voltammetry in Modern Research: From Fundamental Principles to Cutting-Edge Applications in Drug Development and Energy Science
Abstract
This article provides a comprehensive overview of cyclic voltammetry (CV), a powerful electrochemical technique essential for researchers, scientists, and drug development professionals. It covers foundational principles, including redox behavior and the Nernst equation, and explores diverse methodological applications from characterizing fuel cell catalysts and screening pharmaceutical antioxidants to assessing seed viability. The content also addresses advanced troubleshooting for data interpretation, the impact of finite diffusion, and innovative optimization strategies, including machine learning for high-throughput analysis. Finally, it examines CV's role in validation through comparative studies with other analytical techniques, offering a holistic view of its critical function in both fundamental research and applied sciences.
Understanding Cyclic Voltammetry: Core Principles and What a Voltammogram Reveals
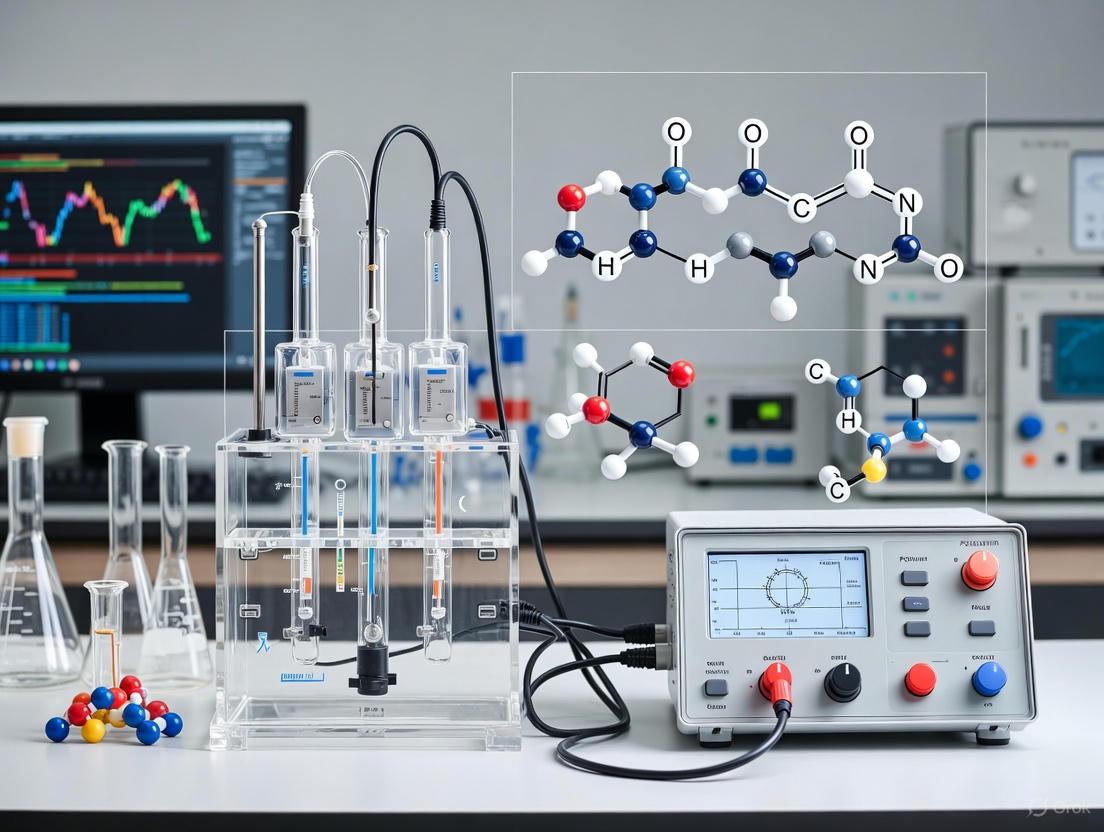
Cyclic Voltammetry (CV) stands as a cornerstone electrochemical technique, indispensable for probing the redox properties of chemical species, studying reaction mechanisms, and characterizing materials critical to advancements in conductive polymers, battery technology, and pharmaceutical development [1] [2]. The power and precision of this technique are fundamentally enabled by its underlying hardware: the three-electrode system. This configuration is not merely a convenience but a necessity for obtaining accurate, reproducible, and meaningful data. It separates the crucial function of potential measurement from the current-carrying circuit, thereby overcoming the significant limitations of simpler two-electrode setups [3] [4]. Within the broader context of research applications—from determining drug-DNA interactions to optimizing battery materials—understanding the three-electrode system is paramount [5]. This guide provides an in-depth examination of this essential setup, detailing its core principles, constituent parts, and operational protocols to empower researchers in harnessing its full potential.
The Core Principle: Why Three Electrodes Are Essential
In the early days of electrochemistry, experiments were primarily conducted using a two-electrode system. While simple, this approach had significant drawbacks, particularly in measuring and controlling electrode potentials, which led to considerable errors [3]. The introduction of the reference electrode in the 1920s created the modern three-electrode system, a innovation that dramatically improved the precision and reproducibility of electrochemical experiments [3].
The fundamental breakthrough of the three-electrode cell is its "two-circuit" conceptual design [3]. It establishes two distinct electrical pathways:
- The Potential Circuit: A high-impedance voltmeter measures and controls the potential difference between the working electrode and the reference electrode. This circuit draws negligible current, ensuring the reference electrode's potential remains stable and providing an accurate baseline for measurement.
- The Current Circuit: An ammeter measures the current flowing between the working electrode and the counter electrode. This circuit handles the sometimes substantial current required for the electrochemical reaction at the working interface.
This separation is critical because it allows the potentiostat (the instrument controlling the experiment) to precisely control the energy at which redox reactions occur at the working electrode, independent of the current flowing through the solution [1] [3]. In a two-electrode system, the voltage drop across the solution resistance (known as the iR drop) and polarization of the counter electrode obscure the true potential at the working electrode, leading to distorted data and inaccurate interpretations [3] [4]. The three-electrode system effectively eliminates this ambiguity.
System Components: Anatomy of a Three-Electrode Cell
A three-electrode system consists of three distinct components, each with a specific, non-interchangeable role. The careful selection and preparation of each electrode are vital for experimental success.
The Working Electrode (WE)
The Working Electrode is the star of the experiment; it is the site where the electrochemical reaction of interest occurs [3]. Its properties must be carefully controlled to ensure reproducible results.
- Role: The stage for the redox reaction. The applied potential drives the target analyte to be oxidized or reduced at its surface [6].
- Material Requirements: It must be chemically inert relative to the electrolyte, possess a reproducible surface state, and have a defined geometric area [3].
- Common Materials: Glassy carbon, platinum, and gold are frequently used [3]. In specialized applications, composite battery electrode materials or chemically modified electrodes are employed as the WE [7] [8].
The Reference Electrode (RE)
The Reference Electrode is the cornerstone of accurate potential measurement. It provides a stable, well-known, and constant reference potential against which the working electrode's potential is controlled and measured [1] [3].
- Role: To maintain a fixed potential, providing a baseline for all potential measurements in the system [3].
- Key Principle: It is designed to be non-polarizable, meaning its potential remains stable even if minor currents flow. In a properly configured system, minimal current passes between the RE and the WE, which is key to its stability [1].
- Common Types: The Ag/AgCl (silver/silver chloride) electrode and the saturated calomel electrode (SCE) are widespread choices. Recent research also explores simpler quasi-reference electrodes (e.g., a bare silver or platinum wire) for specific applications, though their potential may be less stable than conventional reference electrodes [9] [8].
The Counter Electrode (CE)
The Counter Electrode, also known as the auxiliary electrode, completes the electrical circuit.
- Role: To balance the current generated by the electron transfer at the working electrode [1] [3]. It supplies the current required to facilitate the reaction at the WE.
- Material and Design: It is typically made from an inert, highly conductive material like platinum or graphite [3]. A critical design rule is that the counter electrode should have a surface area significantly larger than that of the working electrode. This ensures that the reaction at the CE is not rate-limiting and that it can supply the necessary current without becoming polarized [3] [4].
The following diagram illustrates the electrical relationships and current flow within this three-electrode setup.
Experimental Protocol: Setting Up a CV Experiment
Executing a reliable CV experiment requires meticulous attention to setup and procedure. The following workflow outlines the key stages.
Step-by-Step Methodology
Cell and Electrode Preparation: The electrochemical cell is filled with an electrolyte solution containing the analyte of interest [1]. The three electrodes are immersed in the solution. A key best practice is to position the tip of the reference electrode close to the working electrode to minimize uncompensated solution resistance (iR drop) [3]. The working electrode surface often requires polishing and cleaning to ensure a reproducible state before each experiment [3].
Electrical Connection: The potentiostat leads are connected to the corresponding electrodes. Critically, both the RED (working drive) and ORANGE (working sense) leads are connected to the working electrode. The WHITE (reference sense) lead is connected to the reference electrode, and the GREEN (counter drive) lead is connected to the counter electrode [10].
Parameter Configuration: The experimental parameters are set in the potentiostat's software. These include:
- Initial Potential (Eᵢ): The starting voltage for the sweep [2].
- Upper and Lower Potential Limits (Eλ): The vertex potentials where the scan direction reverses [6].
- Scan Rate (ν): The speed at which the potential is changed, typically expressed in mV/s or V/s. This is a critical parameter that affects the current response [1] [2].
Experiment Execution: The potentiostat begins the potential sweep. It linearly ramps the potential of the working electrode from the initial value to the first vertex potential, then reverses the sweep back through the initial potential to the second vertex, often repeating this cycle multiple times [1] [2]. Throughout this process, it meticulously records the current response at the working electrode.
Data Acquisition and Analysis: The result is a cyclic voltammogram—a plot of current (I) versus the applied potential (E) [2]. This characteristic "duck-shaped" curve is then analyzed for key features such as peak potentials (Epa and Epc) and peak currents (ipa and ipc), which contain information about the thermodynamics and kinetics of the redox process [1].
The Scientist's Toolkit: Essential Research Reagents and Materials
A successful CV experiment relies on a suite of carefully selected reagents and materials. The table below details the core components of a researcher's toolkit for a standard CV analysis.
| Item | Function & Importance | Common Examples |
|---|---|---|
| Potentiostat | The control center; applies the potential sweep and measures the resulting current with high precision and low noise [3]. | IEST Electrochemical Analyzer, Gamry Potentiostats, Ossila Potentiostat [1] [3] [2]. |
| Working Electrode | The site of the reaction of interest; material choice depends on required potential window and chemical inertness [3]. | Glassy Carbon Electrode (GCE), Platinum Disc Electrode, Gold Electrode [3] [8]. |
| Reference Electrode | Provides a stable potential reference; critical for accurate and reproducible measurements [3]. | Ag/AgCl (3M KCl), Saturated Calomel Electrode (SCE) [3] [2]. |
| Counter Electrode | Completes the circuit; must be inert and have large surface area to avoid becoming rate-limiting [3]. | Platinum Mesh, Graphite Rod, Platinum Wire [3] [9]. |
| Supporting Electrolyte | Carries current and minimizes resistive loss (iR drop); must be inert in the scanned potential window [1]. | Salts in buffer solutions (e.g., Phosphate Buffer Saline, KCl, NaClO₄) [5]. |
| Redox Probe | A standard used for system validation and calibration [1] [9]. | Potassium Ferricyanide, Ferrocene [1] [9]. |
Quantitative Foundations: Key Equations in CV
The data extracted from a cyclic voltammogram can be quantified using several fundamental equations, transforming qualitative observations into hard data.
Table 2: Fundamental Equations of Cyclic Voltammetry
| Equation Name | Mathematical Formula | Parameters and Applications |
|---|---|---|
| Nernst Equation | E = E° + (RT/nF) * ln(Cₒₓ/Cᵣₑ𝒹) |
Describes the thermodynamic potential of a redox couple at equilibrium. E is the electrode potential, E° is the standard potential, R is the gas constant, T is temperature, n is the number of electrons, F is Faraday's constant, and Cₒₓ/Cᵣₑ𝒹 is the ratio of oxidized to reduced species [1] [2]. |
| Randles-Ševčík Equation | ip = (2.69×10⁵) * n³/² * A * D¹/² * C * ν¹/² |
Relates the peak current (ip) to the concentration (C) and diffusion coefficient (D) of the analyte. A is the electrode area, and ν is the scan rate. This equation is used for quantitative analysis and determining diffusion coefficients [1] [2]. |
| Butler-Volmer Equation | i = i₀ * [exp(αnFη/RT) - exp(-(1-α)nFη/RT)] |
Describes the kinetics of an electrochemical reaction. i is the current density, i₀ is the exchange current density, α is the charge transfer coefficient, and η is the overpotential [2]. |
Innovations and Future Directions
While the conventional three-electrode system is well-established, research continues to develop more robust, miniaturized, and user-friendly configurations. A significant innovation is the development of same-metal three-electrode systems. For example, one study demonstrated a miniaturized printed circuit board (PCB) where the counter, working, and reference electrodes were all fabricated from gold. This design simplified the setup, required only trace amounts of analyte, and showed impressive repeatability and sensitivity compared to traditional systems [9]. Another advancement is the creation of an integrated, polishable, and reusable triple electrode, which eliminates the need for a separate cell and reduces chemical consumption, making it a suitable alternative to screen-printed electrodes for certain applications [8]. These developments highlight a clear trend towards portability, integration, and operational simplicity without sacrificing analytical performance.
The three-electrode system is the unsung hero of cyclic voltammetry, providing the precise control and accurate measurement required to unlock detailed insights into redox processes. Its elegant separation of potential measurement and current flow overcomes the fundamental limitations of two-electrode setups, making it indispensable for serious electrochemical research. From elucidating drug-DNA interactions to characterizing next-generation battery materials, the principles and protocols outlined in this guide form the foundation for reliable and impactful scientific discovery. As electrochemical applications continue to expand into fields like point-of-care diagnostics and portable sensors, the ongoing innovation in electrode design ensures that the three-electrode system will remain a vital tool for researchers and drug development professionals for the foreseeable future.
Cyclic Voltammetry (CV) stands as one of the most ubiquitous electrochemical techniques employed in research today due to its powerful capability for rapidly elucidating redox properties of molecules and materials. This potent characterization tool operates by cycling the potential of a working electrode in a controlled manner while measuring the resulting current, generating a plot of current versus potential known as a voltammogram [11] [12]. The widespread adoption of CV spans diverse fields including inorganic and organic synthesis, materials science, sensor development, biological system evaluation, and fundamental studies of electron transfer mechanics [12]. Within the context of a broader research thesis, understanding what CV is used for reveals its fundamental role in determining formal redox potentials, assessing electron transfer kinetics, quantifying diffusion coefficients, investigating coupled chemical reactions, and characterizing electrocatalytic materials [12] [13]. The technique provides both qualitative and quantitative insights into electrochemical systems, serving as a cornerstone method for initial redox characterization of novel compounds and functional materials [13].
The interpretation of a voltammogram centers on decoding its key features—specifically peak currents and peak potentials—which serve as fingerprints of the underlying electrochemical processes. This guide provides an in-depth technical examination of these critical parameters, detailing their theoretical foundation, practical measurement, and significance in analyzing reversible, quasi-reversible, and irreversible systems. By mastering the interpretation of these features, researchers can extract rich information about their systems of interest, from the energy levels of semiconducting polymers to the catalytic efficiency of novel electrode materials for fuel cell applications [14] [15].
Fundamental Principles of Cyclic Voltammetry
In a typical CV experiment, the potential of a working electrode is swept linearly between designated initial and vertex potentials in a triangular waveform while the current response is measured [12]. The potential sweep rate (v) is a controlled parameter that defines the experimental timescale. When the potential reaches a value sufficient to drive the reduction or oxidation of an analyte, a Faradaic current develops, creating characteristic peaks in the voltammogram [11]. The forward scan generates a cathodic peak current (ipc) for reduction processes, while the reverse scan produces an anodic peak current (ipa) for oxidation processes [11] [13].
The physical origin of these peaks lies in the interplay between electron transfer kinetics and mass transport. As the potential is swept toward the reduction potential of an analyte, current increases rapidly as the analyte is reduced at the electrode surface. This current reaches a peak when the concentration of analyte at the electrode surface approaches zero, creating a maximum concentration gradient and thus maximal flux to the electrode. The current then decays as the diffusion layer extends further into solution, requiring analyte to diffuse over greater distances to reach the electrode surface [11]. This sequence creates the characteristic peak shape observed in voltammograms.
Table 1: Fundamental Equations in Cyclic Voltammetry
| Parameter | Equation | Variables and Constants | Application |
|---|---|---|---|
| Randles-Ševčík Equation (at 25°C) | ( i_p = (2.69 \times 10^5) n^{3/2} A C D^{1/2} v^{1/2} ) | n = electron number, A = electrode area (cm²), C = concentration (mol/cm³), D = diffusion coefficient (cm²/s), v = scan rate (V/s) | Relates peak current to concentration and scan rate for diffusion-controlled processes [12] [13] |
| Peak Potential Separation | ( \Delta Ep = E{pa} - E_{pc} = \frac{59}{n} mV ) (for reversible systems) | Epa = anodic peak potential, Epc = cathodic peak potential, n = number of electrons | Diagnoses electrochemical reversibility [13] |
| Formal Potential | ( E^{0'} = \frac{E{pa} + E{pc}}{2} ) | Epa = anodic peak potential, Epc = cathodic peak potential | Estimates formal reduction potential for reversible systems [11] [15] |
| Surface Adsorption Peak Current | ( i_p(ads) = \frac{n^2 F^2}{4RT} v A \Gamma ) | Γ = surface coverage of electroactive species, A = electrode area, v = scan rate | Describes current for surface-bound species [14] [16] |
The key parameters extracted from a voltammogram include the peak potentials (Epc and Epa), peak currents (ipc and ipa), and the half-wave potential (E1/2), which is often approximated as the average of the peak potentials for reversible systems [15]. These parameters provide the foundation for quantitative analysis of electrochemical systems, enabling researchers to determine concentration, identify species through their redox potentials, and assess the reversibility of electron transfer processes.
Identifying and Interpreting Key Voltammogram Features
Peak Currents and Potentials
The most prominent features of a cyclic voltammogram are the anodic and cathodic peaks, each defined by both current and potential coordinates. The anodic peak current (Ipa) and anodic peak potential (Epa) correspond to the oxidation half-cycle, where electrons flow from the analyte to the electrode, while the cathodic peak current (Ipc) and cathodic peak potential (Epc) correspond to the reduction half-cycle, where electrons flow from the electrode to the analyte [15]. According to IUPAC convention, anodic currents are plotted as positive values and cathodic currents as negative values, with potential becoming increasingly positive from left to right on the x-axis [15].
Accurate measurement of these parameters requires careful baseline establishment. The anodic peak current is measured relative to an extension of the baseline in the zero-current region preceding the redox event. The cathodic peak current measurement is more complex, as it must be measured relative to a reverse sweep baseline that resembles "a reflection of the voltammogram had the direction of the scan not been reversed" [15]. For quantitative work, charging currents should be subtracted by obtaining a background voltammogram without the analyte present and subtracting it from the sample voltammogram [15].
Diagnostic Parameters for System Characterization
The relationship between peak currents and potentials provides critical diagnostic information about the electrochemical system under investigation. Several key parameters derived from these basic measurements enable researchers to classify systems as reversible, quasi-reversible, or irreversible:
Peak Potential Separation (ΔEp): The difference between anodic and cathodic peak potentials (ΔEp = Epa - Epc) is a primary indicator of electrochemical reversibility. For a reversible one-electron transfer process at 25°C, ΔEp is approximately 59 mV, increasing to 59/n mV for an n-electron process [13]. Values larger than this theoretical minimum indicate slowed electron transfer kinetics or the influence of uncompensated solution resistance [13].
Peak Current Ratio (ipa/ipc): The ratio of the anodic to cathodic peak currents provides information about the stability of the electrogenerated species. For a fully reversible system with no following chemical reactions, this ratio should be unity (ipa/ipc = 1) at all scan rates [13]. Deviation from unity indicates chemical complications such as decomposition or dimerization of the electrogenerated species [13].
Scan Rate Dependence: The relationship between peak current and scan rate distinguishes between diffusion-controlled and adsorption-controlled processes. For species freely diffusing in solution, ip is proportional to v1/2, while for surface-confined species, ip is proportional to v [16]. This diagnostic can be applied by measuring peak currents at different scan rates and plotting ip versus v1/2 (linear for diffusion control) and ip versus v (linear for adsorption control) [16].
Table 2: Diagnostic Criteria for Electrochemical Systems
| System Type | Peak Separation ΔEp | Peak Current Ratio ipa/ipc | Scan Rate Dependence | Interpretation |
|---|---|---|---|---|
| Reversible | ~59/n mV at all scan rates [13] | ≈1 at all scan rates [13] | ip ∝ v1/2 [16] | Fast electron transfer kinetics; Nernstian equilibrium maintained [13] |
| Quasi-Reversible | >59/n mV; increases with scan rate [13] | Approaches 1 at slower scan rates [16] | ip ∝ v1/2 (with deviation) [13] | Electron transfer kinetics moderately slow relative to scan rate [13] |
| Irreversible | Only one peak observed; no reverse peak [16] | N/A (only one peak) | ip ∝ v1/2 for diffusion control [16] | Very slow electron transfer or follow-up chemical reaction consuming product [16] [13] |
| Adsorption-Controlled | Variable | Variable | ip ∝ v [16] | Electroactive species adsorbed on electrode surface [16] |
Experimental Protocol: Case Study of Methanol Oxidation Catalysis
To illustrate the practical application of cyclic voltammetry in research, we examine a detailed case study investigating Ni/Al-carbonate hydrotalcite (Ni-LDH) as a catalyst for methanol oxidation reaction (MOR), a process relevant to direct methanol fuel cells (DMFCs) [14].
Electrode Preparation and Modification Protocol
Synthesis of Ni/Al-Carbonate Hydrotalcite (Ni-LDH): Prepare Ni-LDH using co-precipitation method by slowly adding 0.1 L aqueous solution containing Ni(NO3)2·6H2O (0.75 mol) and Al(NO3)3·9H2O (0.25 mol) to a solution of Na2CO3 (0.05 mol in 100 mL) while maintaining constant pH of 10 using 3.33 M NaOH. Age the resulting gelatinous precipitate at 65°C for 24 hours, then filter and wash until neutral pH is achieved. Air-dry the resulting powder at room temperature [14].
Preparation of Catalyst Ink: Create a colloidal suspension by grinding the precipitated Ni-LDH into a fine powder and dissolving 50 mg in 10 mL of catalyst ink prepared with deionized water, isopropanol, and polytetrafluoroethylene resin in a 4:1:0.05 volume ratio. Agitate the suspension to ensure proper mixing, then sonicate for 2 hours to maximize dispersion of the nanomaterial [14].
Electrode Modification: Polish a glassy carbon electrode (GCE) with 0.3 μm alumina slurry, wash with doubly distilled water, and ultrasonicate before allowing to air dry. Drop-cast the Ni-LDH suspension onto the clean GCE surface (3 mm diameter) using a micropipette and allow to dry at ambient temperature, achieving a loading amount of approximately 0.074 mg [14].
Electrochemical Measurement Conditions
Electrochemical Cell Configuration: Utilize a standard three-electrode system with the modified glassy carbon electrode (NLGC) as working electrode, platinum wire as counter electrode, and saturated calomel electrode (SCE) as reference electrode [14].
Experimental Parameters: Conduct experiments in alkaline conditions (pH 13) using degassed solutions maintained at room temperature under nitrogen atmosphere. Employ scan rates typically ranging from 0.1 to 1.0 V/s for characterization of the redox system [14].
Data Collection: Perform cyclic voltammetry measurements by scanning potential through the region of interest where Ni(II)/Ni(III) redox transitions occur (typically 0.1-0.9 V vs. SCE based on the specific system). Record current response with high sampling density (α = 0.5) for optimal signal definition [14] [12].
Data Analysis and Interpretation
Analysis of the resulting voltammograms for the Ni-LDH modified electrode revealed:
The presence of anodic and cathodic peak current densities at 0.62 V and 0.42 V, respectively, corresponding to the quasi-reversible redox behavior of Ni(II)/Ni(III) centers [14].
A linear correlation between peak current and scan rate in the non-faradaic region (0.1-0.3 V) suggested an adsorption mechanism involving the NiII-(OH)2/NiIII-OOH redox couple, while a square-root relationship indicated diffusion-controlled methanol oxidation at higher potentials [14].
The electrochemically active surface area was calculated to be 0.042 cm², and the onset potential for methanol oxidation was determined to be 5.2 V through linear sweep voltammetry [14].
Double potential chronoamperometry confirmed a one-electron redox process with a Tafel slope of 24.2 mV/dec, supporting the proposed mechanism [14].
This case study demonstrates how careful analysis of voltammetric features enables researchers to extract detailed mechanistic information about electrocatalytic systems, informing the development of more efficient fuel cell technologies.
Advanced Considerations in Voltammogram Interpretation
The Impact of Experimental Parameters
Several experimental factors can significantly influence voltammetric responses and must be considered when interpreting results:
Scan Rate Effects: The scan rate (v) controls the experimental timescale, affecting both current response and apparent reversibility. For a reversible system, peak currents increase with v1/2 while peak potentials remain constant. For quasi-reversible systems, the peak separation (ΔEp) increases with scan rate as the electron transfer kinetics become increasingly slow relative to the potential sweep rate [16] [13]. Very fast scan rates may reveal reaction intermediates that are consumed in chemical steps at slower scan rates [16].
Uncompensated Resistance (Ru): Solution resistance between working and reference electrodes can distort voltammograms, increasing peak separation and altering peak shapes. This effect can be minimized through careful electrode placement, electronic positive feedback compensation, or post-run data manipulation [13]. Uncompensated resistance can be distinguished from slow electron transfer kinetics by its dependence on analyte concentration—Ru effects increase with current (and thus concentration), while kinetic parameters remain concentration-independent [13].
Charging Currents: The non-faradaic current associated with charging the electrical double-layer (ic = vCdl, where Cdl is the double-layer capacitance) contributes to the total measured current, potentially obscuring Faradaic signals, particularly at high scan rates [13] [15]. Charging currents can be subtracted by measuring background voltammograms in supporting electrolyte alone and subtracting from sample voltammograms [15].
Troubleshooting Common Voltammetric Challenges
Researchers often encounter several common challenges when interpreting voltammograms:
Irreversible Systems: When a reverse peak is absent, the system may be irreversible due to slow electron transfer kinetics or a following chemical reaction that consumes the electrogenerated species. To distinguish these possibilities, vary the scan rate—if the reverse peak appears at faster scan rates, the irreversibility is likely due to a chemical reaction; if the peak remains absent, the electron transfer itself is likely slow [16].
Non-Ideal Peak Shapes: Asymmetric or broad peaks may indicate heterogeneous surface conditions, non-uniform adsorption, or mixed diffusion-adsorption control. Using highly polished electrodes with reproducible surfaces helps minimize these effects [16].
Background Currents: High background currents can obscure Faradaic signals, particularly at low analyte concentrations. Using electrodes with smaller surface areas or slower scan rates can improve the signal-to-noise ratio [16] [13].
The Research Toolkit: Essential Materials and Reagents
Successful cyclic voltammetry experiments require careful selection of reagents and materials. The following table outlines key components used in the featured methanol oxidation study and their functions in electrochemical research.
Table 3: Essential Research Reagents and Materials for Electrochemical Studies
| Reagent/Material | Specification/Example | Function in Research | Case Study Example |
|---|---|---|---|
| Transition Metal Salts | Ni(NO3)2·6H2O, Al(NO3)3·9H2O | Precursors for electrocatalyst synthesis | Ni/Al-hydrotalcite preparation for methanol oxidation catalysis [14] |
| Alkaline Electrolyte | NaOH solutions (pH 13) | Provides conductive medium; influences reaction thermodynamics | Optimal catalytic activity for MOR under alkaline conditions [14] |
| Electrode Materials | Glassy carbon (polished with 0.3 μm alumina) | Provides conductive, inert surface for electron transfer | Working electrode substrate for Ni-LDH modification [14] |
| Reference Electrodes | Saturated Calomel Electrode (SCE) | Maintains fixed potential reference against which working electrode is controlled | Potential reference in three-electrode system [14] |
| Counter Electrodes | Platinum wire | Completes electrical circuit without reaction interference | Counter electrode in three-electrode cell [14] |
| Binding Agents | Polytetrafluoroethylene resin | Enhances catalyst adhesion to electrode surface | Component of catalyst ink for electrode modification [14] |
| Solvents | Deionized water, isopropanol | Disperses catalyst materials; provides medium for ion transport | Components of catalyst ink suspension [14] |
| Purge Gases | Nitrogen gas | Removes dissolved oxygen to prevent interference with redox reactions | Solution degassing prior to electrochemical measurements [14] |
The ability to decode a voltammogram by accurately identifying and interpreting key features such as peak currents and potentials remains an essential skill for researchers across numerous scientific disciplines. These parameters serve as fundamental indicators of electron transfer mechanisms, catalytic efficiency, and reaction kinetics in systems ranging from energy storage materials to biological redox mediators. The diagnostic power of cyclic voltammetry extends beyond simple identification of redox potentials to encompass sophisticated analysis of coupled chemical reactions, adsorption processes, and electron transfer kinetics through systematic variation of experimental conditions.
As electrochemical techniques continue to evolve, with recent advances including high-speed regression using machine learning algorithms to rapidly extract kinetic parameters, the fundamental principles of voltammogram interpretation remain critically important [17]. By mastering these core concepts and maintaining awareness of potential experimental artifacts, researchers can fully leverage cyclic voltammetry as a powerful tool for materials characterization, mechanistic studies, and the development of next-generation electrochemical technologies. The continued refinement of both experimental methodologies and theoretical frameworks ensures that cyclic voltammetry will maintain its position as a cornerstone technique in the researcher's analytical arsenal for the foreseeable future.
Cyclic Voltammetry (CV) is a powerful and versatile electrochemical technique extensively employed in research to study the redox properties of chemical species. It provides critical information about electron transfer processes that occur during oxidation and reduction reactions, offering insights into the thermodynamics and kinetics of electrochemical systems [2]. In the context of pharmaceutical research and drug development, CV serves as an indispensable tool for characterizing active pharmaceutical ingredients (APIs), understanding reaction mechanisms, and developing sensitive analytical methods [18]. The technique's value lies in its ability to rapidly generate a species during a forward potential scan and probe its fate with the reverse scan or subsequent cycles, enabling researchers to investigate the stability and reactivity of electroactive compounds on short timescales [6].
The fundamental principle of CV involves applying a linearly cycled potential sweep to an electrochemical cell and measuring the resulting current response. This process generates a characteristic "duck-shaped" plot known as a cyclic voltammogram, which serves as a fingerprint of the redox behavior of the analyte [1]. The interpretation of this voltammogram relies heavily on foundational mathematical models, primarily the Nernst equation which describes thermodynamic equilibrium, and the Butler-Volmer equation which governs electron transfer kinetics. Together, these equations form the theoretical backbone for extracting quantitative information from CV experiments, enabling researchers to determine formal potentials, diffusion coefficients, electron transfer rate constants, and concentration values for various analytes [2] [19].
Theoretical Foundations
The Nernst Equation: Thermodynamic Equilibrium
The Nernst equation provides the fundamental relationship between the electrode potential and the concentration of species undergoing a redox reaction at equilibrium conditions. This equation serves as the cornerstone for understanding the thermodynamic aspects of electrochemical processes in cyclic voltammetry [2].
For a general redox reaction: [ \text{O} + ne^- \rightleftharpoons \text{R} ]
The Nernst equation is expressed as: [ E = E^\circ + \frac{RT}{nF} \ln\frac{[\text{O}]}{[\text{R}]} ]
Where:
- (E) is the electrode potential
- (E^\circ) is the standard electrode potential
- (R) is the gas constant (8.314 J·K⁻¹·mol⁻¹)
- (T) is the temperature in Kelvin
- (n) is the number of electrons transferred in the redox event
- (F) is the Faraday constant (96,485 C·mol⁻¹)
- ([\text{O}]) and ([\text{R}]) are the concentrations of the oxidized and reduced species, respectively [2]
Under standard conditions of temperature (298 K), the equation simplifies to: [ E = E^\circ + \frac{0.0592}{n} \log\frac{[\text{O}]}{[\text{R}]} ]
In cyclic voltammetry, the formal potential ((E^{\circ'})) is often used in place of the standard potential to account for non-ideal behavior in real systems. For a reversible system, the formal reduction potential is calculated as the mean of the anodic and cathodic peak potentials: [ E^{\circ'} = \frac{E{pa} + E{pc}}{2} ] where (E{pa}) is the anodic peak potential and (E{pc}) is the cathodic peak potential [11] [13].
Table 1: Key Parameters from the Nernst Equation for Reversible Systems
| Parameter | Symbol | Equation/Value | Significance |
|---|---|---|---|
| Formal Potential | (E^{\circ'}) | (\frac{E{pa} + E{pc}}{2}) | Characteristic redox potential of the system |
| Peak Separation | (\Delta E_p) | (\frac{59.2}{n}) mV at 25°C | Diagnostic criterion for reversibility |
| Electron Stoichiometry | (n) | (Ep - E{p/2} > \frac{0.0565}{n}) | Determines number of electrons transferred |
Butler-Volmer Kinetics: Electron Transfer Dynamics
The Butler-Volmer equation is a fundamental relation in electrochemistry that quantifies the kinetics of electrode reactions by linking the net current density to the electrode overpotential. This equation accounts for both anodic oxidation and cathodic reduction contributions in faradaic processes, making it essential for understanding the rate of electron transfer in cyclic voltammetry experiments [19].
The standard form of the Butler-Volmer equation for a single electron transfer step is: [ i = i0 \left[ \exp\left( \frac{\alphaa F \eta}{RT} \right) - \exp\left( -\frac{\alpha_c F \eta}{RT} \right) \right] ]
Where:
- (i) is the net current density (A/cm²)
- (i_0) is the exchange current density, representing the magnitude of anodic and cathodic current densities at equilibrium
- (\alphaa) and (\alphac) are the anodic and cathodic transfer coefficients (dimensionless, typically between 0 and 1)
- (F) is the Faraday constant (96,485 C/mol)
- (\eta) is the overpotential, defined as (\eta = E - E_{eq})
- (R) is the gas constant (8.314 J/mol·K)
- (T) is the absolute temperature (K) [19]
The transfer coefficients (\alphaa) and (\alphac) quantify the symmetry of the energy barrier for electron transfer, with their sum often equaling 1 for elementary steps. The overpotential (\eta) represents the additional driving force required to drive the reaction away from equilibrium [19].
Table 2: Butler-Volmer Equation Parameters and Their Significance
| Parameter | Symbol | Typical Values | Physical Meaning |
|---|---|---|---|
| Exchange Current Density | (i_0) | 10⁻⁶ to 10⁻³ A/cm² | Intrinsic reaction rate at equilibrium |
| Anodic Transfer Coefficient | (\alpha_a) | 0.3-0.7 | Fraction of overpotential lowering oxidation barrier |
| Cathodic Transfer Coefficient | (\alpha_c) | 0.3-0.7 | Fraction of overpotential lowering reduction barrier |
| Overpotential | (\eta) | Varies with application | Deviation from equilibrium potential |
The Butler-Volmer equation simplifies under extreme overpotential conditions. At high positive overpotentials ((\eta > 50) mV), the cathodic term becomes negligible, yielding the Tafel equation for anodic processes: [ \eta = \frac{RT}{\alpha F} \ln\left( \frac{i}{i_0} \right) ]
Similarly, at high negative overpotentials, the anodic term becomes negligible, giving the cathodic Tafel equation. The Tafel slope ((b = 2.303RT/\alpha F)) provides crucial insight into the reaction mechanism, with a typical value of 120 mV per decade for a single-electron transfer with (\alpha = 0.5) at room temperature [19].
Experimental System and Setup
The Three-Electrode Configuration
Cyclic voltammetry employs a three-electrode system to precisely control the potential applied to the working electrode while accurately measuring the resulting current. This configuration is essential for maintaining a stable reference potential and ensuring that the measured current reflects only the processes occurring at the working electrode surface [20] [1].
The core components of this system are:
Working Electrode: This is the electrode where the redox reaction of interest occurs. Common materials include platinum, gold, glassy carbon, and mercury, chosen based on the potential window and reactivity requirements. The working electrode typically has a small, well-defined surface area to ensure uniform current distribution [20].
Reference Electrode: This electrode maintains a constant, stable potential against which the working electrode potential is measured. Common reference electrodes include Ag/AgCl, saturated calomel (SCE), and silver wire with ferrocene as an internal standard. The reference electrode must experience minimal current flow to prevent polarization [20] [6].
Counter Electrode (Auxiliary Electrode): Typically made from an inert material like platinum gauze with a large surface area, this electrode completes the electrical circuit and allows current to flow without significantly affecting the measurement. It ensures that the current observed at the working electrode is balanced without passing significant current through the reference electrode [20].
The potentiostat is the instrument that controls the potential between the working and reference electrodes while measuring the current between the working and counter electrodes. This separation of functions allows for precise potential control and accurate current measurement [1].
Diagram 1: Three-Electrode System
Potential Waveform and Scan Rate
In cyclic voltammetry, the potentiostat applies a triangular potential waveform to the working electrode. The potential is swept linearly from an initial potential (Eᵢ) to a final potential (E_f) – known as the switching potential – and then back to the initial potential. The slope of this excitation signal defines the scan rate (ν, in V/s), which is a critical experimental parameter that influences the voltammetric response [2] [11].
The potential during the forward scan is described by: [ E = Ei + \nu t ] After reaching the switching potential, the reverse scan follows: [ E = Es - \nu t ] where (E_s) is the potential at the switching point and (t) is time [11].
The scan rate significantly impacts the current response. Higher scan rates provide less time for diffusion, resulting in higher peak currents but also increasing the charging current background. The selection of an appropriate scan rate depends on the system under investigation and whether the goal is to study diffusion-controlled or adsorption-controlled processes [13].
Diagram 2: Potential Waveform
Quantitative Relationships in Cyclic Voltammetry
The Randles-Sevcik Equation: Diffusion-Controlled Processes
The Randles-Sevcik equation describes the relationship between the peak current and the concentration of the electroactive species for diffusion-controlled reversible systems. This equation is fundamental for quantitative analysis in cyclic voltammetry, allowing researchers to determine concentrations or diffusion coefficients from voltammetric data [2].
The Randles-Sevcik equation is expressed as: [ i_p = (2.69 \times 10^5) n^{3/2} A C D^{1/2} \nu^{1/2} ]
Where:
- (i_p) is the peak current (amperes)
- (n) is the number of electrons transferred in the redox event
- (A) is the electrode area (cm²)
- (C) is the concentration (mol/cm³)
- (D) is the diffusion coefficient (cm²/s)
- (\nu) is the scan rate (V/s) [2] [1]
At 298 K, the equation becomes: [ i_p = (2.69 \times 10^5) n^{3/2} A C D^{1/2} \nu^{1/2} ]
The key insight from this equation is that for a reversible, diffusion-controlled process, the peak current is proportional to the square root of the scan rate. This relationship provides a diagnostic criterion for distinguishing diffusion-controlled processes from adsorption-controlled processes, where the peak current is directly proportional to the scan rate [2] [13].
Table 3: Diagnostic Criteria for Reversible, Quasi-Reversible, and Irreversible Systems
| Parameter | Reversible System | Quasi-Reversible System | Irreversible System |
|---|---|---|---|
| Peak Separation | (\Delta E_p = \frac{59.2}{n}) mV | (\Delta E_p > \frac{59.2}{n}) mV, increases with scan rate | (\Delta E_p > \frac{59.2}{n}) mV, large separation |
| Peak Current Ratio | (i{pa}/i{pc} = 1) | (i{pa}/i{pc} \approx 1) (deviation increases with scan rate) | (i{pa}/i{pc} \neq 1), significant imbalance |
| Scan Rate Dependence | Peak current function ((i_p/n^{1/2})) independent of scan rate | Peak current function decreases with increasing scan rate | Peak current function decreases with increasing scan rate |
| Peak Potential | Independent of scan rate | Cathodic peak shifts negative, anodic peak shifts positive with increasing scan rate | Peak potentials shift with scan rate |
Diagnostic Criteria for Electron Transfer Mechanisms
The interplay between the Nernst equation and Butler-Volmer kinetics manifests in characteristic voltammetric responses that allow researchers to classify electrode processes as reversible, quasi-reversible, or irreversible:
Reversible Systems exhibit behavior consistent with the Nernst equation, where electron transfer is fast compared to mass transport. Key characteristics include:
- Peak potential separation (\Delta Ep = E{pa} - E_{pc} = 59.2/n) mV at 25°C
- Peak current ratio (i{pa}/i{pc} = 1) at all scan rates
- Peak potentials independent of scan rate
- Formal potential (E^{\circ'} = (E{pa} + E{pc})/2) [13]
Quasi-Reversible Systems show intermediate behavior where electron transfer kinetics influence the response:
- Peak separation greater than 59.2/n mV, increasing with scan rate
- Peak current ratio approximately 1 but decreases at higher scan rates
- Peak potentials shift with scan rate
- Response depends on the ratio (ks/\nu), where (ks) is the standard heterogeneous electron transfer rate constant [13]
Irreversible Systems display complete kinetic control where reverse electron transfer is negligible:
- Large peak separation with no reverse peak observed in some cases
- Significant shift in peak potentials with scan rate
- Current governed by the Butler-Volmer equation with negligible reverse reaction term [13]
Experimental Protocols for Pharmaceutical Analysis
Method Development for Drug Compound Characterization
The application of cyclic voltammetry in pharmaceutical research requires careful method development to ensure reliable and reproducible results. The following protocol outlines a systematic approach for characterizing redox properties of drug compounds:
Solution Preparation:
- Prepare electrolyte solution with appropriate supporting electrolyte (e.g., 0.1 M phosphate buffer, pH 7.4 for physiological relevance)
- Dissolve drug compound in electrolyte at typical concentration range of 0.1-1.0 mM
- Degas solution with inert gas (N₂ or Ar) for 10-15 minutes to remove dissolved oxygen
- Maintain constant temperature using water jacket or temperature-controlled cell
Electrode Preparation:
- Polish working electrode (typically glassy carbon) with alumina slurry (1.0, 0.3, then 0.05 μm) on microcloth
- Rinse thoroughly with purified water between polishing steps
- Sonicate in water and/or ethanol for 2 minutes to remove adsorbed particles
- Perform electrochemical activation in supporting electrolyte via potential cycling until stable background is obtained
Initial Scan Parameters:
- Set initial potential: 0.2 V more negative than expected reduction potential or 0 V vs. Ag/AgCl if unknown
- Set switching potential: 0.2 V more positive than expected oxidation potential or +1.2 V vs. Ag/AgCl if unknown
- Use moderate scan rate (50-100 mV/s) for initial characterization
- Employ 2-3 cycles to assess stability of redox processes
Scan Rate Studies:
- Perform CV at multiple scan rates (e.g., 10, 25, 50, 100, 200, 500 mV/s)
- Plot peak current vs. square root of scan rate for diffusion-controlled processes
- Plot peak potential vs. log(scan rate) for kinetic analysis
- Calculate electron transfer rate constant ((k_s)) from scan rate dependence of peak separation
Data Analysis:
- Measure peak currents ((i{pa}), (i{pc})) and peak potentials ((E{pa}), (E{pc}))
- Calculate formal potential (E^{\circ'} = (E{pa} + E{pc})/2)
- Determine electron stoichiometry ((n)) from peak separation
- Calculate diffusion coefficient ((D)) using Randles-Sevcik equation
- Assess reversibility using diagnostic criteria [6] [13]
Advanced Integration Analysis for Immobilized Systems
For drug compounds that adsorb strongly or are immobilized on electrode surfaces (e.g., in modified electrodes or thin-layer cells), integration analysis of cyclic voltammograms provides enhanced information about reaction kinetics. This method is particularly valuable for studying diffusionless systems where the electrode reaction is not affected by mass transport limitations [21].
The integration analysis protocol:
System Requirements:
- Strong adsorption of reactant and product on electrode surface, OR
- Thin-layer cell configuration with scan rate not exceeding diffusion limits
- Known total charge ((Q^*)) for the immobilized species when available
Integration Procedure:
- Record cyclic voltammogram at appropriate scan rate (typically 1-50 mV/s for immobilized systems)
- Integrate current from starting potential to each potential (E) during forward scan to obtain (Q_f(E))
- Integrate current from switching potential to each potential (E) during backward scan to obtain (Q_b(E))
- Calculate concentrations of oxidized and reduced forms at each potential: [ CO(E) = \frac{Qf(E) - Qb(E)}{2nFA} \quad \text{and} \quad CR(E) = \frac{Q^* - [Qf(E) - Qb(E)]}{2nFA} ]
- Determine forward and backward reaction rates from concentration profiles
Parameter Estimation:
- Plot (\ln[kf(E)]) and (\ln[kb(E)]) vs. (E)
- Obtain standard formal potential (E^{\circ'}) from the intersection point
- Calculate standard electron transfer rate constant (k_s^{\circ}) from the slopes
- Determine transfer coefficient (\alpha) from the symmetry of the plot [21]
This integration method can be applied to cases where the cyclic voltammetric oxidation-reduction peak potential separation is greater than only 20 mV, making it suitable for a wide range of pharmaceutical compounds with quasi-reversible electron transfer behavior.
The Scientist's Toolkit: Essential Research Reagents and Materials
Table 4: Key Research Reagent Solutions for Cyclic Voltammetry in Pharmaceutical Analysis
| Reagent/Material | Function | Typical Specifications | Pharmaceutical Application Examples |
|---|---|---|---|
| Supporting Electrolyte | Provides ionic conductivity; controls potential window and pH | 0.1 M concentration; high purity (>99%); appropriate pH buffer | Phosphate buffer (pH 7.4) for physiological simulation; acetate buffer for acidic conditions |
| Internal Standard | Potential calibration; reference redox couple | Ferrocene/Ferrocenium (Fc/Fc⁺) couple; E⁰ = 0.64 V vs. NHE | Adding ferrocene for potential scale normalization in non-aqueous drug studies |
| Working Electrodes | Surface for redox reactions; determines potential window | Glassy carbon (polarizable window); Pt (catalytically active); Au (thiol modification) | Glassy carbon for most drug compounds; modified electrodes for selective detection |
| Reference Electrodes | Stable potential reference | Ag/AgCl (3 M KCl); SCE; pseudo-reference with internal standard | Ag/AgCl for aqueous systems; Ag wire with Fc/Fc⁺ for non-aqueous drug studies |
| Electrode Polishing | Surface renewal and reproducibility | Alumina suspensions (1.0, 0.3, 0.05 μm); diamond polish for carbon electrodes | Sequential polishing for reproducible surface area and minimized adsorption effects |
| Oxygen Scavenging | Removal of interfering oxygen | Nitrogen (high purity, >99.998%); argon; vacuum degassing | Dissolved oxygen removal to prevent interference with drug reduction waves |
| Redox Mediators | Electron transfer facilitation | Ferricyanide; ruthenium hexamine; methylene blue | Enhancing electron transfer for drugs with slow heterogeneous kinetics |
| Surface Modifiers | Electrode functionalization | Thiols for Au; nanomaterials; polymers; enzymes | Selective detection of specific drug compounds in complex matrices |
Applications in Pharmaceutical Research and Drug Development
Cyclic voltammetry serves as a critical analytical tool throughout the drug development pipeline, from early discovery to quality control. The technique's ability to provide information about redox properties, reaction mechanisms, and concentration values makes it invaluable for pharmaceutical applications [18].
Drug Stability and Degradation Studies: CV enables rapid assessment of drug compound stability by monitoring changes in voltammetric response over multiple cycles or under different environmental conditions. The appearance of new redox peaks or changes in existing peak currents can indicate degradation products or oxidative transformation. This application is particularly valuable for understanding the stability of drugs containing easily oxidizable functional groups like phenols, amines, or heterocyclic aromatic systems [2] [18].
Metabolic Pathway Elucidation: The redox behavior of drug molecules and their metabolites can provide insights into metabolic pathways, particularly those involving oxidative transformations. By comparing the voltammetric responses of parent compounds and their suspected metabolites, researchers can hypothesize about metabolic transformation pathways and identify potential electroactive metabolites [18].
Quantitative Analysis in Formulations: Using the Randles-Sevcik equation, CV can be employed for quantitative determination of active pharmaceutical ingredients in formulations. The linear relationship between peak current and concentration allows for the development of calibration curves for drug quantification, often with detection limits in the micromolar range. While not as sensitive as pulse techniques like differential pulse voltammetry, CV provides a rapid screening method for quality control applications [2] [18].
Reaction Mechanism Studies: CV is exceptionally valuable for studying the mechanisms of electrochemical reactions involving drug compounds. Through diagnostic analysis of peak separations, scan rate dependencies, and cycle-to-cycle changes, researchers can distinguish between simple electron transfer processes and more complex mechanisms involving chemical steps following electron transfer (EC mechanisms). This information is crucial for understanding the redox behavior of drugs in biological systems and for developing electroanalytical methods [13].
The integration of CV with spectroscopic methods in spectroelectrochemistry (SEC) has further enhanced its utility in pharmaceutical analysis. This hybrid approach provides simultaneous information about redox properties and molecular structures, offering unique advantages for characterizing complex drug molecules and their transformation products [22].
The governing equations of cyclic voltammetry – the Nernst equation for thermodynamic equilibrium and the Butler-Volmer equation for electron transfer kinetics – provide the theoretical foundation for interpreting voltammetric data in pharmaceutical research. These mathematical models enable researchers to extract quantitative information about redox potentials, electron transfer rates, diffusion coefficients, and concentration values from cyclic voltammograms.
The continued advancement of electrochemical instrumentation, coupled with the development of novel electrode materials and data analysis methods, promises to further expand the applications of cyclic voltammetry in drug development. The integration of CV with other analytical techniques, particularly spectroscopic methods, creates powerful hybrid approaches that provide comprehensive characterization of pharmaceutical compounds. As the field moves toward more personalized medicine and rapid quality control methods, the principles outlined in this technical guide will remain essential for researchers exploiting cyclic voltammetry in pharmaceutical applications.
Distinguishing Reversible and Irreversible Processes from CV Shape and Peak Separation
Cyclic voltammetry (CV) is a foundational electrochemical technique where the voltage applied to a working electrode is swept linearly with time and then swept back in the reverse direction, while the resulting current is measured [2]. The resulting plot of current versus potential, called a cyclic voltammogram, provides a wealth of information about the redox properties and electron transfer kinetics of chemical species. A core application of CV in research is diagnosing the reversibility of electrochemical reactions, a characteristic paramount for assessing the stability of electrocatalysts, the efficiency of energy storage materials, and the mechanistic pathways in synthetic and biological systems [23] [15].
This technical guide delves into how the shape of the cyclic voltammogram and the separation between its characteristic peaks serve as primary diagnostics for distinguishing between reversible, quasi-reversible, and irreversible electron transfer processes. This analysis forms an essential part of a broader thesis on the applications of cyclic voltammetry, establishing it as an indispensable tool for researchers and drug development professionals who require deep insight into electrochemical reactivity.
Theoretical Foundation of Reversibility in Electrochemistry
In the context of cyclic voltammetry, the term "reversibility" has specific meanings distinct from its use in thermodynamics. In thermodynamics, a reversible process is an idealized, infinitely slow process where the system remains in equilibrium with its surroundings at every stage [24] [25]. All real-world processes are thermodynamically irreversible as they increase the entropy of the universe and cannot be perfectly reversed by an infinitesimal change in external conditions [26] [25].
In contrast, electrochemical reversibility is a practical classification of a reaction based on the time scale of the experiment and the kinetics of electron transfer. It is categorized as follows [15]:
- Chemically Reversible: The electron transfer can be reversed without any side reactions consuming the initial product.
- Thermodynamically Reversible (Nernstian): The electron transfer is sufficiently fast that equilibrium at the electrode surface is maintained throughout the potential sweep. The surface concentrations of the redox species follow the Nernst equation.
- Practically Reversible: This term is often used when both chemical and thermodynamic reversibility are observed on the experimental time scale.
An electrochemically irreversible system is one where the electron transfer kinetics are slow, or a fast chemical reaction consumes the product of the electron transfer, making the back reaction impossible within the experiment's timeframe [16].
Diagnostic Features in a Cyclic Voltammogram
The key to diagnosing reversibility lies in analyzing specific features of the cyclic voltammogram. A classic, "duck-shaped" voltammogram for a reversible, diffusion-controlled system with a single electron transfer displays several characteristic peaks and parameters [15].
Key Voltammogram Parameters
- Anodic Peak Potential (Epa) and Current (Ipa): The potential and current at the peak of the oxidation wave.
- Cathodic Peak Potential (Epc) and Current (Ipc): The potential and current at the peak of the reduction wave.
- Peak Potential Separation (ΔEp): The difference between the anodic and cathodic peak potentials (ΔEp = Epa - Epc). This is a critical parameter for assessing reversibility.
- Formal Potential (E°): For a reversible system, the formal potential is approximately the midpoint between the two peak potentials (E°' ≈ (Epa + Epc)/2) [16].
- Peak Current Ratio (Ipa/Ipc): The ratio of the absolute magnitudes of the anodic and cathodic peak currents.
Table 1: Diagnostic CV Parameters for Different Systems
| System Type | Peak Separation ΔEp | Peak Current Ratio Ipa/Ipc | Scan Rate Dependence of ΔEp | Scan Rate Dependence of Ip |
|---|---|---|---|---|
| Reversible | ~59/n mV at 25°C | ≈1 | Independent | Ip ∝ v^(1/2) |
| Quasi-Reversible | >59/n mV | ≈1 | Increases with scan rate | Ip ∝ v^(1/2) (deviation at high v) |
| Irreversible | No reverse peak, or very large ΔEp | N/A | Increases with scan rate | Ip ∝ v^(1/2) |
A Workflow for Diagnosing Reversibility
The following diagram illustrates the logical decision process for classifying an electrochemical system based on its cyclic voltammogram.
Characterizing Reversible, Quasi-Reversible, and Irreversible Systems
The Reversible (Nernstian) System
A reversible system exhibits fast electron transfer kinetics, allowing equilibrium to be maintained at the electrode surface according to the Nernst equation throughout the potential sweep [16] [15].
- CV Shape: A pair of symmetric, well-defined oxidation and reduction peaks.
- Peak Separation: The peak potential separation (ΔEp) is small and constant, ideally about (59/n) mV at 25°C, where
nis the number of electrons transferred [16]. - Peak Current Ratio: The ratio of the anodic to cathodic peak currents (|Ipa/Ipc|) is equal to 1 [15].
- Scan Rate Dependence: The peak currents (Ip) are proportional to the square root of the scan rate (v^(1/2)), as described by the Randles-Ševčík equation. The peak potentials and their separation do not shift with changing scan rate [16] [27].
A classic example is the ferro/ferricyanide couple ([Fe(CN)₆]⁴⁻/³⁻), often used as a benchmark for reversible behavior [28].
The Quasi-Reversible System
As the scan rate increases, the electron transfer kinetics may become too slow to maintain Nernstian equilibrium. This leads to a quasi-reversible system, which displays characteristics between reversible and irreversible.
- CV Shape: A pair of broader oxidation and reduction peaks.
- Peak Separation: ΔEp is greater than (59/n) mV and increases with increasing scan rate [16].
- Peak Current Ratio: The ratio |Ipa/Ipc| may still be close to 1.
- Scan Rate Dependence: The peak current may still roughly follow Ip ∝ v^(1/2), but the widening ΔEp is the key indicator of kinetic limitation.
The Irreversible System
In an irreversible system, the electron transfer kinetics are very slow, or the product of the electron transfer is consumed by a subsequent chemical reaction [16].
- CV Shape: Only one peak (either anodic or cathodic) is present. The reverse peak is absent because the species needed for the back reaction is no longer available [16] [15].
- Peak Separation: Not applicable in the same way, as only one peak is observed. If a very small reverse peak is forced, the ΔEp would be very large.
- Scan Rate Dependence: For a purely irreversible system with no follow-up chemistry, the peak current is still proportional to v^(1/2), but the peak potential shifts significantly with scan rate.
A key diagnostic is to perform CV at different scan rates. If a missing reverse peak appears at a very fast scan rate, it indicates that the system is irreversible due to a follow-up chemical reaction (EC mechanism). The fast scan "outruns" the chemical step, allowing the back electron transfer to occur [16].
Experimental Protocol for Determining Reversibility
The following section provides a detailed methodology for a standard CV experiment designed to diagnose reversibility, using the well-established ferro/ferricyanide redox couple.
Research Reagent Solutions
Table 2: Essential Materials and Their Functions
| Item | Function / Explanation |
|---|---|
| Potentiostat | Instrument that controls the potential and measures current (e.g., MedPstat, Ossila Potentiostat, IEST ERT6008) [28] [15] [27]. |
| Three-Electrode Cell | Standard electrochemical cell configuration. |
| Working Electrode | Surface where redox reaction occurs (e.g., Pt, Au, glassy carbon). Must be clean and polished. |
| Reference Electrode | Provides a stable, known potential (e.g., Ag/AgCl, Saturated Calomel Electrode). |
| Counter Electrode | Completes the electrical circuit (e.g., Pt wire or coil). |
| Potassium Ferricyanide (K₃Fe(CN)₆) | Oxidized species of the redox probe. |
| Potassium Ferrocyanide (K₄Fe(CN)₆) | Reduced species of the redox probe. |
| Potassium Chloride (KCl) | Supporting electrolyte (1 M) to minimize solution resistance. |
| Deionized Water | Solvent for preparing aqueous solutions. |
Step-by-Step Procedure
- Solution Preparation: Prepare a solution containing 5 mM K₃Fe(CN)₆ and 5 mM K₄Fe(CN)₆ in 1 M KCl using deionized water [28].
- Electrode Preparation: Clean the working electrode (e.g., Platinum Wire Electrode) according to standard protocols, often involving polishing and rinsing with deionized water [28] [15].
- Cell Setup: Introduce 30 mL of the prepared solution into an electrochemical cell. Immerse the working, reference, and counter electrodes into the solution.
- Oxygen Removal: Gently bubble an inert gas (e.g., N₂ or Ar) through the solution for ~10 minutes to remove dissolved oxygen, which can interfere with the measurement [15].
- Instrument Connection: Connect the electrodes to the potentiostat—Red for Working Electrode (WE), Blue/Black for Reference Electrode (RE), and Black for Counter Electrode (CE) [28].
- Parameter Configuration: In the potentiostat software, set the parameters for the cyclic voltammetry experiment:
- Initial Potential: e.g., -0.2 V (vs. Ref.)
- Switching Potential 1: e.g., +0.6 V (vs. Ref.)
- Final Potential: Set to the initial potential to complete the cycle.
- Scan Rate: Begin with a slow scan rate, e.g., 0.1 V/s.
- Number of Cycles: 3-5 cycles to ensure stability.
- Data Acquisition: Start the measurement. The voltammogram will be displayed in real-time.
- Multi-Scan Rate Experiment: Repeat the measurement at several different scan rates (e.g., 0.05, 0.1, 0.2, 0.5 V/s) using a fresh solution or after ensuring the electrode surface is unchanged.
Data Analysis and Interpretation
- Peak Identification: For each scan rate, identify the anodic peak potential (Epa), cathodic peak potential (Epc), anodic peak current (Ipa), and cathodic peak current (Ipc).
- Calculate Key Parameters:
- Calculate ΔEp = Epa - Epc for each scan rate.
- Calculate the ratio |Ipa/Ipc| for each scan rate.
- Plot Dependencies:
- Create a plot of Peak Current (Ip) vs. Square Root of Scan Rate (v^(1/2)). A linear relationship suggests a diffusion-controlled process [27].
- Create a plot of ΔEp vs. Scan Rate (v). A constant ΔEp indicates reversibility, while an increasing ΔEp indicates quasi-reversibility.
- Classification: Use the criteria outlined in Table 1 and the decision workflow to classify the system.
Advanced Considerations and Broader Research Context
The Nicholson Parameter for Quantifying Reversibility
For quasi-reversible systems, the Nicholson parameter provides a quantitative method to determine the dimensionless kinetic parameter (Ψ), which is related to the electron transfer rate constant (k⁰). This allows researchers to move beyond qualitative classification to obtaining quantitative kinetic data from CV experiments [15].
Distinguishing Adsorbed and Diffusing Species
The diagnosis of reversibility can be complicated if the redox species is adsorbed onto the electrode surface rather than freely diffusing. For adsorbed species, the CV peaks are sharp and symmetrical, and the peak current (Ip) is directly proportional to the scan rate (v), not its square root [16]. This distinction is crucial in fields like sensor design and surface science [23].
Applications in Research and Drug Development
Understanding electrochemical reversibility is critical across numerous domains:
- Battery Research: CV is a "diagnostic report" for electrode materials. A small ΔEp indicates highly reversible Li⁺ intercalation, which is crucial for high-performance batteries with low polarization and long cycle life [27].
- Drug Development: Studying the redox behavior of antibiotic molecules like amoxicillin can reveal quasi-reversible behavior and interactions with metal ions, guiding prescription advice to avoid co-administration [23].
- Biosensors and Bioelectrochemistry: CV is used to measure the electron transfer rates of immobilized redox proteins, which is fundamental to developing biosensors and understanding biological redox processes [29].
- Electrocatalyst Characterization: In fuel cell research, CV is used to characterize synthesized catalysts (e.g., Pt-Ru) and their catalytic activities, where reversibility informs on the efficiency of the catalytic cycles [23].
The shape of the cyclic voltammogram, specifically the presence and separation of redox peaks and their dependence on experimental parameters like scan rate, provides a powerful, in-situ diagnostic toolkit for classifying electrochemical systems. Mastering the interpretation of these features allows researchers to distinguish reversible, quasi-reversible, and irreversible processes reliably. This knowledge is not merely academic; it is the cornerstone of rational material design in energy storage, the development of sensitive analytical biosensors, and the understanding of complex redox mechanisms in pharmaceutical and biological systems. As a core technique within the electrochemical repertoire, cyclic voltammetry's role in deciphering electron transfer reversibility ensures its continued indispensability in scientific research and industrial development.
Cyclic Voltammetry in Action: Key Research Applications Across Scientific Fields
Cyclic Voltammetry (CV) is a powerful and ubiquitous electrochemical technique used to study the kinetics of electrochemical reactions by measuring current while cycling the potential of a working electrode [30]. In the context of renewable energy research, CV is indispensable for probing and developing efficient electrocatalysts for reactions critical to fuel cell technology, such as the methanol oxidation reaction (MOR) [31] [14]. This technique provides a direct window into the electrode-solution interface, allowing researchers to decipher complex reaction mechanisms, evaluate catalytic activity, and determine crucial kinetic parameters [32] [33]. The output, a cyclic voltammogram (I-E curve), serves as a fingerprint of the electrochemical processes occurring at the electrode surface, offering insights into the energetics of redox reactions, the dynamics of electron transfer, and the rates of coupled chemical reactions [32] [30]. This guide details the application of CV in characterizing MOR catalysts, framed within the broader thesis that CV is a fundamental tool for advancing electrochemical energy conversion research.
Fundamentals of Cyclic Voltammetry
Core Principles and Technique
Cyclic Voltammetry operates by applying a linear potential sweep between two set limits (the vertex potentials) and measuring the resulting current [30]. The potential (E) is defined as a function of time (t) and scan rate (v), typically starting at an initial potential (Ei) where no significant current flows [33]. For a simple, reversible one-electron transfer process (O + e⁻ ⇌ R), the current response is governed by the interplay between electron transfer kinetics and mass transport of reactants and products via diffusion [33]. The shape of the voltammogram reveals the reversibility of the reaction, which is classified as reversible, quasi-reversible, or irreversible based on the relative rates of electron transfer and mass transport [33] [30].
- Reversible Process: Electron transfer is much faster than mass transport. The system obeys the Nernst equation, and the voltammogram exhibits symmetric oxidation and reduction peaks with a peak separation (ΔEp) of approximately 59 mV for a one-electron process at 25°C [33].
- Quasi-Reversible Process: Intermediate case where electron transfer and mass transport rates are comparable. The peak separation is larger than 59 mV and increases with scan rate [30].
- Irreversible Process: Electron transfer is much slower than mass transport. The reverse scan peak is absent, and the peak potential shifts significantly with scan rate [33] [30].
The following diagram illustrates the core principle of potential scanning and electron transfer in CV.
Information Derived from Cyclic Voltammetry
CV provides a wealth of qualitative and quantitative information, making it a cornerstone technique in electrocatalysis research. The table below summarizes the key parameters that can be extracted from a cyclic voltammogram.
Table 1: Key Information Obtainable from Cyclic Voltammetry Analysis
| Parameter | Description | Application in Electrocatalysis |
|---|---|---|
| Peak Current (Ip) | The maximum current observed during a redox event. | Proportional to the concentration of the electroactive species and the square root of the scan rate in diffusion-controlled processes; indicates catalytic activity [33] [30]. |
| Peak Potential (Ep) | The potential at which the peak current occurs. | Identifies the redox potential of a reaction; shifts in Ep can indicate changes in reaction kinetics or catalyst binding energy [33]. |
| Peak Separation (ΔEp) | The difference between anodic and cathodic peak potentials. | Diagnoses electrochemical reversibility; smaller ΔEp values indicate faster electron transfer kinetics [33] [30]. |
| Electrochemically Active Surface Area (ECSA) | The area of the catalyst actively participating in the electrochemical reaction. | Evaluates the density of active sites, often calculated from the charge under a non-Faradaic (capacitive) current region or a known surface redox couple [14]. |
| Onset Potential | The potential at which the Faradaic current for a catalytic reaction begins to significantly increase. | A key metric for catalyst efficiency; a lower onset potential signifies a more efficient catalyst that operates closer to the thermodynamic potential [14]. |
Application to Methanol Oxidation Reaction (MOR)
The Importance of MOR and Catalyst Challenges
The methanol oxidation reaction (MOR) is the critical anodic process in direct methanol fuel cells (DMFCs), which are promising energy conversion devices due to their high efficiency and low pollutant emissions [14]. The most common and effective catalysts for MOR are based on platinum (Pt). However, a major challenge is catalyst poisoning by carbon monoxide (CO) and other intermediates (e.g., HCHOad, COHad) generated during methanol oxidation [31]. These species strongly adsorb onto the Pt active sites, blocking them from further reaction with fresh methanol molecules, which leads to a rapid decline in fuel cell performance [31]. This has driven extensive research into more CO-tolerant catalysts, such as PtRu alloys, and lower-cost, non-precious metal alternatives [31] [14].
Interpreting the MOR Cyclic Voltammogram
A typical cyclic voltammogram for MOR on a Pt-based catalyst features two distinct oxidation peaks [31]:
- Forward Scan Peak (Pf): Arises from the oxidation of freshly chemisorbed methanol molecules.
- Backward Scan Peak (Pb): Observed during the reverse potential sweep.
For years, the ratio of the forward to backward peak currents (jf/jb) was intensively used as a criterion to evaluate a catalyst's tolerance to CO poisoning, with a higher ratio implying better CO oxidation capability [31]. However, recent studies using advanced techniques like Differential Electrochemical Mass Spectrometry (DEMS) have demonstrated that both peaks primarily originate from the direct oxidation of freshly adsorbed methanol, not from accumulated carbonaceous residues [31]. The hysteresis between the peaks is now understood to be related to the changing state of the catalyst surface: at high potentials in the forward scan, the Pt surface becomes oxidized, and the backward peak is linked to methanol oxidation on this oxidized surface as it is reduced during the reverse scan [31]. Therefore, the peak area ratio (Sf/Sb) is a more appropriate descriptor for the reducibility of the oxidized catalyst surface formed at high potential [31].
Case Study: Ni/Al-Carbonate Hydrotalcite as a Non-Precious MOR Catalyst
Ni/Al-carbonate-based layered double hydroxide (Ni-LDH) has emerged as a promising, cost-effective catalyst for MOR in highly alkaline conditions [14]. The CV of a glassy carbon electrode modified with Ni-LDH (NLGC) shows a quasi-reversible redox couple with anodic and cathodic peaks corresponding to the Ni(II)/Ni(III) transition [14]. The proposed mechanism for MOR on NLGC involves:
- Electrochemical generation of the active Ni(III) species: NiII-(OH)₂ → NiIII-OOH + e⁻
- Catalytic oxidation of methanol by NiIII-OOH to CO₂ or other products like formate.
The catalytic current is proportional to the surface coverage of the electroactive Ni species, and the brucite-like layers of the hydrotalcite structure enhance charge transport, contributing to the catalyst's efficiency [14]. The experimental workflow and reaction pathway for this system are illustrated below.
Experimental Protocols & Data Analysis
Detailed Methodology for MOR Catalyst Evaluation
The following protocol outlines a standard procedure for evaluating a MOR catalyst using CV, based on studies of Ni-LDH and similar systems [31] [14].
Electrode Preparation:
- Working Electrode: A glassy carbon electrode (GCE, e.g., 3 mm diameter) is meticulously polished with a 0.3 μm alumina slurry on a microcloth. It is then rinsed thoroughly with doubly distilled water and ultrasonicated in water for 1-2 minutes to remove any adsorbed alumina particles, followed by air drying.
- Catalyst Ink Preparation: 5 mg of the catalyst powder (e.g., Ni-LDH) is dispersed in a mixture of 975 μL of solvent (typically 4:1 v/v water:isopropanol) and 25 μL of a binder (e.g., 5% Nafion solution) via vortex mixing and then sonication for 30-60 minutes to form a homogeneous ink.
- Electrode Modification: A precise volume (e.g., 5-10 μL) of the catalyst ink is drop-casted onto the clean, polished surface of the GCE and allowed to dry at ambient temperature. The catalyst loading mass is calculated from the concentration and volume of the ink.
Electrochemical Setup and Measurement:
- Cell Configuration: A standard three-electrode system is used. The modified GCE serves as the working electrode, a high-purity platinum wire or coil as the counter electrode, and a saturated calomel electrode (SCE) or Ag/AgCl as the reference electrode.
- Electrolyte: A degassed (with N₂ for 15-20 minutes) alkaline solution (e.g., 0.1 M NaOH, pH ~13) is used as the base electrolyte.
- Initial Characterization: The CV of the modified electrode is first recorded in the base electrolyte without methanol (e.g., from 0.1 V to 0.6 V vs. SCE) to characterize the catalyst's inherent redox behavior (e.g., Ni²⁺/Ni³⁺ couple) and to calculate the electrochemically active surface area (ECSA).
- MOR Activity Measurement: A known volume of methanol is added to the electrolyte to achieve a specific concentration (e.g., 0.5 M). The CV is then recorded over a suitable potential window (e.g., 0.1 V to 0.8 V vs. SCE) at various scan rates (e.g., 10-100 mV/s). The solution is stirred and purged with N₂ between scans if necessary.
Key Research Reagents and Materials
The table below lists essential materials and their functions for a typical MOR electrocatalysis experiment.
Table 2: Essential Research Reagents and Materials for MOR Electrocatalysis
| Material/Reagent | Function/Explanation |
|---|---|
| Glassy Carbon Electrode (GCE) | An inert working electrode substrate with a well-defined surface for depositing catalyst materials [14]. |
| Catalyst Powder (e.g., Ni-LDH, Pt/C) | The active material under investigation, responsible for facilitating the methanol oxidation reaction [14]. |
| Nafion Perfluorinated Resin | A common ionomer binder used to create a stable catalyst layer on the electrode surface and to conduct protons [14]. |
| Sodium Hydroxide (NaOH) or Potassium Hydroxide (KOH) | Used to prepare the alkaline electrolyte necessary for the reaction, as the MOR mechanism is typically favored in basic media [14]. |
| Methanol (CH₃OH) | The fuel and target analyte for the oxidation reaction [31] [14]. |
| Platinum Counter Electrode | Serves as the auxiliary electrode to complete the electrical circuit in the three-electrode cell. |
| Reference Electrode (e.g., SCE, Ag/AgCl) | Provides a stable and known reference potential against which the working electrode potential is precisely controlled and measured [14]. |
Quantitative Data Analysis and Interpretation
The data extracted from CV experiments can be systematically analyzed to determine key performance metrics for the electrocatalyst. The following table compiles quantitative data and parameters from relevant studies.
Table 3: Quantitative Data from MOR Catalyst Studies Using CV
| Catalyst System | Key CV Parameters | Experimental Conditions | Interpretation & Significance |
|---|---|---|---|
| Pt-based Catalysts (General) | Forward peak (Pf), Backward peak (Pb) [31]. | Acidic or neutral media. | Peak Area Ratio (Sf/Sb) is a descriptor for the reducibility of the oxidized catalyst surface, not solely CO tolerance [31]. |
| Ni/Al-Carbonate Hydrotalcite (Ni-LDH) | Anodic Peak: 0.62 V (vs. SCE), Cathodic Peak: 0.42 V [14]. | 0.5 M Methanol, pH 13. | Corresponds to the quasi-reversible Ni(II)/Ni(III) redox couple, which is the active site for MOR [14]. |
| Ni/Al-Carbonate Hydrotalcite (Ni-LDH) | Onset Potential: 5.2 V, Tafel Slope: 24.2 mV/dec [14]. | Alkaline media. | Indicates the potential required to initiate MOR and provides insight into the reaction kinetics and mechanism [14]. |
| Ni/Al-Carbonate Hydrotalcite (Ni-LDH) | Electrochemically Active Surface Area: 0.042 cm² [14]. | Calculated from CV in blank electrolyte. | Quantifies the effective surface area of the catalyst available for the electrochemical reaction [14]. |
Cyclic Voltammetry stands as an essential analytical technique in the quest for advanced electrocatalysts for methanol fuel cells. Its power lies in its ability to provide a real-time, in-depth probe of the electrochemical interface, yielding critical information on reaction mechanisms, catalytic activity, and kinetics. The ongoing refinement of CV interpretation, as evidenced by the re-evaluation of the jf/jb ratio for MOR, underscores its dynamic role in scientific discovery [31]. As research pushes towards non-precious metal catalysts like Ni-LDH, CV remains the foundational method for characterizing their performance and elucidating their redox-mediated reaction pathways [14]. By enabling the rational design of more efficient and cost-effective catalysts, Cyclic Voltammetry directly contributes to the advancement of renewable energy technologies, solidifying its status as an indispensable tool in modern electrochemical research.
Cyclic voltammetry (CV) has emerged as a powerful electroanalytical technique for the rapid screening of antioxidants in pharmaceutical formulation development. This technical guide explores the fundamental principles, experimental protocols, and practical applications of CV within the broader research context of electrochemical characterization methods. Compared to traditional antioxidant assessment techniques, CV provides significant advantages in speed, cost-effectiveness, and mechanistic insight, enabling formulation scientists to efficiently identify optimal antioxidant systems for drug stabilization. This whitepaper details standardized methodologies, data interpretation frameworks, and implementation strategies tailored to pharmaceutical research environments, providing development professionals with a comprehensive resource for enhancing formulation stability screening protocols.
Cyclic voltammetry is an electrochemical technique that measures the current response of a solution when the working electrode potential is linearly swept versus time and then swept back in the opposite direction, generating a cyclic voltammogram that reveals crucial information about redox-active compounds [34]. Within pharmaceutical research, CV serves as a valuable tool for characterizing the electrochemical properties of molecules by providing their oxidation/reduction potentials [35]. This capability is particularly advantageous for evaluating antioxidants, which function primarily through electron transfer mechanisms that can be directly measured via electrochemical methods.
The application of CV for antioxidant capacity assessment was pioneered in biological systems and has since been validated for quantifying low-molecular-weight antioxidants in diverse matrices including blood plasma, tissue homogenates, and plant extracts [36] [37]. In pharmaceutical contexts, CV enables researchers to rapidly determine the oxidation potential of antioxidant candidates, which correlates well with their radical scavenging efficiency [35]. This technique provides both quantitative concentration information and qualitative insights into the nature of the antioxidant compounds present in a formulation, making it particularly valuable during preformulation stages where rapid screening of multiple antioxidant candidates is essential.
Theoretical Foundations and Practical Advantages
Electrochemical Principles of Antioxidant Assessment
The fundamental principle underlying CV-based antioxidant evaluation revolves around the electron-donating capacity of antioxidant compounds. When an antioxidant molecule encounters an appropriate oxidation potential at the working electrode, it loses electrons, generating an anodic current that appears as characteristic peaks in the voltammogram [34]. Analysis of these peaks provides two critical parameters: the anodic peak potential (Epa), which indicates the specific voltage required to oxidize the compound and reflects the antioxidant's thermodynamic tendency to donate electrons, and the anodic peak current (Ipa), which is proportional to the concentration of the electroactive species [36] [38].
The overall antioxidant capacity can be determined from the area under the anodic wave (S), while the half-wave potential (E₁/₂) provides information about the nature of the specific antioxidant molecules present [36]. For reversible systems, the relationship between peak potentials offers additional characterization parameters, with the ideal separation between anodic and cathodic peaks (ΔEp) being approximately 57 mV for a one-electron transfer process [34]. These electrochemical parameters collectively enable researchers to construct comprehensive antioxidant profiles for pharmaceutical formulations.
Comparative Advantages Over Traditional Methods
Traditional antioxidant assessment methods, including DPPH, ABTS, FRAP, and ORAC assays, rely on spectrophotometric measurements of color changes or complexation events following antioxidant-radical interactions [39] [40]. While these methods have proven utility, they present significant limitations including extensive sample preparation requirements, use of hazardous reagents, long incubation times, and limited mechanistic information [39]. CV addresses these limitations through several distinct advantages:
- Rapid Analysis: CV measurements typically require minutes rather than hours, enabling high-throughput screening of antioxidant candidates [35].
- Minimal Sample Preparation: Pharmaceutical samples can often be analyzed with minimal pretreatment, dissolved in appropriate electrolytes [41].
- Mechanistic Insights: The technique provides direct information about electron transfer processes and can distinguish between different antioxidant mechanisms [39].
- No Specialized Reagents: CV eliminates the need for unstable radical species or complex chromogenic systems required in traditional assays [40].
- Quantitative Correlation: Studies have demonstrated strong correlations between electrochemical parameters from CV and conventional antioxidant measures, with correlation coefficients reaching 0.86 in validation studies [41].
These advantages position CV as a powerful complementary technique that can streamline the antioxidant selection process in pharmaceutical development workflows.
Experimental Design and Methodological Protocols
Instrumentation and Research Reagent Solutions
The experimental setup for CV analysis requires specific instrumentation and reagents carefully selected for pharmaceutical applications. The table below details essential components and their functions:
Table 1: Essential Research Reagent Solutions for CV-based Antioxidant Screening
| Component | Specification | Pharmaceutical Application |
|---|---|---|
| Working Electrode | Glassy carbon, platinum, or gold | Primary surface for electron transfer; glassy carbon preferred for broad potential range |
| Reference Electrode | Ag/AgCl | Provides stable reference potential for accurate measurements |
| Counter Electrode | Platinum wire | Completes electrical circuit without reaction interference |
| Supporting Electrolyte | Tetrabutylammonium hexafluorophosphate or alkali metal salts | Ensures solution conductivity and minimizes resistive losses |
| Solvent System | Acetonitrile, acetate buffer (pH 3.0), phosphate buffer (pH 7.0) | Dissolves analytes and electrolytes; choice depends on antioxidant solubility and stability |
| Standard Antioxidants | Gallic acid, caffeic acid, catechin, ascorbic acid | Method validation and quantitative calibration |
The potentiostatic control system (potentiostat) applies the programmed voltage sweep and measures the resulting current, with modern instruments offering sophisticated software for data acquisition and analysis [34] [38]. Electrode selection is particularly critical, with glassy carbon representing the preferred material for most pharmaceutical applications due to its wide potential window, chemical inertness, and reproducible surface properties.
Standardized Experimental Procedure
The following protocol provides a standardized approach for CV-based antioxidant screening in pharmaceutical formulations:
Step 1: Sample Preparation
- Dissolve the drug formulation or antioxidant candidate in appropriate electrolyte solution (typically 0.1-1.0 mg/mL concentration)
- For solid formulations, extract antioxidants using suitable solvent (methanol, ethanol, or buffer) with brief sonication
- Remove insoluble excipients by centrifugation at 10,000 × g for 10 minutes
- For liquid formulations, dilute directly in electrolyte solution [41] [38]
Step 2: Electrode Preparation
- Polish glassy carbon working electrode with alumina slurry (0.05 μm) on a microcloth
- Rinse thoroughly with deionized water followed by electrolyte solution
- Sonicate in water or ethanol for 2 minutes to remove adsorbed particles
- Condition electrode by performing multiple CV cycles in blank electrolyte until stable baseline achieved [38]
Step 3: Instrumental Parameters
- Set initial potential: 0.0 V
- Set switching potential: +1.0 to +1.5 V (dependent on antioxidant system)
- Set final potential: return to initial potential
- Scan rate: 50-100 mV/s (optimized for each system)
- Sample temperature: 25.0 ± 0.5°C
- Decorate with nitrogen for 10 minutes before measurement [38]
Step 4: Data Acquisition and Analysis
- Record minimum of three consecutive cycles until stable voltammogram obtained
- Measure anodic peak current (Ipa), anodic peak potential (Epa), and peak area (S)
- Compare with standard antioxidants for quantitative assessment
- Calculate antioxidant capacity parameters based on established calibration curves [36] [38]
This standardized protocol ensures reproducible results across different testing sessions and between laboratory environments, which is essential for reliable formulation development decisions.
Figure 1: CV Experimental Workflow for Antioxidant Screening
Data Interpretation and Analytical Parameters
Key Electrochemical Parameters for Antioxidant Assessment
CV analysis generates voltammograms with characteristic features that provide quantitative and qualitative information about antioxidant properties. The table below summarizes the critical parameters used in antioxidant evaluation:
Table 2: Key Electrochemical Parameters for Antioxidant Capacity Assessment
| Parameter | Symbol | Interpretation | Pharmaceutical Significance |
|---|---|---|---|
| Anodic Peak Potential | Epa | Voltage at oxidation current maximum | Indicates antioxidant strength; lower Epa = stronger antioxidant |
| Anodic Peak Current | Ipa | Maximum current during oxidation | Proportional to antioxidant concentration in sample |
| Peak Area | S | Area under anodic wave | Represents total antioxidant capacity through charge transfer |
| Onset Potential | Eon | Potential where oxidation begins | Identifies most easily oxidized components in mixture |
| Half-Peak Potential | E₁/₂ | Potential at half peak current | Characterizes specific antioxidant molecules present |
| Peak Separation | ΔEp | Difference between anodic and cathodic peaks | Indicates electron transfer reversibility |
These parameters enable comprehensive characterization of antioxidant systems in pharmaceutical formulations. The anodic peak potential (Epa) serves as the primary indicator of antioxidant efficacy, with lower values corresponding to greater ease of electron donation and thus higher antioxidant potential [38]. Recent studies have demonstrated that Epa values effectively classify antioxidant strength, enabling rapid comparison between candidate molecules [38].
Correlation with Conventional Antioxidant Assays
Validation studies have established significant correlations between CV parameters and traditional antioxidant measures. In moth bean protein hydrolysates, CV analysis demonstrated strong correlation (r = 0.86) with ABTS radical scavenging capacity, confirming the electrochemical technique's reliability for antioxidant assessment [41]. Similar correlations have been observed in studies comparing CV with DPPH assays in vegetable extracts, where the anodic current showed inverse relationship with IC₅₀ values from radical scavenging assays [40].
The onset potential (Eon) has emerged as particularly valuable for evaluating synergistic effects between different antioxidants in complex mixtures [38]. Binary and mixed antioxidant systems often exhibit lower Eon values than individual components, indicating enhanced antioxidant potential through cooperative interactions – a critical consideration for formulating multi-component antioxidant systems in pharmaceutical products.
Figure 2: CV Data Interpretation Framework for Pharmaceutical Applications
Pharmaceutical Implementation and Validation
Integration in Formulation Development Workflow
The implementation of CV for antioxidant screening aligns with quality by design (QbD) principles in pharmaceutical development by providing scientific evidence for antioxidant selection decisions. The technique fits strategically within the early formulation development workflow, enabling rapid identification of the most effective antioxidants before committing to long-term stability studies [35]. This approach significantly accelerates development timelines while enhancing formulation robustness.
In practice, CV screening should be applied to a panel of preferred antioxidants identified through preliminary compatibility studies. The small group of antioxidants demonstrating optimal electrochemical properties – characterized by appropriate oxidation potentials and sufficient current responses – can then be selected for conventional stability studies [35]. This tiered approach maximizes resource efficiency while ensuring scientific rigor in excipient selection.
Method Validation and Regulatory Considerations
For CV methods to provide reliable data for pharmaceutical decision-making, appropriate validation is essential. While formal validation requirements for electrochemical methods may be less standardized than for chromatographic assays, key validation parameters should include:
- Precision: Repeatability of Epa and Ipa measurements (RSD < 5%)
- Linearity: Current response proportionality across relevant concentration ranges
- Robustness: Performance consistency with minor method parameter variations
- Specificity: Ability to detect target antioxidants in presence of formulation matrix
Method transfer to quality control environments requires additional standardization of electrode preparation protocols, electrolyte specifications, and system suitability criteria. The correlation between CV parameters and established antioxidant efficacy measures provides scientific justification for implementing this technique as a screening tool, though traditional stability studies remain essential for final formulation approval [35].
Cyclic voltammetry represents a sophisticated yet practical analytical tool that significantly enhances the efficiency of antioxidant screening in pharmaceutical development. By providing rapid, mechanistically insightful assessment of antioxidant properties, CV enables formulation scientists to make evidence-based decisions early in the development process, potentially reducing both time and resource investments. The strong correlation between electrochemical parameters and conventional antioxidant measures validates CV as a reliable screening technique, while its ability to detect synergistic effects offers unique advantages for optimizing complex antioxidant systems.
As pharmaceutical formulations grow increasingly sophisticated and stability requirements more stringent, the implementation of efficient analytical techniques like cyclic voltammetry will become increasingly valuable. By integrating CV into standardized development workflows, pharmaceutical scientists can enhance formulation robustness while adhering to QbD principles, ultimately delivering more stable and effective drug products to patients.
The imperative for robust methods to rapidly determine seed viability extends across agronomy, forestry, and biodiversity conservation. Traditional methods, including germination tests and tetrazolium staining, are often cumbersome, time-consuming, or qualitative. This whitepaper details a novel application of cyclic voltammetry (CV) for the rapid, quantitative, and non-destructive assessment of seed viability. The technique leverages the correlation between a seed's total antioxidant capacity, which diminishes with aging, and its electrochemical activity. Recent research demonstrates that CV measurements of seed extracts show a strong correlation (up to R = 0.92) with germination rates, establishing CV as a powerful tool for high-throughput seed quality screening. This guide provides a comprehensive technical overview, from fundamental principles to detailed experimental protocols, framing CV as an essential technique in the modern researcher's arsenal.
Cyclic Voltammetry (CV) is a cornerstone electrochemical technique used to study the redox properties of chemical species. It provides critical insights into the thermodynamics and kinetics of electron transfer reactions, which are fundamental processes in fields ranging from material science to biology [2].
In a standard CV experiment, the potential applied to a working electrode is swept linearly with time between two set limits and then swept back. The resulting current response is plotted against the applied potential to produce a cyclic voltammogram. Key features of this plot, such as peak potentials and peak currents, provide information about the redox potential of the electroactive species, the concentration, and the reversibility of the electron transfer process [1] [2]. The governing equations include the Nernst equation (for thermodynamics) and the Randles-Sevcik equation (which relates peak current to scan rate and concentration) [2].
The versatility of CV is evidenced by its diverse research applications:
- Fuel Cell & Energy Research: Characterizing electrocatalysts for methanol oxidation, utilizing materials like Ni/Al hydrotalcite [14].
- Analytical & Bio-Analytical Chemistry: Detecting antioxidants in complex matrices like blood plasma, food, and, as explored here, plant extracts [42].
- High-Throughput Experimentation: Employing machine learning to regress kinetic parameters from voltammograms in milliseconds, vastly accelerating data analysis [17].
- Sensor Development: Analyzing redox probes under finite diffusion conditions to improve sensor design [43].
The application of CV to seed viability assessment is a novel and powerful extension of its capability to quantify redox-active species, specifically the antioxidant compounds that are a key indicator of seed metabolic health.
The Scientific Principle: Linking Antioxidant Capacity to Seed Viability
Seed deterioration during storage is a primary cause of viability loss, with reactive oxygen species (ROS) being the central agents of damage. ROS cause oxidative stress, leading to the degradation of lipids, proteins, and DNA, ultimately resulting in the loss of germination capacity [42] [44]. A seed's ability to counteract this damage hinges on its arsenal of low-molecular-weight antioxidants (e.g., glutathione, ascorbic acid) and antioxidant enzymes [42].
The core premise of the CV method is that the total antioxidant capacity of a seed is a direct reflection of its physiological health and viability. As a seed ages and deteriorates, its antioxidant defenses are depleted. CV directly measures this collective antioxidant power by electrochemically oxidizing the antioxidant compounds present in a seed extract. The resulting voltammogram provides a "fingerprint" of the extract's redox activity. A higher electrochemical response indicates a greater concentration of antioxidants, which is strongly correlated with higher viability [42] [44].
This electrochemical approach offers significant advantages over traditional spectrophotometric antioxidant assays (e.g., CUPRAC, DPPH), which can be misled by interfering compounds and require specific redox-active reagents. CV is explicitly based on the inherent electrochemical properties of the antioxidants themselves, making it a more reliable and direct quantification method [42].
Diagram: The relationship between seed aging, antioxidant depletion, and the electrochemical signal.
Experimental Protocol: A Step-by-Step Guide
The following protocol, adapted from a 2025 study on silver maple (Acer saccharinum L.), provides a robust framework for determining seed viability via CV [42] [44].
Seed Preparation and Accelerated Aging
- Source Seeds: Obtain seeds of the species under study. Recalcitrant seeds (which are sensitive to desiccation) like silver maple are excellent models for aging studies due to their rapid deterioration.
- Induce Aging: To create seeds with a range of viabilities, subject batches to accelerated aging. A typical protocol involves placing seeds with high moisture content (e.g., 45%) in sealed bags and incubating them at 35°C for varying durations (e.g., 0, 1, 4, 10, and 14 days) [42].
- Control Group: Maintain a control group of non-aged seeds for baseline measurements.
Preparation of Seed Extracts
- Homogenization: Grind a representative sample of seeds (e.g., 0.5 g) into a fine powder using a mortar and pestle under liquid nitrogen.
- Antioxidant Extraction: Transfer the powder to a centrifuge tube and add an appropriate solvent. Studies have successfully used:
- Extraction Process: Vortex the mixture vigorously, then sonicate for 15-30 minutes to maximize antioxidant extraction. Centrifuge the sample at >10,000 × g for 10 minutes to pellet cellular debris.
- Supernatant Collection: Carefully collect the clear supernatant, which contains the soluble antioxidants, and use it immediately for CV analysis or store at -80°C.
Cyclic Voltammetry Measurement
- Electrochemical Cell Setup: Use a standard three-electrode system [1] [2].
- Working Electrode: Glassy Carbon Electrode (GCE, 3 mm diameter).
- Reference Electrode: Saturated Calomel Electrode (SCE) or Ag/AgCl.
- Counter Electrode: Platinum wire.
- Electrode Preparation: Prior to modification, polish the GCE with a 0.3 μm alumina slurry, rinse thoroughly with distilled water, and dry [14].
- Supporting Electrolyte: Use a suitable aqueous buffer (e.g., PBS, pH 7.4) as the electrolyte solution. Degas with nitrogen or argon for 10 minutes before measurements to remove dissolved oxygen.
- Analysis: Add an aliquot of the seed extract directly to the electrolyte cell. Perform CV scans, typically between 0.0 V and +0.8 V vs. the reference electrode, at a scan rate of 50-100 mV/s [42]. Run multiple scans to ensure stability.
Diagram: The workflow for the electrochemical determination of seed viability.
Data Interpretation and Analysis
The cyclic voltammogram of a seed extract will typically show one or more oxidation peaks within the scanned potential window. These peaks correspond to the oxidation of different classes of antioxidants (e.g., phenolic compounds, ascorbic acid, glutathione) present in the extract [42].
Key Analytical Parameters
- Peak Current (ip): The magnitude of the anodic (oxidation) peak current is directly proportional to the concentration of the electroactive antioxidants. This is the primary quantitative metric for assessing total antioxidant capacity.
- Peak Potential (Ep): The voltage at which the oxidation peak occurs indicates the reducing power of the antioxidants. A lower (more negative) Ep suggests a stronger, more easily oxidized antioxidant.
Correlation with Viability
The quantitative data from the CV analysis must be correlated with traditional viability measures.
- Germination Test: The gold standard for viability. Seeds from each aging group are germinated under standard conditions, and the total germination percentage is calculated.
- Statistical Correlation: A linear regression analysis is performed between the CV response (e.g., anodic peak current) and the observed germination percentage. The 2025 silver maple study reported a highly significant correlation (R = 0.92 and 0.86 for methanolic and PBS extracts, respectively, p ≤ 0.01) [42] [44]. This strong correlation validates the CV signal as a reliable predictor of viability.
Table 1: Summary of Key Quantitative Findings from Seed Viability Research
| Measurement Technique | Key Quantitative Result | Correlation with Viability (R-value) | Reference |
|---|---|---|---|
| Cyclic Voltammetry (CV) of 80% Methanolic Extract | Peak current / total charge measurement | R = 0.92 (p ≤ 0.01) | [42] [44] |
| Cyclic Voltammetry (CV) of PBS Extract | Peak current / total charge measurement | R = 0.86 (p ≤ 0.01) | [42] [44] |
| Traditional TTC Staining | Absorbance of extracted TTF at 483 nm | Used for quantitative calibration | [45] |
Comparison with Traditional and Emerging Methods
Understanding the position of CV among other viability assessment techniques highlights its unique advantages.
Table 2: Comparison of Seed Viability Assessment Techniques
| Method | Principle | Advantages | Disadvantages |
|---|---|---|---|
| Germination Test | Direct measurement of growth potential | International standard; biologically relevant | Slow (days/weeks); labor-intensive |
| Tetrazolium (TTC) Staining | Visual assessment of dehydrogenase activity | Relatively quick; established protocol | Often qualitative; destructive; can be cumbersome for quantification [45] |
| Near-Infrared (NIR) Spectroscopy | Spectral analysis of chemical bonds | Non-destructive; fast | Requires complex calibration models; indirect measurement [46] |
| Hyperspectral Imaging | Combines imaging and spectroscopy | Spatially resolved data | Expensive equipment; complex data processing [46] |
| Cyclic Voltammetry (CV) | Electrochemical measurement of antioxidants | Fast; quantitative; high correlation with viability; does not require specific reagents | Destructive (requires extract); requires electrochemical instrumentation |
The Scientist's Toolkit: Essential Research Reagents & Materials
Table 3: Key Research Reagent Solutions for Electrochemical Seed Viability Assessment
| Item | Function / Application | Specific Examples / Notes |
|---|---|---|
| Glassy Carbon Electrode (GCE) | Working electrode; surface for electron transfer reactions. | 3 mm diameter is common. Requires polishing with alumina slurry before use [14] [42]. |
| Potentiostat | Instrument to control potential and measure current. | Essential for performing CV scans. |
| Reference Electrode | Provides a stable, known potential reference. | Saturated Calomel Electrode (SCE) or Ag/AgCl [14]. |
| Extraction Solvents | To dissolve and extract antioxidant compounds from seeds. | 80% Methanol or 1x PBS have been validated [42]. |
| Supporting Electrolyte | Conducts current in the electrochemical cell. | Phosphate Buffered Saline (PBS), pH 7.4. |
| Polishing Supplies | To clean and renew the working electrode surface. | 0.3 μm and 0.05 μm Alumina slurry on a polishing cloth [14]. |
The electrochemical determination of seed viability using Cyclic Voltammetry represents a significant advancement in agricultural analytics. By quantifying the total antioxidant capacity of seeds—a direct biochemical correlate of physiological health—CV provides researchers with a method that is rapid, quantitative, and highly accurate (up to 92% correlation with germination). Its superiority over traditional TTC staining in terms of quantification and reliability, combined with its more direct and simpler workflow compared to emerging spectroscopic techniques, positions CV as a powerful tool for high-throughput seed quality control. Integrating this method into seed banks, breeding programs, and agricultural operations can dramatically enhance efficiency in monitoring and preserving seed germplasm, contributing directly to food security and biodiversity conservation efforts.
Cyclic Voltammetry (CV) is a powerful and versatile electrochemical technique that is extensively used in research for characterizing redox properties of molecules and investigating electron transfer mechanisms. In the context of pharmaceutical analysis, CV provides invaluable insights for detecting and quantifying antibiotic compounds in formulations and environmental samples. The technique involves applying a linear potential sweep to an electrochemical cell and measuring the resulting current, generating a characteristic "duck-shaped" plot known as a cyclic voltammogram [30] [15]. This output reveals critical information about the electrochemical behavior of analytes, including redox potentials, reaction reversibility, and electron transfer kinetics [13] [30].
For antibiotic detection, CV offers significant advantages over traditional chromatographic methods, including rapid analysis, low cost, simple operation, and excellent sensitivity and selectivity [47]. These characteristics make CV particularly valuable for quality control in drug manufacturing and environmental monitoring of pharmaceutical residues. The core principle involves monitoring the oxidation or reduction current of electroactive functional groups present in antibiotic molecules, enabling their detection and quantification at trace levels [47] [48]. When combined with strategically modified electrodes that enhance sensitivity and selectivity, CV emerges as an indispensable tool in modern pharmaceutical analysis.
Fundamental Principles of Cyclic Voltammetry
Key Voltammetric Parameters and Their Significance
The interpretation of cyclic voltammograms relies on several key parameters that provide information about the redox system under investigation. The peak current (ip) and peak potential (Ep) are the most fundamental parameters measured from the voltammogram [13]. For a reversible system at equilibrium, the peak current is described by the Randles-Sevcik equation:
ip = 2.69 × 10^5 × n^3/2 × A × C × D^1/2 × v^1/2
where n is the number of electrons transferred, A is the electrode surface area (cm²), C is the concentration (mol/cm³), D is the diffusion coefficient (cm²/s), and v is the scan rate (V/s) [13]. This relationship forms the basis for quantitative analysis in CV, as the peak current is directly proportional to analyte concentration.
The reversibility of a redox reaction is determined by evaluating two key metrics: the peak potential separation (ΔEp = Epa - Epc) and the peak current ratio (ipa/ipc) [13] [15]. For a perfectly reversible, single-electron transfer process, ΔEp is approximately 59 mV and ipa/ipc equals 1 at all scan rates [13]. Deviations from these values indicate quasi-reversible or irreversible electron transfer behavior, often observed with complex pharmaceutical compounds like antibiotics [13] [30].
Electrode Modification Strategies for Enhanced Detection
A critical advancement in CV analysis of pharmaceuticals involves electrode modification to enhance sensitivity and selectivity. Modified electrodes significantly improve analytical performance through several mechanisms:
- Increased electroactive surface area - Nanostructured materials provide greater surface area for redox reactions, amplifying the Faradaic current relative to background charging current [47] [48].
- Enhanced electron transfer kinetics - Certain materials lower the activation energy for electron transfer, leading to better-defined peaks with higher currents [47].
- Preconcentration effects - Modified surfaces can selectively adsorb target analytes, effectively concentrating them at the electrode surface before measurement [47].
- Reduced fouling - Specialized coatings minimize passivation of the electrode surface by reaction products, improving reproducibility [48].
The following diagram illustrates the general workflow for developing and utilizing modified electrodes in antibiotic detection:
Modified Electrodes for Antibiotic Detection: Case Studies
Detection of Sulfamethoxazole Using MXene/ZIF-8 Composite
Recent research has demonstrated the successful application of MXene/ZIF-8 composite modified glassy carbon electrodes (GCE) for detecting sulfamethoxazole (SMX), a widely used antibiotic [48]. The MXene/ZIF-8 composite (MXOF) combines the high electrical conductivity of two-dimensional MXene materials with the exceptional surface area and adsorption capacity of zeolitic imidazolate framework-8 (ZIF-8) [48]. This synergistic effect significantly enhances the electrochemical response toward SMX oxidation compared to either material alone.
The experimental protocol for SMX detection involves several critical steps. First, the MXene/ZIF-8 composite is synthesized through chemical etching and precipitation methods, with successful formation confirmed by X-ray diffraction (XRD) and scanning electron microscopy (SEM) [48]. For electrode preparation, the GCE is meticulously polished with alumina powder and thoroughly rinsed with deionized water and ethanol. A colloidal suspension is prepared by sonicating 5 mg of the MXOF composite in ethanol for one hour, after which 5 μL of this suspension is drop-cast onto the clean GCE surface and dried in a vacuum chamber [48].
Electrochemical optimization studies revealed that phosphate buffer saline (PBS) at pH 7 with 5 mM ferric/ferrocyanide as the supporting electrolyte provides optimal sensing performance due to its buffering capacity and appropriate ionic strength [48]. The MXOF-modified electrode demonstrated enhanced sensitivity of 77.13 μA·mM⁻¹·cm⁻² with a linear detection range from 100 to 1000 μL, outperforming individual MXene (41.29 μA·mM⁻¹·cm⁻²) or ZIF-8 modified electrodes [48]. The limit of detection (LOD) achieved with this sensor configuration was sufficiently low for environmental and pharmaceutical monitoring applications.
Detection of Amoxicillin Using Reduced Graphite Oxide Nanosheets
Another significant application involves the voltammetric determination of amoxicillin (AMX) using reduced graphite oxide nanosheet electrodes (RGOnS) [47]. This sensor employs square-wave adsorptive stripping voltammetry (SWAdSV), which combines the accumulation of analyte at the electrode surface with sensitive square-wave measurement, significantly enhancing detection limits.
The electrode fabrication process begins with a graphite electrode that is electrochemically expanded by applying 5 V potential for 1 second in 0.5 M H₂SO₄ solution, creating graphite oxide nanosheets (GOnS) [47]. Subsequent electrochemical reduction at -1 V for 120 seconds produces RGOnS with restored conjugated networks and improved electrical conductivity [47]. This in-situ modification approach creates a stable bond between the electrode material and substrate, overcoming limitations of conventional drop-casting methods where unstable bonding can restrict electron transfer.
For AMX detection, experimental conditions including pH and accumulation time were systematically optimized [47]. The RGOnS electrode exhibited approximately ten times higher oxidation signal for AMX compared to the pristine graphite electrode, demonstrating the significant enhancement afforded by the modified surface [47]. The calibration curve showed excellent linearity in the range of 0.5-80 μM with a correlation coefficient of 0.9992 and a detection limit of 0.193 μM [47]. The method was successfully applied to detect AMX in various water samples and pharmaceutical formulations, confirming its practical utility for quality control and environmental monitoring.
Nickel-Based Catalysts for Organic Compound Oxidation
While not directly applied to antibiotics in the available literature, nickel/aluminum-carbonate hydrotalcite (Ni-LDH) modified electrodes have shown exceptional catalytic activity for methanol oxidation, suggesting potential applicability to antibiotic detection [14]. The catalytic performance stems from the quasi-reversible redox behavior of Ni(II)/Ni(III) centers, which facilitate electron transfer in alkaline conditions [14].
The preparation of Ni-LDH involves a co-precipitation method with Ni(NO₃)₂·6H₂O and Al(NO₃)₃·9H₂O solutions added dropwise to Na₂CO₃ solution while maintaining pH at 10 with NaOH [14]. The resulting precipitate is aged, filtered, washed, and air-dried before being transformed into a colloidal suspension for electrode modification [14]. This synthesis approach creates a material with advantageous thermal stability, chemical stability, and reversible oxidation properties that could potentially be harnessed for antibiotic detection.
Table 1: Performance Comparison of Modified Electrodes for Antibiotic Detection
| Electrode Material | Antibiotic Detected | Linear Range | Limit of Detection | Sensitivity | Reference |
|---|---|---|---|---|---|
| MXene/ZIF-8 composite | Sulfamethoxazole (SMX) | 100-1000 μL | Not specified | 77.13 μA·mM⁻¹·cm⁻² | [48] |
| Reduced Graphite Oxide Nanosheets (RGOnS) | Amoxicillin (AMX) | 0.5-80 μM | 0.193 μM | Not specified | [47] |
Experimental Protocols for Electrode Modification and Analysis
General Electrode Preparation and Modification Procedure
Proper electrode preparation is fundamental to obtaining reproducible and reliable cyclic voltammetry results. The following protocol outlines the standard procedure for preparing and modifying glassy carbon electrodes:
- Electrode Polishing: Polish the glassy carbon electrode (GCE) surface sequentially with 0.3 μm and 0.05 μm alumina slurry on a microcloth polishing pad [14] [48].
- Cleaning: Rinse the polished electrode thoroughly with doubly distilled water and ethanol to remove all polishing residue [48].
- Sonication: Subject the electrode to ultrasonication in ethanol for 5-10 minutes to remove any adherent particles [47].
- Drying: Allow the electrode to air dry at ambient temperature [14].
- Modification Preparation: Prepare the modifying material suspension by sonicating the nanomaterial (e.g., MXene/ZIF-8, reduced graphite oxide) in an appropriate solvent (typically water, isopropanol, or ethanol mixtures) for 30-120 minutes to achieve homogeneous dispersion [14] [48].
- Modification Application: Apply a precise volume (typically 5-10 μL) of the modifying suspension to the clean GCE surface using a micro-pipette [14] [48].
- Drying: Allow the modified electrode to dry completely under ambient conditions or in a vacuum chamber [48].
Cyclic Voltammetry Measurement Parameters
Standard CV parameters for antibiotic detection typically include:
- Potential Range: Determined based on the redox characteristics of the target antibiotic, typically spanning -1.0 to +1.0 V vs. Ag/AgCl [48] [15].
- Scan Rate: Usually between 10-100 mV/s for initial characterization, with variation studies from 10-500 mV/s to investigate diffusion control vs. adsorption mechanisms [14] [13].
- Quiet Time: 5-15 seconds to allow equilibrium establishment before initiating the potential sweep.
- Sample Degassing: Purge the solution with inert gas (N₂ or Ar) for 10-15 minutes before measurements to remove dissolved oxygen [15].
Table 2: Essential Research Reagents and Materials for Electrode Modification
| Reagent/Material | Function/Purpose | Example Application |
|---|---|---|
| MXene/ZIF-8 Composite | Enhanced surface area and conductivity | Sulfamethoxazole detection [48] |
| Reduced Graphite Oxide Nanosheets (RGOnS) | Improved electron transfer and adsorption | Amoxicillin detection [47] |
| Ni/Al-Carbonate Hydrotalcite | Redox mediation through Ni(II)/Ni(III) couple | Catalytic oxidation [14] |
| Phosphate Buffer Saline (PBS) | Supporting electrolyte with stable pH | Electrochemical optimization [48] |
| Ferric/Ferrocyanide | Redox probe for electrode characterization | Electroactive area determination [48] |
Data Analysis and Interpretation in Antibiotic Detection
Assessing Reaction Reversibility and Mechanisms
The interpretation of cyclic voltammograms for antibiotic detection involves careful analysis of peak characteristics to determine the reversibility and mechanism of the electrochemical reaction. For reversible systems, the peak current ratio (ipa/ipc) approaches unity, and the peak separation (ΔEp) remains constant with changing scan rate [13] [15]. However, many antibiotic compounds exhibit quasi-reversible or irreversible behavior due to complex electron transfer processes coupled with chemical reactions [13].
The relationship between peak current and scan rate provides critical information about the reaction mechanism. A linear correlation between peak current and scan rate (ip ∝ v) suggests an adsorption-controlled process, where the redox species is confined to the electrode surface [14]. Conversely, a linear relationship between peak current and the square root of scan rate (ip ∝ v¹/²) indicates a diffusion-controlled process, where mass transport from the bulk solution limits the current response [14] [13]. Many antibiotic detection systems exhibit mixed behavior, with both adsorption and diffusion contributing to the overall current.
Quantitative Analysis and Calibration
For quantitative analysis, calibration curves are constructed by plotting peak current against antibiotic concentration. The linear range of detection depends on the electrode modification and the specific antibiotic being analyzed. The limit of detection (LOD) is typically calculated as 3σ/slope, where σ represents the standard deviation of the blank response and slope is the sensitivity of the calibration curve [47].
The following diagram illustrates the electron transfer mechanism involved in the detection of antibiotics like amoxicillin, where the oxidation involves electron donation from functional groups:
The application of modified electrodes in cyclic voltammetry for antibiotic detection represents a significant advancement in pharmaceutical analysis methodology. The strategic design of electrode surfaces using nanomaterials like MXene/ZIF-8 composites and reduced graphite oxide nanosheets dramatically enhances detection sensitivity, selectivity, and reliability. These developments align with the broader research applications of cyclic voltammetry in characterizing redox-active compounds, studying electron transfer mechanisms, and developing quantitative analytical methods.
The experimental protocols outlined provide a framework for researchers to develop and optimize modified electrodes for specific antibiotic detection applications. The critical importance of proper electrode preparation, material characterization, and electrochemical optimization cannot be overstated, as these factors directly impact analytical performance. As research in this field continues to evolve, future developments will likely focus on multi-analyte detection platforms, miniaturized systems for point-of-care testing, and advanced materials with even greater specificity for target antibiotics.
For drug development professionals and quality control specialists, CV with modified electrodes offers a powerful complementary technique to traditional chromatographic methods, providing rapid, cost-effective analysis with minimal sample preparation. The continued refinement of these electrochemical sensors promises to enhance drug formulation analysis, environmental monitoring of pharmaceutical residues, and ultimately contribute to improved public health outcomes.
Cyclic Voltammetry (CV) is a fundamental electrochemical technique used to study the redox properties of materials, providing critical insights into their energy levels, reaction kinetics, and stability. In materials science, CV is indispensable for characterizing advanced materials such as conductive polymers and battery components, directly supporting the development of next-generation energy storage and conversion devices [1]. This guide details the experimental protocols and data analysis methods that enable researchers to extract quantitative performance metrics for these materials.
Core Principles and Key Analytical Parameters
Cyclic Voltammetry involves linearly cycling the potential of a working electrode in a solution containing the analyte and measuring the resulting current [12]. This produces a characteristic "duck-shaped" plot called a cyclic voltammogram, from which key parameters are derived [1].
For a reversible redox couple, the peak current (ip) is described by the Randles-Ševčík equation at 25°C [13] [12]: [i_p = (2.69 \times 10^5) n^{3/2} A C D^{1/2} v^{1/2}] where:
- (n) is the number of electrons transferred
- (A) is the electrode area (cm²)
- (C) is the concentration (mol/cm³)
- (D) is the diffusion coefficient (cm²/s)
- (v) is the scan rate (V/s)
A key indicator of a reversible, one-electron transfer process is a peak potential separation (ΔEp) of approximately 59 mV [13]. The electrochemically active surface area can be calculated from the peak current, while the half-wave potential (E1/2), calculated as the average of the anodic and cathodic peak potentials, approximates the formal potential of the redox couple [15].
Characterizing Conductive Polymers
Conductive polymers, such as polyaniline (PANI), polypyrrole (PPy), and poly(3,4-ethylenedioxythiophene) (PEDOT), possess conjugated backbones that enable electrical conductivity and redox activity [49] [50]. CV is used to determine their doping states, energy levels, and charge storage capabilities.
Experimental Protocol for Conductive Polymer Analysis
Electrode Preparation [50]:
- Substrate Cleaning: Polish a glassy carbon electrode (GCE) with a 0.3 μm alumina slurry. Wash and ultrasonicate in distilled water, then air-dry.
- Solution Preparation: Dissolve the conductive polymer (e.g., 50 mg) in an ink solvent (e.g., 10 ml of a 4:1:0.05 volume ratio of water, isopropanol, and polytetrafluoroethylene resin). Sonicate for 2 hours to ensure proper dispersion.
- Film Casting: Drop-cast a portion of the suspension onto the clean GCE surface and allow it to dry at ambient temperature.
CV Measurement Parameters [12] [15]:
- Electrolyte: 0.1 M to 1.0 M suitable salt (e.g., LiClO₄, TBAPF₆) in an aprotic solvent (e.g., acetonitrile).
- Potential Range: Scan through the polymer's oxidation and reduction waves. For example, PANI has an electrochemical window of about 1.0 V under acidic conditions [50].
- Scan Rate: Typically 20-200 mV/s for kinetic studies.
- Environment: Degas the solution with an inert gas (e.g., N₂) for ~10 minutes before measurement to remove oxygen [15].
Data Interpretation and Application
The cyclic voltammogram of a conductive polymer reveals its doping/dedoping processes and electronic structure. The onset potentials for oxidation and reduction correlate with the material's HOMO and LUMO energy levels, which is crucial for designing organic electronic devices [15]. The integrated charge under the redox peaks provides information about the polymer's charge storage capacity, relevant for supercapacitor applications [49]. CV also assesses the chemical reversibility of the redox reactions by examining the stability of the current response over multiple cycles, indicating the material's durability [15].
Diagram 1: Workflow for characterizing conductive polymers via CV, linking analysis to applications.
Analyzing Battery Component Materials
In battery research, CV is used to evaluate key parameters of electrode materials, including redox potentials, reaction kinetics, and cycling stability, and to study catalytic reactions in fuel cells.
Protocol for Evaluating Electrode Materials
The general protocol for conductive polymers applies. A specific example for a Ni-based catalyst is detailed below.
Case Study: Ni/Al-Carbonate Hydrotalcite (Ni-LDH) for Methanol Oxidation [14]
Synthesis & Electrode Preparation [14]:
- Material Synthesis: Synthesize Ni-LDH via co-precipitation. Slowly add a solution of Ni(NO₃)₂·6H₂O and Al(NO₃)₃·9H₂O to a Na₂CO₃ solution while maintaining pH at 10 with NaOH. Age the precipitate at 65°C for 24 hours, then filter, wash, and air-dry.
- Electrode Modification: Prepare a catalyst ink of the synthesized Ni-LDH. Drop-cast the ink onto a pre-polished and cleaned GCE to create an Ni-LDH-modified GCE (NLGC).
CV Measurement [14]:
- Electrolyte: Alkaline solution (e.g., pH 13).
- Potential Range: Scan through the Ni(II)/Ni(III) redox couple, typically between 0.2 V and 0.8 V vs. a reference electrode.
- Analysis: Identify the anodic peak (oxidation of Ni²⁺ to Ni³⁺) and cathodic peak (reduction of Ni³⁺ to Ni²⁺). The peak potential separation (ΔEp) indicates the reversibility of the redox process.
Data Interpretation and Application
For the Ni-LDH catalyst, the peaks at 0.62 V (anodic) and 0.42 V (cathodic) correspond to the quasi-reversible redox behavior of Ni(II)/Ni(III) centers [14]. The linear relationship between peak current and scan rate in the non-faradaic region suggests an adsorption-controlled process, while a square-root relationship indicates a diffusion-controlled reaction, such as the methanol oxidation reaction (MOR) [14]. The Tafel slope, which can be determined from chronoamperometry experiments, provides information about the reaction kinetics, with a value of 24.2 mV/decade confirming a one-electron redox process for MOR [14].
Diagram 2: Relationship between CV data, calculated parameters, and their significance in battery research.
The following tables consolidate key quantitative information from research on characterized materials.
Table 1: Key Electrochemical Parameters from CV of a Ni-LDH Catalyst for Methanol Oxidation [14]
| Parameter | Value | Significance |
|---|---|---|
| Anodic Peak Potential (Epa) | 0.62 V | Potential for Ni²⁺ to Ni³⁺ oxidation |
| Cathodic Peak Potential (Epc) | 0.42 V | Potential for Ni³⁺ to Ni²⁺ reduction |
| Peak Potential Separation (ΔEp) | ~0.20 V | Indicates quasi-reversible electron transfer |
| Onset Potential (MOR) | 5.2 V | Catalytic activity threshold for methanol oxidation |
| Tafel Slope | 24.2 mV/dec | Suggests a one-electron transfer process |
| Electrochemically Active Surface Area | 0.042 cm² | Measure of available catalytic sites |
Table 2: Performance of Selected Conductive Polymers in Energy Storage
| Polymer | Theoretical Capacity (mAh·g⁻¹) | Key Characteristics | Primary Applications |
|---|---|---|---|
| Polyaniline (PANI) - Leucoemeraldine Base (LB) | 197.2 (Reversible) [50] | High coulombic efficiency (98%), good rate performance [50] | Cathode material for Li-ion batteries [50] |
| Polyaniline (PANI) - General | ~295 (Theoretical) [50] | Remarkable redox properties, environmental stability [50] | Cathode candidate, conductive additive, binder [50] |
| PEDOT:PSS | N/A (Conductive additive/binder) | High conductivity, aqueous processability, used in flexible electronics [51] | Conductive agent, flexible current collectors [50] [51] |
Essential Research Reagents and Materials
A standardized set of materials is required to perform CV experiments for material characterization.
Table 3: Essential Research Reagent Solutions for CV Experiments
| Item | Function | Example Materials & Notes |
|---|---|---|
| Working Electrode | Surface where redox reaction of the sample occurs. | Glassy Carbon (GC), Platinum, Gold. GC is common for modified electrodes [14] [15]. |
| Reference Electrode | Provides a stable, known potential for the working electrode. | Saturated Calomel Electrode (SCE), Ag/AgCl [14]. |
| Counter Electrode | Completes the electrical circuit by balancing current from the working electrode. | Platinum wire or coil [14]. |
| Electrolyte Salt | Provides ionic conductivity in the solution. | LiClO₄, TBAPF₆ for non-aqueous systems; KOH, NaOH for aqueous systems [14]. |
| Solvent | Dissolves the electrolyte salt and analyte. | Acetonitrile (AN), Dimethylformamide (DMF) for non-aqueous; Water for aqueous systems. |
| Redox Active Material | The sample under investigation. | Conductive polymers (PANI, PPy), inorganic catalysts (Ni-LDH), organometallics (Ferrocene) [14] [50] [15]. |
| Conductive Additives/Binders | Used in electrode preparation to enhance conductivity and adhesion. | Carbon black, polyvinylidene fluoride (PVDF), PTFE resin [14] [50]. |
Cyclic Voltammetry remains a cornerstone technique for characterizing the electrochemical properties of conductive polymers and battery materials. By following standardized protocols and rigorously analyzing voltammetric data, researchers can effectively design and optimize materials for advanced energy applications. The integration of CV with other characterization methods and the adoption of emerging tools like machine learning for high-speed data regression will further accelerate innovation in this critical field [17].
Mastering Your CV Experiment: Troubleshooting Common Issues and Advanced Optimization Strategies
Cyclic Voltammetry (CV) is a cornerstone technique in electrochemical research, used extensively to probe the thermodynamics of redox processes, electron transfer kinetics, and energy levels of molecules [15] [1]. Its application is critical in fields ranging from drug development and material science to electrocatalysis and energy storage [5] [1]. A fundamental aspect governing the response in any voltammetric experiment is mass transport, the process by which electroactive species move to and from the electrode surface. The observed current is a direct consequence of the electron transfer that occurs only with molecules that have successfully reached the electrode interface. Therefore, understanding and controlling mass transport is not merely a technical detail but a prerequisite for accurate data interpretation, particularly in complex research environments like drug-DNA interaction studies or confined electrocatalysis [52] [5].
Traditionally, the theoretical framework for interpreting CV data has relied on models based on semi-infinite linear diffusion [52]. This model assumes an unrestricted, large volume of solution where the diffusion layer can grow indefinitely during the experiment. However, many modern research applications, including those involving microelectrodes, porous materials, or biological cells, violate this assumption. These systems operate under finite diffusion (FD) conditions, where spatial restrictions impose a limit on the thickness of the diffusion field, dramatically altering the voltammetric response [43] [52]. This guide delves into the critical distinction between finite and unbounded diffusion regimes, providing researchers with the knowledge to identify, analyze, and leverage these effects within the broader context of their investigative work.
Theoretical Foundations of Diffusion Regimes
Defining Finite and Unbounded Diffusion
In electrochemical systems, the diffusion regime is defined by the physical boundaries of the solution domain and the conditions at those boundaries.
Finite Diffusion (FD) occurs when the diffusion of electroactive species is restricted within a domain of finite thickness, L [43] [52]. This is a common scenario in thin-layer cells, porous electrode structures, or nanoporous environments. Within FD, two distinct configurations are recognized:
- Bounded Diffusion: In this mode, no mass renovation is permitted at the boundary located a finite distance, L, from the electrode [43] [52]. The total amount of electroactive species within the cell is fixed, leading to complete depletion or saturation under sustained electrolysis.
- Unbounded Diffusion: This configuration also exists within a finite domain of thickness L, but it features a fast and effective mass renovation (replenishment) at the boundary [43] [52]. This acts as a reservoir, mimicking some aspects of semi-infinite diffusion but within a confined space.
Semi-Infinite Linear Diffusion is the classical model where the diffusion layer can grow without any restriction for the duration of the experiment. It assumes a large, effectively infinite, volume of solution [15].
The distinction between these regimes has profound implications. Under bounded finite diffusion, the diffusive flux decays more rapidly as the domain thickness L decreases, directly reducing the current [52]. Conversely, unbounded finite conditions can enhance the current above what is expected in a truly semi-infinite model because the fixed boundary facilitates a steeper concentration gradient [43].
Impact on Voltammetric Response
The diffusion regime directly shapes the cyclic voltammogram. Key diagnostic features change as follows:
- Peak Current and Shape: In a reversible system under semi-infinite diffusion, the peak current (ip) scales linearly with the square root of the scan rate (v^(1/2)), as described by the Randles-Ševčík equation [1]. Under thin-layer (bounded finite) conditions, the voltammetric peaks become sharper, and the current eventually scales linearly with the scan rate (v) itself, as the entire confined volume of reactant is electrolyzed [43].
- Peak Separation: For a reversible, Nernstian system under semi-infinite diffusion, the peak potential separation (ΔEp) is a constant 59.2/n mV at 25°C [13]. In finite diffusion cells, this value can deviate, and under ideal thin-layer conditions, the peaks can collapse into a symmetrical, peak-shaped curve with negligible separation.
- Current Decay: After the peak, the current in a semi-infinite system decays in a characteristic Cottrell-like (t^(-1/2)) manner. In a bounded finite system, the current decays much more rapidly as the reactant pool is exhausted.
Table 1: Comparison of Key Features in Different Diffusion Regimes for a Reversible Redox Couple
| Feature | Semi-Infinite Diffusion | Bounded Finite Diffusion | Unbounded Finite Diffusion |
|---|---|---|---|
| Domain Size | Unrestricted | Restricted thickness (L) | Restricted thickness (L) |
| Boundary Condition | No boundary | No mass flux at boundary | Concentration maintained at boundary |
| Peak Current (ip) Scaling | ip ∝ v^(1/2) | ip ∝ v (at slow scan rates) | Enhanced vs. bounded; depends on L |
| Peak Separation (ΔEp) | ~59/n mV | Approaches zero in thin-layer limit | Variable, sensitive to L and kinetics |
| Primary Application | Standard solution studies | Thin-layer cells, confined spaces | Systems with forced convection or renewal |
Finite Diffusion in Modern Research Contexts
Molecular Electrocatalysis in Confined Spaces
The study of molecular electrocatalysis is increasingly focused on confined environments, which are relevant to electrosynthesis, fuel cells, and electroanalysis [52]. Traditional catalytic models based on semi-infinite diffusion fail in these settings. A 2025 study highlights that for catalytic processes, the response in finite diffusion is governed by the interplay between the diffusion layer thickness (L) and the catalytic rate constant [52].
- Bounded Catalysis: Under bounded diffusion, the catalytic current decreases as the domain thickness L is reduced. This is because the confined space limits the supply of substrate available for the catalytic reaction.
- Unbounded Catalysis: In unbounded finite diffusion, the catalytic current is enhanced and can even become independent of kinetics for very small L, as mass transport becomes extremely efficient [52]. This has been demonstrated experimentally in the mediated oxidation of isopropyl alcohol to acetone, where the accurate determination of the catalytic rate constant depended entirely on using the correct finite diffusion model [52].
Electroanalysis and Drug Development
CV is a powerful tool in pharmaceutical research for characterizing the redox properties of drug molecules and their interactions with biological targets like DNA [53] [5]. Mass transport effects are critical here. When a drug molecule, such as the anticancer agent Doxorubicin, intercalates into DNA, its diffusion coefficient drops significantly due to the increased hydrodynamic radius of the complex [5]. This leads to a measurable decrease in the voltammetric peak current, which can be used to quantify the binding [5]. Understanding this within a finite diffusion framework is essential when using miniaturized sensors or when the interaction occurs in a restricted microenvironment, such as at a cell membrane or within a porous tissue scaffold. The ability to approximate energy levels and study electron transfer mechanisms with CV makes it indispensable for understanding a drug's mechanism of action at a molecular level [5] [15].
Experimental Protocols and Methodologies
Implementing Finite Diffusion Cells
To experimentally study finite diffusion effects, researchers can configure electrochemical cells to operate under bounded or unbounded conditions.
Protocol A: Bounded Diffusion Cell
- Cell Design: Utilize a thin-layer cell (TLC) where the working electrode is positioned very close (micrometers) to an impermeable wall or a second electrode, creating a solution cavity of well-defined, small volume [43].
- Preparation: Fill the cell with a deoxygenated solution containing the redox probe (e.g., 1 mM potassium ferricyanide in buffer).
- Data Acquisition: Perform Cyclic Staircase Voltammetry (CSCV) or CV across a range of slow scan rates (e.g., 1-20 mV/s) [43]. The use of CSCV is emphasized as it is the actual technique implemented by digital potentiostats [43].
- Analysis: Analyze the charge under the peak (Q), which is directly proportional to the total concentration of electroactive species in the confined volume [43]. Observe the transition from a peak-shaped voltammogram to a sigmoidal steady-state shape as the confinement increases.
Protocol B: Unbounded Diffusion Cell
- Cell Design: A cell where a fast flow of solution or a convective element is introduced at a fixed distance L from the electrode. A rotating disk electrode (RDE) can be conceptually considered a system with a hydrodynamically defined diffusion layer thickness.
- Preparation: Use the same solution as in Protocol A.
- Data Acquisition: Perform CSCV/CV while maintaining the convective flow or rotation speed constant.
- Analysis: The current response will be enhanced compared to a stagnant bounded cell. The effective thickness L can be extracted by fitting the current-potential response to the analytical models for unbounded finite diffusion [43].
The Scientist's Toolkit: Essential Research Reagents and Materials
Table 2: Key Research Reagent Solutions and Materials for Finite Diffusion Studies
| Item | Function/Description | Research Application |
|---|---|---|
| Fast Redox Probes (e.g., Ferrocene, Potassium Ferricyanide) | Well-behaved, reversible redox couples with fast electron transfer kinetics. | Model systems for validating experimental setup and theoretical models [43] [1]. |
| Pencil Graphite Electrode (PGE) | A disposable, reproducible carbon-based working electrode. | Ideal for electroanalysis of drugs (e.g., Doxorubicin) and biomolecules, minimizing fouling [53]. |
| Glassy Carbon Electrode (GCE) | A versatile, polished solid electrode with a well-defined surface. | Standard electrode for fundamental studies in electrocatalysis and analysis [52] [5]. |
| Thin-Layer Electrochemical Cell | A cell designed with a microscopic gap between the working electrode and a counter surface. | Creating a well-defined bounded finite diffusion environment [43]. |
| Molecular Electrocatalysts (e.g., 4-Methoxy-TEMPO) | Mediators that shuttle electrons between the electrode and a substrate. | Studying catalytic mechanisms and rates under confinement, e.g., alcohol oxidation [52]. |
Data Analysis and Visualization
Analyzing Current and Charge Responses
A significant advancement in finite diffusion analysis is the reporting of both current-potential and charge-potential responses [43]. The converted charge (Q) is directly proportional to the concentration of the electroactive species and can be measured with high reliability, offering a complementary and sometimes more robust analytical parameter than current alone [43].
For a reversible system under thin-layer (bounded) conditions, the peak current is given by: ip = (n²F² / 4RT) * v * V * C
Where n is the number of electrons, F is Faraday's constant, v is scan rate (V/s), V is the volume of the thin-layer cell, and C is the concentration (mol/cm³). The charge, Q, is simply nFVC. Analytical models now allow for the extraction of the diffusion layer thickness L by fitting experimental CSCV or CV data to the derived equations for both bounded and unbounded cases [43].
Workflow for Diagnostic Analysis
The following diagram illustrates a logical workflow for diagnosing mass transport regimes and analyzing finite diffusion effects from experimental data.
Diagram: Diagnostic Workflow for Mass Transport Regimes
Advanced Considerations and Recent Developments
Recent research emphasizes that Cyclic Staircase Voltammetry (CSCV) is the true technique implemented by digital potentiostats, and the latest theoretical models have been developed specifically for CSCV responses under finite diffusion, closing a previous gap in the literature [43]. This allows for more accurate parameter estimation without the need to approximate CSCV as analog CV.
Furthermore, the analysis of more complex reactions, such as electrocatalytic mechanisms, under finite diffusion has been formalized. Kinetic zone diagrams have been developed that map out the limiting behaviors of catalytic systems based on two key variables: the ratio of the diffusion layer thickness to the reaction layer (related to the catalytic rate constant) and the type of finite diffusion (bounded/unbounded) [52]. This provides a powerful framework for diagnosing and optimizing catalytic processes in confined spaces, which is crucial for developing more efficient energy conversion and electrosynthesis technologies.
A deep understanding of mass transport effects, particularly the distinctions between finite and unbounded diffusion regimes, is no longer a niche concern but a central requirement for advanced research using cyclic voltammetry. As electrochemical applications expand into confined spaces, nanomaterials, and complex biological environments, the traditional model of semi-infinite diffusion becomes insufficient. The latest theoretical advances, providing analytical solutions for both current and charge responses in CSCV and CV under finite diffusion, equip researchers with more precise tools. By correctly applying these principles and protocols, scientists and drug development professionals can extract more accurate kinetic and thermodynamic parameters, leading to a better fundamental understanding of reaction mechanisms and more reliable analytical data in fields from molecular electrocatalysis to pharmaceutical analysis.
Cyclic voltammetry (CV) is a cornerstone electrochemical technique used to study redox processes, reaction kinetics, and mechanisms in research. This powerful method involves ramping the potential of a working electrode linearly with time and then reversing the direction to return to the initial potential, creating cyclical potential sweeps. The resulting plot of current versus potential, known as a cyclic voltammogram, provides a wealth of information about the electrochemical properties of the system under investigation [34]. Within the broader context of its research applications, one of CV's most critical capabilities lies in characterizing fundamental charge transfer mechanisms—specifically, distinguishing between processes controlled by reactant adsorption onto the electrode surface versus those governed by mass transport through diffusion.
This technical guide examines how systematic variation of scan rate serves as an essential diagnostic tool for identifying these mechanisms. The principles discussed find application across diverse fields including electrocatalyst development, energy storage systems, and electrochemical sensing, where understanding interfacial processes is crucial for optimizing material performance and reaction efficiency [14] [54].
Theoretical Foundation
Fundamental Principles of Cyclic Voltammetry
In cyclic voltammetry, the potential applied to the working electrode follows a triangular waveform, changing at a constant rate known as the scan rate (ν), measured in V/s [55]. The resulting current response reveals whether redox-active species are in solution or adsorbed onto the electrode surface [55]. For a reversible system with diffusing species, the peak current (ip) is proportional to the square root of the scan rate, as described by the Randles-Ševčík equation [34]. Conversely, for surface-confined species, the peak current varies linearly with scan rate [34].
The electric double layer at the electrode-solution interface significantly influences non-faradaic processes. When a redox reaction occurs, the current is governed by either electron transfer kinetics at the electrode surface or the rate at which reactants reach the surface through diffusion [56]. This distinction forms the basis for differentiating adsorption from diffusion control.
Adsorption-Controlled Processes
In adsorption-controlled (or surface-confined) processes, electroactive species are directly attached to the electrode surface prior to electron transfer. The current response arises from the redox switching of these immobilized species rather than from molecules diffusing from bulk solution [56]. The current-potential relationship for such systems can be described by:
[ i = \frac{n^2F^2}{4RT} \nu A \Gamma ]
where n is the number of electrons transferred, F is Faraday's constant, A is the electrode surface area, and Γ is the surface coverage of the electroactive species (mol cm⁻²) [14]. This equation highlights the direct proportionality between peak current and scan rate, which serves as a key diagnostic criterion for surface-confined processes [14].
Diffusion-Controlled Processes
Diffusion-controlled processes occur when electroactive species in solution undergo reduction or oxidation at the electrode surface. The current is limited by the rate of mass transport from bulk solution to the electrode interface [34]. As the potential is scanned, a diffusion layer develops where concentration gradients form, leading to the characteristic peak-shaped voltammograms.
The Randles-Ševčík equation quantitatively describes the peak current for diffusion-controlled systems:
[ i_p = 0.4463 \ n F A C \left( \frac{n F \nu D}{R T} \right)^{1/2} ]
where C is the bulk concentration (mol cm⁻³) and D is the diffusion coefficient (cm² s⁻¹) [34]. The square root dependence on scan rate distinguishes diffusion-controlled processes from adsorption-controlled ones.
Mixed-Control Systems
Many real-world systems exhibit mixed behavior, incorporating both adsorption and diffusion elements. For instance, in electrocatalysis, a reactant might first adsorb onto the catalyst surface before undergoing electron transfer, with subsequent steps potentially limited by diffusion [14]. The Ni/Al-carbonate hydrotalcite system for methanol oxidation demonstrates such hybrid behavior, showing linear peak current dependence on scan rate at lower ranges (indicating adsorption) and square root dependence at higher scan rates (indicating diffusion control) [14].
Diagnostic Criteria and Data Analysis
Current-Scan Rate Relationships
The relationship between peak current (ip) and scan rate (ν) provides the most definitive diagnostic tool for distinguishing between adsorption and diffusion control. Systematic variation of scan rate across multiple orders of magnitude (typically 0.01-10 V/s) enables mechanism determination through power law analysis.
Table 1: Diagnostic Criteria from Scan Rate Dependence
| Process Type | Current-Scan Rate Relationship | Peak Shape | Peak Separation (ΔEp) | Key Diagnostic Plot |
|---|---|---|---|---|
| Adsorption-Controlled | ip ∝ ν (linear) | Symmetric, narrow width | Approaches 0 mV for ideal Nernstian systems | ip vs ν → linear |
| Diffusion-Controlled | ip ∝ ν^(1/2) (square root) | Asymmetric, wider peaks | ~57/n mV for reversible systems | ip vs ν^(1/2) → linear |
| Mixed-Control | Combined dependence | Variable | Dependent on kinetics | Requires more detailed analysis |
For adsorption-controlled processes, a plot of peak current versus scan rate yields a straight line, while for diffusion-controlled processes, a plot of peak current versus the square root of scan rate is linear [14] [34]. Intermediate behavior suggests quasi-reversible systems or mixed control mechanisms.
Additional Diagnostic Parameters
Beyond current-scan rate relationships, several additional parameters aid in mechanism identification:
Peak potential shift: In adsorption-controlled systems, peak potentials typically remain constant with changing scan rate. For diffusion-controlled irreversible systems, peak potentials shift with scan rate according to: [ E_p = E^\circ - \frac{RT}{\alpha nF} \left[ 0.780 - \ln \left( \frac{k^\circ}{\sqrt{D}} \right) + \ln \left( \sqrt{ \frac{\alpha nF \nu}{RT} } \right) \right] ] where α is the charge transfer coefficient and k° is the standard rate constant.
Peak width: For ideal Nernstian surface-confined systems, the peak width at half-height is approximately 90.6/n mV [34].
Peak separation: The difference between anodic and cathodic peak potentials (ΔEp) approaches zero for highly reversible adsorption systems but remains around 57/n mV for diffusion-controlled reversible processes [34].
Experimental Protocols
Methodology for Scan Rate Studies
To properly differentiate between adsorption and diffusion control, researchers should implement the following systematic protocol:
Electrode Preparation: Begin with meticulous electrode surface preparation. For glassy carbon electrodes, polish with 0.3 μm alumina slurry, rinse with distilled water, and sonicate to remove adsorbed particles [14]. For modified electrodes, ensure consistent film deposition through controlled methods like drop-casting [14].
Preliminary CV Characterization: Perform initial cyclic voltammetry across the relevant potential window to identify redox features of interest. Use a moderate scan rate (e.g., 0.1 V/s) for this initial assessment.
Systematic Scan Rate Variation: Collect CV data across a wide range of scan rates, typically from 0.01 to 10 V/s or wider if possible. Ensure the electrode surface remains unchanged throughout the experiment by checking reproducibility at a reference scan rate.
Background Subtraction: Record background voltammograms in supporting electrolyte alone and subtract from sample voltammograms to isolate faradaic currents [15]. This is particularly important for accurate peak current measurements at fast scan rates where charging currents become significant.
Data Analysis: Measure peak currents and potentials from background-subtracted voltammograms. Plot anodic and cathodic peak currents versus scan rate and square root of scan rate to determine the governing relationship.
Case Study: Ni-LDH Modified Electrode for Methanol Oxidation
A representative experiment from recent literature illustrates this approach [14]:
Electrode Modification: Ni/Al-carbonate hydrotalcite (Ni-LDH) was synthesized via co-precipitation and deposited on a glassy carbon electrode (NLGC)[ccitation:1].
Electrochemical Testing: CV was performed in 0.1 M NaOH with 0.5 M methanol between 0.1-0.7 V vs. SCE at scan rates from 0.01-0.30 V/s [14].
Results: The anodic peak current showed linear dependence on scan rate in the lower range (0.1-0.3 V/s), indicating an adsorption-controlled process involving the NiII-(OH)2/NiIII-OOH redox couple. At higher scan rates, square root dependence emerged, indicating a shift to diffusion-controlled methanol oxidation [14].
Analysis: The electrochemically active surface area was calculated to be 0.042 cm² based on the adsorption-controlled response [14].
Advanced Technique: Analysis of Adsorption-Related Voltammograms
For complex systems, a more sophisticated approach involves transforming adsorption-related voltammograms to potential-program invariant forms [57]. This method calculates scan rate-independent, hysteresis-free functions from CV data collected at multiple scan rates:
- One function characterizes adsorption kinetics at zero surface coverage
- The second function represents the adsorption isotherm
This approach is also applicable to surface-confined redox systems and enables more accurate determination of adsorption rates [57].
Research Applications and Case Studies
Electrocatalyst Development
In electrocatalyst research, CV scan rate studies help elucidate reaction mechanisms and active site utilization. The Ni/Al-carbonate hydrotalcite system for methanol oxidation demonstrates how scan rate analysis reveals dual mechanisms: adsorption control at lower scan rates versus diffusion control at higher scan rates [14]. This insight is crucial for optimizing catalyst structure—in this case, the brucite-like layers that enhance charge transport [14].
For oxygen reduction reaction (ORR) studies on gold ultramicroelectrodes, rapid scan cyclic voltammetry (RSCV) at varying rates enables detection and quantification of transient intermediates like hydroperoxide (HO₂⁻) [58]. Scan rate adjustments can intentionally alter reaction pathways, highlighting the method's utility in mechanistic electrocatalysis [58].
Energy Storage Materials
In supercapacitor development, scan rate analysis distinguishes surface capacitance from diffusion-limited processes. For TiO₂/Carbon/MoS₂ hybrid materials, scan rate studies revealed a significant diffusion-controlled contribution (82%) to the total capacitance, explaining the high specific capacitance of 436 F/g at 5 mV/s [54]. This diffusion-dominated behavior contrasts with typical electric double-layer capacitors and informs material design strategies for enhanced energy density [54].
Table 2: Scan Rate Dependence in Different Application Areas
| Application Field | Typical System | Predominant Control Mechanism | Key Insights from Scan Rate Studies |
|---|---|---|---|
| Electrocatalysis | Ni-LDH for methanol oxidation | Mixed: Adsorption at low ν, Diffusion at high ν | Revealed NiII-(OH)2/NiIII-OOH redox mediation [14] |
| Supercapacitors | TiO₂/C/MoS₂ hybrid | Predominantly diffusion-controlled (82%) | High capacitance attributed to bulk utilization [54] |
| Sensor Development | Ti-Ni-CNF for estradiol/dopamine | Adsorption-controlled | Increased CNF length enhanced adsorption sites and sensitivity [59] |
| Battery Research | Pulse nitrate electroreduction | Intermediate adsorption configuration | Pulsed electrolysis optimized *NO adsorption geometry [60] |
Sensor Development
In electrochemical sensing, adsorption control is often desirable for sensitive and reproducible detection. For co-detection of estradiol and dopamine on Ti-Ni-carbon nanofiber electrodes, both analytes exhibited adsorption-controlled oxidation [59]. Scan rate studies confirmed the linear relationship between peak current and scan rate, enabling optimization of nanofiber length to increase adsorption sites and improve sensitivity [59].
Battery and Fuel Cell Research
In battery material characterization, CV scan rate studies help identify rate-limiting steps. For pulsed nitrate electroreduction on Cu catalysts, scan rate analysis complemented potential pulse techniques to optimize intermediate adsorption configurations [60]. The combination revealed transitions in *NO adsorption geometry from top-bound to side-on configurations, significantly enhancing ammonia formation efficiency [60].
The Scientist's Toolkit
Essential Research Reagent Solutions
Table 3: Key Reagents and Materials for Scan Rate Studies
| Reagent/Material | Function/Application | Example Specifications |
|---|---|---|
| Supporting Electrolyte | Provides conductivity, minimizes iR drop | 0.1-1.0 M alkali metal perchlorates/nitrates (aqueous) or tetrabutylammonium hexafluorophosphate (nonaqueous) [34] |
| Electrode Polishing Supplies | Maintain reproducible electrode surface | 0.3 μm alumina slurry, 0.05 μm alumina suspension [14] [58] |
| Redox Probes | System validation and surface area determination | 1-5 mM Ferrocene (nonaqueous) or Potassium ferricyanide (aqueous) |
| Surface Modification Agents | Electrode functionalization | Ni-Al hydrotalcite synthesis: Ni(NO₃)₂·6H₂O (0.75 mol) + Al(NO₃)₃·9H₂O (0.25 mol) in Na₂CO₃/NaOH solution at pH 10 [14] |
| Purging Gases | Remove dissolved oxygen | High-purity Nitrogen or Argon, bubbled for 10-15 minutes prior to measurements [59] |
Instrumentation Considerations
Proper instrument selection and configuration are crucial for reliable scan rate studies:
Potentiostat Selection: Choose a potentiostat with appropriate current ranges and scan rate capabilities. For very fast scan rates (>100 V/s), specialized instruments with high slew rates are necessary [58].
Electrode Configuration: Standard three-electrode systems with working, reference, and counter electrodes are essential. For fast scan rate experiments, ultramicroelectrodes (UMEs) minimize iR drop and charging currents [58].
Cell Design: Use electrochemical cells with precise electrode positioning to ensure reproducible geometry. For nonaqueous systems, ensure airtight seals to prevent solvent evaporation or atmospheric contamination.
Diagnostic Workflow Visualization
The following diagram illustrates the systematic approach for distinguishing between adsorption and diffusion control through scan rate studies:
Diagnostic Workflow for CV Scan Rate Studies illustrates the decision process for identifying the dominant control mechanism in electrochemical systems.
Scan rate variation in cyclic voltammetry provides critical insights into the fundamental mechanisms governing electrochemical processes. The distinction between adsorption-controlled and diffusion-controlled systems has profound implications for research across electrocatalysis, energy storage, sensor development, and beyond. By systematically applying the diagnostic criteria and experimental protocols outlined in this guide, researchers can accurately characterize interfacial processes, optimize material designs, and elucidate complex reaction mechanisms. As electrochemical techniques continue to evolve, the foundational principles of scan rate analysis remain essential for advancing our understanding of charge transfer phenomena at electrode interfaces.
Leveraging Machine Learning for High-Speed Regression of Kinetic Parameters
Cyclic Voltammetry (CV) is a fundamental and ubiquitous electrochemical technique used to study the redox properties of chemical species, providing critical insights into electron transfer processes during oxidation and reduction reactions [2]. In this technique, the potential applied to a working electrode is swept linearly between set limits and then back, while the resulting current is measured [12]. The primary output, a voltammogram (a plot of current versus potential), serves as an electrochemical fingerprint, offering both qualitative and quantitative information about the system under investigation [30] [2]. The widespread adoption of CV extends across numerous research fields, including analytical chemistry, materials science, drug development, and fundamental electrochemistry, where it is employed for tasks ranging from sensor evaluation and catalyst characterization to the study of biological systems [12] [2].
The core of CV analysis lies in interpreting key voltammetric features—peak potentials (Eₚ), peak currents (iₚ), and their separation—to extract kinetic and thermodynamic parameters [13]. For a simple, reversible one-electron transfer process, the peak-to-peak separation (ΔEₚ) is approximately 59 mV at 25°C [13]. The peak current is quantitatively described by the Randles-Ševčík equation [12]: iₚ = (2.69 × 10⁵) n³/² A C D¹/² ν¹/² where n is the number of electrons, A is the electrode area, C is the concentration, D is the diffusion coefficient, and ν is the scan rate [12] [2]. However, real-world systems often exhibit quasi-reversible or irreversible behavior due to slow electron transfer kinetics or follow-up chemical reactions, complicating parameter extraction [30] [13]. Traditional regression of kinetic parameters like the standard rate constant (k°) requires computationally intensive simulations and fitting procedures, which can take over 3000 seconds per analysis, creating a significant bottleneck in high-throughput research environments [17].
The Machine Learning Paradigm for CV Analysis
A groundbreaking approach to this challenge leverages Machine Learning (ML), specifically Convolutional Neural Networks (CNNs), to achieve high-speed regression of kinetic parameters from cyclic voltammograms [17]. Inspired by the ability of expert electrochemists to rapidly interpret CVs based on their shape, this data-driven method treats the voltammogram as an image pattern. The CNN model is trained to recognize the complex, non-linear relationships between the shape of the voltammogram and the underlying kinetic parameters, bypassing the need to solve the governing differential equations explicitly [17].
This ML framework offers transformative advantages. Once trained, the model can regress both the kinetic rate constant (k°) and the charge transfer coefficient (α) in a few milliseconds—a speed increase of over six orders of magnitude compared to conventional optimization protocols [17]. This performance is achieved with high accuracy, demonstrated by a 93.6% cross-validation accuracy in published studies [17]. This capability is particularly valuable for laboratory automation and high-throughput experimentation in fields like electrocatalyst discovery and pharmaceutical development, where rapid electrochemical characterization is paramount.
Comparative Analysis: Traditional vs. ML-Enhanced CV Workflows
Table 1: Comparison of Traditional and ML-Based Approaches for CV Parameter Regression
| Feature | Traditional Simulation & Fitting | ML-Based Regression |
|---|---|---|
| Theoretical Basis | Solves partial differential equations for mass transport and electron transfer [30] | Learns patterns from large datasets of simulated or experimental CVs [17] |
| Computational Time | >3000 seconds per analysis [17] | ~Milliseconds per analysis [17] |
| Primary Outputs | Kinetic rate constant (k°), transfer coefficient (α) [30] | Kinetic rate constant (k°), transfer coefficient (α) [17] |
| Automation Suitability | Low, due to slow processing speed | High, enabling real-time analysis and decision-making [17] |
| Key Tool Example | CV Fit in EC-Lab software [30] | Custom Convolutional Neural Networks [17] |
Experimental Protocols for CV and ML Integration
Foundational Cyclic Voltammetry Methodology
The reliability of any subsequent ML analysis is contingent on the quality of the initial experimental CV data. The following protocol outlines a standardized procedure for acquiring robust voltammograms, synthesized from established electrochemical practices [15] [12].
Electrochemical Cell Setup: A standard three-electrode system is employed. The working electrode (e.g., glassy carbon, platinum) is where the redox reaction of interest occurs. The reference electrode (e.g., Ag/AgCl, saturated calomel) provides a stable potential reference, and the counter electrode (e.g., platinum wire) completes the circuit [15] [2]. The cell is filled with an electrolyte solution containing the analyte, typically degassed with an inert gas (e.g., N₂) for ~10 minutes to remove dissolved oxygen, which can interfere with measurements [15].
Electrode Modification (For Catalyst Studies): In studies of novel materials, such as the Ni/Al-carbonate hydrotalcite (Ni-LDH) catalyst for methanol oxidation, the working electrode is often modified [14]. A clean glassy carbon electrode is polished with alumina slurry, washed, and ultrasonicated. A colloidal suspension of the catalyst (e.g., Ni-LDH in water-isopropanol) is then drop-cast onto the electrode surface and allowed to dry at ambient temperature [14].
Instrumental Parameters and Data Acquisition: Using a potentiostat, the potential is swept between predefined initial and vertex potentials. The scan rate (ν) is a critical parameter, typically varied from 0.01 to 1 V/s for conventional electrodes [30]. Multiple cycles are often run to ensure signal stability. The potentiostat records the current response as a function of the applied potential, generating the raw voltammogram [12].
Machine Learning Model Implementation
The protocol for implementing the ML regression model, as demonstrated in recent high-speed applications, involves the following steps [17]:
Dataset Generation: A large and diverse training set is created by simulating thousands of cyclic voltammograms across a wide range of kinetic parameters (k°, α) and experimental conditions (e.g., scan rates) using traditional simulation tools that solve the governing differential equations [17] [30].
Model Architecture and Training: A Convolutional Neural Network (CNN), akin to those used in image recognition, is designed. The network's input is the voltammogram (effectively a 1D "image"), and its outputs are the continuous values for k° and α. The model is trained on the simulated dataset, learning to map the complex shapes of the voltammograms to the underlying kinetic parameters [17].
Validation and Deployment: The model's performance is rigorously validated using a hold-out test set of simulated data and, where possible, with benchmark experimental systems. After validation, the model is deployed for analysis. A new, experimental voltammogram is preprocessed and fed into the trained CNN, which outputs the regressed kinetic parameters in milliseconds [17].
Research Reagent Solutions and Essential Materials
Table 2: Essential Materials and Reagents for Electrocatalytic CV Studies
| Item | Function / Description | Example from Literature |
|---|---|---|
| Working Electrode | Surface where the redox reaction occurs; often modified with catalyst material. | Glassy Carbon Electrode (GCE) [14] |
| Reference Electrode | Provides a stable, known potential for the electrochemical cell. | Saturated Calomel Electrode (SCE) [14] |
| Counter Electrode | Completes the electrical circuit, allowing current to flow. | Platinum Wire [14] |
| Electrolyte Salt | Provides ionic conductivity in the solution. | Alkaline solution (e.g., NaOH, pH 13) [14] |
| Electrocatalyst Material | Substance that lowers the activation energy for the reaction of interest. | Ni/Al-carbonate Layered Double Hydroxide (Ni-LDH) [14] |
| Redox Probe / Analyte | The molecule whose electrochemical properties are being studied. | Methanol (for Methanol Oxidation Reaction studies) [14] |
| Solvents | Used to prepare solutions and clean electrodes. | Deionized Water, Isopropanol [14] |
Data Presentation and Kinetic Parameter Analysis
The transition from raw voltammograms to quantitative kinetic insights is the central goal of CV analysis. The tables below summarize the key parameters and relationships used in both traditional and ML-enhanced analyses.
Key Voltammetric Parameters for Kinetic Analysis
Table 3: Fundamental Parameters Extracted from a Cyclic Voltammogram
| Parameter | Symbol | Definition & Kinetic Significance |
|---|---|---|
| Anodic Peak Potential | Eₚₐ | Potential at the maximum current during oxidation. Shifts with slow kinetics [13]. |
| Cathodic Peak Potential | Eₚ꜀ | Potential at the maximum current during reduction. Shifts with slow kinetics [13]. |
| Peak Potential Separation | ΔEₚ = Eₚₐ - Eₚ꜀ | Indicator of electron transfer reversibility. >59/n mV indicates quasi-reversibility [13]. |
| Anodic Peak Current | iₚₐ | Maximum current during the oxidative scan. Related to concentration and diffusion [2]. |
| Cathodic Peak Current | iₚ꜀ | Maximum current during the reductive scan. Ratio iₚₐ/iₚ꜀ indicates chemical reversibility [13]. |
| Half-Wave Potential | E₁/₂ ≈ (Eₚₐ + Eₚ꜀)/2 | Approximates the formal potential (E°') of the redox couple for reversible systems [15] [13]. |
Case Study: Quantitative Analysis of Ni-LDH Catalysis
Recent research on Ni/Al-carbonate hydrotalcite (Ni-LDH) for methanol oxidation provides a concrete example of kinetic parameter extraction. The study employed a suite of electrochemical techniques to fully characterize the catalyst [14].
Table 4: Experimental Kinetic Data for Ni-LDH Modified Electrode from Literature
| Parameter | Value | Technique / Notes |
|---|---|---|
| Anodic Peak Potential | 0.62 V (vs. SCE) | Cyclic Voltammetry, corresponds to Ni(II) to Ni(III) oxidation [14]. |
| Cathodic Peak Potential | 0.42 V (vs. SCE) | Cyclic Voltammetry, corresponds to Ni(III) to Ni(II) reduction [14]. |
| Onset Potential (MOR) | 5.2 V | Linear Sweep Voltammetry, potential where methanol oxidation begins [14]. |
| Tafel Slope | 24.2 mV/dec | Chronoamperometry, indicates the mechanism and rate-determining step [14]. |
| Electroactive Surface Area | 0.042 cm² | Calculated from CV data in the non-faradaic region [14]. |
In this study, the linear correlation of peak current with scan rate indicated an adsorption-controlled process for the NiII-(OH)₂/NiIII-OOH redox couple, while a square-root relationship confirmed a diffusion-controlled process for the overall methanol oxidation reaction (MOR) [14]. The hysteresis and peak shifts in the voltammogram highlighted efficient charge transport through the catalyst's brucite layer [14]. Analyzing such complex, multi-mechanism data is a task well-suited for ML models, which can deconvolute these overlapping contributions to provide a more refined kinetic picture.
The integration of Machine Learning with Cyclic Voltammetry marks a significant leap forward for electrochemical research and development. By reducing the time required to regress kinetic parameters from thousands of seconds to a few milliseconds, ML addresses a critical bottleneck, thereby enabling high-throughput experimentation [17]. This advancement is poised to accelerate discovery cycles in diverse fields, from the development of novel electrocatalysts for fuel cells—exemplified by the detailed kinetic study of Ni-LDH [14]—to the rapid screening of redox-active drug compounds in pharmaceutical development.
While traditional CV analysis, grounded in physical simulations, remains essential for validating mechanisms and understanding fundamental principles, the future of routine electrochemical characterization is undoubtedly data-driven. The synergy between robust experimental protocols, which yield high-quality voltammograms, and powerful ML models, which extract hidden information at unprecedented speeds, creates a powerful toolkit for researchers and scientists. This paradigm shift towards high-speed, automated electrochemical analysis will not only increase laboratory efficiency but also open new avenues for exploring complex electrochemical systems that were previously too time-consuming to analyze in depth.
Cyclic Voltammetry (CV) is a cornerstone technique in electrochemical research, used to study redox properties, reaction kinetics, and charge transfer processes. Its applications span from characterizing novel catalysts for fuel cells to sensing neurotransmitters in the brain. However, the fidelity of CV data is often compromised by a common issue: uncompensated resistance (iR drop). This technical guide explores the practical aspects of iR compensation and experimental configuration to ensure accurate and quantitative results, a concern critical to researchers and drug development professionals who rely on precise electrochemical measurements [61] [2].
Understanding the Origin and Impact of iR Error
In an ideal three-electrode potentiostat setup, the potential is perfectly controlled at the working electrode interface. In reality, the solution between the reference electrode tip and the working electrode has a finite resistance, Ru. When current (Icell) flows, Ohm's law dictates a voltage drop, the iR error (Icell × Ru), which means the potential applied at the working electrode surface is less than the potential measured by the potentiostat [61].
This error manifests in CV experiments as [61]:
- Peak Shifting: Redox peaks shift to more extreme potentials.
- Peak Broadening: Peaks become wider and less defined.
- Distorted Kinetics: The measured kinetics appear slower than they are.
The simplified circuit model of an electrochemical cell, the Randles cell, helps visualize this. It comprises the uncompensated solution resistance (Ru) in series with the faradaic impedance (a parallel combination of the charge transfer resistance, Rfaradaic, and the double-layer capacitance, Cfaradaic) [61].
When is iR Compensation Necessary?
The need for iR compensation is not universal but depends on experimental conditions. The following table outlines key scenarios and a simple diagnostic test [61].
Table 1: Criteria for Assessing the Need for iR Compensation
| Scenario | Description | Rationale |
|---|---|---|
| Quantitative Tests | Experiments requiring numerical results like corrosion rates, equilibrium constants, or rate constants. | iR error directly introduces inaccuracies in calculated parameters [61]. |
| Low Conductivity Solutions | Electrolytes with low ionic strength (e.g., pure solvents, biological fluids). | Low conductivity leads to a high R𝑢 [61]. |
| High Current Systems | Experiments involving large currents (e.g., electrocatalytic water splitting, bulk electrolysis). | The iR error (I𝑐𝑒𝑙𝑙 × R𝑢) is proportional to current [61]. |
| Non-Ideal Cell Geometry | setups where the reference electrode cannot be placed close to the working electrode. | Increases the effective R𝑢 [61]. |
A practical rule of thumb is to record CV scans with and without iR compensation. If the shape and position of the voltammogram change significantly (beyond increased noise), compensation is required [61].
Methodologies for Measuring and Correcting iR Drop
Two primary methods are used to determine the uncompensated resistance, R𝑢: Electrochemical Impedance Spectroscopy (EIS) and the Current-Interrupt technique.
Measuring R𝑢 with Electrochemical Impedance Spectroscopy (EIS)
Electrochemical Impedance Spectroscopy is a powerful AC technique for characterizing cell resistance. A small amplitude AC voltage is applied over a range of frequencies, and the impedance is measured [61].
- Protocol:
- Set the DC potential to the operating potential of interest.
- Perform an EIS scan from high frequency (e.g., 100 kHz) to low frequency (e.g., 0.1 Hz).
- Plot the data in a Bode format (Impedance vs. Frequency).
- The impedance at the high-frequency limit corresponds to the uncompensated resistance, R𝑢. At these frequencies, the capacitor Cfaradaic acts as a short circuit, so the total impedance is dominated by R𝑢 [61].
Measuring R𝑢 with the Current-Interrupt Technique
The Current-Interrupt technique is a transient DC method often integrated into potentiostats for real-time iR compensation during CV experiments [61].
- Protocol:
- The potentiostat applies a current to the cell.
- It rapidly interrupts the current flow (for a very short time, e.g., 10-30 µs).
- The cell voltage is measured immediately before and after the interruption.
- The instantaneous voltage drop after current interruption is the iR error. The voltage then decays more slowly as the double-layer capacitor discharges.
- R𝑢 is calculated as R𝑢 = ΔV / Icell, where ΔV is the instantaneous voltage drop [61].
Critical Considerations for Current-Interrupt:
- Sampling Speed: The measurement must be fast enough to capture the instantaneous drop before the capacitor discharge significantly affects the voltage. If the sampling is too slow, extrapolation can introduce error [61].
- Cable Capacitance: The capacitance of the cables connecting the cell can distort the voltage transient, complicating the measurement [61].
The following workflow diagram summarizes the decision process and methodologies for iR compensation.
The Scientist's Toolkit: Research Reagent Solutions
Selecting the right materials is crucial for a successful CV experiment, especially for managing iR drop.
Table 2: Essential Materials for CV Experiments with iR Considerations
| Item | Function & Rationale |
|---|---|
| Supporting Electrolyte | An electrochemically inert salt (e.g., TBAPF₆, KCl) at high concentration (typically >0.1 M). It increases solution conductivity, thereby reducing R𝑢, without participating in the redox reaction [61]. |
| Luggin Capillary | A probe that positions the reference electrode tip very close to the working electrode surface. This configuration minimizes the distance between them, reducing R𝑢 by confining the current path in the solution [61]. |
| Non-Aqueous Solvents & Electrolytes | Solvents like acetonitrile or dichloromethane have inherently low conductivity. Using a suitable supporting electrolyte is absolutely essential in these systems to avoid excessive iR drop [61]. |
| Potentiostat with iR Compensation | Modern potentiostats have built-in firmware to perform positive-feedback or current-interrupt iR compensation. They use the measured R𝑢 value to automatically correct the applied potential in real-time [61]. |
| Glassy Carbon Working Electrode | A common working electrode material. Its surface area is a key parameter in the Randles-Sevcik equation for calculating analyte concentration and diffusion coefficients [14] [1] [2]. |
Case Study in Applied Research: Ni/Al-Carbonate Hydrotalcite for Methanol Oxidation
A recent 2025 study on a Ni/Al-carbonate hydrotalcite (Ni-LDH) catalyst for methanol oxidation (MOR) highlights the importance of proper experimental configuration, even if iR compensation is not explicitly mentioned [14]. The research provides a robust methodology for catalyst characterization and testing.
- Experimental Protocol for Catalyst Modification:
- Electrode Preparation: A glassy carbon electrode (GCE) was polished with a 0.3 µm alumina slurry, washed, and ultrasonicated to ensure a clean, reproducible surface [14].
- Catalyst Ink Preparation: The synthesized Ni-LDH powder was ground and dispersed in a solution of water, isopropanol, and polytetrafluoroethylene (PTFE) resin, then sonicated to create a homogeneous colloidal suspension [14].
- Drop-Casting: A precise volume of the catalyst ink was drop-casted onto the clean GCE surface and dried at ambient temperature, resulting in a Ni-LDH modified glassy carbon (NLGC) working electrode with a loading of ~0.074 mg [14].
- Electrochemical Testing: CV was performed in a three-electrode cell with the NLGC electrode as the working electrode, a platinum wire counter electrode, and a saturated calomel electrode (SCE) as the reference in a high-pH (13) electrolyte. The solution was degassed with nitrogen prior to measurements to remove interfering oxygen [14].
This configuration allowed the researchers to successfully characterize the Ni(II)/Ni(III) redox couple and its catalytic role in methanol oxidation, demonstrating how careful experimental setup enables the study of advanced materials for energy applications [14].
Validating Electrochemical Data: How CV Complements and Correlates with Other Analytical Techniques
The development of efficient catalysts is a cornerstone of advances in renewable energy and sustainable chemical synthesis. While cyclic voltammetry (CV) provides powerful insights into the electrochemical behavior and kinetic parameters of catalytic materials, it traditionally reveals little about the concomitant structural and compositional changes at the catalyst surface. To address this limitation, researchers are increasingly coupling CV with spectroscopic techniques such as Raman and Fourier-Transform Infrared (FTIR) spectroscopy. This multimodal approach provides a more comprehensive picture by correlating electrochemical response with molecular-level structural data, enabling the identification of active sites, reaction intermediates, and degradation mechanisms. This technical guide explores the theoretical foundations, experimental methodologies, and data interpretation strategies for integrating CV with Raman and FTIR spectroscopy, framed within the broader research context of what CV is used for in modern electrocatalyst development.
Theoretical Foundations
Fundamentals of Cyclic Voltammetry (CV)
Cyclic Voltammetry is a ubiquitous electrochemical technique where the potential applied to a working electrode is swept linearly between set limits and the resulting current is measured [12]. The primary output, a voltammogram (a plot of current vs. potential), provides both qualitative and quantitative information about electrochemical systems.
- Key Kinetic Parameters: CV can determine formal potentials, electron-transfer rate constants, and diffusion coefficients. For a reversible, one-electron transfer process, the ideal peak-to-peak separation is 59 mV [12].
- Diagnostic Capabilities: The shape of the voltammogram and the relationship between peak current and scan rate can distinguish between diffusion-controlled and adsorption-controlled processes, a critical aspect in catalyst characterization [14].
- Research Context: In catalyst studies, CV is used to assess electrochemically active surface area (ECSA), determine redox potentials of active sites, and evaluate catalytic activity and stability [14] [42]. For instance, the redox behavior of Ni(II)/Ni(III) centers in hydrotalcite catalysts has been probed using CV to understand their role in methanol oxidation [14].
Principles of Raman and FTIR Spectroscopy
Vibrational spectroscopy techniques like Raman and FTIR probe the energy levels associated with molecular vibrations, providing a "fingerprint" that is sensitive to chemical structure, bonding, and molecular environment.
- FTIR Spectroscopy measures the absorption of infrared light, which occurs when the radiation's frequency matches the vibrational frequency of a chemical bond, causing a change in its dipole moment [62]. It is exceptionally useful for identifying functional groups and surface species.
- Raman Spectroscopy relies on the inelastic scattering of monochromatic light, providing information about vibrational modes that involve a change in polarizability. It is particularly well-suited for studying symmetric bonds and carbonaceous materials in aqueous environments, which can be challenging for FTIR [62].
- Surface-Enhanced Raman Spectroscopy (SERS) significantly amplifies the Raman signal by many orders of magnitude when molecules are adsorbed onto nano-structured metallic surfaces, enabling the detection of trace intermediates and monolayer coverage [63] [64]. A related technique, photo-excited electrochemical SERS, integrates light illumination to directly study photoelectrocatalytic interfaces [63].
The Rationale for Coupling Techniques
The synergy between CV and vibrational spectroscopy is transformative for catalyst characterization. While CV identifies when and how efficiently redox events occur, Raman and FTIR reveal what chemical species are present and how their structures change during these events. This combined approach is invaluable for:
- Directly identifying reaction intermediates and poisoning species adsorbed on the catalyst surface during potential cycling.
- Correlating electrochemical features (e.g., an oxidation peak) with the formation or consumption of specific chemical species.
- Monitoring dynamic structural evolution of catalysts, such as phase transformations or oxidation state changes, under operational conditions.
- Elucidating reaction mechanisms and structure-activity relationships at a molecular level [63] [64].
Experimental Methodologies
In Situ and Operando Cell Design
A critical component of successful coupling is the design of the electrochemical cell that is compatible with spectroscopic measurements.
- Optical Access: The cell must feature a window (e.g., CaF₂ for IR, quartz or glass for Raman) that is transparent to the incident spectroscopic beam and positioned close to the working electrode.
- Electrode Configuration: A standard three-electrode setup is maintained. The working electrode is often a flat disk or the cell window itself, coated with the catalytic material of interest.
- Material Compatibility: All cell materials must be inert to the electrolyte and not produce interfering spectroscopic signals.
Table 1: Common Window Materials for Spectro-Electrochemical Cells
| Window Material | Spectral Range | Technique | Advantages | Limitations |
|---|---|---|---|---|
| CaF₂ | ~1000 - 40,000 cm⁻¹ | FTIR | Excellent transmission in mid-IR; insoluble in water. | Soluble in acidic solutions; relatively soft. |
| ZnSe | ~500 - 20,000 cm⁻¹ | FTIR | Good transmission, used for ATR configurations. | Toxic; reacts with strong acids and bases. |
| Quartz | ~250 - 3,500 nm (UV-Vis-NIR) | Raman | High transmission for visible laser lines; chemically robust. | Opaque in mid-IR range. |
| Diamond | < 2300 cm⁻¹ & > 4000 cm⁻¹ (FTIR); Broad for Raman | FTIR, Raman | Extremely robust; chemically inert; weak spectral features. | High cost; can have fluorescence impurities. |
Integrated Workflow for Coupled Measurements
A typical experiment involves running CV cycles while simultaneously acquiring spectroscopic data at controlled intervals or continuously.
Detailed Protocols for Key Experiments
Protocol: In Situ SERS for Methanol Oxidation Reaction (MOR)
This protocol is adapted from studies on Ni/Al-hydrotalcite catalysts [14] and photo-excited EC-SERS [63].
1. Catalyst Synthesis and Electrode Preparation:
- Synthesize Ni/Al-carbonate hydrotalcite (Ni-LDH) via co-precipitation: Slowly add a solution of Ni(NO₃)₂·6H₂O (0.75 mol) and Al(NO₃)₃·9H₂O (0.25 mol) to a Na₂CO₃ (0.05 mol) solution under constant stirring, maintaining pH at 10 with NaOH. Age the precipitate at 65°C for 24 hours, then filter, wash, and air-dry [14].
- Prepare a catalyst ink by dispersing the fine Ni-LDH powder in a mixture of deionized water, isopropanol, and polytetrafluoroethylene resin (4:1:0.05 volume ratio). Sonicate for 2 hours to ensure a homogeneous dispersion.
- Drop-cast the ink onto a polished glassy carbon electrode (GCE, 3 mm diameter) and allow it to dry at ambient temperature. The typical catalyst loading is ~0.074 mg [14].
2. Spectro-Electrochemical Measurement:
- Assemble an electrochemical cell with the Ni-LDH modified GCE as the working electrode, a Pt wire counter electrode, and a saturated calomel reference electrode (SCE). Use a SERS-active substrate or ensure the catalyst itself has SERS activity.
- Fill the cell with 0.1 M NaOH electrolyte with and without 0.5 M methanol.
- Use a potentiostat to run CV cycles between 0.1 V and 0.7 V vs. SCE at a scan rate of 50 mV/s.
- Simultaneously, use a Raman spectrometer with a 532 nm laser to acquire spectra at set intervals (e.g., every 50 mV during the forward scan). For photo-excited studies, integrate controlled light illumination [63].
3. Data Analysis:
- Correlate the appearance of an anodic peak around 0.62 V in the CV (corresponding to Ni(II) to Ni(III) oxidation) with the emergence of a Raman band at 474 cm⁻¹ (Ni(II)-O vibration) and features associated with formate ions, a key intermediate in MOR [14].
- Monitor peak shifts and intensity changes to deduce the role of the NiIII-OOH species in catalyzing methanol oxidation.
Protocol: In Situ FTIR for Catalyst Surface Analysis
This protocol leverages FTIR's strength in identifying surface functional groups and adsorbed species [62].
1. Electrode and Cell Setup:
- Prepare a catalyst film on a conductive substrate (e.g., Au-coated glass) that also serves as the IR window or is pressed against it.
- Assemble a cell with a CaF₂ or ZnSe IR window. Use a three-electrode configuration as described above.
2. FTIR Data Acquisition:
- Employ Subtractively Normalized Interfacial FTIR Spectroscopy (SNIFTIRS). This involves taking a series of single-beam spectra at a reference potential (e.g., 0.1 V) and sample potentials of interest.
- The interferogram is collected and transformed via a Fourier transform to generate a frequency-domain spectrum [62].
- Calculate the differential spectrum (ΔR/R) as (Rsample - Rref)/R_ref, where R is reflectance. Positive bands indicate formation of species, while negative bands indicate consumption.
3. Data Interpretation:
- Identify characteristic vibrational bands. For example, a sudden peak around 1700 cm⁻¹ typically indicates a carbonyl (C=O) group, while a broad peak in the 3200–3600 cm⁻¹ range is related to hydroxyl (O–H) stretching vibrations [62].
- Track the intensity of these bands as a function of applied potential to build a potential-dependent profile of surface species.
Table 2: Key Vibrational Bands for Catalyst Characterization
| Vibrational Mode | FTIR Frequency (cm⁻¹) | Raman Shift (cm⁻¹) | Assignment | Catalytic Relevance |
|---|---|---|---|---|
| ν(O-H) | 3200-3600 (broad) | 3200-3600 (broad) | Hydroxyl Stretch | Water, Hydroxides |
| ν(C=O) | 1650-1750 | 1650-1750 | Carbonyl Stretch | Aldehyde/Ketone Intermediates |
| ν(C-O) | 1000-1300 | 1000-1300 | Carbon-Oxygen Stretch | Alcohols, Ethers, Carbonates |
| ν(Ni-O) | - | ~474 | Nickel-Oxygen Vibration | NiOOH Active Site [14] |
| ν(C-N) | 1180-1360 | 1180-1360 | Carbon-Nitrogen Stretch | C-N Coupled Products [65] |
| Ring Breathing | - | ~1580, ~1100 | Aromatic Carbon Rings | Carbon Support/Deposit |
Data Integration and Interpretation
Correlating Electrochemical and Spectral Data
The core of the coupled analysis is establishing direct links between voltammetric features and spectral changes.
For the Ni-LDH system, the anodic peak in the CV corresponds to the oxidation of Ni²⁺ to Ni³⁺. The concurrent redshift of the Ni-O vibration in the Raman spectrum confirms the structural change in the nickel-oxygen coordination environment upon oxidation. The simultaneous detection of formate vibrations provides direct spectroscopic evidence that the newly formed Ni³⁺ species is oxidizing methanol via a formate pathway [14].
Case Study: Mechanistic Investigation of MOR on Ni-Based Catalysts
The integrated CV-Raman analysis allows for a detailed mechanistic proposal:
- Electrochemical Activation: During the anodic scan, Ni²⁺ sites in the brucite-like layers are oxidized to Ni³⁺, observed as a broad peak at ~0.62 V in the CV [14].
- Spectroscopic Confirmation: The Raman spectrum shows a corresponding redshift of the Ni²⁺-O vibration, confirming the formation of a Ni³⁺-OOH species, the proposed active site.
- Intermediate Detection: The appearance of Raman bands assigned to formate ions indicates that methanol is oxidized to formate on the Ni³⁺-OOH sites.
- Regeneration: During the cathodic scan, the reduction peak at ~0.42 V corresponds to the reduction of Ni³⁺ back to Ni²⁺, resetting the catalytic cycle.
This combined approach moves beyond inference to provide direct, molecular-level evidence of the catalytic mechanism.
The Scientist's Toolkit: Essential Research Reagents and Materials
Successful implementation of these coupled techniques requires specific materials and an understanding of their function.
Table 3: Key Research Reagent Solutions for CV-Spectroscopy Coupling
| Item | Function/Description | Example from Literature |
|---|---|---|
| Ni/Al-Carbonate Hydrotalcite (Ni-LDH) | Layered double hydroxide catalyst; provides well-defined Ni²⁺ sites that undergo reversible oxidation to Ni³⁺. | Model catalyst for methanol oxidation [14]. |
| SERS-Active Substrates | Nanostructured Au or Ag films/particles that enhance Raman signal by plasmonic effects. | Used in photo-excited EC-SERS for studying photoelectrocatalytic interfaces [63] [64]. |
| Alkaline Electrolyte (e.g., 0.1 M NaOH) | Provides conducting medium and necessary hydroxide ions for reactions like alcohol oxidation. | Essential for achieving Ni²⁺/Ni³⁺ redox chemistry in MOR [14]. |
| Glassy Carbon Electrode (GCE) | Common, inert working electrode substrate for drop-casting catalyst inks. | Used as a support for Ni-LDH catalysts [14]. |
| CaF₂ or ZnSe Optical Windows | Infrared-transparent materials for in situ FTIR cells; allow specific IR frequencies to pass. | Critical for constructing spectro-electrochemical cells for FTIR [62]. |
| Potentiostat with Synchronization | Instrument to control potential/current and synchronize with spectrometer for time-resolved data. | Required for all coupled CV-spectroscopy experiments. |
Advanced Applications and Future Outlook
The convergence of electrochemistry and spectroscopy is rapidly advancing, driven by the need for deeper mechanistic understanding.
- Single-Atom Catalysts (SACs): Coupled techniques are crucial for characterizing SACs used in complex reactions like electrocatalytic C–N coupling. In situ spectroscopy can validate the preservation of atomic dispersion under potential control and identify reaction intermediates on the unique active sites [65].
- Machine Learning Enhancement: The high-dimensional data from coupled techniques is ideal for machine learning. For instance, convolutional neural networks can rapidly regress kinetic parameters from voltammograms in milliseconds, a task that traditionally takes hours. Similar approaches can be applied to interpret complex spectral datasets [17].
- Multi-Modal Operando Platforms: The future lies in combining multiple spectroscopic techniques (e.g., SERS, FTIR, and X-ray absorption spectroscopy) simultaneously with CV in a single operando platform. This provides complementary data streams that offer an unprecedented holistic view of the catalyst's dynamic state during operation [66] [64].
In conclusion, coupling cyclic voltammetry with Raman and FTIR spectroscopy transforms catalyst characterization from a descriptive to a mechanistic science. By simultaneously probing electrical, chemical, and structural information, this integrated approach provides the fundamental insights needed to rationally design the next generation of high-performance, durable catalysts for energy and chemical conversion.
The accurate determination of antioxidant capacity (AOC) is crucial for evaluating the efficacy of natural compounds, pharmaceutical formulations, and functional foods. Antioxidants play a substantial role in protecting biological systems against oxidative damage caused by free radicals and reactive oxygen species [67] [68]. While traditional spectrophotometric assays have long been the standard for AOC assessment, electrochemical techniques—particularly cyclic voltammetry (CV)—are emerging as powerful complementary tools that provide unique insights into redox behavior [67] [40]. This technical guide explores the correlation between electrochemical data and traditional assays, framing this analysis within the broader research applications of cyclic voltammetry, which include investigating reaction reversibility, describing electron transfer kinetics, and characterizing electrocatalytic materials [14] [15].
The fundamental principle underlying the electrochemical assessment of antioxidants lies in their ability to donate electrons, a property directly measurable through voltammetric techniques [69] [70]. When integrated into a comprehensive analytical framework, cyclic voltammetry offers researchers a rapid, sensitive, and information-rich alternative to conventional methods, enabling nuanced understanding of antioxidant profiles that extends beyond what traditional assays can provide alone [40].
Conventional Spectrophotometric Assays for Antioxidant Capacity
Traditional AOC assessment relies heavily on spectrophotometric methods that measure a sample's ability to neutralize specific free radicals or reduce oxidizing agents [67]. These assays can be broadly categorized into two classes: radical scavenging assays and reduction capacity assays [67]. The 2,2-diphenyl-1-picrylhydrazyl (DPPH) assay is one of the most widely used methods due to its simplicity and rapid implementation [69] [67]. In this assay, antioxidants react with the stable DPPH radical, resulting in a color change measurable at 517 nm [69]. The antioxidant activity is typically expressed as IC50 (concentration required to scavenge 50% of DPPH radicals) or Antiradical Power (ARP = 1/EC50) [69].
Other common spectrophotometric approaches include the ABTS (2,2'-azinobis(3-ethylbenzothiazoline-6-sulfonic acid)) assay, Ferric Reducing Antioxidant Power (FRAP) assay, and Oxygen Radical Absorbance Capacity (ORAC) assay [67] [68]. Each method operates on distinct principles, with ABTS and FRAP employing mixed electron transfer (ET) and hydrogen atom transfer (HAT) mechanisms, while ORAC specifically measures the radical chain-breaking potential of antioxidants [67]. Despite their widespread use, these conventional approaches present limitations including tedious sample preparation, long reaction times, interference from colored compounds, and inability to provide mechanistic information about individual redox-active components in complex mixtures [67] [70].
Table 1: Comparison of Conventional Spectrophotometric Assays for Antioxidant Capacity
| Assay | Mechanism | Detection Method | Key Advantages | Key Limitations |
|---|---|---|---|---|
| DPPH | ET and HAT mixed mechanisms | Spectrophotometry (517 nm) | Rapid, facile, low cost [69] | Steric hindrance issues, lacks standardization [67] |
| ABTS/TEAC | ET and HAT mixed mechanisms | Spectrophotometry (734 nm) | Applicable over wide pH ranges, measures both hydrophilic and hydrophobic antioxidants [67] | Moderate precision, results depend on reaction time [67] |
| FRAP | Single electron transfer | Spectrophotometry (593 nm) | Simple, rapid, inexpensive | Does not measure SH-containing antioxidants, irrelevant to biological systems [68] |
| ORAC | HAT mechanism | Fluorimetry | Applicable to both hydrophilic and hydrophobic antioxidants, biologically relevant [67] | Fluorescent probe can cause false readings, competitive assay [67] |
Electrochemical Assessment Using Cyclic Voltammetry
Fundamental Principles of Cyclic Voltammetry in Antioxidant Research
Cyclic voltammetry is an electrochemical technique that applies a linearly varying potential to an electrochemical cell while measuring the resulting current [15]. The potential is swept back and forth between designated limits while the current response is recorded, producing a characteristic "duck-shaped" plot known as a cyclic voltammogram [15]. For antioxidant research, CV provides direct information about the redox-active compounds present in a sample based on their oxidation and reduction potentials [69] [40].
The key parameters obtained from a cyclic voltammogram include anodic peak potential (Ep,a), anodic peak current (Ip,a), cathodic peak potential (Ep,c), and cathodic peak current (Ip,c) [15]. The anodic peak potential reflects the ease with which a compound donates electrons, with lower oxidation potentials indicating stronger antioxidant activity [69]. The peak current is proportional to the concentration of the redox-active species, enabling both qualitative and quantitative assessment [15] [40]. The half-wave potential (E1/2), calculated as the average of the anodic and cathodic peak potentials, approximates the formal potential of the redox couple and is frequently used to characterize antioxidant strength [15].
Experimental Protocol for Antioxidant Capacity Assessment
Electrode Preparation and Measurement: The standard three-electrode system consists of a working electrode (typically glassy carbon electrode, GCE), a reference electrode (saturated calomel electrode or Ag/AgCl), and a counter electrode (platinum wire) [14] [15]. Prior to measurements, the GCE must be polished with 0.3 μm alumina slurry, washed, and ultrasonicated with doubly distilled water [14]. For plant extract analysis, samples are typically dissolved in appropriate solvents such as acetonitrile with 0.1 M tetrabutylammonium hexafluorophosphate as supporting electrolyte [40]. Solutions should be degassed with inert gas (nitrogen or argon) for approximately 10 minutes before measurements to remove dissolved oxygen [15].
Voltammetric Parameters: Cyclic voltammograms are typically recorded at scan rates ranging from 0.1 V/s to 1.0 V/s, with the forward scan usually initiated from 0 V to positive potentials (for oxidation reactions) [14] [69]. Multiple cycles may be recorded to ensure stability of the electrochemical response. The oxidation peak potential (Ep,a) and anodic peak current (Ip,a) are the primary parameters used for AOC assessment, with Ip,a serving as an indicator of antioxidant concentration and Ep,a characterizing the antioxidant power [40].
Data Interpretation: The electrochemical behavior provides insights into the nature of redox-active compounds. Quasi-reversible redox behavior, characterized by peak separation (ΔEp = Ep,a - Ep,c) greater than 59 mV, is commonly observed for many phenolic antioxidants [14] [15]. The relationship between peak current and scan rate can distinguish between adsorption-controlled and diffusion-controlled processes, with linear dependence suggesting adsorption mechanisms and square-root relationship indicating diffusion control [14].
Figure 1: Experimental workflow for antioxidant capacity assessment using cyclic voltammetry
Correlation Between Electrochemical and Spectrophotometric Data
Quantitative Relationships Between CV Parameters and Traditional Assays
Substantial research efforts have been directed toward establishing correlations between electrochemical parameters and traditional AOC assays. Studies have demonstrated a significant inverse relationship between oxidation potentials (Ep,a) from cyclic voltammetry and Antiradical Power (ARP) from DPPH assays [69]. For example, gallic acid—a potent antioxidant—exhibits a low oxidation potential of 274 mV coupled with a high ARP value of 12.5, while less potent antioxidants like carvacrol show higher oxidation potentials (552 mV) and correspondingly lower ARP values (0.12) [69]. This correlation enables the prediction of radical scavenging activity based on electrochemical data.
Recent comparative investigations on vegetable extracts further validate these relationships. In studies comparing Ipomoea aquatica and Colocasia esculenta extracts, cyclic voltammetry revealed characteristic electron transfer peaks that aligned with DPPH radical scavenging activity [40]. Fractions exhibiting strong anodic currents in cyclic voltammetry consistently demonstrated low IC50 values in DPPH assays, confirming the complementary nature of both techniques [40].
Table 2: Correlation between Electrochemical Parameters and DPPH Assay for Selected Antioxidants
| Compound | Oxidation Potential (Ep,a) (mV) | Antiradical Power (ARP) | DPPH IC50 (μg/mL) | Reference |
|---|---|---|---|---|
| Gallic Acid | 274 | 12.5 | - | [69] |
| Sesamol | 343 | 5.5 | - | [69] |
| Eugenol | 411 | 5.0 | - | [69] |
| 4-Hexylresorcinol | 453 | 2.3 | - | [69] |
| Thymol | 529 | 0.78 | - | [69] |
| Carvacrol | 552 | 0.12 | - | [69] |
| I. aquatica Fraction 2 | - | - | 41.80-188.15 | [40] |
| C. esculenta Fraction 3 | - | - | 35.55-170.84 | [40] |
Advantages of Electrochemical Approaches
Electrochemical methodologies offer several distinct advantages over conventional spectrophotometric assays for AOC determination. CV provides rapid analysis with minimal sample preparation, requires small sample volumes, and offers exceptional precision and sensitivity [67] [70]. Unlike DPPH and ABTS assays which are limited by steric hindrance due to the large molecular size of the radical species, electrochemical methods can detect antioxidants regardless of molecular size [67]. Furthermore, CV enables the analysis of colored or turbid samples without interference—a significant limitation for spectrophotometric techniques [70].
Perhaps most importantly, cyclic voltammetry provides mechanistic insights into antioxidant behavior that traditional assays cannot offer. The technique can distinguish between different antioxidant classes based on their redox potentials, identify multiple redox-active centers in complex mixtures, and provide information about reaction kinetics and mechanisms [69] [40]. This nuanced understanding is particularly valuable for screening natural product extracts where multiple antioxidant compounds may be present simultaneously.
Experimental Protocols for Comparative Studies
Sample Preparation and Fractionation
For plant material analysis, the cold maceration method is recommended using ethanol (96%) as extraction solvent [40]. Typically, 300 g of powdered plant material is mixed with 1000 mL of ethanol and macerated for 10 days with periodic shaking, followed by filtration and evaporation to dryness [40]. Subsequent fractionation using column chromatography with silica gel stationary phase and gradient elution (n-hexane:ethyl acetate mixtures from 90:10 to 65:35) effectively separates compounds based on polarity [40]. Fractions should be stored in airtight glass vials at 4°C to preserve stability.
Cyclic Voltammetry Parameters
Cyclic voltammetry measurements should be performed using a standard three-electrode system with glassy carbon working electrode, platinum wire counter electrode, and saturated calomel reference electrode (SCE) [14] [40]. Optimal parameters include scan rates between 0.1-0.3 V/s for the non-faradaic region and potential windows tailored to the specific antioxidants of interest [14]. For phenolic compounds, a potential range of 0 V to +0.8 V is typically suitable [69]. All measurements should be conducted at room temperature with degassed solutions to eliminate oxygen interference [15].
DPPH Assay Protocol
The DPPH radical scavenging assay should be performed according to established protocols [69] [40]. Briefly, prepare a 0.1 mM DPPH solution in methanol. Mix sample solutions at varying concentrations with DPPH solution and incubate in darkness for 30 minutes. Measure absorbance at 517 nm against a methanol blank. Calculate radical scavenging activity as percentage inhibition = [(Acontrol - Asample)/Acontrol] × 100. Determine IC50 values from the linear regression of inhibition percentage versus concentration plots [40].
Research Reagent Solutions for Antioxidant Capacity Studies
Table 3: Essential Research Reagents for Electrochemical and Spectrophotometric AOC Analysis
| Reagent/Solution | Function/Application | Typical Concentration/Formula | Key Considerations |
|---|---|---|---|
| Tetrabutylammonium hexafluorophosphate | Supporting electrolyte for non-aqueous electrochemistry | 0.1 M in acetonitrile | Requires recrystallization before use; provides high electrochemical stability [40] |
| DPPH (2,2-diphenyl-1-picrylhydrazyl) | Stable free radical for spectrophotometric AOC assay | 0.1 mM in methanol | Sensitive to light; requires storage in darkness; reaction time affects results [69] [40] |
| ABTS (2,2'-azino-bis(3-ethylbenzothiazoline-6-sulfonic acid)) | Radical cation for spectrophotometric AOC assay | Generated by oxidation with K₂S₂O₈ | Can measure both hydrophilic and hydrophobic antioxidants; applicable over wide pH ranges [67] |
| Glassy Carbon Electrode | Working electrode for cyclic voltammetry | 3 mm diameter standard | Requires polishing with 0.3 μm alumina slurry before each use [14] |
| Silica Gel | Stationary phase for column chromatography | 60-120 mesh for fractionation | Enables separation of antioxidant compounds by polarity [40] |
The integration of cyclic voltammetry with traditional spectrophotometric assays provides a powerful multidimensional approach to antioxidant capacity assessment. While conventional methods like DPPH offer established protocols for radical scavenging evaluation, electrochemical techniques deliver complementary information through direct measurement of electron transfer capabilities, enabling more comprehensive antioxidant profiling [69] [40]. The significant correlations observed between oxidation potentials and antiradical power validate the use of CV as a reliable predictor of antioxidant activity [69].
For researchers and drug development professionals, the combined methodological approach offers distinct advantages in speed, sensitivity, and mechanistic insight. The experimental protocols outlined in this guide provide a robust framework for implementing these complementary techniques in analytical workflows. As electrochemical methodologies continue to evolve—enhanced by nanomaterials and advanced sensor technologies [70]—their integration with traditional assays will undoubtedly yield deeper understanding of antioxidant mechanisms and more accurate assessment of antioxidant capacity across diverse sample types.
Cyclic Voltammetry (CV) is a powerful electrochemical technique primarily used to investigate the reduction and oxidation (redox) processes of molecular species. In the context of electrocatalysis research, it serves as a fundamental tool for probing the catalytic performance, electrochemical reversibility, and kinetic parameters of novel catalyst materials. The technique involves cycling the potential applied between a working electrode (WE) and a counter electrode (CE) in an electrochemical cell while measuring the corresponding current. The resulting voltammogram provides critical information about the redox potential levels of the analyte, while the separation of oxidation and reduction waves reveals the analyte's electrochemical irreversibility, which is crucial for understanding catalyst efficiency [71].
The growing demand for renewable energy sources has driven significant research into exploring the electrocatalytic characteristics of electrode materials, particularly for the oxidation of small organic molecules like methanol in applications such as direct methanol fuel cells (DMFCs). CV enables researchers to benchmark novel catalysts against standard materials by providing quantitative data on onset potentials, peak current densities, and charge transfer characteristics, forming the basis for comparative performance analysis [14].
Experimental Framework for Catalyst Benchmarking
Core Principles of Catalyst Evaluation via CV
Benchmarking catalyst performance requires a standardized experimental framework to ensure meaningful comparisons. The CV technique is particularly valuable for characterizing the quasi-reversible redox behavior of catalyst centers, such as the Ni(II)/Ni(III) transition in non-precious metal catalysts. For methanol oxidation reaction (MOR) studies, CV reveals characteristic anodic and cathodic peak current densities corresponding to these transitions, typically observed at specific potential ranges (e.g., 0.62 V and 0.42 V versus SCE as observed for Ni/Al-carbonate hydrotalcite catalysts) [14].
The linear correlation of peak current with scan rate in the non-faradaic region (0.1–0.3 V) suggests an adsorption mechanism, while a square-root relationship indicates diffusion-controlled processes. These relationships provide critical insights into the reaction mechanisms governing catalyst performance. Additionally, hysteresis observations and peak shifts in voltammograms highlight efficient charge transport characteristics, which can be enhanced by structural features such as the brucite layer in layered double hydroxide (LDH) catalysts [14].
Advanced CV Techniques for Kinetic Analysis
Beyond conventional CV, advanced techniques provide enhanced capability for detailed kinetic analysis. Cyclic Staircase Voltammetry (CSCV), the actual technique implemented in many digital potentiostats, offers improved quantification under finite diffusion conditions. Recent advancements also include high-speed CV regressions using machine learning, where convolutional neural networks can successfully regress both the kinetic rate constant and transfer coefficient of CV data in milliseconds, compared to over 3000 seconds required using conventional optimization protocols with finite elemental analysis [43] [17].
Double potential chronoamperometry complements CV studies by confirming electron transfer processes (e.g., one-electron redox processes), while Tafel analysis (with slopes typically around 24.2 mV/dec for efficient catalysts) provides additional insights into the reaction kinetics and mechanisms [14].
Quantitative Benchmarking: Novel vs. Standard Catalysts
Performance Metrics for Methanol Oxidation Catalysts
The following table summarizes key performance parameters for various catalyst materials used in methanol oxidation reaction (MOR), demonstrating how CV-derived metrics enable direct comparison between novel and standard catalysts:
Table 1: Performance comparison of catalyst materials for methanol oxidation reaction
| Catalyst Material | Onset Potential (V) | Peak Current Density | Redox Peaks (V) Ni(II)/Ni(III) | Tafel Slope (mV/dec) | Electrochemically Active Surface Area (cm²) |
|---|---|---|---|---|---|
| Ni/Al-carbonate LDH [14] | 5.2 | Optimal at pH 13 | 0.62 (anodic), 0.42 (cathodic) | 24.2 | 0.042 |
| Pt/C (Standard) [14] | - | - | - | - | - |
| Pt-Ru/C (Standard) [14] | - | - | - | - | - |
Catalyst Composition and Structural Properties
Table 2: Structural and compositional properties of benchmarked catalysts
| Catalyst Material | Composition | Support Material | Synthesis Method | Key Advantages | Limitations |
|---|---|---|---|---|---|
| Ni/Al-carbonate LDH [14] | Layered Double Hydroxide with carbonate anions | Glassy Carbon Electrode | Co-precipitation | Cost-effective, high-temperature tolerance, chemical stability | Lower activity compared to noble metals |
| Pd/C (Acid-pretreated) [72] | 5 wt.% Pd | Carbon | Acid pretreatment | High selectivity in methanol solvent | Requires halides/acids to prevent H₂O₂ decomposition |
| Pd-Au catalyst [72] | Pd-Au on Cs-containing heteropolyacid | Heteropolyacid | Ion exchange | Current benchmark for water solvent | Limited selectivity due to H₂O₂ hydrogenation |
| Pt-based catalysts [14] | Pt or Pt alloys | Various supports | Various | High conductivity, effective catalytic activity | CO poisoning, high cost, complex processing |
Detailed Experimental Protocols for Catalyst Evaluation
Electrode Modification and Catalyst Deposition
Protocol for Working Electrode Preparation:
- Begin with mechanical polishing of the glassy carbon electrode (GCE) using a 0.3 μm alumina slurry to create a uniform surface [14].
- Wash the polished electrode with doubly distilled water and ultrasonicate to remove any residual alumina particles [14].
- Allow the cleaned GCE to air dry completely before catalyst deposition [14].
- Prepare catalyst ink by suspending fine catalyst powder (e.g., 50 mg of Ni-LDH) in a mixture of deionized water, isopropanol, and polytetrafluoroethylene resin (4:1:0.05 volume ratio) [14].
- Agitate the suspension thoroughly to ensure proper mixing, followed by sonication for 2 hours to maximize nanomaterial dispersion [14].
- Drop-cast a precise volume of the catalyst suspension onto the clean GCE surface using a micropipette, ensuring uniform coverage across the 3 mm diameter surface [14].
- Allow the modified electrode to dry at ambient temperature, resulting in a calculated catalyst loading of approximately 0.074 mg for standard 3 mm GCE [14].
Synthesis of Ni/Al-carbonate Hydrotalcite (Ni-LDH) Catalyst:
- Prepare an aqueous solution (0.1 L) containing Ni(NO₃)₂·6H₂O (0.75 mol) and Al(NO₃)₃·9H₂O (0.25 mol) [14].
- Prepare a separate solution (100 mL) containing Na₂CO₃ (0.05 mol) [14].
- Add the nitrate solution dropwise to the carbonate solution while maintaining constant pH at 10 through dropwise addition of NaOH (3.33 M) [14].
- Age the resulting gelatinous precipitate at 65°C for 24 hours [14].
- Filter and wash the precipitate repeatedly until neutral pH is achieved [14].
- Air-dry the resulting powder at room temperature to obtain the final Ni-LDH catalyst [14].
CV Measurement Parameters and Conditions
Standardized Electrochemical Measurements:
- Employ a three-electrode system with the catalyst-modified GCE as working electrode, platinum wire as counter electrode, and saturated calomel electrode (SCE) as reference electrode [14].
- Use alkaline conditions (pH 13) for MOR studies, prepared using high-purity NaOH solutions [14].
- Degas all solutions with nitrogen purging for at least 15 minutes prior to electrochemical measurements to remove dissolved oxygen [14].
- Maintain room temperature throughout the experiments unless studying temperature effects [14].
- Set appropriate potential windows based on the catalyst system under investigation, typically ranging from -0.2 V to 0.8 V vs. SCE for nickel-based catalysts [14].
- Utilize multiple scan rates (typically 0.01-1 V/s) to study the influence of mass transport and distinguish between adsorption-controlled and diffusion-controlled processes [14].
Essential Research Reagent Solutions and Materials
Table 3: Essential research reagents and materials for electrocatalyst benchmarking
| Reagent/Material | Function/Purpose | Specification/Notes |
|---|---|---|
| Working Electrode [14] | Platform for catalyst deposition | Glassy carbon electrode (3 mm diameter) |
| Reference Electrode [14] | Stable potential reference | Saturated calomel electrode (SCE) |
| Counter Electrode [14] | Completes electrical circuit | Platinum wire |
| Supporting Electrolyte [14] | Provides conductivity, minimizes resistance | 0.05-0.5 M concentration in solvent |
| Solvent [72] | Dissolves electrolyte and analyte | Water, methanol, or mixtures; must not react with system components |
| Catalyst Precursors [14] | Source of active metal components | Metal salts (e.g., Ni(NO₃)₂·6H₂O, Al(NO₃)₃·9H₂O) |
| Precipitating Agent [14] | Controls catalyst formation | NaOH, Na₂CO₃ for hydrotalcite synthesis |
| Probe Molecules [14] | Evaluates catalytic activity | Methanol (1-10 mM for MOR studies) |
| Inert Gas [71] | Removes dissolved oxygen | Nitrogen or argon for solution degassing |
Data Interpretation and Analytical Techniques
Key Voltammetric Features for Performance Assessment
The interpretation of cyclic voltammograms focuses on specific features that indicate catalytic performance:
- Redox Peak Potentials: The positions of oxidation and reduction waves indicate the thermodynamic feasibility of the catalytic reaction. For instance, well-defined anodic and cathodic peaks at 0.62 V and 0.42 V (vs. SCE) correspond to the quasi-reversible redox behavior of Ni(II)/Ni(III) centers in Ni-LDH catalysts [14].
- Peak Current Ratios: The comparison of anodic to cathodic peak currents (ip,a/ip,c) approaching unity indicates reversible electron transfer processes, while deviations suggest mechanistic complications or side reactions [14].
- Onset Potential: The potential at which significant catalytic current begins to flow indicates the activation barrier for the reaction, with lower values representing more efficient catalysts. For MOR on Ni-LDH, onset potential of 5.2 V has been reported [14].
- Scan Rate Dependence: Linear correlation of peak current with scan rate suggests surface-confined (adsorption-controlled) processes, while linear correlation with the square root of scan rate indicates diffusion-controlled mass transport [14].
Complementary Characterization Techniques
Spectro-electrochemical Methods: Raman spectroscopy provides molecular-level insights into catalyst structure and reaction mechanisms. For Ni-LDH catalysts, Raman analysis shows a redshift of NiII-O at 474 cm⁻¹ and formate ion vibrations, confirming NiIII-OOH's role in MOR catalysis [14].
Structural Characterization: X-ray diffraction (XRD) patterns confirm catalyst crystallinity and phase composition, while scanning electron microscopy (SEM) reveals morphological features that influence catalytic activity. Fourier Transform Infrared Spectroscopy (FTIR) identifies functional groups and intercalated species in structured catalysts like hydrotalcites [14].
Visualization of Experimental Workflows and Data Interpretation
CV Experimental Setup and Measurement Process
CV Experimental Workflow: This diagram illustrates the step-by-step process for preparing electrodes and conducting cyclic voltammetry measurements for catalyst benchmarking.
Catalyst Performance Data Interpretation Logic
CV Data Interpretation Logic: This flowchart outlines the analytical process for extracting key performance metrics from cyclic voltammetry data to enable catalyst benchmarking.
Cyclic voltammetry serves as an indispensable technique in the comprehensive benchmarking of novel catalyst materials against standard references. Through systematic experimental design, standardized protocols, and multifaceted data interpretation, researchers can obtain quantitative performance metrics that enable direct comparison of catalytic activity, stability, and efficiency. The integration of CV with complementary characterization techniques provides a robust framework for advancing catalyst development, particularly in renewable energy applications such as direct methanol fuel cells. As electrocatalytic research progresses, the continued refinement of CV methodologies, including the adoption of machine learning for rapid data regression, will further enhance our ability to efficiently screen and optimize next-generation catalyst materials.
Cyclic voltammetry (CV) stands as a cornerstone technique in electrochemical research, prized for its ability to rapidly elucidate redox mechanisms and characterize electron transfer processes. This technical guide examines the position of CV within the modern analytical toolkit, contrasting its capabilities with alternative voltammetric methods. By evaluating key performance parameters across diverse application scenarios—from drug development to material science—we provide a structured framework for researchers to select the optimal technique based on analytical objectives, sample characteristics, and required data quality. The analysis synthesizes current methodologies, technical considerations, and emerging trends to inform strategic method selection in research and industrial settings.
Cyclic voltammetry represents one of the most versatile and widely-employed techniques in electrochemistry, providing critical insights into redox behavior across scientific disciplines. In pharmaceutical research, CV serves as a powerful tool for investigating redox properties of drug candidates, studying reaction mechanisms, and characterizing electron transfer kinetics [18]. The technique's fundamental principle involves scanning the potential applied to a working electrode linearly with time while monitoring the resulting current, then reversing the scan direction to complete the cycle [73]. This bidirectional scanning generates the characteristic "duck-shaped" voltammogram that contains rich information about the thermodynamics and kinetics of electrochemical reactions [15].
The popularity of CV stems from its exceptional capability to rapidly provide qualitative information about redox processes. Unlike single-direction techniques, the reverse scan in CV reveals the reversibility of reactions—a critical parameter in battery development, electrocatalyst assessment, and drug metabolism studies [73]. When framed within the broader thesis of what cyclic voltammetry is used for in research, its primary value lies in mechanistic elucidation rather than quantitative analysis. Researchers routinely employ CV to determine formal reduction potentials, identify reaction intermediates, diagnose coupled chemical reactions, and evaluate electrochemical reversibility [32]. This diagnostic power makes CV typically the first technique deployed when encountering new electrochemical systems, establishing a foundation for subsequent quantitative analysis using specialized techniques.
Comparative Analysis of Voltammetric Techniques
Key Voltammetric Methods and Their Characteristics
The strategic selection of voltammetric technique depends fundamentally on the analytical objectives, sample matrix, and required detection capabilities. Table 1 summarizes the primary techniques, their underlying principles, and optimal application scenarios.
Table 1: Comparison of Common Voltammetric Techniques
| Technique | Principle | Primary Strengths | Primary Limitations | Optimal Use Cases |
|---|---|---|---|---|
| Cyclic Voltammetry (CV) | Potential scanned linearly in forward and reverse directions | Excellent for mechanism studies, reversibility assessment, rapid screening | Higher detection limits, susceptible to charging currents | Initial system characterization, reversibility studies, reaction mechanism elucidation |
| Differential Pulse Voltammetry (DPV) | Series of small potential pulses superimposed on linear ramp | Low detection limits, minimal charging current effects, better resolution of closely-spaced peaks | Slower than CV, less information about reaction kinetics | Trace analysis, quantification in complex matrices, resolving overlapping signals |
| Square Wave Voltammetry (SWV) | Symmetrical square wave superimposed on staircase ramp | Fast, extremely low detection limits, effective rejection of charging currents | Complex data interpretation, less established for mechanistic studies | Ultra-sensitive detection, rapid screening, studying surface-confined processes |
| Linear Sweep Voltammetry (LSV) | Potential scanned linearly in one direction only | Simpler data interpretation, good for diffusion studies | Limited mechanistic information, no reversibility data | Basic characterization, diffusion coefficient determination |
CV excels particularly in initial system characterization where understanding redox behavior takes precedence over precise quantification [18]. The technique provides immediate insights into the number of redox processes, their reversible nature, and approximate potential windows. For reversible systems, CV offers diagnostic criteria including peak separation (ΔEp ≈ 57/n mV), peak current ratio (Ipa/Ipc ≈ 1), and scan rate independence of peak potentials [73]. These characteristics make CV indispensable for fundamental electrochemical studies despite its relatively higher detection limits compared to pulse techniques.
Quantitative Performance Comparison
The analytical performance characteristics of these techniques vary significantly, influencing their suitability for different research scenarios. Table 2 presents key quantitative parameters that guide technique selection.
Table 2: Analytical Performance Characteristics Across Techniques
| Technique | Typical Detection Limit | Linear Dynamic Range | Scan Rate/Speed | Selectivity Considerations |
|---|---|---|---|---|
| CV | Micromolar (10⁻⁶ M) range | 2-3 orders of magnitude | Variable (0.001-1000 V/s) | Moderate; peak overlap problematic in complex mixtures |
| DPV | Nanomolar (10⁻⁹ M) range | 4-5 orders of magnitude | Moderate to slow | High; effective resolution of peaks separated by ≥50 mV |
| SWV | Sub-nanomolar (10⁻¹⁰ M) range | 4-6 orders of magnitude | Fast | High; excellent resolution with proper parameter optimization |
| LSV | Micromolar (10⁻⁶ M) range | 2-3 orders of magnitude | Variable | Moderate; similar limitations to CV |
The data reveal a critical trade-off: while CV provides rich mechanistic information, it typically exhibits higher detection limits than pulse techniques [18]. This fundamental limitation directs CV toward qualitative and semi-quantitative applications rather than trace analysis. For instance, in pharmaceutical analysis, CV excellently characterizes the redox behavior of new drug candidates, while differential pulse voltammetry achieves the sensitive quantification required for pharmacokinetic studies [74]. The significantly lower detection limits of DPV and SWV stem from their effective discrimination against capacitive currents, which often dominate the faradaic response in CV, particularly at fast scan rates [15].
Technique Selection Framework
The decision to select CV over alternative techniques follows a logical workflow based on analytical priorities. The following diagram illustrates the decision-making process:
This decision framework emphasizes CV's primary strength: when understanding electrochemical behavior takes precedence over quantitative analysis. For completely new systems, CV provides the comprehensive overview needed to guide subsequent analytical steps.
CV in Pharmaceutical Research: Applications and Protocols
Drug Development and Analysis Applications
CV occupies a critical niche in pharmaceutical research, particularly during early-stage investigation of new chemical entities. Reaction mechanism elucidation represents one of CV's strongest applications, as demonstrated in studies of potential anticancer agents like dimethyl 2-[2-(1-phenyl-4,5-dihydro-1H-imidazol-2-yl)hydrazinylidene]butanedioate (DIHB) and 8-(3-chlorophenyl)-2,6,7,8-tetrahydroimidazo[2,1-c][1,2,4]triazine-3,4-dione (HDIT) [74]. In these investigations, CV revealed oxidation peaks at 1.18 V and 0.98 V (vs. Ag/AgCl), respectively, enabling preliminary characterization of their redox behavior before developing more sensitive quantitative methods.
Beyond drug discovery, CV provides valuable insights in antioxidant capacity assessment, where it complements traditional spectrophotometric methods like DPPH assay [40]. The technique directly measures electron-donating capacity through anodic current signals, with peak potential (Epa) indicating antioxidant strength and peak current (Ipa) correlating with concentration. This approach successfully characterized antioxidant profiles in vegetable extracts, demonstrating CV's versatility in phytochemical analysis.
In pharmaceutical quality control, CV serves as a rapid screening tool for active pharmaceutical ingredients (APIs), though it typically yields to more sensitive techniques for regulatory testing. The technique's ability to study electron transfer kinetics makes it invaluable for characterizing modified electrodes used in pharmaceutical biosensors [18]. CV also plays a crucial role in stability assessment by detecting degradation products through the appearance of new redox peaks or changes in existing peak ratios.
Experimental Protocol: Basic CV Setup and Operation
Implementing CV requires careful attention to experimental parameters to generate meaningful data. The following protocol outlines a standard approach for pharmaceutical analysis:
Equipment and Reagents Setup
- Potentiostat: Instrument capable of precise potential control and current measurement
- Electrochemical Cell: Three-electrode configuration (working, reference, and counter electrodes)
- Working Electrode Selection: Glassy carbon electrode (GCE) for general purpose, gold or platinum for specific applications, carbon paste for modified surfaces [74]
- Reference Electrode: Ag/AgCl (3.0 M KCl) for non-aqueous systems, saturated calomel for aqueous
- Counter Electrode: Platinum wire or coil
- Supporting Electrolyte: 0.1-0.2 M acetate buffer (pH 4.5) or phosphate buffer saline depending on analyte properties [74]
- Solvent Selection: Acetonitrile for non-aqueous systems, distilled/deionized water for aqueous
Electrode Preparation Protocol
- Working Electrode Polishing: Using alumina slurry (0.05 μm) on microcloth pad, followed by thorough rinsing with distilled water and solvent
- Surface Activation: Electrochemical cycling in clean electrolyte (e.g., 0.1 M H₂SO₄) between suitable potential limits until stable response achieved
- Electrode Characterization: Validation using standard redox couples (ferrocene/ferrocenium in non-aqueous or potassium ferricyanide in aqueous systems)
Sample Preparation and Measurement
- Solution Degassing: Purge with inert gas (N₂ or Ar) for 10-15 minutes to remove dissolved oxygen [15]
- Analyte Introduction: Add stock solution to achieve desired concentration (typically 0.1-5 mM for initial CV characterization)
- Parameter Setup:
- Initial potential: Typically 0.2-0.5 V before expected redox event
- Scan direction: Positive for oxidizable compounds, negative for reducible compounds
- Vertex potentials: Set to encompass all redox events of interest
- Scan rate: Begin with moderate rate (50-100 mV/s) for initial characterization
- Data Collection: Multiple cycles to assess stability (typically 3-5 cycles)
Data Interpretation Workflow
- Peak Identification: Locate anodic (Epa) and cathodic (Epc) peak potentials
- Reversibility Assessment: Calculate ΔEp (Epa - Epc) and ipa/ipc ratio
- Kinetic Analysis: Perform scan rate studies to determine diffusion vs. adsorption control
- Quantitative Estimation: Compare peak currents with standards for semi-quantitative analysis
This protocol provides a foundation for reliable CV analysis, though specific parameters require optimization for each analytical system.
Experimental Protocol: Advanced CV for Mechanism Elucidation
For detailed mechanistic studies, extended protocols provide deeper insights:
Scan Rate Dependence Studies
- Procedure: Measure CV responses across a wide scan rate range (0.01-10 V/s)
- Data Analysis: Plot log(ip) vs. log(v) to determine mass transport characteristics
- Interpretation: Slope of 0.5 indicates diffusion control, slope of 1.0 suggests surface-confined processes
Concentration Variation Studies
- Procedure: Systematically vary analyte concentration while maintaining constant other parameters
- Data Analysis: Evaluate peak current vs. concentration linearity
- Interpretation: Non-linearity may indicate adsorption, association, or other complex phenomena
pH Dependence Studies
- Procedure: Measure CV responses across physiologically relevant pH range
- Data Analysis: Plot formal potential (E°') vs. pH
- Interpretation: Slope of -59 mV/pH indicates equal proton and electron transfer
Technical Considerations and Research Reagents
Essential Research Reagent Solutions
Successful CV analysis requires careful selection of supporting materials and reagents. Table 3 catalogues essential research reagents and their functions in CV experiments.
Table 3: Key Research Reagent Solutions for CV Experiments
| Reagent/Category | Function/Purpose | Examples & Specific Applications |
|---|---|---|
| Supporting Electrolytes | Provide ionic conductivity, control potential distribution | Acetate buffer (pH 4.5 for drug analysis) [74], phosphate buffer, tetrabutylammonium hexafluorophosphate (non-aqueous) [40] |
| Redox Probes | Electrode characterization, method validation | Ferrocene (non-aqueous reference) [40], potassium ferricyanide (aqueous systems) |
| Electrode Materials | Working electrode surfaces | Glassy carbon (general purpose) [74], carbon fiber microelectrodes (neurochemical sensing) [75], gold, platinum |
| Surface Modifiers | Enhance selectivity, prevent fouling | Nafion (cation exchanger), alkanethiols (self-assembled monolayers) [29], nanomaterials |
| Solvent Systems | Dissolve analytes, provide electrochemical window | Acetonitrile (wide potential window) [40], aqueous buffers (physiological relevance) |
Electrode selection significantly influences CV data quality. Glassy carbon electrodes offer a balance of reproducibility, surface renewability, and wide potential windows, making them ideal for pharmaceutical analysis [74]. Carbon fiber microelectrodes provide enhanced spatial resolution for specialized applications like neurotransmitter detection [75]. Increasingly, nanomaterials like carbon nanotubes and graphene are incorporated to enhance sensitivity and electron transfer kinetics.
Critical Technical Limitations and Mitigation Strategies
Despite its strengths, CV presents several technical limitations that researchers must acknowledge and address:
Charging Current Interference
- Nature of Problem: Non-faradaic currents from double-layer charging obscure faradaic signals, particularly at fast scan rates and low analyte concentrations [15]
- Impact: Reduced signal-to-noise ratio, inaccurate peak current measurements
- Mitigation Strategies: Background subtraction, use of microelectrodes, switching to pulse techniques for quantification
Uncompensated Resistance Effects
- Nature of Problem: Solution resistance between working and reference electrodes causes potential shift (IR drop) [15]
- Impact: Peak potential distortion, altered peak separation, incorrect kinetic parameters
- Mitigation Strategies: Electrode positioning, supporting electrolyte concentration, positive feedback compensation
Diffusion Regime Considerations
- Nature of Problem: CV theory assumes semi-infinite linear diffusion, violated in thin-layer cells or with nanoelectrodes [43]
- Impact: Altered current-potential responses, incorrect mechanistic interpretation
- Mitigation Strategies: Understand cell geometry, use appropriate theoretical models
Surface Fouling Issues
- Nature of Problem: Adsorption of reaction products or matrix components degrades electrode performance
- Impact: Signal decay, poor reproducibility, inaccurate kinetics
- Mitigation Strategies: Surface modification, regular electrode cleaning, rotating electrode systems
Cyclic voltammetry remains an indispensable technique in the electrochemical toolbox, occupying a unique position between rapid screening methods and highly sensitive quantification techniques. Its principal advantage lies in providing comprehensive mechanistic information through a relatively simple experimental setup. The technique's ability to rapidly characterize redox behavior, assess reaction reversibility, and identify coupled chemical reactions makes it the preferred initial approach for investigating new electrochemical systems.
The decision to select CV over alternative voltammetric techniques hinges primarily on analytical objectives. CV excels in situations requiring mechanistic insight, reversibility assessment, or initial system characterization. In pharmaceutical research specifically, CV provides critical early-stage information about drug candidate redox properties, informs formulation strategies, and guides development of more sensitive quantitative methods. However, when analytical requirements shift toward trace quantification, resolution of complex mixtures, or analysis in challenging matrices, pulse techniques like DPV and SWV offer superior performance.
Future directions in CV methodology continue to expand its applications. Advances in finite diffusion models enhance quantitative interpretation under spatial constraints [43]. Integration with complementary techniques like spectroelectrochemistry provides multidimensional analytical capabilities [22]. Miniaturization and array-based approaches enable high-throughput screening applications. Despite these advancements, CV's fundamental strength remains its unparalleled ability to reveal electrochemical mechanism—a capability that ensures its continued relevance across scientific disciplines.
Conclusion
Cyclic voltammetry remains an indispensable and dynamic technique in the researcher's toolkit, bridging fundamental electrochemistry with real-world applications. Its ability to provide rapid, sensitive, and multifaceted insights into redox processes makes it particularly valuable for accelerating innovation in drug development, renewable energy, and materials science. The integration of machine learning for data analysis and the ongoing development of advanced models for complex systems like finite diffusion promise to further enhance its speed and accuracy. As CV continues to evolve, its role in validating new pharmaceutical compounds, optimizing next-generation energy catalysts, and solving novel challenges in biomedicine and agriculture will only expand, solidifying its status as a cornerstone of modern analytical science.
References
- 1. Cyclic Voltammetry Basic Principles, Theory & Setup [https://www.ossila.com/pages/cyclic-voltammetry]
- 2. Cyclic Voltammetry - CV Electrochemical Technique ... [https://www.gamry.com/electrochemistry-applications/cv-cyclic-voltammetry/]
- 3. Three Electrode System: The Key To Electrochemical ... [https://iestbattery.com/case/introduce-the-three-electrode-system/]
- 4. Electrochemistry in a Two- or Three-Electrode ... [https://www.mdpi.com/2072-666X/14/4/722]
- 5. What Can Electrochemical Methods Offer in Determining ... [https://pmc.ncbi.nlm.nih.gov/articles/PMC8201389/]
- 6. Lab 1: Cyclic Voltammetry [https://chem.libretexts.org/Courses/University_of_California_Davis/CHE_115%3A_Instrumental_Analysis_-_Lab_Manual/Lab_1%3A_Cyclic_Voltammetry]
- 7. Use of voltammetric and chemometric tools to develop a ... [https://www.sciencedirect.com/science/article/pii/S2666831921000497]
- 8. Fabrication of a polishable and reusable triple electrode as ... [https://www.sciencedirect.com/science/article/pii/S2214180424000175]
- 9. Novel same-metal three electrode system for cyclic ... [https://pubs.rsc.org/en/content/articlelanding/2023/ra/d3ra00457k]
- 10. Three-Electrode Setups [https://pineresearch.com/support-article/three-electrode-setups/]
- 11. Cyclic Voltammetry [https://chem.libretexts.org/Bookshelves/Analytical_Chemistry/Supplemental_Modules_(Analytical_Chemistry)/Instrumentation_and_Analysis/Cyclic_Voltammetry]
- 12. pineresearch.com/support-article/ cyclic - voltammetry -cv [https://pineresearch.com/support-article/cyclic-voltammetry-cv/]
- 13. Cyclic Voltammetry - Data Analysis [https://www.basinc.com/manuals/EC_epsilon/Techniques/CycVolt/cv_analysis]
- 14. Cyclic voltammetry insights into Ni/Al-carbonate ... [https://www.nature.com/articles/s41598-025-96933-4]
- 15. Uses | How to Read a Voltammogram | Ossila Cyclic Voltammetry [https://www.ossila.com/pages/cyclic-voltammetry-applications]
- 16. Cyclic Voltammetry 3/4- What Information Can a CV Provide? [https://www.palmsens.com/knowledgebase-article/cyclic-voltammetry-what-information-can-a-cv-provide/]
- 17. High-Speed Cyclic Voltammetry Regressions Using ... [https://chemrxiv.org/engage/chemrxiv/article-details/67818b4d6dde43c9080b1d81]
- 18. Electroanalysis Advances in Pharmaceutical Sciences [https://www.mdpi.com/2673-4532/6/2/12]
- 19. Butler–Volmer equation [https://grokipedia.com/page/Butler%E2%80%93Volmer_equation]
- 20. 2.7: Electrochemistry [https://chem.libretexts.org/Bookshelves/Analytical_Chemistry/Physical_Methods_in_Chemistry_and_Nano_Science_(Barron)/02%3A_Physical_and_Thermal_Analysis/2.07%3A_Electrochemistry]
- 21. Integration analysis of the cyclic voltammograms ... [https://www.sciencedirect.com/science/article/abs/pii/S002207289900100X]
- 22. Progress and future directions in determining drugs using ... [https://www.sciencedirect.com/science/article/pii/S2949771X25000180]
- 23. Cyclic Voltammetry and Its Applications [https://www.intechopen.com/chapters/65380]
- 24. 4.2: Reversible and Irreversible Processes [https://phys.libretexts.org/Bookshelves/University_Physics/University_Physics_(OpenStax)/University_Physics_II_-_Thermodynamics_Electricity_and_Magnetism_(OpenStax)/04%3A_The_Second_Law_of_Thermodynamics/4.02%3A_Reversible_and_Irreversible_Processes]
- 25. Differentiate between reversible and irreversible processes ... [https://www.ck12.org/flexi/physical-science/specific-heat/differentiate-between-reversible-and-irreversible-processes-in-thermodynamics./]
- 26. Difference between Reversible and Irreversible processes ... [https://physics.stackexchange.com/questions/755353/difference-between-reversible-and-irreversible-processes-in-physics-vs-chemistr]
- 27. Cyclic Voltammetry Analysis Of Electrode Materials [https://iestbattery.com/cyclic-voltammetry-analysis-of-electrode-materials/]
- 28. A Comprehensive Guide to conduct Cyclic Voltammetry ... [https://mtxlabsglobal.com/guide-for-cyclic-voltammetry/]
- 29. Cyclic voltammetry, square wave voltammetry or ... [https://www.sciencedirect.com/science/article/pii/S2667160323000248]
- 30. What is CV? A comprehensive guide to Cyclic Voltammetry [https://www.biologic.net/topics/what-is-cv-a-comprehensive-guide-to-cyclic-voltammetry/]
- 31. Essential analysis of cyclic voltammetry of methanol ... [https://www.sciencedirect.com/science/article/abs/pii/S037877532100906X]
- 32. sciencedirect.com/topics/chemistry/ cyclic - voltammetry [https://www.sciencedirect.com/topics/chemistry/cyclic-voltammetry]
- 33. Cyclic Voltammetry Part 1: Fundamentals [https://www.jstage.jst.go.jp/article/electrochemistry/90/10/90_22-66082/_html/-char/en]
- 34. - Wikipedia Cyclic voltammetry [https://en.wikipedia.org/wiki/Cyclic_voltammetry]
- 35. Rapid screening of antioxidants in pharmaceutical ... [https://pubmed.ncbi.nlm.nih.gov/16472255/]
- 36. The use of cyclic for the evaluation of voltammetry ... antioxidant [https://pubmed.ncbi.nlm.nih.gov/10802216/]
- 37. (PDF) The use of cyclic for the evaluation of voltammetry ... antioxidant [https://www.academia.edu/1442005/The_use_of_cyclic_voltammetry_for_the_evaluation_of_antioxidant_capacity]
- 38. Effectiveness of Cyclic Voltammetry in Evaluation of the ... [https://www.mdpi.com/2304-8158/13/6/906]
- 39. FIA-ECD and Cyclic Voltammetry for antioxidant ... [https://www.sciencedirect.com/science/article/abs/pii/S0026265X25014870]
- 40. Comparative investigation of free radical scavenging and ... [https://www.nature.com/articles/s41598-025-12731-y]
- 41. Cyclic voltammetry for antioxidant assessment of moth ... [https://link.springer.com/article/10.1007/s11694-025-03266-x]
- 42. Cyclic voltammetry as a method for determining the viability of ... [https://bmcplantbiol.biomedcentral.com/articles/10.1186/s12870-025-07137-x]
- 43. Cyclic staircase voltammetry and cyclic ... [https://www.sciencedirect.com/science/article/pii/S0013468625005195]
- 44. a case study on silver maple (Acer saccharinum L.) [https://pubmed.ncbi.nlm.nih.gov/40813638/]
- 45. A Rapid and Quantitative Method for Determining Seed ... [https://pmc.ncbi.nlm.nih.gov/articles/PMC10574412/]
- 46. Recent advances in emerging techniques for non ... [https://www.sciencedirect.com/science/article/pii/S2589721719300054]
- 47. Voltammetric Determination of Amoxicillin Using a ... [https://pmc.ncbi.nlm.nih.gov/articles/PMC8099507/]
- 48. Electrochemical detection of sulfamethoxazole antibiotics ... [https://www.nature.com/articles/s41699-025-00555-3]
- 49. Conducting polymer based electrodes in metal-ion batteries [https://www.sciencedirect.com/science/article/abs/pii/S1364032125006550]
- 50. Electrically Conductive Functional Polymers and Application ... [https://pmc.ncbi.nlm.nih.gov/articles/PMC11944948/]
- 51. From batteries to biosensors: Conductive polymers make ... [https://www.cas.org/resources/cas-insights/conductive-polymers]
- 52. Molecular Electrocatalysis in Confined Spaces: Analysis of ... [https://pubmed.ncbi.nlm.nih.gov/40642307/]
- 53. Voltammetric detection of anticancer drug Doxorubicin at ... [https://www.sciencedirect.com/science/article/pii/S2666351120300334]
- 54. Diffusion controlled electrochemical analysis of MoS2 and ... [https://www.nature.com/articles/s41598-023-47730-4]
- 55. Electrochemical Measurements: Cyclic Voltammetry [https://www.nanoscience.com/techniques/electrochemistry/electrochemical-measurements-cyclic-voltammetry/]
- 56. Cyclic Voltammetry Part 2: Surface Adsorption, Electric ... [https://www.jstage.jst.go.jp/article/electrochemistry/90/10/90_22-66084/_html/-char/en]
- 57. Analysis of adsorption-related voltammograms [https://www.sciencedirect.com/science/article/pii/S1388248120301612]
- 58. Rapid Scan Cyclic Voltammetry (RSCV) investigation of ... [https://link.springer.com/article/10.1007/s44373-025-00034-w]
- 59. Key role of adsorption site abundance in the direct ... [https://link.springer.com/article/10.1186/s11671-024-04092-8]
- 60. Steering the catalyst structure and intermediates ... [https://www.nature.com/articles/s41467-025-65391-x]
- 61. Understanding iR Compensation [https://www.gamry.com/application-notes/instrumentation/understanding-ir-compensation/]
- 62. Fourier transform infrared spectroscopic technique for analysis ... [https://pubs.rsc.org/en/content/articlehtml/2025/na/d5na00522a]
- 63. in situ/operando insights into photoelectrocatalytic interfaces [https://pubs.rsc.org/en/content/articlehtml/2025/cc/d5cc01605c?page=search]
- 64. Research on the Characterization of Heterogeneous ... [https://ui.adsabs.harvard.edu/abs/2025JRSp...56..546W/abstract]
- 65. Single atom catalysts for electrocatalytic C–N coupling [https://www.sciopen.com/article/10.26599/NR.2025.94907530]
- 66. In situ characterization of semiconductor photocatalysts [https://www.sciencedirect.com/science/article/pii/S1369702125003086]
- 67. Electrochemical Methodologies for Investigating the ... [https://pmc.ncbi.nlm.nih.gov/articles/PMC9220340/]
- 68. Assays of antioxidant capacity: Optics and voltammetry [https://www.sciencedirect.com/science/article/pii/S1452398123197306]
- 69. Comparison of the Simple Cyclic Voltammetry (CV) and ... [https://pmc.ncbi.nlm.nih.gov/articles/PMC6268035/]
- 70. Antioxidant Determining Using Electrochemical Method [https://www.mdpi.com/2624-8549/5/3/131]
- 71. ExperimentCyclicVoltammetry Documentation [https://www.emeraldcloudlab.com/helpfiles/experimentcyclicvoltammetry]
- 72. A review of catalyst performance and novel reaction ... [https://www.sciencedirect.com/science/article/abs/pii/S0920586114002867]
- 73. Understanding linear sweep voltammetry and cyclic ... [https://www.metrohm.com/en/discover/blog/2025/lsv-and-cv-explained.html]
- 74. First voltammetric analysis of two possible anticancer drug ... [https://www.nature.com/articles/s41598-024-68309-7]
- 75. Frontiers | Carbon microelectrodes for the measurement of... [https://www.frontiersin.org/journals/bioengineering-and-biotechnology/articles/10.3389/fbioe.2025.1569508/full]