Combating Potentiometric Drift: From Foundational Causes to Advanced Solutions for Biomedical Research
This article provides a comprehensive analysis of potentiometric measurement drift, a critical challenge for researchers and drug development professionals relying on ion-selective electrodes (ISEs).
Combating Potentiometric Drift: From Foundational Causes to Advanced Solutions for Biomedical Research
Abstract
This article provides a comprehensive analysis of potentiometric measurement drift, a critical challenge for researchers and drug development professionals relying on ion-selective electrodes (ISEs). It explores the fundamental mechanisms behind signal instability, including the formation of detrimental water layers and temperature effects. The content details cutting-edge methodological advancements such as novel solid-contact materials and 3D-printing fabrication, alongside practical troubleshooting and optimization protocols for electrode maintenance and performance validation. By synthesizing foundational knowledge with applied strategies, this guide serves as an essential resource for achieving high-fidelity, reliable potentiometric data in complex biomedical applications, from therapeutic drug monitoring to continuous health diagnostics.
Understanding Potentiometric Drift: Core Mechanisms and Underlying Causes
Defining Potentiometric Drift and Its Impact on Data Integrity
Potentiometric drift is a gradual, undesirable change in the electrical potential output of a sensor over time, occurring without any corresponding change in the concentration of the target analyte being measured. This deviation compromises the accuracy and reliability of measurements, leading to systematic errors in data collection and interpretation [1] [2].
In the context of a broader thesis on measurement reliability, understanding drift is paramount. For researchers and drug development professionals, unchecked drift can corrupt experimental results, leading to flawed conclusions, wasted resources, and potential compliance issues in regulated environments. This technical support guide provides a comprehensive framework for diagnosing, understanding, and mitigating potentiometric drift in experimental settings.
Quantifying the Impact: Data Integrity Consequences
The consequences of potentiometric drift manifest across experimental data, affecting both immediate readings and long-term studies. The following table summarizes the primary types of data errors introduced by drift.
Table 1: Data Errors Caused by Potentiometric Drift
| Error Type | Description | Impact on Data Analysis |
|---|---|---|
| Bias | A systematic error that shifts all readings consistently higher or lower than the true value [2]. | Skews the entire dataset, leading to inaccurate mean values and incorrect estimation of analyte concentrations. |
| Increased Variance | Higher variability and noise in the data, even when the mean might be correct [2]. | Obscures real trends and changes, reduces statistical power, and makes it difficult to distinguish signal from noise. |
| Spurious Correlations | The introduction of false relationships between different measured variables [2]. | Can lead to incorrect conclusions about cause-and-effect, potentially invalidating research hypotheses. |
The real-world impact of these errors is significant. In therapeutic drug monitoring (TDM), where potentiometric sensors are used to measure drug concentrations with narrow therapeutic indices, drift can lead to incorrect dosage recommendations [3]. In environmental monitoring, drift can result in the underestimation of pollutant levels, creating false safety assurances [2].
Troubleshooting Guide: FAQs on Potentiometric Drift
This section addresses the most common questions and specific issues researchers encounter.
Q1: Why are my potentiometric readings consistently drifting upwards/downwards over several hours?
A consistent directional drift is often a sign of sensor aging or component degradation.
- Primary Cause: Aging of Sensor Components. Over time, the materials within the sensor degrade. For ion-selective electrodes (ISEs), this can involve the loss of sensitivity in the ion-selective membrane, the breakdown of internal adhesives and seals, or the slow dissolution of the reference electrode [1] [4].
- Underlying Mechanism: As the sensor components age, the internal standard potentials shift. This is a gradual process that manifests as a slow, continuous drift in the measured potential. Harsh conditions like extreme pH, temperature, or chemical exposure can dramatically accelerate this aging [4].
- Solution:
- Inspect the Sensor: Visually check for any physical damage, such as cracks in a glass membrane or clogged reference junctions [4].
- Perform a Slope Check: Calibrate the sensor and calculate the slope. A slope outside the acceptable range (e.g., 92-102% for a Nernstian response) indicates a need for sensor replacement [4].
- Replace the Sensor: If aging is confirmed, the sensor must be replaced. Unused pH electrodes, for example, have a shelf life of 12-18 months before degradation begins [4].
Q2: My sensor was working fine, but now the readings are unstable and erratic. What happened?
Erratic, non-directional instability is typically related to physical damage or contamination.
- Primary Cause: Physical Damage or Contamination. A cracked sensing bulb, a clogged liquid junction, or contamination of the reference electrolyte can cause random, fluctuating readings [1] [4].
- Underlying Mechanism: A clogged junction (a common issue with glass electrodes) disrupts the stable electrical connection between the reference system and the sample solution. Contamination alters the composition of the reference electrolyte, leading to unstable potential generation [4].
- Solution:
- Clean the Junction: For a clogged junction, follow manufacturer guidelines for cleaning with an appropriate solvent or solution.
- Inspect for Damage: Examine the sensing element (e.g., the glass bulb of a pH electrode) under magnification for microscopic cracks or scratches. A slow response time is a key indicator of a damaged bulb [4].
- Store Properly: Always store sensors according to manufacturer instructions, typically in a recommended storage solution to keep the membrane hydrated and prevent clogging [4].
Q3: How do environmental factors like temperature cause drift, and how can I compensate?
Temperature fluctuations are one of the most frequent causes of both temporary and permanent drift.
- Primary Cause: Temperature Fluctuations. Temperature changes cause materials within the sensor to expand or contract, altering its internal structure and electrical properties. It also directly affects the thermodynamics of the electrochemical reaction, as described by the Nernst equation [1].
- Underlying Mechanism: Temperature shifts alter the activity of ions in the solution and the equilibrium potentials of the electrodes. For instance, the neutral point of pure water shifts from pH 7.0 at 25°C to 7.47 at 0°C [4].
- Solution:
- Allow for Thermal Equilibrium: After a temperature change, allow the sensor and the sample sufficient time to stabilize before taking a measurement [4].
- Use Temperature Compensation: Employ sensors with built-in temperature probes and automated temperature compensation (ATC) algorithms.
- Control the Environment: Perform calibrations and measurements at a constant temperature wherever possible [4].
Q4: What are the best practices to minimize drift in long-term experiments?
Proactive maintenance and system design are key to managing drift over the long term.
- Strategy 1: Implement Regular Calibration. Schedule calibrations based on manufacturer guidelines and the required accuracy of your application. Use certified reference standards and maintain detailed records to track performance trends [1] [2].
- Strategy 2: Use Smart Sensors and Buffers. Modern solid-contact ion-selective electrodes (SC-ISEs) using nanomaterials like conductive polymers or carbon nanotubes demonstrate superior signal stability and reduced drift by providing a high capacitance solid-contact layer [3]. In solutions with low buffering capacity, adding a pH buffer can help resist drift caused by ambient CO₂ absorption [4].
- Strategy 3: Protect the Sensor. Use protective enclosures to shield sensors from harsh environments, dust, and moisture. In high-vibration settings, use isolation mounts to minimize mechanical stress and fatigue [1].
The Scientist's Toolkit: Research Reagent Solutions
The following table lists key materials and reagents used in advanced, low-drift potentiometric sensing, as identified in current research.
Table 2: Essential Research Reagents for Stable Potentiometric Sensors
| Reagent/Material | Function in Potentiometric Sensing | Research Context |
|---|---|---|
| Conducting Polymers (e.g., PEDOT, PANI) | Acts as a solid-contact (ion-to-electron transducer) in SC-ISEs, replacing the unstable inner filling solution. Reduces signal drift and facilitates miniaturization [3]. | Used in the development of stable, mass-producible solid-contact sensors [3] [5]. |
| Carbon-based Nanomaterials (e.g., MWCNTs, Graphene) | Serves as a high-surface-area solid-contact transducer. Enhances capacitance and stability, leading to lower drift [3]. | Nanocomposites are explored to create a synergetic effect, improving sensitivity and reducing signal drift [3]. |
| Ionophores | The selective recognition element within the ion-selective membrane. It specifically binds to the target ion, generating the potentiometric signal [3]. | The core of any ion-selective electrode; research focuses on synthesizing new ionophores for different analytes like Na⁺, K⁺, and Li⁺ [3] [5] [6]. |
| Ionic Liquids (e.g., [N2225][NTf₂]) | Used as a stable salt bridge electrolyte in differential potentiometry. Helps cancel out liquid junction potentials, especially in non-aqueous solvents [7]. | Critical for establishing reliable potentiometric measurements in low-polarity organic solvents, a challenging environment [7]. |
| UV-Curable Resins | The base material for 3D-printing sensor components via stereolithography. Allows for rapid prototyping and fabrication of complex sensor designs [5]. | Enables the creation of fully 3D-printed sensors with tailored hydrophobicity and stability, demonstrating the future of sensor manufacturing [5]. |
Experimental Protocols for Drift Diagnosis and Correction
Protocol 1: Diagnosing Sensor Health via Slope and Offset
This is a fundamental quantitative check for the viability of an ion-selective or pH electrode [4].
- Calibration: Calibrate the sensor using at least two standard buffer solutions that bracket your expected measurement range (e.g., pH 4.00 and 7.00).
- Calculate the Slope: The sensor's response should follow the Nernst equation. For a monovalent ion, the theoretical slope at 25°C is approximately 59.16 mV/decade. Calculate the actual slope as a percentage of the theoretical slope.
- Acceptable Range: 92% - 102% [4].
- Out-of-Range Indication: A low slope indicates an aged or contaminated sensor.
- Check the Offset: Measure the millivolt (mV) reading in pH 7.00 buffer.
- Acceptable Range: Typically within 0 ± 30 mV [4].
- Out-of-Range Indication: A large offset suggests a damaged reference system or a clogged junction.
Protocol 2: Advanced Drift Correction Using Mathematical Modeling
For data already affected by drift, post-processing algorithms can be applied. It is critical to note that these are corrections, not replacements for proper sensor maintenance, and their effectiveness is limited for strongly non-stationary systems [8].
- Linear Correction: Assumes the drift is linear over time. A baseline is established, and a linear correction factor is subtracted from all data points.
- Polynomial Correction: Uses a polynomial equation to model more complex, non-linear drift patterns, offering greater flexibility than linear correction [2].
- Kalman Filtering: A recursive algorithm optimal for real-time applications. It estimates the "true" signal by combining a series of noisy measurements, taking into account the known drift characteristics of the system [2].
Important Consideration: Research shows that while drift correction can improve data, it cannot always generate data that is fully consistent with fundamental physical laws (Kramers-Kronig relations) for systems that are inherently unstable during measurement [8].
Visualizing Drift Mitigation: Experimental Workflow
The following diagram illustrates a logical workflow for diagnosing and addressing potentiometric drift, integrating the FAQs and protocols from this guide.
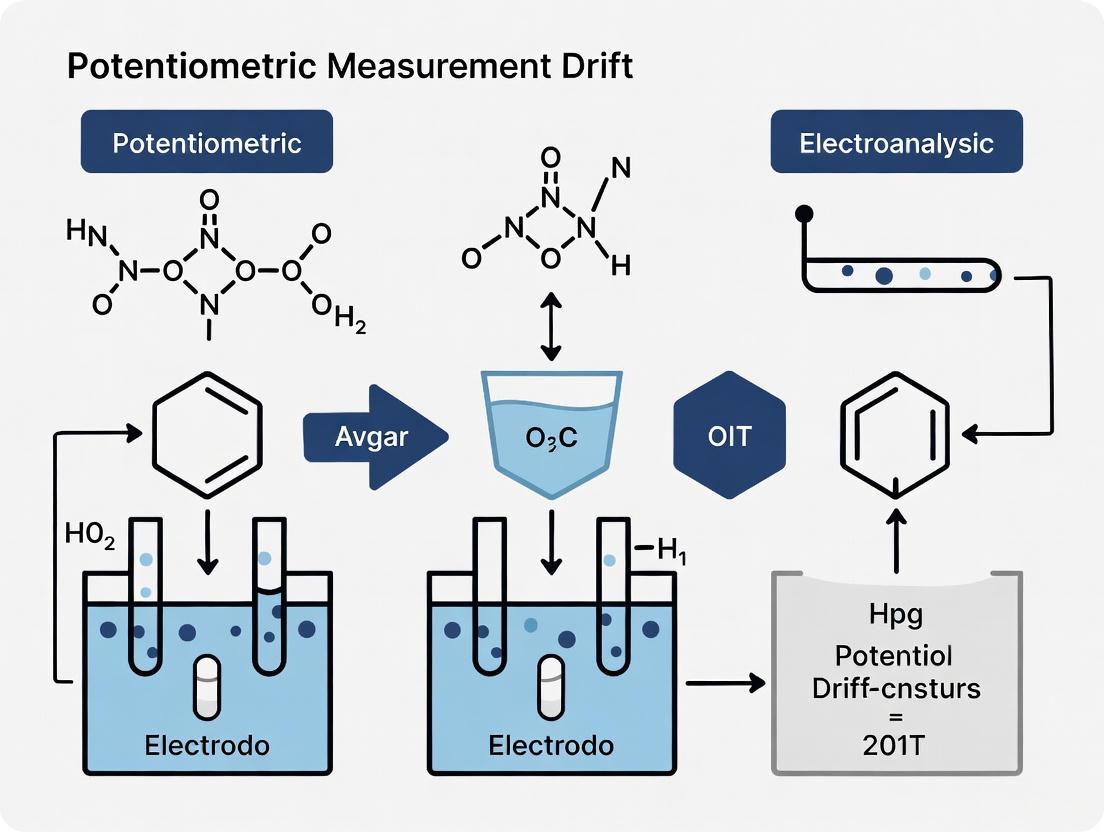
A primary challenge in the development of reliable solid-contact ion-selective electrodes (SC-ISEs) is the formation of an aqueous layer between the ion-selective membrane (ISM) and the underlying solid-contact material. This thin water layer, which can form due to water uptake through the polymeric membrane, creates an unstable water film that acts as an unintended reservoir for ions. The presence of this layer fundamentally compromises the potentiometric response stability of the sensor, leading to measurement drift and poor reproducibility [9].
The aqueous layer introduces a separate liquid junction potential that is highly sensitive to changes in the sample composition, particularly variations in carbon dioxide levels or pH. This unwanted electrolyte solution between the transducer and the ISM prevents the establishment of a well-defined, stable potentiometric signal, making it a critical issue that researchers and developers must address to create robust sensors for pharmaceutical and clinical applications [9].
Frequently Asked Questions (FAQs)
Q1: What is the aqueous layer, and why does it cause instability in solid-contact ISEs?
The aqueous layer is a thin water film that forms between the ion-selective membrane and the solid-contact transducer material in SC-ISEs. This layer creates an unintended reservoir that allows ions to accumulate and exchange slowly, leading to signal drift and long-term instability. Unlike the controlled inner filling solution in conventional ISEs, this water layer is uncontrolled and changes with the sample history and environmental conditions, resulting in inconsistent potential readings that reduce measurement reliability [9].
Q2: How can I detect if my solid-contact ISE has developed a significant aqueous layer?
The most telling indicator of aqueous layer formation is a pronounced potential drift under constant experimental conditions, even when the target ion concentration remains unchanged. This drift typically manifests as a gradual shift in baseline readings over time. Another diagnostic method involves exposing the sensor to a solution containing a known interfering ion and observing the resulting potential hysteresis - a delayed return to baseline potential after the interference is removed indicates significant aqueous layer formation [9].
Q3: What materials and strategies are most effective for preventing aqueous layer formation?
The most effective approach involves using highly hydrophobic solid-contact materials that repel water penetration. Key materials include:
- Conducting polymers like poly(3-octylthiophene-2,5-diyl) (POT) and polypyrrole (PPy) [10] [9]
- Carbon-based nanomaterials (e.g., graphene, carbon nanotubes) with high hydrophobicity [9]
- Hydrophobic ionic liquids and molybdenum disulfide nanocomposites [10]
These materials create a barrier that prevents water accumulation while maintaining efficient ion-to-electron transduction [9].
Q4: How does the aqueous layer specifically affect the reproducibility of SC-ISEs in drug development applications?
In drug development, where precise ion concentration measurements are critical for formulation stability and bioavailability studies, the aqueous layer introduces irreproducible baseline shifts between measurements. This variability is particularly problematic when analyzing multiple samples over extended periods, as it compromises the ability to make reliable comparisons. The resulting inconsistencies can affect the assessment of critical quality attributes in pharmaceutical products, potentially leading to inaccurate conclusions about drug formulation performance [9].
Troubleshooting Guide: Identifying and Mitigating Aqueous Layer Issues
Symptoms of Aqueous Layer Formation
The following table outlines common experimental observations indicating aqueous layer problems:
| Symptom | Experimental Manifestation | Underlying Mechanism |
|---|---|---|
| Potential Drift | Gradual change in measured potential under constant conditions [9] | Slow ion exchange and redistribution within the aqueous layer |
| Reduced Reproducibility | Inconsistent readings for identical samples measured at different times [9] | Variations in the composition and volume of the aqueous layer |
| Extended Response Time | Slower stabilization after calibration or sample change [11] | Additional time required for ion equilibration across the water layer |
| Memory Effects | Influence of previous sample on current measurement [11] | Retention of ions from previous samples in the aqueous layer |
Material Selection and Fabrication Solutions
Selecting appropriate materials is crucial for preventing aqueous layer formation. The table below compares key solid-contact materials and their effectiveness:
| Material Class | Example Materials | Key Properties | Effectiveness Against Aqueous Layer |
|---|---|---|---|
| Conducting Polymers | PEDOT, PPy, POT, PANI [9] | Redox capacitance, moderate hydrophobicity | Moderate to High (with proper polymerization) |
| Carbon Nanomaterials | Graphene, CNTs, fullerene [9] | High double-layer capacitance, tunable hydrophobicity | High (with appropriate functionalization) |
| Nanocomposites | POT-MoS2, PPy-Clay [10] [9] | Synergistic properties, enhanced hydrophobicity | Very High |
| Hydrophobic Ionic Liquids | Quaternary ammonium salts [9] | High hydrophobicity, plasticizing effects | High |
Experimental Protocols for Aqueous Layer Detection
Protocol 1: Potential Drift Measurement for Aqueous Layer Assessment
This protocol evaluates the formation and extent of an aqueous layer by monitoring potential stability under controlled conditions.
- Sensor Conditioning: Condition the SC-ISE in a 0.01 M solution of the primary ion for 2 hours before measurement [12] [11].
- Baseline Establishment: Immerse the sensor in a stable reference solution (e.g., 0.01 M KCl for potassium ISE) with constant stirring at slow to moderate speed [12].
- Potential Recording: Record the potential at 5-second intervals for 60 minutes while maintaining constant temperature (±0.5°C) [13].
- Drift Calculation: Calculate the potential drift as mV/hour from the slope of the potential versus time plot.
- Interpretation: A drift exceeding 10 µV/hour suggests significant aqueous layer formation requiring intervention [9].
Protocol 2: Light-Interference Test for Aqueous Layer Detection
This method utilizes the light-addressable nature of the aqueous layer to confirm its presence.
- Experimental Setup: Place the SC-ISE in a light-protected Faraday cage with controlled temperature.
- Baseline Measurement: Record the potential in a reference solution under constant conditions until stable.
- Light Exposure: Expose the sensor to a focused LED light source (wavelength 450-550 nm) for 30 seconds.
- Potential Monitoring: Monitor potential changes during and after light exposure.
- Result Interpretation: A significant potential shift (>0.5 mV) upon light exposure indicates the presence of a photosensitive aqueous layer [9].
Mechanism of Aqueous Layer Formation and Its Consequences
The aqueous layer formation follows a specific mechanism that leads to signal instability, as illustrated below:
This formation mechanism leads to the following consequences in SC-ISE performance:
Uncontrolled Ion Exchange: The aqueous layer creates an unintended ion reservoir that allows continuous exchange of primary and interfering ions, leading to slow potential drift as equilibrium shifts over time [9].
CO₂ Sensitivity: The water layer absorbs carbon dioxide from the environment or samples, forming carbonic acid that alters local pH and indirectly affects the potential measurement through changes in hydrogen ion activity [9].
Oxygen Interference: Dissolved oxygen in the aqueous layer can participate in redox reactions, particularly with conducting polymer-based transducers, creating an additional source of potential instability [9].
Material Solutions and Experimental Workflow
The development of aqueous-layer-free SC-ISEs requires a systematic approach to material selection and sensor fabrication, as shown in the workflow below:
The Scientist's Toolkit: Essential Research Reagents and Materials
The table below provides a comprehensive overview of key materials used in developing stable, aqueous-layer-free SC-ISEs:
| Category | Specific Materials | Function/Application | Performance Characteristics |
|---|---|---|---|
| Solid-Contact Materials | Poly(3-octylthiophene-2,5-diyl) (POT) [9] | Ion-to-electron transducer | High redox capacitance, excellent hydrophobicity |
| Polypyrrole (PPy) [10] [9] | Conducting polymer solid contact | Good transducer, moderate hydrophobicity | |
| Poly(3,4-ethylenedioxythiophene) (PEDOT) [9] | High-performance transducer | Superior conductivity, stability | |
| Nanocomposites | Molybdenum disulfide (MoS₂) with POT [10] | Enhanced solid contact | Synergistic hydrophobicity and capacitance |
| Carbon nanotubes-PEDOT composites [9] | Nanostructured transducer | High surface area, dual capacitance mechanism | |
| Membrane Components | TDMA-based ion-selective membranes [10] | Nitrate-selective membrane | Selective ion recognition |
| High-molecular-weight PVC [11] [14] | Polymer matrix | Mechanical stability, controlled diffusion | |
| Hydrophobic Additives | Carbon nanomaterials [9] | Water-repellent additives | Create tortuous path against water penetration |
| Ionic liquids [9] | Multifunctional additives | Hydrophobicity and plasticizing effects |
Quantitative Performance Data and Stability Metrics
Research studies have demonstrated significant improvements in SC-ISE stability through implementation of advanced materials that prevent aqueous layer formation. The table below summarizes key performance metrics from recent studies:
| Sensor Configuration | Potential Drift (μV/h) | Stability Duration | Aqueous Layer Test Results | Reference |
|---|---|---|---|---|
| POT/MoS₂ Nanocomposite | < 10 μV/h | Up to 8 days | No detectable aqueous layer | [10] [9] |
| PEDOT:PSS Solid Contact | 10-50 μV/h | 3-5 days | Minimal aqueous layer formation | [9] |
| Conventional Coated Wire | > 100 μV/h | Hours | Significant aqueous layer | [9] |
| PPy-based Solid Contact | 10 μV/h | 8 days | Greatly reduced aqueous layer | [9] |
The reproducibility of properly designed aqueous-layer-free SC-ISEs has been demonstrated in real-sample applications. Recent research on all-solid-state nitrate sensors showed a reproducibility of ±3 mg/L in drinking water samples, making them suitable for precise environmental and pharmaceutical measurements [10].
Core Concepts: Understanding Drift and the Role of Hydrophobicity
What is potential drift in solid-contact ion-selective electrodes (SC-ISEs), and why is it a problem? Potential drift is a slow, unpredictable change in the measured potential of a sensor over time, even when the concentration of the target ion remains constant. For researchers, this manifests as a gradual shift in the baseline signal, compromising the accuracy and long-term reliability of measurements. In the context of drug development, this can lead to inaccurate potency assessments or stability studies. This drift is primarily caused by the formation of an undesired water layer between the ion-selective membrane (ISM) and the underlying solid transducer surface [15] [9]. This aqueous layer acts as a reservoir for ions, where uncontrolled exchange and re-equilibration with the sample solution occur, leading to an unstable potential at the membrane-transducer interface [16].
How does transducer hydrophobicity prevent this? A highly hydrophobic (water-repellent) transducer material fundamentally prevents the formation and persistence of this water layer. Hydrophobicity minimizes the transducer's affinity for water, effectively "locking out" water molecules from the critical interface. Research on 3D-printed carbon-based transducers has shown that manipulating material properties related to hydrophobicity, such as print angle and thickness, is directly linked to achieving highly stable sensors with low potential drift [5]. By creating a barrier to water accumulation, a hydrophobic transducer ensures that the potential-determining process remains confined to the ion-selective membrane, resulting in a stable and reproducible signal.
Table 1: Impact of Hydrophobic Transducers on Sensor Performance as Documented in Recent Research
| Transducer Material | Reported Drift/Stability Performance | Key Hydrophobic Mechanism | Application Context |
|---|---|---|---|
| Graphene Nanoplatelets | Prevents water layer formation; stabilizes potential response [15] | High intrinsic hydrophobicity and high electrical capacitance [17] | Pharmaceutical analysis (e.g., Donepezil, Memantine, Bupropion) [15] [17] |
| Multi-Walled Carbon Nanotubes (MWCNTs) | Enhances potential stability by mitigating drift; prevents water layer formation [16] | Hydrophobic nature forms a protective layer at the interface [16] | Determination of silver ions from pharmaceutical formulations [16] |
| 3D-Printed Carbon-Infused PLA | Highly stable (~20 μV/hour drift) [5] | Tunable hydrophobicity via print parameters (angle, thickness) [5] | Sodium ion determination in biological fluids like saliva [5] |
| Graphene/Cobalt Hexacyanoferrate Composite | Improves and stabilizes measured potential [17] | Composite structure prevents aqueous layer formation beneath the sensing membrane [17] | Selective determination of Bupropion [17] |
Troubleshooting Guide: FAQs on Hydrophobicity and Drift
FAQ 1: My sensor's baseline consistently drifts upward over several hours. Is this a sign of water layer formation, and how can I confirm it? A consistent, slow drift is a classic symptom of water layer formation at the transducer interface. To confirm this, a water layer test can be performed [16]. This involves exposing the sensor to a solution of a highly lipophilic ion (e.g., a large organic ion) that cannot easily penetrate the ion-selective membrane. If a water layer is present, this lipophilic ion will slowly partition into it, causing a significant and slow potential shift. A sensor with a properly hydrophobic transducer will show minimal response in this test, confirming the absence of a significant water layer.
FAQ 2: I am using a carbon-based transducer, but I still observe significant drift. What are the potential causes? While carbon materials are generally hydrophobic, several factors can compromise their performance:
- Incomplete Surface Coverage: If the transducer layer is porous or uneven, it may not form a continuous hydrophobic barrier, allowing water to penetrate. Using nanomaterials with high surface area and ensuring a uniform coating is crucial [9].
- Material Purity and Functionalization: The presence of hydrophilic functional groups (e.g., oxygen-containing groups) on the carbon material can increase its water affinity. Using pristine graphene or thoroughly reduced graphene oxide is often preferable for maximizing hydrophobicity [17].
- Poor Adhesion: Delamination between the transducer and the membrane or the underlying electrode can create micro-scale cavities where water can accumulate.
FAQ 3: Beyond material selection, how can I experimentally enhance the hydrophobicity of my sensor? Recent research points to several advanced strategies:
- Integrate Hydrophobic Additives: Hydrophobic deep eutectic solvents (HDESs) have been successfully incorporated into polymeric membranes. One study found that adding 5% wt. of a terpene-based HDES significantly improved sensor performance, including a lower detection limit, by increasing the membrane's overall hydrophobicity [18].
- Engineer Surface Morphology: The hydrophobicity of a material is not only defined by its chemistry but also by its physical texture. As demonstrated with 3D-printed transducers, parameters like print angle and layer thickness can be tuned to create micro-structured surfaces that enhance hydrophobic properties [5].
- Utilize Composite Transducers: Combining materials can synergistically improve hydrophobicity. For instance, a composite of graphene and cobalt hexacyanoferrate nanoparticles has been used as a transducer, where the graphene provides a hydrophobic base and the composite structure further enhances stability [17].
FAQ 4: My sensor works well in simple lab solutions but drifts in complex biological samples. Why? Complex samples like plasma or saliva contain surfactants, proteins, and lipids that can foul the sensor surface. Biofouling can alter the local surface chemistry, effectively reducing hydrophobicity and promoting water uptake. To address this, consider applying an anti-fouling coating. For example, one study created a highly effective anti-fouling potentiometric sensor by applying a self-adhesive coating of waterborne polyurethane containing a biocide, which drastically reduced bacterial adhesion and maintained long-term stability in challenging environments like seawater [19].
Experimental Protocols & Methodologies
Protocol 1: Fabricating a Graphene-Based Hydrophobic Solid-Contact Transducer
This protocol is adapted from methods used for pharmaceutical analysis of drugs like Donepezil and Bupropion [15] [17].
- Electrode Substrate Preparation: Begin with a glassy carbon electrode (GCE). Polish the GCE surface sequentially with alumina slurries of decreasing particle size (e.g., 1.0 μm, 0.3 μm, and 0.05 μm) on a micro-cloth pad. Rinse thoroughly with deionized water after each polishing step.
- Graphene Dispersion: Disperse graphene nanoplatelets in a suitable solvent. Some studies use non-ionic surfactants like Tween 80 above the critical micelle concentration to create a homogenous and stable aqueous dispersion [17].
- Transducer Layer Deposition: Drop-cast a precise volume (e.g., 5-10 μL) of the well-dispersed graphene suspension onto the polished surface of the GCE.
- Drying and Curing: Allow the solvent to evaporate under ambient conditions or under a gentle infrared lamp to form a uniform, dry graphene nanoplatelet film. This layer acts as the hydrophobic ion-to-electron transducer.
Protocol 2: Water Layer Testing (Lipophilic Ion Test)
This is a standard method to diagnose the presence of an undesired water layer [16].
- Conditioning: Condition the fabricated SC-ISE and a suitable reference electrode in a dilute solution of the primary ion (e.g., 1.0 x 10⁻³ M) for at least 30 minutes.
- Baseline Recording: Place the sensor pair in a well-stirred sample of the same primary ion solution and record a stable baseline potential.
- Lipophilic Ion Exposure: Switch the solution to one containing a high concentration (e.g., 1.0 x 10⁻² M) of a lipophilic ion, such as tetraalkylammonium salt. Do not add the primary ion to this new solution.
- Potential Monitoring: Monitor the potential response over time (typically 1-2 hours).
- Interpretation: A significant potential drift (several millivolts) indicates that the lipophilic ions are permeating and changing the composition of a water layer between the membrane and the transducer. A stable potential suggests a effectively hydrophobic transducer with no significant water layer.
Workflow Diagram: Transducer Hydrophobicity in SC-ISE Mechanism
The following diagram illustrates the critical role of a hydrophobic transducer in preventing the water layer and ensuring signal stability.
Stable Sensor Mechanism
The Scientist's Toolkit: Key Research Reagents & Materials
Table 2: Essential Materials for Fabricating Hydrophobic Transducers in SC-ISEs
| Material / Reagent | Function / Role | Specific Examples |
|---|---|---|
| Graphene Nanoplatelets | Hydrophobic ion-to-electron transducer; prevents water layer formation [15] [17] | 6–8 nm thick, 5 μm wide nanoplatelets [15] |
| Multi-Walled Carbon Nanotubes (MWCNTs) | Hydrophobic transducer layer; enhances signal stability and prevents water layer [16] | MWCNT powder used in screen-printed electrodes [16] |
| Hydrophobic Deep Eutectic Solvents (HDES) | Membrane additive; increases overall hydrophobicity, lowers detection limit [18] | Terpene-based (e.g., Menthol, Thymol) with Octanoic Acid [18] |
| Conducting Polymers | Ion-to-electron transducer (redox capacitance mechanism) [9] | PEDOT, Polypyrrole, Polyaniline [9] |
| Ion-Selective Membrane Components | Forms the primary sensing layer; provides analyte selectivity [15] [16] | Polyvinyl Chloride (PVC), plasticizers (e.g., NPOE), ionophores (e.g., Calix[n]arene) [15] [16] |
Troubleshooting Guides
Guide to Diagnosing and Resolving Temperature-Related Potentiometric Drift
Q1: Why does my potentiometric measurement exhibit a continuous, gradual drift over time, and how can I determine if temperature is the cause?
A gradual drift in potentiometric measurements is a common issue often linked to temperature fluctuations. The electrode potential is intrinsically temperature-dependent, as described by the Nernst equation. To diagnose this, follow these steps [20]:
Step 1: Visual Inspection and System Setup Check
- Ensure the electrode, sample, and calibration buffers are at thermal equilibrium. Rapid temperature changes cause hydrogen ion activity to shift, leading to drift until equilibrium is reached [20] [21].
- Verify that your sensor utilizes Automatic Temperature Compensation (ATC). Note that ATC compensates for the electrode's temperature coefficient but not for actual chemical changes in the solution, such as temperature-dependent dissociation. The sensor and solution must be at the same temperature for accurate compensation [20].
Step 2: Calibration and Slope Analysis
- Always calibrate with fresh buffers that are at room temperature and at the same temperature as your sample measurements [20].
- Calculate the electrode slope after calibration. A slope outside the ideal Nernstian range (e.g., 59 mV/decade for a single-electron transfer at 25°C) can indicate an aging or contaminated electrode, but it can also be symptomatic of unresolved temperature effects [20] [21].
Step 3: Isolate the Source of Drift
- Sensor vs. Solution: To determine if the drift originates from the sensor or the solution itself, place the electrode in a stable, well-buffered solution (e.g., pH 7 buffer) for an extended period (e.g., one hour). If the drift persists, the issue is likely related to the sensor or its reference electrolyte. If the reading stabilizes, the drift is likely due to chemical instability in your sample, which can be exacerbated by temperature changes [20].
- Sample Properties: Be aware that samples with low ionic strength (e.g., pure water, reverse osmosis water) have minimal buffering capacity. They are highly susceptible to pH drift from ambient influences, such as the absorption of atmospheric CO₂, a process whose rate and equilibrium are temperature-dependent [21].
Q2: How can I fix drift caused by a temperature gradient between my sensor and solution?
The following workflow provides a systematic method to resolve this common issue:
Q3: The slope of my ion-selective electrode is lower than the theoretical Nernstian value. Is temperature a factor?
Yes, temperature directly affects the slope. The Nernst equation shows that the theoretical slope is proportional to the absolute temperature (T): Slope = 2.303 RT/zF [22] [23]. A lower-than-expected slope can be caused by:
- Aging or contaminated electrode: The primary cause is often a degraded sensor [20] [21].
- Temperature mismatch during calibration: If the electrode was calibrated at one temperature and used at another, the slope will be incorrect.
- Insufficient temperature control: Recent research demonstrates that locally heating an ion-selective membrane can modulate its response. One study showed that a temperature pulse increased the slope of a copper-selective electrode from 31 mV to 43 mV per 10-fold activity change [24]. This confirms that uncontrolled temperature variations can directly impact the observed slope.
Advanced Technique: Temperature Pulse Potentiometry (TPP)
Q4: Are there advanced experimental methods that use temperature to enhance potentiometric measurements?
Yes, Temperature Pulse Potentiometry (TPP) is an emerging methodology that uses controlled thermal excitation to improve sensor performance [24].
Experimental Protocol for TPP [24]:
- Apparatus: An all-solid-state ion-selective electrode is required. The substrate integrates a heating circuitry, such as a meander-shaped element from Low-Temperature Co-fired Ceramic (LTCC) technology.
- Sensor Fabrication: A conducting polymer (e.g., poly(3-octylthiophene)) is cast onto the heated substrate as an ion-to-electron transducer. An ion-selective membrane cocktail is then deposited on top via spin-coating.
- Measurement Cycle:
- Apply a defined voltage pulse to the heating meander for a specific duration (e.g., 20 seconds) to raise the local electrode temperature.
- Record the potential during this heated period.
- Allow a cooling interval (e.g., 50 seconds) followed by a stabilization period to return to the baseline potential.
- Data Analysis: The potential pulse upon heating changes as a function of ion activity. This provides a peak-shaped analytical signal, which can improve the limit of detection and serve as an additional dimension for measurement.
Frequently Asked Questions (FAQs)
Q1: What is the fundamental relationship between temperature and electrode potential? The electrode potential is governed by the Nernst equation: E = E° - (RT/zF) ln(Q) [22] [23] [25], where:
- E is the measured potential
- E° is the standard potential
- R is the universal gas constant
- T is the absolute temperature in Kelvin
- z is the number of electrons transferred
- F is the Faraday constant
- Q is the reaction quotient This equation shows that the potential has a linear dependence on temperature for a given reaction quotient Q.
Q2: How much does the potential change per degree Celsius? The change is dependent on the number of electrons (z) in the redox reaction. A useful approximation at room temperature is:
- For a one-electron (z=1) process, the potential changes by approximately 0.059 mV/°C per decade of concentration change.
- For a two-electron (z=2) process, the change is approximately 0.030 mV/°C per decade [22]. The exact value is calculated as (R/zF) ln(Q). For a full cell, the net temperature coefficient depends on the respective coefficients of the anode and cathode reactions.
Q3: My measurements are in a noisy industrial environment. Could temperature be interacting with this noise? Indirectly, yes. Temperature fluctuations can cause physical expansion/contraction in fixtures and connections, potentially leading to intermittent electrical contacts. Furthermore, pH and other ion-selective electrodes have high impedance, making them susceptible to electrical interference from motors or heaters. This noise can manifest as a drifting reading. Using shielded cables and ensuring all connections are secure can mitigate this [20] [21].
Q4: How does temperature affect the standard potential (E°) of a cell? The standard potential (E°) itself is a function of temperature because it is related to the standard Gibbs free energy (ΔG° = -nFE°). The temperature dependence of ΔG° means that E° shifts with temperature. This is distinct from the explicit "RT/nF" term in the Nernst equation and must be considered for highly precise work across a wide temperature range.
The following tables summarize key quantitative relationships and experimental data related to temperature effects.
Table 1: Nernst Equation Temperature Dependence Parameters [22] [23] [25]
| Parameter | Symbol | Value & Units | Note |
|---|---|---|---|
| Universal Gas Constant | R | 8.314462618 J·K⁻¹·mol⁻¹ | |
| Faraday Constant | F | 96,485.33212 C·mol⁻¹ | |
| Thermal Voltage (at 25°C / 298.15K) | V_T = RT/F | 25.693 mV | Pre-exponential factor in natural log form |
| Nernst Slope (at 25°C / 298.15K) | 2.303 RT/F | 59.16 mV | Pre-exponential factor in base-10 log form for z=1 |
| Temperature Coefficient (z=1) | (R/zF)ln(Q) | ~0.059 mV/°C per decade | Approximate near room temperature |
| Temperature Coefficient (z=2) | (R/zF)ln(Q) | ~0.030 mV/°C per decade | Approximate near room temperature |
Table 2: Experimental Temperature Coefficient Data from Literature
| System / Component | Configuration | Temperature Coefficient | Reference / Context |
|---|---|---|---|
| Copper Ion-Selective Electrode | Potentiometric (slope) | Increased from 31 mV to 43 mV per decade with heating [24] | Temperature Pulse Potentiometry (TPP) experiment |
| Digital Potentiometer (DS1845) | Variable Resistor Mode | ~750 ppm/°C (e.g., 0.075%/°C) [26] | Electronic component reference |
| Digital Potentiometer (DS1845) | Voltage Divider Mode | ~10 ppm/°C (e.g., 0.001%/°C) [26] | Electronic component reference |
The Scientist's Toolkit: Research Reagent Solutions
Table 3: Essential Materials for Potentiometric Experiments with Temperature Control
| Item | Function / Explanation |
|---|---|
| Automatic Temperature Compensation (ATC) Probe | A separate sensor that measures solution temperature and provides a signal to the meter to correct for the electrode's inherent temperature coefficient [20]. |
| Thermostated Electrochemical Cell | A jacketed cell connected to a recirculating water bath to maintain a constant temperature for both the sample and electrode, crucial for eliminating drift. |
| Ion-selective Membrane Components | Ionophore: Provides selectivity for the target ion [24]. Ionic Additives (e.g., NaTFPB): Optimizes membrane potential response and lowers detection limit [24]. Polymer Matrix (e.g., MMA-DMA): Forms the inert body of the sensing membrane [24]. |
| Conducting Polymer (e.g., PEDOT, POT) | Serves as a solid contact in all-solid-state electrodes, transducing ion flux in the membrane to electron flow in the circuit. Critical for advanced techniques like TPP [24]. |
| Fresh, Certified Buffer Solutions | Used for calibration. Must be at the same temperature as the samples to establish a correct calibration curve and avoid slope errors [20]. |
| High-Ionic-Strength Storage Solution | Prevents dehydration of the ion-selective membrane. Storing an electrode dry causes drift and irreversible damage. A solution like 3.0 M KCl is typically used [20] [21]. |
Theoretical and Experimental Pathways
The core relationship between temperature and measurement error can be visualized through the following pathway, which integrates both fundamental theory and practical experimental manifestations.
Interfering Ions and Selectivity Challenges in Complex Matrices
Frequently Asked Questions (FAQs)
Q1: What are the primary sources of interfering ions in potentiometric measurements? Interfering ions originate from the sample matrix itself. Complex samples, such as biological fluids, environmental waters, or pharmaceutical formulations, contain numerous compounds and ions with similar chemical properties to your target analyte. These interferents can compete for the ionophore binding site in the sensor membrane, leading to inaccurate readings [27] [28].
Q2: How do I know if my sensor is suffering from interference? Signs of interference include a sluggish or unstable potential response, a calibration slope that deviates significantly from the theoretical Nernstian value, poor reproducibility between measurements, and super-Nernstian responses (a slope greater than expected). These symptoms suggest that interferents are affecting the phase-boundary potential at the membrane-solution interface [29] [30].
Q3: Can I use a sensor with known interferents for my analysis? Yes, provided you properly characterize and mitigate the interference. This involves determining the potentiometric selectivity coefficient (( K{A,B}^{pot} )) to understand the sensor's relative response to the interferent versus the primary ion. If the concentration of the interferent is relatively low and its ( K{A,B}^{pot} ) is very small, accurate measurement may still be possible. For critical measurements, employing a standard addition method or backside calibration potentiometry can help correct for these effects [30] [31].
Q4: What is the best way to store ion-selective electrodes to maintain their selectivity? Proper conditioning is crucial for stability and reproducibility. Sensors should be stored in a solution containing their primary ion (e.g., a dilute solution of the analyte). Studies on nitrate sensors have demonstrated that even after dry storage for one month, a sufficiently long conditioning period can restore excellent performance and signal reproducibility [10].
Q5: Are there strategies to improve selectivity during sample preparation? Absolutely. Sample preparation is a key first line of defense. Techniques like Solid-Phase Extraction (SPE) can be optimized to selectively retain your analyte while washing away interferents, or vice-versa. Monolithic SPE columns, for instance, offer high permeability and robust porosity for enhanced selectivity in separating trace metals like lead from aqueous matrices [27] [32].
Troubleshooting Guide: Common Problems and Solutions
Table 1: Troubleshooting Interference and Selectivity Issues
| Problem & Symptoms | Potential Cause | Recommended Solution |
|---|---|---|
| Non-Nernstian SlopeCalibration slope is significantly steeper or shallower than theoretical. | Super-Nernstian response can occur when discriminated interferents (e.g., Na+) are present in the internal solution or conducting polymer transducer [29]. | Reformulate the sensor's inner membrane composition. Ensure the internal solution contains a well-defined activity of the primary ion and lacks easily exchanged interferents [29] [30]. |
| Signal DriftUnstable potential reading over time. | Interfering ions slowly exchanging with the primary ion in the membrane or internal transducer layer, altering the inner phase-boundary potential [29] [30]. | Use a sensor with a solid contact that minimizes the formation of water films. For supported liquid membranes, employ backside calibration potentiometry to account for slow drifts by assessing chemical asymmetries [30]. |
| High Background/NoiseErratic signals or elevated detection limits. | High concentration of interfering ions in the sample matrix causing a significant baseline signal or ion flux through the membrane [28] [33]. | Implement a sample clean-up step (e.g., SPE, precipitation) to remove interferents [27] [32]. Adjust the sample pH to suppress the interferent's charge or activity [30]. |
| Poor ReproducibilityHigh variance between replicate measurements. | Inconsistent sensor surface or membrane composition due to variable conditioning, or fouling by the sample matrix [10] [34]. | Follow a strict and sufficient conditioning protocol before use. For carbon paste electrodes, ensure a fresh, reproducible surface is generated before each measurement [34]. |
Experimental Protocols
Protocol: Assessing Potentiometric Selectivity Coefficients
The selectivity coefficient (( K_{A,B}^{pot} )) is the most critical parameter for evaluating sensor performance against interferents. The following methods are commonly used [34] [31].
A. Separate Solution Method (SSM)
- Prepare Solutions: Prepare two separate solutions, one containing the primary ion (A) at a fixed concentration (e.g., 0.01 M), and another containing the interfering ion (B) at the same concentration.
- Measure EMF: Measure the potential (EMF) of each solution using the ion-selective electrode. Record the values as ( EA ) and ( EB ).
- Calculate ( K{A,B}^{pot} ): Use the following formula for ions of the same charge (z): [ \log K{A,B}^{pot} = \frac{(EB - EA)zF}{2.303RT} ] where R is the gas constant, T is temperature, and F is the Faraday constant. For ions of different charges, the interpretation is more complex and requires alternative visualization of response curves [31].
B. Fixed Interference Method (FIM)
- Prepare Calibration Solutions: Prepare a series of solutions with a varying concentration of the primary ion (A), but with a constant, high background concentration of the interfering ion (B).
- Calibrate: Perform a calibration and obtain the potential vs. log[A] plot.
- Determine Limit: The point at which the calibration curve deviates from linearity defines the limit of detection in the presence of the interferent. The selectivity coefficient is calculated from this intersection point.
Protocol: Mitigating Matrix Effects with Solid-Phase Extraction
This protocol is adapted from research on selective lead separation [32].
- Column Conditioning: Activate the monolithic (m-SPE) or particle-based (p-SPE) column by passing methanol followed by deionized water at a optimized flow rate (e.g., 1.0 mL/min).
- Sample Loading: Adjust the pH of the aqueous sample to the optimal value for analyte retention (e.g., pH ~5 for Pb²⁺). Pass the sample through the column.
- Washing: Remove weakly adsorbed interferents by passing a washing solvent (optimized for the specific matrix) through the column.
- Elution: Elute the purified analyte using a small volume of an appropriate eluent (e.g., 0.1M HNO₃). The eluate can then be analyzed via potentiometry or another technique with reduced matrix interference.
Signaling Pathways and Workflows
The following diagram illustrates the logical workflow for diagnosing and resolving selectivity challenges, connecting observed symptoms to their root causes and corresponding solutions.
Selectivity Issue Troubleshooting Workflow
The Scientist's Toolkit: Key Research Reagent Solutions
Table 2: Essential Materials for Potentiometric Sensor Development and Interference Mitigation
| Category & Item | Function & Application | Example from Literature |
|---|---|---|
| Ionophores | Membrane-active compounds that selectively bind the target ion, determining the sensor's fundamental selectivity [31]. | A Schiff base (2-(((3-aminophenyl)imino)methyl)phenol) provided high selectivity for Cu(II) over a wide range of metal ions [34]. Modified bis-thiourea ligands outperformed commercial sulfate ionophores in selectivity [31]. |
| Polymeric Membranes | The matrix (e.g., PVC) that hosts the ionophore and other components, providing a stable phase for the potentiometric signal generation. | Plasticized polymeric membranes are the standard material for ion-selective electrodes. The choice of polymer and plasticizer can influence response time and lifetime [31]. |
| Solid-Contact Materials | Materials placed between the ion-selective membrane and the electrode conductor to improve potential stability and eliminate the need for an inner filling solution. | Electropolymerized polypyrrole and poly(3-octylthiophene-2,5-diyl) with MoS₂ nanocomposites have been used to create stable, all-solid-state nitrate sensors with excellent long-term performance [10]. |
| Sample Preparation Sorbents | Materials used in Solid-Phase Extraction (SPE) to selectively isolate and pre-concentrate the analyte from a complex matrix, reducing interferents. | Monolithic SPE columns demonstrated enhanced selectivity, reproducibility, and efficiency for separating trace lead from aqueous environmental matrices compared to particle-packed columns [32]. |
Advanced Materials and Fabrication Methods for Stable Potentiometric Sensing
Core Concepts: Liquid-Contact vs. Solid-Contact ISEs
What is the fundamental structural difference between a traditional Liquid-Contact ISE and a Solid-Contact ISE?
The fundamental difference lies in the internal architecture. A Traditional Liquid-Contact ISE (LC-ISE) relies on an internal filling solution that contacts both an internal reference electrode and the inner side of the ion-selective membrane (ISM) [35]. In contrast, a Solid-Contact ISE (SC-ISE) eliminates this liquid component. A solid-contact (SC) layer is formed between the ISM and the electronic conduction substrate (ECS), which acts as an ion-to-electron transducer [35].
What are the primary limitations of Liquid-Contact ISEs that drove the development of Solid-Contact designs?
LC-ISEs suffer from several inherent limitations that hinder their application in modern, miniaturized sensors [35]:
- Instability of Inner Solution: The evaporation, permeation, and changes in the sample's temperature and pressure affect the electrode response.
- Miniaturization Difficulty: It is challenging to reduce the volume of the inner filling solution, making the electrode difficult to miniaturize.
- Osmotic Pressure and Water Influx: Differences in ionic strength between the sample and inner solution can cause water to move in and out, leading to volume changes and membrane stratification.
- Maintenance Intensive: LC-ISEs require careful use and maintenance, incurring higher costs.
What key advantages do Solid-Contact ISEs offer?
SC-ISEs provide significant benefits that align with the needs of portable and wearable detection devices [35] [16]:
- Easy Miniaturization and Integration: Their solid-state structure facilitates chip integration and the creation of small, portable sensors.
- Enhanced Stability: They are less prone to the effects of sample pressure, temperature changes, and osmotic pressure.
- Reduced Maintenance: The absence of an internal solution that requires refilling simplifies operation.
- Robustness for Complex Environments: Their design makes them suitable for use in field-deployable, industrial, and biomedical settings.
The following diagram illustrates the structural evolution and key components of this transition.
Troubleshooting Guide: FAQs on Solid-Contact ISE Performance
FAQ 1: My SC-ISE shows a constant drift in potential readings. What is the most likely cause and how can I mitigate it?
Constant potential drift in SC-ISEs is frequently caused by the formation of an undesired water layer at the interface between the ISM and the Solid-Contact layer [16] [36]. This thin aqueous film becomes a site for ion exchange and leaching, destabilizing the electrode potential.
Mitigation Strategies:
- Enhance Interfacial Hydrophobicity: Incorporate hydrophobic nanomaterials into the SC layer. Multi-walled carbon nanotubes (MWCNTs) or laser-induced graphene/MXene composites have proven effective. Their hydrophobicity prevents water accumulation, with studies showing significant stability improvements [16] [36].
- Optimize the Ion-Selective Membrane (ISM): Add hydrophobic block copolymers like SEBS (polystyrene-block-poly(ethylene-butylene)-block-polystyrene) to traditional PVC-based membranes. This improves hydrophobicity and mechanical strength, reducing ion leaching and potential drift to very low levels (e.g., < 0.04 mV/h) [36].
- Use High-Capacitance Materials: Employ solid-contact materials with high redox or double-layer capacitance, such as conducting polymers (e.g., polypyrrole, poly(3-octylthiophene)) or porous carbons. A high capacitance buffers against potential changes, enhancing signal stability [10] [35].
FAQ 2: After dry storage, my SC-ISE requires an excessively long conditioning time to stabilize. Is this normal and how can I improve it?
Yes, a long re-conditioning period after dry storage is a known challenge, but its duration can be minimized. The sensor needs time to hydrate the ISM surface and stabilize the solid-contact interface [10].
Protocol for Improved Handling:
- Systematic Conditioning: A study on nitrate SC-ISEs demonstrated that even after one-month dry storage, sensors could regain accurate performance with a sufficiently long conditioning period in an appropriate solution [10].
- Optimal Storage: When possible, store SC-ISEs in a dark, humid environment or in a dilute solution of the target ion to minimize membrane dehydration.
- Material Selection: Sensors using advanced composites (e.g., MXene/PVDF nanofibers) have shown excellent stability and may require shorter conditioning times after dry storage due to their robust interfacial architecture [36].
FAQ 3: My SC-ISE readings are noisy and non-reproducible. What common installation or calibration errors should I check?
Noisy and irreproducible readings often stem from physical setup and calibration protocol issues.
Checklist for Diagnosis:
- Physical Installation:
- Air Bubbles: Ensure no air bubbles are trapped on the sensing membrane surface [13] [37].
- Sensor Orientation: Never install the sensor horizontally or inverted, as this can trap air pockets. A 45-degree angle above horizontal is recommended [13].
- Electrical Connections: Verify all connections are secure and the instrument is properly grounded [37].
- Calibration Procedure:
- Use Interpolation, Not Extrapolation: Always calibrate with at least two standards that bracket the expected unknown concentration. Extrapolation is not accurate for potentiometric methods [13].
- Avoid Rinsing with Deionized Water: Rinsing with DI water between standard solutions dilutes the surface concentration and prolongs response time. Instead, rinse with the next calibration solution [13].
- Match Ionic Background: The calibrating solutions should mirror the ionic background of your sample to account for activity effects [13].
FAQ 4: How significant is temperature on my SC-ISE measurements, and how is it best compensated for?
Temperature has a profound effect on SC-ISE measurements, impacting both the Nernstian slope and the standard electrode potential (E₀) [13] [38]. A 1 mV change in potential alters the concentration reading by at least 4%, and a temperature discrepancy of 5°C can cause at least a 4% error [13].
Best Practices for Compensation:
- Simultaneous Temperature Measurement: Always use a sensor with a built-in temperature probe (e.g., PT100) for real-time monitoring [13] [38].
- Thermal Equilibrium: Allow sufficient time for the sensor and the solution to reach thermal equilibrium, which can take from minutes to over an hour, especially after a temperature change [13].
- Mathematical Correction: Rely on the manufacturer's algorithm or a validated model that corrects for the temperature dependence of the slope (Nernst equation), E₀, and the ion activity coefficient. Note that temperature-induced changes in ion activity cannot be fully compensated like in pH measurements [13].
Performance Data & Experimental Protocols
Quantitative Performance Comparison
The table below summarizes key performance metrics from recent studies on advanced SC-ISEs, highlighting the improvements achieved through material and design innovations.
Table 1: Performance Metrics of Advanced Solid-Contact ISEs from Recent Studies
| Target Ion | Solid-Contact (SC) Layer / Transducer | Ion-Selective Membrane (ISM) | Reported Sensitivity (mV/decade) | Potential Drift | Key Application Demonstrated | Source |
|---|---|---|---|---|---|---|
| Na⁺ | MXene/PVDF-LIG@TiO₂ | PVC-SEBS blend | 48.8 mV/decade | 0.04 mV/h | Real-time sweat monitoring (Wearable) | [36] |
| K⁺ | MXene/PVDF-LIG@TiO₂ | PVC-SEBS blend | 50.5 mV/decade | 0.08 mV/h | Real-time sweat monitoring (Wearable) | [36] |
| NO₃⁻ | Electropolymerized Polypyrrole | TDMA-based membrane | Near-Nernstian | Minimal shift after 1-month dry storage | Drinking water analysis | [10] |
| Ag⁺ | Multi-Walled Carbon Nanotubes (MWCNTs) | PVC with Calix[4]arene | 61.0 mV/decade | High stability (low drift) | Pharmaceutical analysis (Silver sulfadiazine) | [16] |
| Reference Electrode | Polymeric ion exchangers in carbon-paste | N/A (Reference Electrode) | Stable potential in various media | Liquid-junction-free, stable in extreme pH | Potentiometric & power sources | [39] |
Standard Protocol: Fabrication and Conditioning of a Solid-Contact ISE
This protocol outlines the general workflow for creating and validating a solid-contact ion-selective electrode, integrating best practices from the literature.
Detailed Steps:
- Substrate Preparation: Begin with a clean, solid conductive substrate such as a screen-printed electrode (SPE), glassy carbon electrode, or a gold electrode [35] [16].
- SC Layer Fabrication: Apply the ion-to-electron transducer material.
- For MWCNTs: Disperse MWCNTs in a suitable solvent (e.g., dimethylformamide) and drop-cast a specific volume onto the substrate. Allow to dry completely to form a hydrophobic, conductive layer [16].
- For Conducting Polymers: Electropolymerize a monomer like pyrrole onto the substrate from a solution containing the monomer and a supporting electrolyte to form a redox-capacitive polypyrrole layer [10].
- ISM Cocktail Preparation: Prepare the ion-selective membrane by dissolving the required components in tetrahydrofuran (THF). A typical composition includes [35] [16]:
- Polymer matrix (e.g., PVC)
- Plasticizer (e.g., DOS, NPOE)
- Ionophore (target ion-specific, e.g., Calix[4]arene for Ag⁺)
- Ion exchanger (e.g., NaTFPB)
- Membrane Deposition: Drop-cast the prepared ISM cocktail onto the prepared SC layer. Cover the electrode and allow the THF to evaporate slowly over 12-24 hours to form a uniform, defect-free membrane [16].
- Initial Conditioning: Before first use, condition the completed SC-ISE by soaking it in a solution containing the target ion (e.g., 0.001 M to 0.01 M) for 16-24 hours. This allows the membrane to hydrate and establish a stable equilibrium [13] [10].
- Calibration and Validation: Perform a two-point calibration with standard solutions. Always rinse the sensor with the next standard solution instead of deionized water to reduce response time. Validate the calibration with an independent quality control standard [13] [40].
The Scientist's Toolkit: Essential Research Reagents & Materials
Table 2: Key Materials for Solid-Contact ISE Development and Their Functions
| Material Category | Example Components | Primary Function in SC-ISE |
|---|---|---|
| Polymer Matrices | Polyvinyl Chloride (PVC), Polyurethane, Acrylic esters, SEBS Copolymer | Provides the structural backbone of the ISM; determines mechanical stability and flexibility [35] [36]. |
| Plasticizers | bis(2-ethylhexyl) sebacate (DOS), 2-Nitrophenyl octyl ether (NPOE), Dibutyl phthalate (DBP) | Imparts plasticity to the ISM; governs membrane fluidity and dielectric constant, influencing ionophore selectivity and response time [35] [16]. |
| Ion Carriers (Ionophores) | Valinomycin (for K⁺), Calix[4]arene (for Ag⁺), TDMA-based ligands (for NO₃⁻) | Selectively binds to the target ion, providing the sensor's selectivity. High hydrophobicity prevents leaching [35] [16]. |
| Ion Exchangers | Sodium tetrakis[3,5-bis(trifluoromethyl)phenyl]borate (NaTFPB), Potassium tetrakis(4-chlorophenyl)borate (KTPCIPB) | Introduces immobile ionic sites into the ISM; facilitates ion exchange, ensures permselectivity, and reduces interference [35]. |
| Solid-Contact Transducers | Conducting Polymers (Polypyrrole, PEDOT), Carbon Nanotubes (MWCNTs), Laser-Induced Graphene (LIG), MXene composites | Acts as the ion-to-electron transducer layer; its high capacitance and hydrophobicity are critical for potential stability and preventing water layer formation [10] [35] [16]. |
| Conductive Substrates | Screen-Printed Electrodes (SPEs), Glassy Carbon, Gold Electrodes | Serves as the electronic conductor and physical support for the subsequent layers [35] [16]. |
FAQs: Fundamentals of Solid-Contact Transducers
1. What is a solid-contact ion-selective electrode (SC-ISE), and what are its main advantages? Solid-contact ion-selective electrodes (SC-ISEs) are potentiometric sensors where the traditional internal filling solution is replaced by a solid-contact (SC) material that acts as an ion-to-electron transducer between the ion-selective membrane (ISM) and the conductive electrode substrate [41] [42]. This design eliminates issues associated with liquid-contact ISEs, such as evaporation or leakage of the internal solution, variations in sample temperature and pressure, and difficulties in miniaturization [41]. SC-ISEs are easier to store and maintain, do not require external pressure, can achieve lower detection limits, exhibit reduced temperature dependence, and are well-suited for the development of miniaturized, flexible, and wearable sensors [41] [42].
2. Why are carbon nanomaterials and conducting polymers used as solid contacts? Carbon nanomaterials and conducting polymers are ideal for use as solid contacts because they facilitate efficient ion-to-electron transduction, which is crucial for a stable electrode potential [41] [42].
- Carbon Nanomaterials (e.g., Carbon Nanotubes (CNTs), Graphene, Carbon Black): These materials are prized for their excellent electrical conductivity, high chemical stability, large specific surface area (which leads to high electrical capacitance), and hydrophobicity (which helps prevent the formation of a detrimental water layer) [41]. They are also known for their mechanical strength and relatively low cost [41].
- Conducting Polymers (e.g., Polyaniline (PANI), Polypyrrole (PPy), PEDOT): These polymers are conductive, can be easily synthesized, and are biocompatible [43] [44]. Their redox activity provides a high capacitance that stabilizes the potential at the interface between the ISM and the underlying conductor [42]. They can be processed into various forms (films, nanospheres) and integrated into flexible substrates [43] [44].
3. What is the "water layer" problem, and how do these transducers address it? The water layer problem refers to the formation of a thin aqueous film between the ion-selective membrane and the solid-contact layer or electrode substrate [42]. This film can become a secondary, uncontrolled electrochemical site, causing potential drift and unstable measurements because its composition changes slowly with the sample solution [40] [42]. Both carbon-based and conducting polymer-based transducers address this primarily through their hydrophobicity (in the case of carbon materials) or by establishing a stable, high-capacitance interface that minimizes the thermodynamic driving force for water accumulation [41] [42]. Properly designed solid contacts significantly reduce water layer formation, a key factor in achieving long-term potential stability [41] [42].
Troubleshooting Guide: Common Experimental Issues
Problem 1: High Potential Drift and Unstable Readings Potential drift is a change in the measured potential over time when the sample concentration is constant.
- Possible Cause: Inadequate conditioning or hydration of the sensor.
- Solution: Ensure proper initial conditioning of the electrode before use. For sensors with glass membranes (like pH electrodes) or polymeric membranes, this often involves soaking in an electrolyte or specific solution to establish a stable hydration layer [40] [45]. Never store the electrode dry [45].
- Possible Cause: Formation of a water layer between the ISM and the solid contact.
- Solution: Use highly hydrophobic solid-contact materials like carbon nanotubes or graphene, which can help prevent water uptake [41]. Ensure the ISM and the solid-contact layer are firmly adhered.
- Possible Cause: Poor ion-to-electron transduction due to an unsuitable or poorly applied solid-contact material.
- Solution: Optimize the deposition of the solid-contact layer to ensure a uniform, high-surface-area film. Materials with high intrinsic capacitance, such as porous carbons or redox-active conducting polymers, are preferred as they better buffer against potential changes [41] [42].
Problem 2: Slow Response Time A slow response time is when the electrode takes too long to reach a stable potential reading after a change in sample concentration.
- Possible Cause: The ion-selective membrane is not fully conditioned.
- Solution: Condition the electrode in a solution containing the target ion for a sufficient period (as per manufacturer or protocol guidelines) to allow the membrane to hydrate and establish equilibrium [40] [45].
- Possible Cause: Poor adhesion or incomplete contact between the ISM and the solid-contact layer.
- Solution: For composite-based solid contacts, ensure the membrane cocktail effectively penetrates the porous structure of the carbon or polymer layer to create a large, well-connected interface [41].
Problem 3: Reduced Sensitivity and Non-Nernstian Slope The measured slope is significantly less than the theoretical Nernstian value (e.g., ~59 mV/decade for a monovalent ion).
- Possible Cause: Membrane contamination or fouling.
- Solution: Clean the electrode according to protocol using a suitable solvent. For proteinaceous contaminants, a dedicated cleaning kit with enzymatic solutions may be required. Never wipe the sensitive membrane with a tissue, as this can create static charge and damage the surface [45].
- Possible Cause: Incorrect calibration or use of expired buffer solutions.
- Solution: Always use fresh, non-expired standard solutions for calibration [45]. Perform a multi-point calibration that brackets the expected unknown concentration range [40].
- Possible Cause: The presence of interfering ions in the sample matrix that the ISM is not perfectly selective against.
- Solution: Use a matrix-matched calibration or employ the method of standard additions, which is recommended for samples with high ionic strength or a complicated background [40]. The addition of an Ionic Strength Adjustment Buffer (ISAB) or Total Ionic Strength Adjustment Buffer (TISAB) can also help [40].
Problem 4: Poor Reproducibility Between Sensors Measurements are inconsistent when using different electrodes of the same type.
- Possible Cause: Inconsistent fabrication of the solid-contact layer.
- Solution: Standardize the fabrication protocol meticulously. For drop-cast or electropolymerized layers, control parameters such as volume, concentration, temperature, and time precisely. Using composite materials can offer more reproducible properties than single-component materials [42].
- Possible Cause: Variations in the internal reference element or substrate.
- Solution: Ensure the conductive substrate (e.g., glassy carbon, gold, screen-printed electrode) is clean and has a consistent surface state before applying the solid-contact layer.
Performance Comparison of Solid-Contact Materials
The table below summarizes key properties of common solid-contact materials, which influence their performance and suitability for different applications.
Table 1: Comparison of Solid-Contact Transducer Materials
| Material Category | Example Materials | Key Advantages | Reported Performance Characteristics |
|---|---|---|---|
| Carbon Nanotubes (CNTs) | Single-Walled CNTs (SWCNTs), Multi-Walled CNTs (MWCNTs) | High hydrophobicity, large surface area, excellent electrical conductivity, mechanical strength [41]. | Potential drift: < 10 μV/h for K+-SC-ISE with 3D graphene [41]. |
| Graphene | 3D porous graphene | Very high specific capacitance, excellent electrical and ionic conductivity, strong mechanical properties [41]. | |
| Conducting Polymers | Polypyrrole (PPy), Polyaniine (PANI), PEDOT | High redox capacitance, ease of processing, good biocompatibility, flexible [43] [42] [44]. | Conductivity: PPy (10¹-10² S/cm), PANI (~10 S/cm) [43]. |
| Composites/Hybrids | PANI/CNT, PPy/Graphene, Carbon-Metal-Organic Frameworks | Synergistic properties; enhanced capacitance, stability, and ion-to-electron transduction [42]. | Often show superior performance, e.g., lower detection limits and better long-term stability [42]. |
Essential Experimental Protocols
Protocol 1: Fabrication of a CNT-Based Solid-Contact K+-ISE
This protocol outlines the key steps for creating a solid-contact potassium ion-selective electrode using carbon nanotubes as the transducer layer [41].
Research Reagent Solutions & Materials:
- Conductive Substrate: Glassy carbon electrode, gold electrode, or screen-printed carbon electrode.
- Carbon Nanotubes (CNTs): SWCNT or MWCNT dispersion in a suitable solvent (e.g., DMF).
- Ion-Selective Membrane (ISM) Cocktail:
- Polymer Matrix: High-molecular-weight Poly(vinyl chloride) (PVC).
- Plasticizer: Bis(2-ethylhexyl) sebacate (DOS) or o-Nitrophenyl octyl ether (o-NPOE).
- Ionophore: Valinomycin (for K+ selectivity).
- Ionic Additive: Potassium tetrakis(4-chlorophenyl)borate (KTpClPB).
- Solvent: Tetrahydrofuran (THF).
Methodology:
- Substrate Preparation: Polish the conductive substrate (e.g., glassy carbon) with alumina slurry (e.g., 0.3 μm and 0.05 μm) sequentially. Rinse thoroughly with deionized water and sonicate in ethanol and water for a few minutes each to clean.
- Solid-Contact Deposition: Deposit the CNT layer onto the clean substrate. This can be done by drop-casting a specific volume of the CNT dispersion and allowing the solvent to evaporate, or by electrophoretic deposition.
- ISM Membrane Casting: Prepare the ISM cocktail by dissolving the required amounts of PVC, plasticizer, ionophore, and ionic additive in THF. Drop-cast a defined volume of this cocktail directly onto the CNT-modified electrode.
- Solvent Evaporation: Allow the THF to evaporate slowly at room temperature, preferably under a glass cover, to form a uniform, homogeneous ISM.
- Conditioning: Condition the newly fabricated SC-ISE in a solution of the primary ion (e.g., 0.01 M KCl) for at least 12-24 hours before use and between measurements.
Protocol 2: In Situ Electropolymerization of a PPy Solid-Contact Layer
This protocol describes how to form a conducting polymer solid-contact layer through electrochemical polymerization, which often results in a uniform and strongly adhered film [43].
Research Reagent Solutions & Materials:
- Electrochemical Workstation: For controlling the polymerization.
- Monomer Solution: Aqueous solution containing 0.1 M pyrrole monomer.
- Supporting Electrolyte: Typically a salt like sodium nitrate (NaNO₃) or lithium perchlorate (LiClO₄) at a concentration of 0.1 M.
- Three-Electrode System:
- Working Electrode: Your conductive substrate.
- Counter Electrode: Platinum wire or mesh.
- Reference Electrode: Ag/AgCl (e.g., 3 M KCl).
Methodology:
- Substrate Preparation: Clean the conductive substrate as described in Protocol 1.
- Electrochemical Setup: Place the working, counter, and reference electrodes into the monomer/electrolyte solution.
- Polymerization: Use a constant potential (chronoamperometry) or potential cycling (cyclic voltammetry) technique to oxidize the pyrrole monomer at the working electrode surface. For example, apply a constant potential of ~0.8 V vs. Ag/AgCl until a sufficient charge has passed (indicating the desired film thickness).
- Rinsing and Drying: Remove the electrode from the monomer solution, rinse thoroughly with deionized water, and let it dry.
- ISM Application: Apply the ion-selective membrane cocktail (as in Protocol 1, Step 3) directly onto the electropolymerized PPy layer and allow the solvent to evaporate.
- Conditioning: Condition the completed SC-ISE as in Protocol 1, Step 5.
Visualizing Sensor Architecture and Performance
Diagram: SC-ISE Structure and Water Layer Issue
Diagram: Key Performance Validation Tests
Technical Support Center: Troubleshooting Potentiometric Measurement Drift
This technical support center provides troubleshooting guides and FAQs for researchers working with nanocomposite-based solid-contact ion-selective electrodes (SC-ISEs). The content is framed within the broader context of academic research on the causes and solutions of potentiometric measurement drift.
Frequently Asked Questions (FAQs)
FAQ 1: What are the primary causes of potential drift in solid-contact potentiometric sensors? Potential drift in SC-ISEs is primarily caused by the formation of an unwanted water layer between the ion-selective membrane and the solid-contact transducer material. This layer allows ions from the sample to penetrate, causing a drifting potential as the composition of this layer changes [42]. Other causes include low capacitance of the solid-contact material and poor adhesion between the membrane and the underlying electron conductor [46].
FAQ 2: How do nanocomposites like graphene, CNTs, and MOFs improve sensor stability? Nanocomposites enhance stability through several mechanisms:
- High Capacitance: Carbon nanotubes (CNTs) and reduced graphene oxide (rGO) provide a high electrical double-layer capacitance, which stabilizes the potential by acting as an efficient ion-to-electron transducer [9] [47].
- Hydrophobicity: Materials like MOF/rGO composites are highly hydrophobic, which prevents the formation of the destabilizing water layer [47].
- Redox Buffering: Some nanocomposites can also provide a redox capacitance, further contributing to potential stability [9].
FAQ 3: How can I quickly test the short-term stability of my newly fabricated sensor? Short-term stability can be rapidly assessed using the chronopotentiometry (CP) technique. Apply a constant current pulse (typically in the nanoampere range) to the electrode for a short period (e.g., 60 seconds) and record the potential change over time. The potential drift (dE/dt) is calculated from the linear section of the resulting curve. A lower drift value indicates better stability [42] [47].
FAQ 4: My sensor shows good sensitivity but poor long-term stability. What should I investigate? Focus on the interface between your ion-selective membrane and the nanocomposite solid contact. Poor long-term stability is often due to:
- Delamination: Ensure strong adhesion between the membrane and the solid contact. Using single-walled carbon nanotubes (SWCNTs) can provide better adhesion than multi-walled CNTs [46].
- Water Layer Formation: Use hydrophobic transducer materials like MOF/rGO composites to block water uptake [47].
- Material Compatibility: Verify that the plasticizers in your polymeric membrane do not dissolve or degrade the nanocomposite layer.
Troubleshooting Guide: Measurement Drift
| Observed Problem | Possible Causes | Recommended Solutions |
|---|---|---|
| High Short-Term Drift (during chronopotentiometry) | Low capacitance of the solid-contact material; High resistance at the transducer/membrane interface [42]. | Increase transducer capacitance by using high-surface-area nanomaterials like CNTs [46] or rGO/MOF composites [47]. |
| Continuous Long-Term Drift (over hours/days) | Formation of a water layer between the membrane and solid contact; Delamination of the ion-selective membrane [42]. | Use more hydrophobic nanocomposites (e.g., MOF/rGO) [47]; Ensure proper membrane adhesion by selecting compatible materials (e.g., SWCNTs over MWCNTs) [46]. |
| Drift in Complex Samples (e.g., serum, urine) | Interference from competing ions; Biofouling of the sensor membrane [48] [38]. | Incorporate selective receptors like Molecularly Imprinted Polymers (MIPs) [46]; Use a protective outer layer; Buffer sample ionic strength where possible. |
| Drift with Temperature Changes | Temperature sensitivity of the standard electrode potential (E0) and ion activity [38]. | Implement automatic temperature compensation (ATC) during measurements; Perform calibrations at the same temperature as the sample analysis. |
Experimental Protocols for Stability Assessment
Protocol 1: Assessing Short-Term Stability via Chronopotentiometry
Objective: To determine the potential drift and calculate the capacitance of a solid-contact ISE.
Materials:
- Potentiostat/galvanostat (e.g., Metrohm Autolab) [46]
- Fabricated SC-ISE and a reference electrode
- A standard electrolyte solution (e.g., 0.01 M phosphate buffer)
Methodology:
- Place the SC-ISE and reference electrode in the standard solution.
- Using the chronopotentiometry (CP) function, apply a constant current of ±1 nA for 60 seconds [47].
- Record the potential change over time.
- From the linear section of the chronopotentiogram, calculate the potential drift (dE/dt) in µV/s or µV/h.
- Calculate the capacitance (C) of the electrode using the formula: C = i / (dE/dt), where i is the applied current [42].
Protocol 2: Long-Term Stability and Water Layer Test
Objective: To monitor the standard potential (E0) over time and check for water layer formation.
Materials:
- mV/pH meter (e.g., Orion Model 720) [46]
- Fabricated SC-ISE, reference electrode, and calibration solutions
Methodology:
- Calibrate the SC-ISE daily in a series of standard solutions (e.g., from 10⁻⁵ M to 10⁻¹ M) over a period of at least one week.
- Record the measured potential for each concentration and plot the calibration curve to determine the standard potential (E0) each day.
- A change in E0 of more than a few mV per day indicates poor long-term stability [42].
- To test for a water layer, first immerse the sensor in a solution of the primary ion (e.g., 0.1 M NH₄⁺), then transfer it to a solution of a strongly interfering ion. A slow potential drift suggests the presence of a water layer where ions are exchanging [42].
Quantitative Performance of Nanocomposite Materials
The table below summarizes key performance metrics from recent research, providing benchmarks for evaluating your own sensors.
| Nanocomposite Material | Target Analyte | Sensitivity (mV/decade) | Detection Limit | Potential Drift / Stability | Key Advantage |
|---|---|---|---|---|---|
| CNT-based Membrane [48] | Ascorbic Acid (AA) | –33.53 ± 2.57 | Includes 10–200 μM physiological range | Limited influence from UA, Na⁺, lactate | Dual role of CNTs as transducer and receptor; High selectivity. |
| MOF/rGO Composite [47] | Ammonium (NH₄⁺) | 59.2 ± 1.5 | 10⁻⁶.³⁷ M | 7.2 µV/s (i = ±1 nA); Stable for 7 days | Hydrophobicity prevents water layer; High capacitance. |
| SWCNT + MIP [46] | Lidocaine (LDC) | 58.92 ± 0.98 | 7.75 × 10⁻⁸ M | N/A | MIP grants exceptional selectivity; SWCNTs provide stable potential. |
| Conductive Polymers (e.g., PEDOT) [9] | Various Ions (e.g., K⁺, Na⁺) | Near-Nernstian | Varies by membrane | Potential drift as low as 10 µV/h for up to 8 days | Established redox capacitance mechanism; Good adhesion. |
The Scientist's Toolkit: Essential Research Reagents and Materials
This table lists key materials used in the fabrication of high-performance, stable SC-ISEs.
| Item | Function/Benefit | Example Application |
|---|---|---|
| Single-Walled Carbon Nanotubes (SWCNTs) | High capacitance ion-to-electron transducer; provides efficient charge transfer and reduces potential drift [46]. | Used as a solid-contact layer in lidocaine sensors [46]. |
| Reduced Graphene Oxide (rGO) | Conductive, high-surface-area carbon material; enhances charge transfer and electroactive surface area [47]. | Combined with MOFs in ammonium ion sensors [47]. |
| Metal-Organic Frameworks (MOFs) | Porous materials with vast surface areas; enhance sensitivity and can impart hydrophobicity to prevent water layer formation [47]. | Ni-based MOFs used in composite with rGO for sweat sensing [47]. |
| Molecularly Imprinted Polymers (MIPs) | Synthetic polymers with tailor-made recognition sites for a specific molecule; significantly enhance sensor selectivity [46]. | Used as the sensory membrane for selective lidocaine detection [46]. |
| Conductive Polymers (e.g., PEDOT, PANI) | Act as ion-to-electron transducers via a redox capacitance mechanism; help stabilize the potential [9]. | Common solid-contact materials for a wide range of ions [9] [42]. |
| Ion-Selective Membrane Components | ||
| ∙ Poly(vinyl chloride) - PVC | Common matrix for the ion-selective membrane [46]. | Used in most conventional polymeric membrane ISEs. |
| ∙ Plasticizers (e.g., DOP) | Provide mobility to ionophores and ions within the polymer membrane [46]. | Essential for the function of PVC-based membranes. |
| ∙ Ionophores | Selectively bind the target ion, determining sensor selectivity [47]. | Nonactin is a common ionophore for ammonium ions [47]. |
| ∙ Lipophilic Salts | Reduce membrane resistance and improve selectivity by reducing anion interference [9]. | Often added in small quantities to the membrane cocktail. |
Signaling Pathways and Workflow Diagrams
FAQs: Fabrication Techniques and Measurement Drift
Q1: What are the most common causes of potential drift in 3D-printed solid-contact ion-selective electrodes (SC-ISEs)?
Potential drift in 3D-printed SC-ISEs is often caused by the formation of a water layer between the ion-selective membrane (ISM) and the solid-contact transducer layer. This occurs when the transducer material is not sufficiently hydrophobic, allowing water to accumulate and create an unstable electrochemical potential [49]. The choice of printing parameters and materials significantly influences this; for instance, the print angle and print thickness during fabrication directly affect the hydrophobicity of the carbon-based transducer. Optimizing these parameters is critical to achieving highly stable signals with low drift, as demonstrated by sensors showing drift rates as low as ~20 μV per hour [5].
Q2: How can I improve the long-term stability of my screen-printed reference electrodes (REs)?
Long-term stability in screen-printed reference electrodes (REs) can be achieved through intelligent design features that mitigate electrolyte leakage and contamination. A proven approach involves fabricating the Ag/AgCl RE with a multi-layer structure that includes an electrolyte layer, a hydrophobic junction layer, and a small hole [50]. This design collectively contributes to stable potential by minimizing the flux of the inner electrolyte and reducing contamination from the sample solution, resulting in minimal drift over extended periods in various buffer solutions [50].
Q3: My 3D-printed electrode has high electrical resistance. What fabrication factors contribute to this?
High contact resistance in 3D-printed electrodes, particularly those made with conductive filaments like carbon-infused PLA, is a common issue stemming from the printing process itself. Key factors include:
- Printing Orientation and Path: The orientation of the electrode on the print bed and the design of the conductive path significantly impact resistance. A continuous printed path between the electrode surface and the electrical contact point minimizes resistance [51].
- Printing Speed: Slower printing speeds allow for better layer adhesion and lower electrical resistivity in the final part [51].
- Material Age and Storage: The conductive filament can absorb water from the atmosphere over time, which increases its resistivity. Proper storage of the filament is crucial to maintain performance [51].
Q4: Can nanomaterials be integrated into screen-printed sensors to reduce drift?
Yes, integrating hydrophobic nanomaterials like multi-walled carbon nanotubes (MWCNTs) into the transducer layer of screen-printed potentiometric sensors is a highly effective strategy to reduce signal drift. MWCNTs are highly hydrophobic, which helps prevent the formation of the detrimental water layer. They also enhance electrical conductivity and capacitance, leading to improved potential stability [49] [3]. A comparative study found that sensors doped with MWCNTs exhibited better performance and stability than those using other nanocomposites like graphene [49].
Troubleshooting Guides
Guide 1: Troubleshooting High Drift in 3D-Printed Potentiometric Sensors
| Symptom | Possible Cause | Solution |
|---|---|---|
| Consistently increasing or decreasing potential readings over time in a stable solution. | Water layer formation due to insufficient hydrophobicity of the solid-contact layer. | Optimize print parameters (angle, thickness) to maximize transducer hydrophobicity [5]. |
| Poor layer adhesion and high contact resistance from suboptimal printing. | Reduce printing speed and adjust print orientation to ensure a continuous conductive path [51]. | |
| Noisy signal and unstable potential. | Aged or moisture-laden conductive filament. | Use fresh, properly stored conductive filament and keep it in a dry environment [51]. |
| Non-Nernstian sensor response (slope too low/high). | Faulty or contaminated ion-selective membrane. | Ensure the membrane composition is correct and the printing resin for SLA-printed membranes is not expired or contaminated [52] [5]. |
Guide 2: Troubleshooting Screen-Printed Electrode Performance
| Symptom | Possible Cause | Solution |
|---|---|---|
| Unstable reference electrode potential. | Clogged or compromised reference junction. | Ensure the hydrophobic junction layer is intact and the small hole in the RE design is not blocked [50]. |
| Rapid signal drift in biological or complex samples. | Biofouling or protein adsorption on the sensor surface. | Consider using biocompatible coatings or Nafion membranes to protect the electrode surface (Note: Specific mitigation strategy derived from general sensor knowledge). |
| Low sensitivity and poor selectivity. | Inefficient ion-to-electron transducer or suboptimal ion-selective membrane. | Dope the transducer layer with nanomaterials like MWCNTs to enhance capacitance and stability [49] [3]. Use molecularly imprinted polymers (MIPs) in the membrane for improved selectivity [49]. |
Experimental Protocols
Protocol 1: Fabrication of a Low-Drift, Fully 3D-Printed Sodium Ion-Selective Electrode
This protocol is adapted from research demonstrating a fully 3D-printed solid-contact potentiometric sensor for sodium determination [5].
1. Objectives: To fabricate a solid-contact Na+-ISE with a Nernstian response and low potential drift for measuring physiologically relevant Na+ levels.
2. Materials:
- Printer for Transducer: Fused Deposition Modeling (FDM) 3D printer.
- Filament: Conductive carbon-infused Polylactic Acid (PLA).
- Printer for Membrane: Stereolithography (SLA) 3D printer.
- Membrane Resin: A custom photocurable resin formulation containing sodium ionophore, lipophilic additive, and plasticizer.
- Software: Computer-aided design (CAD) software.
3. Step-by-Step Methodology:
- Step 1: Design Electrodes. Use CAD software to design the solid-contact transducer (a disk with an integrated connection stalk) and the ion-selective membrane (a cup-shaped structure to fit onto the transducer).
- Step 2: Print Transducer. Print the transducer using the FDM printer with carbon-infused PLA. Critical parameters to manipulate for low drift are print angle and print thickness to maximize the hydrophobicity of the resulting part.
- Step 3: Print Membrane. Print the ion-selective membrane using the SLA printer with the customized ion-selective resin.
- Step 4: Assemble Sensor. Physically assemble the SLA-printed membrane onto the FDM-printed transducer to form a complete solid-contact ISE.
- Step 5: Conditioning. Condition the assembled sensor in a solution of NaCl before first use.
4. Validation and Expected Results:
- Calibration: The sensor should demonstrate a linear and Nernstian response with a slope of approximately 57.1 mV/decade over a range of 240 μM–250 mM Na+ [5].
- Drift Test: Measure the potential in a stable standard solution over time. A well-optimized sensor can achieve a drift rate as low as ~20 μV/hour [5].
- Selectivity: Test the sensor in solutions containing common interfering ions (K+, NH4+, Mg2+, Ca2+). The sensor should show high selectivity for Na+.
Protocol 2: Enhancing Screen-Printed Sensor Stability with MWCNTs
This protocol is based on a study that developed a molecularly imprinted polymer-based sensor with MWCNTs for determining piroxicam [49].
1. Objectives: To fabricate a stable screen-printed potentiometric sensor with reduced signal drift by incorporating multi-walled carbon nanotubes (MWCNTs) as a hydrophobic ion-to-electron transducer.
2. Materials:
- Screen-printed electrode (SPE) substrates (typically with carbon working electrode).
- Multi-walled carbon nanotubes (MWCNTs).
- Polyvinyl chloride (PVC) for the membrane matrix.
- Plasticizer (e.g., 2-Nitrophenyloctyl ether - NPOE).
- Ionophore or ion-complex specific to the target analyte (e.g., Cu(II)-piroxicam complex).
- Tetrahydrofuran (THF) as a solvent.
3. Step-by-Step Methodology:
- Step 1: Prepare Transducer Dispersion. Disperse a small amount of MWCNTs in a suitable solvent to create a homogeneous dispersion.
- Step 2: Deposit Transducer Layer. Drop-cast the MWCNT dispersion onto the surface of the screen-printed carbon working electrode and allow it to dry, forming a thin, hydrophobic conductive layer.
- Step 3: Prepare Ion-Selective Membrane Cocktail. Dissolve the PVC polymer, plasticizer, and selective ionophore in THF.
- Step 4: Deposit Sensing Membrane. Drop-cast the membrane cocktail directly on top of the MWCNT-modified electrode and allow the THF to evaporate, leaving a uniform ion-selective membrane.
4. Validation and Expected Results:
- Performance Comparison: Compare the potential stability of the MWCNT-doped sensor against a control sensor without MWCNTs. The MWCNT sensor should exhibit significantly lower signal drift [49].
- Hydrophobicity: The enhanced hydrophobicity from MWCNTs interferes with water layer formation, which is a primary cause of drift in solid-contact electrodes [49].
Research Reagent Solutions
Table: Essential Materials for Fabricating Advanced Potentiometric Sensors
| Reagent/Material | Function in Sensor Fabrication | Key Consideration |
|---|---|---|
| Carbon-infused PLA | Serves as the conductive filament for 3D printing the solid-contact transducer in FDM printing [5]. | Susceptible to moisture; store in a dry environment to maintain conductivity [51]. |
| Multi-Walled Carbon Nanotubes (MWCNTs) | Hydrophobic nanomaterial used as an ion-to-electron transducer in screen-printed and other solid-contact electrodes to reduce water layer formation and signal drift [49] [3]. | Requires proper dispersion in solvent or polymer matrix to ensure a homogeneous layer. |
| Conductive Polymers (e.g., PEDOT, PPy) | Classical materials acting as solid-contact transducers, converting ionic signals to electronic signals [52] [3]. | Their stability can be affected by the redox state and the presence of O2 or CO2. |
| Molecularly Imprinted Polymers (MIPs) | Synthetic polymers with cavities complementary to a target molecule, providing high selectivity in the ion-selective membrane [49]. | Synthesis requires careful template removal to ensure binding sites are accessible. |
| Ionophores | Selective recognition elements within the membrane that bind the target ion, determining sensor selectivity [52] [49]. | Must be highly selective for the target ion over potential interferents present in the sample matrix. |
Process Visualization
Troubleshooting Guides and FAQs
This technical support center addresses common experimental challenges in potentiometric sensing, framed within a broader thesis research context on measurement drift causes and solutions.
Wearable Sweat Sensor Troubleshooting
Q1: My wearable sweat sensor shows erratic potential drift during on-body monitoring. What could be causing this?
A: Potential drift in wearable sweat sensing is frequently caused by temperature fluctuations during physiological monitoring and insufficient sensor conditioning.
- Primary Cause: Temperature Variation: The Nernstian response is inherently temperature-dependent. Applying room-temperature calibration curves to on-skin measurements, where temperature can vary significantly (e.g., during exercise or sauna exposure), introduces substantial mathematical errors. A differential of 10°C can cause significant inaccuracies [53].
- Solution: Integrate a real-time skin temperature sensor into your wearable patch. Implement dynamic temperature compensation by tailoring calibration curves to account for measured skin temperature, which has been shown to maintain accuracy even under extreme variations from 8°C to 56°C [53].
- Primary Cause: Improper Sensor Conditioning: Solid-contact ion-selective electrodes require sufficient conditioning to stabilize the ion-selective membrane and the ion-to-electron transducer layer.
- Solution: Ensure a sufficiently long conditioning period in a solution containing the target ion (e.g., 10–2 M) before use. Studies show that even after dry storage, a proper conditioning period can restore reproducible sensor signals [10].
Q2: The sensitivity of my potassium ion-selective electrode (ISE) is lower than the theoretical Nernstian slope. How can I improve it?
A: Sub-Nernstian sensitivity often stems from inefficient charge transfer at the electrode interface.
- Solution: Optimize the Ion-to-Electron Transducer Layer. Incorporate an advanced solid-contact material with high redox capacitance and a large electroactive surface area. For example:
- PEDOT:PSS/Graphene Nanocomposite: This transducer has been shown to achieve super-Nernstian sensitivities of ~134.0 mV/decade for K+ and ~96.1 mV/decade for Na+, surpassing theoretical values due to superior charge transfer efficiency [53].
- Functionalized Multi-Walled Carbon Nanotubes (f-MWCNTs): Used as a transducer layer in microneedle sensors, they provide effective ion-to-electron transduction and stable potentials [54].
In-Vitro Therapeutic Drug Monitoring (TDM) Troubleshooting
Q3: My potentiometric drug sensor has poor reproducibility in real biological samples like serum. How can I address this?
A: Reproducibility issues in complex matrices are commonly due to biofouling, protein binding, and inconsistent electrode surface preparation.
- Primary Cause: Sample Matrix Interference: Biological fluids contain proteins, lipids, and other ions that can foul the ion-selective membrane or compete with the target analyte.
- Solution:
- Membrane Selectivity: Carefully optimize the ion-selective membrane cocktail. Use highly selective ionophores for the target drug and incorporate appropriate lipophilic additives to enhance selectivity and prevent co-extraction of interfering ions [55] [3].
- Surface Modification: Apply a protective Nafion top layer. The sulfonate (−SO3–) functional groups in Nafion facilitate selective cation transport while mitigating sensor degradation and biofouling, which has been demonstrated to ensure 2-week-long stability [53].
- Solution: Standardize Fabrication: For screen-printed electrodes, ensure a uniform and reproducible coating process. Using automated printing or drop-casting with a fixed number of layers and controlled drying times between layers significantly improves batch-to-batch reproducibility [54].
Q4: I am developing a sensor for lithium TDM. What are the critical performance parameters I must meet for clinical relevance?
A: For lithium, which has a narrow therapeutic index, sensor performance is critical for patient safety.
- Therapeutic Range: The sensor must accurately quantify lithium in the range of 0.4–1.2 mmol/L. Levels above 1.2 mmol/L are potentially toxic [56].
- Required Sensitivity and Reproducibility: The sensor must reliably distinguish concentration changes within this narrow window. Reproducibility should be high, with minimal signal drift, to enable dose-adjustment decisions. For context, a nitrate sensor for water analysis achieved a reproducibility of ± 3 mg/L, which translates to a very tight margin of error [10]. Long-term potential drift should be minimized, with state-of-the-art systems demonstrating drift below 0.25 mV/h [55] or even as low as 0.1 mV over 14 days [53].
The table below summarizes key quantitative performance data from recent studies for easy comparison.
Table 1: Performance Metrics of Featured Potentiometric Sensors
| Analyte / Application | Sensing Material / Transducer | Sensitivity (Slope) | Stability / Drift | Key Innovation | Source |
|---|---|---|---|---|---|
| Na+ in Sweat | PEDOT:PSS/Graphene | ~96.1 mV/decade | < 0.1 mV over 14 days | High-capacitance transducer for enhanced sensitivity | [53] |
| K+ in Sweat | PEDOT:PSS/Graphene | ~134.0 mV/decade | < 0.1 mV over 14 days | High-capacitance transducer for enhanced sensitivity | [53] |
| pH in Sweat | PANI/IrOx binary-phase | −69.1 mV/pH | Not specified | Binary-phase structure for mechanical robustness | [53] |
| Nitrate in Water | Polypyrrole solid contact | Nernstian | Stable after 1-month dry storage | Superior long-term stability & conditioning study | [10] |
| Drug (ATR) Hydrolysis | Custom ISE | LOD: 0.23 µmol L⁻¹ | 0.25 mV/h | Real-time tracking of drug degradation kinetics | [55] |
Detailed Experimental Protocols
Protocol 1: Fabrication of a Temperature-Compensated Sweat Sensor Array
This protocol details the creation of a flexible sensor for simultaneous monitoring of pH, Na+, K+, and skin temperature, incorporating dynamic temperature compensation [53].
1. Sensor Fabrication and Functionalization:
- Substrate Preparation: Begin with a flexible polyimide (PI) substrate.
- Electrode Patterning: Pattern the working electrodes (WE) and reference electrode (RE) using laser-induced graphene (LIG) or sputtering/lift-off techniques.
- Reference Electrode (RE) Preparation: Plate the RE with Ag/AgCl to ensure a stable and reproducible potential.
- Ion-to-Electron Transducer Application: Drop-cast or electrodeposit the PEDOT:PSS/graphene nanocomposite onto the working electrode areas for Na+ and K+ sensing. This layer acts as the solid contact.
- Ion-Selective Membrane (ISM) Coating: Drop-cast the respective ion-selective membrane cocktails onto the transducer layers:
- Na+ ISM: A cocktail containing a Na+-selective ionophore.
- K+ ISM: A cocktail containing a K+-selective ionophore (e.g., valinomycin).
- pH Sensor Fabrication: Electrodeposit a layer of polyaniline (PANI) on the pH working electrode. Subsequently, coat it with iridium oxide (IrOx) nanoparticles to form a robust, sensitive binary-phase structure.
- Nafion Coating: Apply a thin Nafion top layer over the ISMs to facilitate selective cation transport and enhance long-term stability.
- Temperature Sensor: The LIG structure itself can serve as a resistive temperature sensor.
2. System Integration and Calibration:
- Circuit Integration: Connect the sensor array to a wireless potentiometric measurement circuit (e.g., based on an ESP32 microcontroller).
- Pre-use Conditioning: Condition the sensors overnight in solutions containing their target ions (e.g., 10–2 M NaCl for Na+ sensor).
- Temperature-Dependent Calibration: Generate calibration curves for the ion sensors across a range of temperatures (e.g., 8°C to 56°C). Store these curves in the device's firmware to allow for real-time correction based on the concurrent skin temperature reading.
Workflow Diagram: Fabrication of a Temperature-Compensated Sweat Sensor
Protocol 2: In-Vitro Potentiometric Monitoring of Drug Hydrolysis
This protocol outlines the use of a screen-printed potentiometric sensor to track the hydrolysis kinetics of a degradable drug, such as atracurium (ATR), in real-time [55].
1. Sensor Preparation:
- Sensor Design: Use commercial or in-house fabricated screen-printed electrodes (SPEs).
- Membrane Modification: Drop-cast a custom-formulated ion-selective membrane cocktail selective for the drug molecule (e.g., ATR) or its degradation product (e.g., laudanosine, LDS) onto the working electrode. The cocktail typically includes PVC, a plasticizer, an ion exchanger, and a selective ionophore.
- Conditioning: Condition the modified sensor in a standard solution of the target analyte before use.
2. Hydrolysis Reaction and Real-Time Monitoring:
- Reaction Setup: Prepare the drug solution in the appropriate buffer or biological medium (e.g., serum for in-vitro metabolism studies) at a controlled temperature.
- Data Acquisition: Immerse the conditioned sensor and a reference electrode into the reaction vessel. Connect the electrodes to a high-impedance data logger or potentiometer.
- Kinetic Tracking: Initiate the hydrolysis reaction (chemically or enzymatically) and record the potentiometric signal continuously over time.
- Data Analysis: Convert the measured potential to concentration using a pre-established calibration curve. Plot concentration versus time to determine the degradation kinetics.
Workflow Diagram: In-Vitro Drug Hydrolysis Monitoring
The Scientist's Toolkit: Research Reagent Solutions
Table 2: Essential Materials for Potentiometric Sensor Development
| Category | Reagent/Material | Function in the Experiment | Example Use Case |
|---|---|---|---|
| Solid Contact & Transducer Materials | PEDOT:PSS / Graphene nanocomposite | Ion-to-electron transducer; enhances sensitivity and reduces drift by providing high redox capacitance and a large electroactive surface area. | Wearable sweat sensors for Na+, K+ [53]. |
| Functionalized Multi-Walled Carbon Nanotubes (f-MWCNTs) | Ion-to-electron transducer layer in all-solid-state electrodes; improves charge transfer and stability. | Microneedle sensors for multi-ion detection [54]. | |
| Ion-Selective Sensing Materials | Prussian Blue Analogues (e.g., K₂Co[Fe(CN)₆]) | Acts as an ionophore for K+ sensing; capable of reversibly incorporating K+ ions. | Wearable potentiometric K+ sensor in sweat [57]. |
| Na0.44MnO2 | Sensing material (ionophore) for selective detection of sodium ions. | Wearable potentiometric Na+ sensor [57]. | |
| Polyaniline (PANI) / Iridium Oxide (IrOx) | pH-sensitive binary-phase material; PANI provides mechanical stability, IrOx provides high pH sensitivity. | Robust pH sensor in sweat [53]. | |
| Stability & Selectivity Enhancers | Nafion | Cation-exchange polymer top coat; facilitates selective cation transport, mitigates sensor degradation and biofouling. | Long-term stable sweat sensors [53]. |
| Polyvinyl Butyral (PVB) with NaCl | Membrane component for a stable, low-drift quasi-reference electrode. | Reference electrode in wearable sensors [57]. | |
| Sensor Fabrication | Polypyrrole (electropolymerized) | Solid contact material for ion-selective electrodes; provides good stability and transduction properties. | Nitrate sensor for long-term use [10]. |
Troubleshooting Drift: Practical Protocols for Maintenance and Performance Optimization
Frequently Asked Questions
What is the most common mistake that shortens an electrode's lifespan? The most common mistake is submerging the entire head of an electrode holder in cleaning fluid or electrolyte. The clip mechanism is not waterproof, and immersion can lead to internal corrosion of wiring and solder joints, causing signal failure and contaminating future solutions [58].
My pH readings are unstable and drifting. What should I check first? First, check for air bubbles trapped in the reference chamber or at the sensing tip. Gently shake the electrode to dislodge them [59]. If the issue persists, the reference junction may be clogged. Clean it with an appropriate solution and ensure the filling solution level is higher than the sample to maintain positive pressure [59].
How can I tell if my pH electrode needs to be replaced? All pH electrodes have a finite lifespan and will eventually need replacement. Signs include very slow response even after cleaning and conditioning, inability to calibrate properly (slope value is too low), or significant drift that cannot be stabilized [59].
What is the proper way to store an electrode between measurements during a single day? For short-term storage between measurements, you can soak the pH electrode in a pH 7.00 buffer or clean water (e.g., tap, distilled, or deionized) [59].
Is it acceptable to wipe the glass membrane of a pH electrode dry with a tissue? No, you should avoid wiping or rubbing the glass membrane. Instead, rinse the electrode with clean water and blot it gently with a soft, lint-free tissue to remove excess water. Wiping can scratch the membrane, remove the essential hydrated layer, and create static charge, leading to inaccurate readings [59].
Troubleshooting Common Electrode Problems
| Problem | Possible Causes | Solutions |
|---|---|---|
| Slow or drifting response [59] | Clogged reference junction, contaminated filling solution, dehydrated glass membrane. | Clean the junction; replace the filling solution; condition the electrode by soaking in pH 7.00 buffer for at least 1 hour [59]. |
| Inaccurate readings or calibration failure [59] [60] | Damaged or dehydrated glass membrane, clogged junction, insufficient filling solution. | Condition the electrode; clean the junction; top up filling solution to ensure positive head pressure [59]. |
| Noisy or erratic signal [58] [61] | Electrical interference, contaminated electrode surface, poor connections, internal corrosion from immersion. | Ensure all connections are secure; clean and re-polish the electrode surface; avoid immersing the electrode holder head [58] [61]. |
| Bubbles in the reference chamber [59] | Bubbles trapped during filling or transportation. | Gently shake the electrode to dislodge the bubbles [59]. |
Detailed Maintenance Protocols
Routine Cleaning Procedures
The cleaning method depends on the type of contaminant encountered during experiments [59].
| Contaminant Type | Recommended Cleaning Solution | Procedure |
|---|---|---|
| General/Inorganic residues | Cleaning Solution 220 (10% thiourea, 1% HCl) or 0.1M HCl [59] | Soak the electrode tip for at least 1 hour. Rinse thoroughly with clean water afterward [59]. |
| Protein residues | Cleaning Solution 250 (contains enzyme protease) [59] | Soak the electrode tip for at least 1 hour. Rinse thoroughly with clean water afterward [59]. |
| Oily or organic residues | Warm, diluted detergent solution [59] | Soak for 5-10 minutes with moderate stirring. For glass-body electrodes only, you can also rinse with methanol or ethanol. Do not use organic solvents on plastic-body electrodes [59]. |
Workflow for Proactive Electrode Maintenance:
Electrode Polishing Guide for Solid Electrodes
Polishing restores a fresh, reproducible surface. The aggressiveness of the polish should match the level of contamination [61].
| Polishing Level | Grit Sequence | When to Perform |
|---|---|---|
| Routine Cleaning | 0.05 μm alumina slurry [61] | Daily or after few uses for gentle touch-up [61]. |
| Periodic Cleaning | 0.3 μm alumina → 0.05 μm alumina [61] | Several times per week for more aggressive polishing [61]. |
| Aggressive Cleaning | 5 μm alumina (Nylon pad) → 0.3 μm → 0.05 μm [61] | For contaminated surfaces or visible adsorbed material [61]. |
Protocol:
- Affix Pad: Remove the backing and affix the appropriate polishing cloth (microfiber for 0.3/0.05μm, Nylon for 5μm) to a stiff, flat surface like glass [61].
- Apply Slurry: Dispense a small spot (approx. 3mm) of the alumina slurry onto the pad [61].
- Polish: Polish the electrode against the slurry, keeping the surface parallel to the cloth. Use a figure-8 pattern while gently turning the electrode for 5-10 minutes per step [61].
- Rinse: Clean all alumina particles off the electrode using distilled water [61].
- Ultrasonicate (Optional): Rinse the electrode surface in an ultrasonication bath with distilled water for 1-5 minutes to shake loose any embedded particles. Suspend only the electrode surface, not the entire assembly [61].
Conditioning and Storage
Conditioning: A dry pH electrode will give inaccurate readings. Before use, and after cleaning or prolonged storage, condition the electrode by soaking the glass membrane and junction in pH 7.00 buffer for at least 1 hour to regenerate the essential hydrated layer [59].
Long-Term Storage:
- Clean First: Ensure the electrode is clean before storage [59].
- Refill (if applicable): For liquid-filled electrodes, ensure the reference chamber is filled with fresh 3.33M KCl solution. Cover the refilling port with the slider to prevent evaporation [59].
- Protective Cap: Wash the white protective cap with clean water to wet the sponge inside and remove any KCl salts. Insert the electrode into the cap. The wet sponge provides a moist environment to keep the membrane and junction hydrated. Do not fill the cap with water [59].
Electrode Troubleshooting and Maintenance Logic:
The Scientist's Toolkit: Essential Research Reagents & Materials
| Item | Function |
|---|---|
| 3.33M KCl Filling Solution [59] | Ionic solution for liquid-filled reference electrodes; maintains a stable potential and prevents reverse flow into the electrode [59]. |
| pH Buffers (e.g., 4.01, 7.00, 10.01) [59] | Used for calibrating the potentiometric system and verifying the Nernstian slope of the electrode response [59]. |
| Alumina (Al₂O₃) Polishing Slurries (5 μm, 0.3 μm, 0.05 μm) [61] | Abrasive suspensions for polishing solid electrode surfaces to a mirror finish, removing adsorbed contaminants and revealing a fresh, electroactive surface [61]. |
| Cleaning Solution 220 (10% thiourea, 1% HCl) [59] | For removing inorganic residues and clearing clogged reference junctions [59]. |
| Cleaning Solution 250 (enzyme protease) [59] | For digesting and removing protein residues from the glass membrane and junction [59]. |
| Microfiber & Nylon Polishing Pads [61] | Adhesive-backed cloths used on a flat surface with alumina slurries for routine and aggressive polishing, respectively [61]. |
Implementing Real-Time Temperature Compensation in Dynamic Environments
Frequently Asked Questions
Q1: Why is real-time temperature compensation critical for potentiometric measurements in dynamic environments?
Potentiometric sensors exhibit inherent temperature dependence according to the Nernst equation, where the electrode potential changes with temperature even at constant ion concentration. Without compensation, significant measurement errors occur. For example, in sweat electrolyte monitoring, a temperature differential of 10°C can introduce substantial mathematical inaccuracies in biomarker concentration calculations. Commercial pH buffer solutions demonstrate this clearly—a pH 10 buffer varies from 10.19 to 9.79 across 5-50°C, creating a 0.4 pH error that critically impacts healthcare monitoring [53].
Q2: What temperature ranges do these compensation methods need to withstand in real-world applications?
Effective compensation systems must operate across extreme temperature variations encountered in real-world scenarios. Research demonstrates successful operation from sub-10°C conditions during outdoor exercise to extreme heat exposure exceeding 50°C in environments like dry saunas, with some systems validated from 8°C to 56°C [53].
Q3: How do hardware and software compensation approaches differ?
Hardware compensation utilizes circuits like numerically controlled voltage bias and adjustable gain circuits to directly modify sensor outputs, ideal for highly repeatable drift patterns. Software compensation employs mathematical algorithms, including machine learning, to correct measurements post-acquisition, better handling non-linear and complex drift behaviors [62] [63].
Q4: Can machine learning effectively compensate for both temperature drift and matrix effects?
Yes, deep neural networks demonstrate particular effectiveness in cross-compensation. Research on ISFET sensors shows DNNs can reduce relative root-mean-square error by 73% over standard two-point calibration by simultaneously addressing temporal drift and cross-sensitivities to interfering ions like Na+ and K+ [64].
Q5: What transducer materials enhance temperature stability in potentiometric sensors?
Advanced materials like PEDOT:PSS/graphene composites function as superior ion-to-charge transducers, providing high redox capacitance and expanded electroactive surface area. These materials maintain signal drift below 0.1 mV over 14 consecutive days, while Nafion top layers facilitate selective cation transport and mitigate sensor degradation [53] [65].
Troubleshooting Guides
Problem: Excessive Drift in Field Measurements
Symptoms: Consistent upward or downward potential drift during extended outdoor monitoring; inaccurate concentration readings despite proper calibration.
Solutions:
- Implement dual compensation for both zero-point drift and amplitude drift using numerically controlled voltage circuits [62]
- Integrate real-time skin temperature sensing with tailored calibration curves for actual application temperatures rather than relying on room-temperature calibrations [53]
- Deploy PEDOT:PSS/graphene transducer layers to minimize signal drift below 0.1 mV over 14 days [53]
- Apply deep neural networks for cross-compensation of multiple drift sources using arrayed sensors with different selectivities [64]
Problem: Slow Response Time in Dynamic Temperature Environments
Symptoms: Lag between actual temperature changes and compensated readings; failure to track rapid physiological changes during exercise.
Solutions:
- Optimize transducer layer with mixed capacitance materials (PEDOT:PSS/graphene) for faster charge transfer dynamics [53]
- Implement Bayesian inversion compensation methods that reduce settling time from 2.48 seconds to 0.15 seconds in probe systems [66]
- Ensure proper Nafion layering to facilitate rapid cation transport while maintaining selectivity [53]
Problem: Compensation Failure Under Extreme Temperature Conditions
Symptoms: System provides accurate compensation at room temperature but fails during sauna exposure or outdoor winter monitoring.
Solutions:
- Validate compensation algorithms across the entire operational range (8-56°C) with real-world testing in dry saunas and sub-10°C outdoor exercise [53]
- Incorporate intrinsic characteristic analysis of response curves that remain invariant across temperature extremes [67]
- Utilize hardware-circuit-based amplitude drift compensation with automatic adjustment of resistor values via microcontroller [62]
Performance Comparison of Compensation Methods
The table below summarizes the effectiveness of different temperature compensation approaches:
| Compensation Method | Accuracy Improvement | Implementation Complexity | Best Application Context |
|---|---|---|---|
| Dynamic Temperature Compensation [53] | Accurate across 8-56°C range | High | Wearable sweat sensors, physiological monitoring |
| Numerically Controlled Voltage [62] | Effective for repeatable drift patterns | Medium | Capacitive displacement sensing, industrial systems |
| Neural Network AI-ReSCU [63] | Recovers up to 1.6 hPa error | High | MEMS pressure sensors, precision localization |
| Deep Neural Networks [64] | 73% error reduction vs. standard calibration | High | ISFET arrays, water quality monitoring |
| Bayesian Inversion [66] | Overshoot reduced from 99.15% to 16.46% | Medium | Contact probes, high-precision measurement |
Experimental Protocols
Protocol 1: Dynamic Temperature Compensation for Wearable Sweat Sensors
This methodology enables accurate electrolyte monitoring during physiological activities with varying skin temperature [53].
Materials:
- Flexible microsensor array with pH, Na+, K+ ion-selective membranes
- Laser-induced graphene (LIG) temperature sensor
- Reference electrode (Ag/AgCl)
- Wireless potentiometric measurement circuit
- PEDOT:PSS/graphene ion-to-charge transducer
- Nafion top layer for selective cation transport
Procedure:
- Fabricate sensor array with integrated temperature sensing adjacent to ion-selective electrodes
- Collect baseline calibration curves at multiple known temperatures (8°C, 25°C, 37°C, 56°C)
- Implement real-time temperature correction algorithm:
Corrected_Value = Raw_Value × [1 + α(T - T_calibration)]where α is the temperature coefficient specific to each ion-selective membrane - Validate compensation accuracy during human trials with moderate outdoor exercise (sub-10°C) and extreme heat exposure (dry sauna >50°C)
- Verify long-term stability over 14-day continuous operation
Validation Metrics:
- Potential drift < 0.1 mV over 14 days
- Sensitivity slopes: Na+ (∼96.1 mV/dec), K+ (∼134.0 mV/dec)
- Linear response within physiological sweat range (Na+ 10e-4 to 10e-2 M; K+ 10e-4 to 5×10e-3 M)
Protocol 2: Machine Learning Compensation for Sensor Arrays
This approach uses deep neural networks to simultaneously address temperature drift and matrix effects in ISFET arrays [64].
Materials:
- Array of ISFET sensors selective to H+, Na+, K+
- Reference commercial pH sensor for training data
- Data acquisition system with continuous monitoring capability
- Computing platform for DNN implementation
Procedure:
- Collect temporal data from ISFET array and reference sensor over 90 consecutive days
- Extract features from sensor responses including steady-state and transient characteristics
- Train DNN model with sensor array outputs as features and reference measurements as targets
- Implement network architecture with input layer (sensor readings), hidden layers (non-linear transformations), and output layer (corrected pH)
- Deploy trained model for real-time prediction of actual ion concentrations from drifted sensor readings
Validation Metrics:
- 73% reduction in root-mean-square error compared to two-point calibration
- Precise pH monitoring maintenance for longer than one week
- Robust performance across varying water quality conditions
Experimental Workflow Visualization
Compensation Workflow
Research Reagent Solutions
The table below details essential materials for implementing advanced temperature compensation strategies:
| Research Reagent | Function | Application Context |
|---|---|---|
| PEDOT:PSS/Graphene [53] | Ion-to-charge transducer with enhanced sensitivity and stability | Wearable potentiometric microsensors |
| Nafion Top Layer [53] | Selective cation transport and sensor degradation mitigation | Long-term sweat electrolyte monitoring |
| Multi-Walled Carbon Nanotubes (MWCNTs) [68] | Transducer layer improving stability and detection limit | Eco-friendly screen-printed electrodes |
| BAPTA-based Copolymer [65] | Selective calcium chelating properties in polymer matrix | Inflammation detection around implants |
| Schiff Base Modified Graphite [34] | Selective Cu(II) ion recognition in carbon paste electrodes | Environmental and pharmaceutical samples |
| 2-Methyltetrahydrofuran (MeTHF) [68] | Eco-friendly solvent for ion-selective membrane preparation | Green analytical chemistry applications |
Advanced Compensation Architecture
System Architecture
FAQs: Addressing Common Calibration Challenges
1. How can I perform calibration for sensors deployed in the field without frequent manual intervention? Implement an in-situ calibration approach that uses natural temperature variations to monitor drift and update calibration parameters automatically. This method uses temperature changes in the field to obtain time-varying calibration parameters without relocating sensors or using complex systems. A temperature-supervised monitoring method detects sensor drift during operation, allowing for periodic correction to maintain high-precision sensing [69]. For potentiometric sensors, an integrated system with a microfluidic flow cell can automate two-point calibration using pumps and valves controlled by a single PCB circuit, enabling long-term in situ measurements [70].
2. What calibration update methods are effective for correcting drift in potentiometric sensor arrays? For potentiometric sensor arrays affected by drift, multivariate model expansion methods generally outperform simple signal standardization. Effective techniques include:
- Calibration update by weighting
- Tikhonov regularization
- Joint Y-PLS (JYPLS) regression
These methods can reduce prediction errors for new data to the level of cross-validation error for initial calibration data. While slope and bias correction offers only limited improvement, the aforementioned methods successfully address both linear and concentration-dependent response changes caused by sensor drift [71].
3. Are auto-calibration features in analytical instruments sufficient for regulatory compliance? No, auto-calibration features cannot replace external performance checks entirely. For example, built-in auto-calibration in analytical balances must be verified periodically using external, traceable standards. Regulatory guidance recommends external performance checks on a periodic basis, though potentially less frequently than for devices without auto-calibration features. The verification frequency should depend on the instrument's usage frequency and the criticality of the application [72].
4. How much measurement error is acceptable before it significantly impacts process monitoring? Measurement systems contributing up to 50% of total variance can still effectively detect process shifts in control charts. Traditional guidelines suggesting less than 10% measurement system variance may be overly restrictive for many applications. Dr. Donald Wheeler's classification system provides a more practical framework for evaluating measurement system usefulness based on its ability to detect process changes rather than arbitrary variance thresholds [73].
5. What are the key considerations when calibrating RGB-D sensors for 3D measurement applications? Calibration is particularly important for RGB-D sensors as they often operate at the limit of their sensitivity. Key considerations include:
- Selecting appropriate calibration methods based on sensor technology (structured light vs. time-of-flight)
- Accounting for residual errors in depth images after initial calibration
- Using correction patterns to address errors that decrease with distance from the subject
- Validating calibration accuracy through object reconstruction applications [74]
Troubleshooting Guides
Problem: Unstable Potentiometric Sensor Readings
Potential Causes and Solutions:
| Cause | Diagnostic Steps | Solution |
|---|---|---|
| Aqueous Layer Formation | Check for potential drift in solid-contact ISEs | Use hydrophobic solid-contact materials (conducting polymers/carbon nanomaterials) to prevent water layer [9] |
| Sensor Drift | Monitor potential stability over time in reference solution | Implement continuous two-point calibration via integrated microfluidic system [70] |
| Temperature Variation | Compare readings at different temperatures | Apply temperature-supervised calibration using natural temperature variations [69] |
| Selectivity Issues | Test with interferent ions | Use multivariate calibration update methods (Weighting, JYPLS) to address altered selectivity [71] |
Problem: Inadequate Measurement System Precision
Diagnostic Flowchart:
Experimental Protocols for Key Calibration Methods
Protocol 1: In Situ Calibration Using Temperature Supervision
Objective: Implement drift monitoring and calibration for field-deployed potentiometric sensors using temperature variations without manual intervention [69].
Materials:
- Potentiometric ion-selective electrodes (e.g., nitrate ISEs)
- Temperature monitoring system
- Data logging capability
- Field deployment setup
Procedure:
- Sensor Deployment: Deploy sensors in the field environment where natural temperature variations occur.
- Data Collection: Continuously record both potential measurements and temperature readings.
- Drift Monitoring: Apply temperature-supervised algorithm to detect time-dependent voltage drift.
- Parameter Calculation: Use temperature variation data to calculate time-varying calibration parameters.
- Validation: Compare field measurements with laboratory-based analysis to verify within 10% agreement.
Protocol 2: Automated Two-Point Calibration for Potentiometric Sensors
Objective: Establish self-calibration capability for long-term potentiometric measurements using an integrated microfluidic system [70].
Materials:
- PCB-based multiplexed SCISE sensor (K+ and NO3− vs. Ag/AgCl)
- Microfluidic flow cell
- PCB circuit with sensor readout and fluid control modules
- Miniaturized peristaltic pump and solenoid valves
- Calibration standards (two concentrations)
Procedure:
- System Setup: Embed multiplexed SCISE sensor into microfluidic flow cell connected to pump and valves.
- Flow Control Programming: Program PCB circuit to alternate between sample measurement and calibration cycles.
- Two-Point Calibration: Automatically introduce two standard solutions at regular intervals (e.g., every 24 hours).
- Response Verification: Confirm sensors maintain near-Nernstian response (56.6 mV/dec for K+; -57.4 mV/dec for NO3−).
- Performance Validation: Test sensor system with actual samples (e.g., plant sap) and compare to reference methods.
Quantitative Data Comparison of Calibration Methods
Table 1: Comparison of Potentiometric Sensor Calibration Methods
| Method | Principle | Drift Reduction | Implementation Complexity | Best Application Context |
|---|---|---|---|---|
| Temperature-Supervised Calibration [69] | Uses temperature variation to estimate drift | Maintains within 10% of lab measurements | Medium | Field-deployed environmental sensors |
| Automated Two-Point Calibration [70] | Microfluidic introduction of standard solutions | Enables 3+ weeks of stable operation | High | Laboratory or controlled field settings |
| Multivariate Model Expansion [71] | Mathematical correction of sensor responses | Reduces error to cross-validation level | Medium | Sensor arrays (electronic tongues) |
| Joint Y-PLS Regression [71] | Joint modeling of initial and new data | Most effective for non-linear drift | High | Complex sample matrices |
Table 2: Performance Metrics of Solid-Contact Materials for Potentiometric Sensors
| Solid Contact Material | Potential Stability | Transduction Mechanism | Suitability for Wearable Sensors |
|---|---|---|---|
| Conducting Polymers (PEDOT) [9] | ~10 µV/h potential drift | Redox capacitance | High (flexible, biocompatible) |
| Carbon Nanomaterials [9] | High stability | Double layer capacitance | High (mechanical robustness) |
| Coated Wire Electrodes [9] | Significant drift | Direct transduction | Low (unstable potential) |
The Scientist's Toolkit: Essential Research Reagents and Materials
Table 3: Key Materials for Potentiometric Sensor Development and Calibration
| Material/Reagent | Function | Example Applications |
|---|---|---|
| Mesoporous Carbon Black (MCB) [70] | Solid-contact ion-to-electron transducer | PCB-based SCISE sensors |
| Ionophores (Valinomycin) [70] | Selective ion recognition in membrane | K+-selective electrodes |
| Polyvinyl Chloride (PVC) [70] | Polymer matrix for sensing membrane | Potentiometric sensor fabrication |
| Tridodecylmethylammonium Nitrate [70] | Ion-exchanger in sensing membrane | NO3−-selective electrodes |
| Conducting Polymers (PEDOT) [9] | Solid-contact with redox capacitance | Wearable potentiometric sensors |
| Chalcogenide Glass Membranes [71] | Sensing material for heavy metals | Cu²⁺, Pb²⁺, Cd²⁺ detection |
Methodological Workflow Diagram
Troubleshooting Guides
Common Performance Issues and Solutions
Table 1: Troubleshooting Guide for Potentiometric Sensor Performance Degradation
| Symptom | Potential Causes | Diagnostic Steps | Corrective Actions |
|---|---|---|---|
| Sluggish Response | - Aged or dehydrated glass membrane [45]- Contaminated diaphragm [45]- Stagnant hydrated layer on glass [60] | - Check sensor storage history [45]- Inspect for physical damage [45]- Test response time in fresh buffer [45] | - Rehydrate membrane by soaking in storage solution [45]- Clean or replace the sensor [45]- Etch glass membrane with dilute ammonium bifluoride [60] |
| Unstable Readings (Drift) | - Unstable liquid junction potential (clogged diaphragm) [45] [60]- Formation of an aqueous layer in solid-contact sensors [9]- Inadequate outflow of electrolyte [45] | - Verify electrolyte level and free outflow [45]- Check for clogging by observing electrolyte flow [45]- Monitor potential over time in a stable solution [9] | - Top up or replace electrolyte [45]- Clean the diaphragm [45]- Use sensors with hydrophobic solid-contact materials (e.g., conducting polymers) [9] |
| Erratic Output or Noise | - Loose wiring or poor solder joints [75]- Dirty or oxidized internal wiper (in electronic pots) [75]- Electromagnetic interference (EMI) [75] | - Inspect and resecure all connections [75]- Use a multimeter to check for intermittent connections [75] | - Clean potentiometer contacts [75]- Use shielded cabling, grounded at one end [75]- Ensure robust chassis grounding [75] |
| Inaccurate Calibration (Low Slope) | - Damaged or expired calibration buffers [45]- Sensor contamination from sample matrix [45]- Incorrect buffer values entered into instrument [45] | - Use fresh, certified buffers [45]- Check calibration slope and offset values [45]- Perform a second calibration with different buffers | - Replace with fresh buffers [45]- Clean sensor thoroughly after sample measurement [45]- Select correct buffer table in the instrument [45] |
| Signal Drop Upon Stirring | - Asymmetrical concentration gradients across the membrane [30]- Diaphragm type susceptible to stirring effects [45] | - Observe signal while switching stirrer on/off [45]- Identify diaphragm type (e.g., ceramic pin vs. fixed ground-joint) [45] | - Keep stirring speed constant for all samples and buffers [45]- Use electrodes with fixed ground-joint diaphragms [45] |
Advanced Diagnostic: The Backside Calibration Method for Membrane Asymmetry
A novel research methodology known as backside calibration potentiometry can diagnose and correct errors arising from concentration gradients across thin supported liquid membranes, a common source of drift and instability in environmental and in-vivo measurements [30].
Experimental Protocol:
- Principle: Chemical asymmetries across the membrane are assessed by monitoring potential drift when the stirring rate is altered on either side. The disappearance of this stirring effect indicates the disappearance of concentration gradients, signaling that the system has reached a symmetric state [30].
- Procedure:
- Place the thin (e.g., 25 µm) supported liquid membrane between the sample solution and a reference calibration solution [30].
- Vary the concentration of the primary or interfering ion in the reference solution.
- For each change, alter the stirring speed on both sides and observe the potential.
- When the potential becomes independent of the stirring speed, the transmembrane concentration gradient is zero. The sample composition can then be calculated from the known reference solution composition [30].
- Application Example: This method has been successfully demonstrated for determining Pb²⁺ in environmental water samples where H⁺ was the dominant interfering ion at a known pH of 4.0 [30].
The logical workflow for this diagnostic approach is outlined below.
Frequently Asked Questions (FAQs)
Q1: My pH sensor was stored dry and is now slow to respond. Is it permanently damaged? Not necessarily. A dry-stored sensor loses its essential hydration layer. You can often recover it by conditioning the sensor in deionized water or a dedicated storage solution for several hours to rehydrate the glass membrane. For future use, always store the electrode submersed in the recommended storage solution to preserve the hydration layer [45].
Q2: Why is constant stirring so important, and why does the signal drop when I turn the stirrer off? Stirring maintains a consistent diffusion layer at the membrane interface. Some diaphragm types (e.g., ceramic pins) are highly sensitive to stirring changes. When the stirrer stops, the diffusion layer changes, altering the liquid junction potential and causing a signal drop. For consistency, always stir at the same, constant speed for both buffers and samples [45].
Q3: How can I tell if my sensor needs to be replaced? After a calibration, check the sensor's slope and offset (pH(0)) values. A slope outside 95–103% and/or a pH(0) outside the range of 6.8–7.2 indicates the sensor is no longer performing optimally. If cleaning does not restore these parameters, replacement is inevitable [45].
Q4: What are the main advantages of solid-contact ion-selective electrodes (SC-ISEs) over traditional models? SC-ISEs eliminate the inner filling solution, which avoids problems like evaporation, fragility to pressure, and osmotic pressure differences. This makes them more compact, robust, and suitable for wearable sensors, in-vivo monitoring, and applications where maintenance is difficult [9].
Q5: How do conducting polymers in solid-contact sensors improve potential stability? Materials like PEDOT or polypyrrole act as ion-to-electron transducers between the electronic conductor and the ion-selective membrane. They stabilize the potential via a redox capacitance mechanism, significantly reducing drift caused by the formation of unwanted water layers [9].
The Scientist's Toolkit: Key Research Reagents & Materials
Table 2: Essential Materials for Potentiometric Sensor Development and Troubleshooting
| Item | Function | Application Note |
|---|---|---|
| Celgard 2500 Membrane | A microporous polypropylene flat sheet used as a support for thin liquid membranes [30]. | Key for fabricating supported liquid membranes in research applications like backside calibration potentiometry [30]. |
| Ionophores (e.g., Lead Ionophore IV) | Neutral or charged molecular carriers that selectively complex with a target ion within the sensing membrane [30] [60]. | The heart of the sensor's selectivity. Different ionophores are required for different analytes (K+, Ca2+, etc.) [60]. |
| Lipophilic Salts (e.g., ETH 500, NaTFPB) | Lipophilic ions (e.g., tetraphenylborate derivatives) added to the membrane to reduce anion interference and lower membrane resistance [30]. | They act as the counter-ions for the primary ion-ionophore complex, ensuring permselectivity and a Nernstian response [60]. |
| Poly(Vinyl Chloride) (PVC) | A common polymer matrix used to form the bulk of the ion-selective membrane [30] [60]. | Provides a stable, inert matrix that hosts the ionophore, lipophilic salt, and plasticizer. |
| Plasticizers (e.g., DOS) | High-boiling-point solvents added to the PVC matrix to impart flexibility and ensure mobility of the ionophore and ions within the membrane [60]. | Crucial for achieving fast ion exchange kinetics and a proper sensor response time. |
| Conducting Polymers (e.g., PEDOT, PPy) | Serve as the ion-to-electron transducer layer in solid-contact ISEs, stabilizing the potential [9]. | Applied between the electronic conductor and the ion-selective membrane to prevent aqueous layer formation and minimize drift [9]. |
| Fresh Buffer Solutions | Certified standard solutions with precisely known pH/ion activity for sensor calibration [45]. | Never use expired buffers. The accuracy of a calibration is directly tied to the quality of the buffers used [45]. |
The core components and ion-transfer pathways of a modern solid-contact ion-selective electrode are illustrated below, highlighting the critical role of the transducer layer.
Enhancing Selectivity with Molecularly Imprinted Polymers (MIPs) for Specific Analytes
Potentiometric sensors are powerful tools for direct, rapid ion concentration measurement, but their performance can be compromised by selectivity issues and potential drift. Molecularly Imprinted Polymers (MIPs) serve as synthetic, tailor-made receptors that fundamentally enhance sensor selectivity by creating binding sites complementary to your target analyte. This technical resource explores the integration of MIPs to mitigate drift and selectivity challenges, providing practical guidance for researchers and drug development professionals.
Troubleshooting Guides
FAQ: MIP Design and Synthesis
What is the fundamental principle behind MIPs? MIPs are three-dimensional polymeric networks containing cavities that complement the template molecule (your target analyte) in shape, size, and functional group arrangement. After template removal, these cavities act as synthetic receptors capable of selectively recognizing and rebinding the target through host-guest interactions like hydrogen bonding, Van der Waals forces, and electrostatic interactions [76] [77].
Which polymerization method is most recommended for creating MIPs for sensors? The precipitation polymerization technique is widely and successfully used across recent studies [76] [49] [77]. It consistently produces polymers with excellent binding properties suitable for sensor applications.
What are typical monomer-to-template ratios used in MIP synthesis? While optimal ratios can vary, a common successful protocol uses a 1:2:20 molar ratio of template molecule (e.g., drug), functional monomer (e.g., methacrylic acid), and cross-linker (e.g., EGDMA) [76]. Other studies have effectively used a 1:4:25 ratio [78]. A systematic review of the ratios used in recent literature is provided in the table below.
Table 1: Typical MIP Synthesis Parameters via Precipitation Polymerization
| Component | Role | Common Reagents | Typical Molar Ratio (Template:Monomer:Cross-linker) |
|---|---|---|---|
| Template | Target molecule for imprinting | Safinamide, Piroxicam, Donepezil [76] [49] [77] | 1 |
| Functional Monomer | Binds to template via non-covalent interactions | Methacrylic acid (MAA) [76] [77] [78] | 2 - 4 |
| Cross-linker | Creates rigid polymer network | Ethylene glycol dimethacrylate (EGDMA) [76] [49] [77] | 20 - 25 |
| Initiator | Starts polymerization reaction | Azobisisobutyronitrile (AIBN) [49] [77] [78] | ~0.6 mmol per total mixture |
| Porogenic Solvent | Dissolves components and creates pore structure | Dimethylsulfoxide (DMSO) [77] [78] | 40-50 mL |
FAQ: Sensor Performance and Stability
My sensor shows unstable potential readings. What could be the cause? Potential drift in solid-contact ion-selective electrodes (SC-ISEs) is often caused by the formation of a water layer between the ion-selective membrane and the underlying solid-contact electrode surface. This water layer acts as an electrolyte reservoir that re-equilibrates with sample changes, destabilizing the potential [76] [9] [77].
How can I prevent water layer formation in my MIP-based sensor? Incorporate a hydrophobic transducer interlayer. Multi-walled carbon nanotubes (MWCNTs) or graphene nanoplatelets are highly effective. They provide high hydrophobicity, excellent electrical conductivity, and a large surface area, which enhances ion-to-electron transduction and blocks water layer formation [76] [49] [77].
My sensor's selectivity is lower than expected. How can I improve it?
- Verify MIP quality: Ensure complete template removal after synthesis using UV-Vis or other spectroscopic methods [76] [78].
- Optimize membrane composition: Adjust the ratio of MIP particles to other membrane components like PVC and plasticizer [76].
- Check transducer layer: A well-formed, homogeneous carbon nanomaterial layer (MWCNT/graphene) improves overall signal stability and sensitivity, which supports selectivity [49] [48].
Experimental Protocols
Detailed Protocol: MIP Synthesis via Precipitation Polymerization
This protocol is adapted from methods successfully used for creating MIPs for pharmaceutical compounds like safinamide and carvedilol [76] [78].
Reagents Needed:
- Template molecule (e.g., target drug, 0.5-1.0 mmol)
- Functional monomer (e.g., Methacrylic acid, 2.0-4.0 mmol)
- Cross-linker (e.g., EGDMA, 8.0-25 mmol)
- Initiator (e.g., AIBN, ~0.6 mmol)
- Porogenic solvent (e.g., DMSO, 40 mL)
Procedure:
- Pre-polymerization Complex Formation: Dissolve the template (0.5-1.0 mmol) in 40 mL of DMSO in a glass-capped bottle. Add the functional monomer (e.g., MAA, 2.0-4.0 mmol) and sonicate the mixture for 15 minutes to allow self-assembly [77] [78].
- Addition of Cross-linker and Initiator: Add the cross-linker (e.g., EGDMA, 8.0-25 mmol) and the initiator (AIBN, 0.6 mmol) to the mixture. Sonicate briefly for 1 minute to ensure complete dissolution and mixing [76] [77].
- Polymerization: Purge the solution with nitrogen gas for 10-15 minutes to remove oxygen. Place the sealed bottle in a thermostatic water bath or oil bath at 60°C for 24 hours to complete the polymerization reaction [49] [78].
- Washing and Template Removal: Filter the resulting white precipitate. Wash repeatedly with ethanol and centrifuge to remove unreacted components. Extract the template molecules using a Soxhlet apparatus or batch-wise washing with a solvent mixture of methanol and acetic acid (9:1, v/v). Monitor the extraction via UV-Vis until no template is detected in the washings [76] [77].
- Drying: Finally, dry the resulting MIP particles in an oven at 100°C before use [78].
Detailed Protocol: Fabricating a Solid-Contact MIP-Based Sensor
This protocol describes constructing a sensor using a glassy carbon electrode (GCE) modified with carbon nanotubes and a MIP-based ion-selective membrane [76].
Reagents Needed:
- Glassy Carbon Electrode (GCE)
- Multi-walled Carbon Nanotubes (MWCNTs)
- MIP particles
- Polyvinyl Chloride (PVC)
- Plasticizer (e.g., 2-Nitrophenyl octyl ether - NPOE)
- Ionic additive (e.g., Potassium tetrakis(4-chlorophenyl)borate - TpClPB)
- Tetrahydrofuran (THF)
Procedure:
- Electrode Preparation: Polish the GCE surface with alumina slurry, then rinse thoroughly with distilled water and dry [76].
- Transducer Layer Application: Prepare a dispersion of MWCNTs in a suitable solvent. Drop-cast a defined volume (e.g., 10 µL) onto the clean GCE surface and allow it to dry completely, forming a hydrophobic ion-to-electron transducer layer [76] [48].
- Membrane Cocktail Preparation: Prepare the sensing membrane cocktail by dissolving the following components in THF (e.g., 5 mL):
- Membrane Deposition: Drop-cast a small volume (e.g., 10 µL) of the membrane cocktail onto the MWCNT-modified GCE. Allow the THF to evaporate at room temperature, leaving a thin, uniform sensing membrane [76].
- Conditioning: Condition the finished sensor by soaking in a solution of the target analyte (e.g., 1 x 10⁻³ M) for several hours or overnight before use [78].
Performance Data and Material Selection
Table 2: Performance Characteristics of Reported MIP-Based Potentiometric Sensors
| Target Analyte | Linear Range (M) | Limit of Detection (M) | Nernstian Slope (mV/decade) | Transducer Layer | Key Application Demonstrated |
|---|---|---|---|---|---|
| Safinamide | Not specified | 8.0 × 10⁻⁷ | 59.30 | MWCNTs | Pharmaceutical tablets, human plasma, milk [76] |
| Piroxicam | 9.7 × 10⁻⁷ – 1 × 10⁻³ | 5.2 × 10⁻⁷ | 28.97 | MWCNTs | Spiked human plasma [49] |
| Donepezil | Not specified | 5.01 × 10⁻⁸ & 4.47 × 10⁻⁷ | ~56.8 | Graphene Nanoplatelets | Combined dosage form, spiked plasma [77] |
| Memantine | Not specified | 2.24 × 10⁻⁷ | 55.87 | Graphene Nanoplatelets | Combined dosage form, spiked plasma [77] |
| Carvedilol | 1 × 10⁻⁷ – 1 × 10⁻³ | 7.0 × 10⁻⁸ | 55.30 | MWCNTs | Pharmaceutical tablets, spiked plasma [78] |
| Ivabradine HCl | 1 × 10⁻⁶ – 1 × 10⁻² | 6.0 × 10⁻⁷ | 55.50 | MWCNTs | Pharmaceutical tablets, spiked plasma [78] |
The Scientist's Toolkit: Essential Research Reagents
Table 3: Key Materials and Their Functions in MIP-Based Sensor Development
| Material Category | Specific Examples | Primary Function |
|---|---|---|
| Functional Monomers | Methacrylic Acid (MAA) | Forms non-covalent interactions with the template during polymerization [76] [77]. |
| Cross-linkers | Ethylene Glycol Dimethacrylate (EGDMA) | Creates a rigid 3D polymer network to stabilize the imprinted cavities [49] [78]. |
| Initiators | Azobisisobutyronitrile (AIBN) | Generates free radicals to initiate the polymerization reaction [77] [78]. |
| Transducer Materials | MWCNTs, Graphene Nanoplatelets | Hydrophobic ion-to-electron transducer; prevents water layer and enhances signal stability [76] [49] [77]. |
| Polymer Matrix | Polyvinyl Chloride (PVC) | Forms the bulk of the ion-selective membrane, providing mechanical stability [76] [78]. |
| Plasticizers | 2-Nitrophenyl octyl ether (NPOE) | Imparts elasticity and mobility to the polymer membrane; influences dielectric constant [76] [77]. |
| Ionic Additives | Tetraphenylborate derivatives (e.g., TpClPB) | Introduces permselectivity and reduces membrane resistance [77] [78]. |
Technical Diagrams and Workflows
MIP-Based Potentiometric Sensing Mechanism
Water Layer Prevention Strategy
Integrating Molecularly Imprinted Polymers with modern solid-contact materials like carbon nanotubes provides a robust strategy to overcome critical challenges in potentiometric sensing. By carefully following the synthesis protocols, troubleshooting guides, and material selection advice outlined in this resource, researchers can develop highly selective and stable sensors capable of determining specific analytes in complex matrices such as pharmaceuticals and biological fluids.
Validating Sensor Performance: Metrics, Comparisons, and Ensuring Reliability
Troubleshooting Guides
FAQ 1: What is measurement drift and how can I minimize it in my potentiometric system?
Answer: Measurement drift is a gradual change in the measurement signal over time, which can adversely affect the accuracy and reliability of potentiometric measurements.
In potentiometric systems, drift typically manifests as an unstable potential reading. For Karl Fischer titrations specifically, drift refers to background moisture that the titrator detects instead of moisture from your sample [79]. This can result from moisture slowly infiltrating the measurement vessel or from a leak allowing continuous moisture entry [79].
To minimize drift:
- Ensure proper electrode conditioning: Prior to using pH or ion-selective electrodes, the exterior surface of the glass membrane must be fully hydrated. Proper conditioning establishes a stable potential across the membrane [40].
- Maintain consistent environmental conditions: Temperature fluctuations can cause significant drift. Maintain a constant ambient temperature (variations of not more than 2°C) and avoid air drafts [80].
- Verify system integrity: Check for leaks in the measurement vessel or electrode mounting that could allow environmental interference [79].
- Allow sufficient stabilization: Before measurements, the system should reach a "ready" mode where the drift becomes low and stable [79].
FAQ 2: How do I determine the Limit of Detection (LOD) and Limit of Quantification (LOQ) for my potentiometric method?
Answer: The Limit of Detection (LOD) is the lowest analyte concentration that can be reliably distinguished from the blank, while the Limit of Quantification (LOQ) is the lowest concentration that can be quantified with acceptable accuracy and precision [81] [82].
Experimental Protocol for Determining LOD and LOQ:
The following workflow outlines the key steps for determining LOD and LOQ:
Determine the Limit of Blank (LoB):
- Analyze a minimum of 20 replicates of a blank sample (containing no analyte).
- Calculate the mean and standard deviation (SD) of these blank measurements.
- LoB = meanblank + 1.645(SDblank) [82]. This represents the highest apparent concentration likely to be observed for a blank sample.
Determine the Limit of Detection (LoD):
- Analyze a minimum of 20 replicates of a sample containing a low concentration of analyte.
- Calculate the mean and standard deviation (SD) of these low-concentration measurements.
- LoD = LoB + 1.645(SD_low concentration sample) [82].
- Verify the LoD by ensuring that no more than 5% of the measured values for the low-concentration sample fall below the LoB [82].
Determine the Limit of Quantification (LoQ):
- The LoQ is the lowest concentration at which the analyte can be measured with predefined goals for bias and imprecision.
- It is determined by testing samples at or above the LoD and identifying the concentration where the assay meets the required performance specifications for precision (e.g., %CV) and accuracy [82].
- LoQ ≥ LoD [82].
The table below summarizes the key parameters for these limits:
| Parameter | Definition | Key Characteristic |
|---|---|---|
| Limit of Blank (LoB) | Highest apparent analyte concentration expected from a blank sample [82]. | Estimates false positive rate (α error). |
| Limit of Detection (LoD) | Lowest concentration reliably distinguished from the LoB [82]. | Detection is feasible, but with potentially high imprecision and bias. |
| Limit of Quantitation (LoQ) | Lowest concentration quantified with acceptable precision and accuracy [82]. | Meets predefined performance goals for the assay. |
FAQ 3: Why is my potentiometric electrode showing poor selectivity and how do I quantify it?
Answer: Poor selectivity occurs when your ion-selective electrode (ISE) responds not only to the primary ion of interest but also to other interfering ions present in the sample solution. This is a common issue described by the Nikolsky-Eisenman equation [83].
To quantify selectivity: The potentiometric selectivity coefficient (Ki,jPot) is the key performance indicator. A smaller Ki,jPot value indicates better selectivity for the primary ion (i) over the interfering ion (j). A value of 1.0 means the electrode responds equally to both ions; a value of 0.001 means the electrode is 1000 times more sensitive to the primary ion [83].
Experimental Protocol for Determining Selectivity Coefficients:
The Fixed Interference Method (FIM) is a commonly recommended approach.
- Prepare solution series: Prepare a series of solutions where the activity of the primary ion (ai) varies, but the activity of the interfering ion (aj) is fixed at a constant level.
- Measure potential: Measure the potential (E) of each solution in the series.
- Plot data: Plot the measured potential (E) versus the logarithm of the primary ion activity (log ai).
- Extract coefficient: The potentiometric selectivity coefficient, Ki,jPot, is determined from the intersection of the extrapolated linear portions of the plot [83].
To improve selectivity:
- Use an Ionic Strength Adjustment Buffer (ISAB): Adding TISAB to both standards and samples ensures similar ionic strength and can reduce interference from other ions [40].
- Select the appropriate membrane: Different ionophores (ion-recognition molecules) in the electrode membrane have different inherent selectivities. Choose an electrode with a membrane designed for your primary ion and specific sample matrix.
- Consider sample preparation: Techniques like dilution or chemical masking can sometimes reduce the concentration or impact of interfering ions.
Research Reagent Solutions
The following table lists essential materials and reagents used in potentiometric experiments for assessing these KPIs.
| Item | Function |
|---|---|
| Ion-Selective Electrode (ISE) | The primary sensor whose performance (drift, LOD, LOQ, selectivity) is being characterized. It generates a potential signal in response to the activity of a specific ion [84]. |
| Reference Electrode | Provides a stable, constant reference potential against which the potential of the ISE is measured, completing the electrochemical cell [84]. |
| Total Ionic Strength Adjustment Buffer (TISAB) | A buffer solution added to standards and samples to maintain a constant ionic strength, control pH, and complex interfering ions, which ensures accurate potentiometric measurements [40]. |
| High-Purity Water | Used for preparing blank solutions, standards, and sample dilutions. Low ionic strength and minimal interference are critical for accurate LOD/LOQ determination. |
| Primary Ion Standard Solutions | Solutions of known, precise concentration used to calibrate the electrode and prepare samples for LOD/LOQ studies. |
| Interferent Ion Solutions | Solutions containing known concentrations of potential interfering ions, used specifically for determining potentiometric selectivity coefficients [83]. |
Standardized Testing Protocols for Electrode Performance and Lifetime
For researchers investigating potentiometric measurement drift, establishing a robust baseline for electrode performance and lifetime is the critical first step. Standardized testing protocols are essential for obtaining reproducible, reliable, and comparable data. This guide provides targeted troubleshooting and best practices to help you isolate the root causes of performance degradation, such as unstable potentials or increasing impedance in your experimental setups. The following sections are structured to address the most common challenges encountered during electrode testing and characterization.
Frequently Asked Questions (FAQs)
Q1: What is the primary cause of potential drift in solid-contact ion-selective electrodes (ISEs)?
Potential drift in solid-contact ISEs is frequently caused by the formation of an undesirable water layer at the interface between the electron-conducting substrate (e.g., metal wire) and the ion-selective membrane. This unstable phase boundary leads to transmembrane ion fluxes. The use of a suitable solid-contact material that acts as an efficient ion-to-electron transducer, such as a hydrophobic conducting polymer (e.g., PEDOT) or carbon-based nanomaterials, is crucial to mitigate this issue and stabilize the measured potential [9].
Q2: How can I quickly verify the electrical integrity of a multi-electrode system before a long-term experiment?
A simple multimeter resistance check can identify many common electrical faults. For a rotating ring-disk electrode (RRDE), for example, you should confirm electrical isolation between different sections. The resistance between the rotator connection (A), disk connection (B), and ring connection (C) should be infinite (open circuit). Conversely, the resistance between the disk connection pin (D) and the disk electrode surface (E) should be very low (typically less than 10 Ω). Similar principles apply to other multi-electrode configurations [85].
Q3: Why is harmonizing testing protocols for electrochemical cells like electrolyzers important for my research on electrode lifetime?
Using harmonized protocols ensures that performance data, such as polarization curves and electrochemical impedance spectroscopy (EIS) results, are accurate and comparable across different laboratories and over time. This is vital for objectively evaluating new electrode materials and structures, identifying true performance improvements, and reliably assessing degradation mechanisms that lead to failure. Standardization helps the community move beyond iterative progress and avoid "running in circles" [86] [87].
Q4: What are the critical safety checks for a pressurized electrolyzer cell test station?
Always perform a nitrogen leak check at a pressure of approximately 30 psi on both the anode and cathode sides after assembling the cell and before applying current. Use a handheld combustible gas detector to check for hydrogen leaks when current is first applied. Install a hydrogen monitoring system set to trigger a cell shutdown at no more than 2% hydrogen by volume (50% of the lower flammability limit). Additionally, ensure your power supply has an upper voltage limit (e.g., 2.5 V) to prevent dangerous over-voltage conditions [87].
Troubleshooting Guides
Troubleshooting High Impedance and Electrical Failures
High impedance or unexpected electrical readings can stem from issues with the electrodes themselves, the connections, or the test station.
Problem: Abnormally high cell voltage or erratic impedance readings.
- Potential Causes and Solutions:
- Loose Electrical Connections: Check that all bolts and connections, especially current-carrying ones, are tightened to the manufacturer's specified torque. Loose connections introduce high resistance and can cause localized overheating [87].
- Damaged Electrode or Shaft: Perform a multimeter test on the electrode and shaft separately. For an RRDE tip, check for conductivity (less than 10 Ω) between the disk pin (D) and disk surface (E), and between the ring connector (F) and ring surface (G). Verify there is infinite resistance (isolation) between the disk and ring sections. If these checks fail, the component may be physically damaged and require repair or replacement [85].
- Contaminated Electrolyte or Cell Components: Ensure ultrapure deionized (DI) water is used. Impurities can foul electrode surfaces and increase impedance. An ion exchange resin in the water loop is recommended to remove contaminants introduced by component degradation [87].
- Potential Causes and Solutions:
Problem: Sudden functional failure (open-circuit or short-circuit) in a single cell within a larger stack or pack.
- Potential Causes and Solutions:
- Manufacturing Defect: A single cell with an internal short can cause overcharging of series-connected cells and rapid discharge of parallel-connected cells, leading to complete pack failure. This underscores the need for rigorous quality control during electrode and cell production to detect microscopic contaminants or geometric tolerances [88].
- Localized Electrode Degradation: Severe lithium plating or active material loss can lead to the formation of an internal short circuit. This is often a root cause of both "knee" points in capacity fade and catastrophic functional failure [88].
- Potential Causes and Solutions:
Troubleshooting Potentiometric Drift and Instability
This section directly addresses the core thesis of investigating potentiometric measurement drift.
Problem: Continuous, monotonic drift in the baseline potential of a solid-contact ISE.
- Potential Causes and Solutions:
- Poor Solid-Contact Transducer: The solid-contact material may have insufficient redox capacitance or double-layer capacitance. Replace or apply a well-established transducer material like PEDOT:PSS or certain carbon nanomaterials, which act as stable ion-to-electron transducers [9].
- Formation of a Water Layer: This is a classical failure mode for coated-wire electrodes. The water layer causes slow ion fluxes, leading to a drifting potential. Using highly hydrophobic solid-contact materials can prevent water uptake and stabilize the potential [9].
- Potential Causes and Solutions:
Problem: Noisy signal or unstable potential readings.
- Potential Causes and Solutions:
- Electrical Interference: Ensure all voltage sense leads are connected as close as possible to the cell components and are shielded. Verify they are not in contact with current-carrying components, which can induce noise [87].
- Unstable Temperature: A fluctuating temperature gradient between the inlet and outlet of an electrolysis cell can cause cell voltage fluctuations. Maintain a stable temperature and keep the inlet-outlet gradient below 2°C [87].
- Potential Causes and Solutions:
Standardized Testing Methodologies
Protocol for PEM Electrolyzer Single-Cell Performance and Lifetime Test
This protocol, adapted from harmonized methods, is crucial for assessing electrode lifetime under realistic operating conditions [87].
1. Preliminary Setup and Safety Checks:
- Cell Setup: Assemble the single-cell hardware with the Membrane Electrode Assembly (MEA).
- Water Loop: Fill the reservoir with high-purity DI water (>1 MΩ·cm). Start the pump and set the heater to the desired operating temperature (e.g., 80°C).
- Leak Check: Pressurize both cell sides with ~30 psi nitrogen gas, close the inlets, and monitor for pressure drops.
- Short-Circuit Check: Before applying power, use a multimeter to verify a high resistance (>1 kΩ) between the cathode and anode terminals.
2. Start-up and Initial Characterization:
- Apply Low Current: Begin with a low current density to initiate electrolysis.
- Hydrogen Leak Check: Use a gas detector around the cell edges.
- Polarization Curve: Measure cell voltage from low to high current density. Hold each current step until the voltage stabilizes to record a steady-state performance baseline.
- Electrochemical Impensity Spectroscopy (EIS): At a fixed current density, perform EIS to probe the various resistance contributions within the cell (ohmic, charge transfer, mass transport).
3. Lifetime and Durability Testing:
- Steady-State Operation: Operate the cell at a constant current density for extended periods (hours, days, or weeks).
- Periodic Characterization: At defined intervals, repeat the polarization curve and EIS measurements to track performance degradation over time, identifying the onset of failure modes like catalyst dissolution or membrane thinning.
The workflow for this protocol is summarized in the following diagram:
Dry Electrorode Powder and Sheet Resistivity Testing
For novel electrode manufacturing processes like dry electrode technology, standardized in-process testing is key to ensuring quality and predicting performance [89].
1. Dry Powder Resistivity vs. Pressure Test (Using PRCD3100-type equipment):
- Purpose: To evaluate the quality of powder fibrillation and its impact on conductive network formation.
- Procedure:
- Place a sample of dry electrode powder into the test fixture.
- Program the instrument to apply pressure from 6 MPa to 350 MPa in steps (e.g., 20 MPa).
- Hold each pressure for 10 seconds, recording the powder's resistivity and thickness (for compacted density).
- Data Interpretation: A lower resistivity at a given pressure indicates better fibrillation of the PTFE binder, which forms a more effective conductive network wrapping the active material particles.
2. Dry Electrode Sheet Resistivity Test (Using BER2500-type equipment):
- Purpose: To assess the consistency and quality of the final rolled electrode sheet.
- Single-Point Test:
- Place the electrode sheet on the platform.
- Apply a fixed pressure (e.g., 5 MPa) for 15 seconds.
- Record the resistance, resistivity, and thickness. Sample multiple points to calculate statistics like Coefficient of Variation (COV).
- Variable-Pressure Test:
- On a single point, ramp pressure from a lower limit (e.g., 5 MPa) to an upper limit (e.g., 60 MPa).
- Hold at each step for 15 seconds and record parameters. This simulates the effect of different calendering pressures.
The table below summarizes key parameters from this methodology:
Table 1: Key Quantitative Parameters for Dry Electrode Testing
| Test Parameter | Target Value or Range | Significance |
|---|---|---|
| Powder Feed Rate (Fibrillation) | Higher rate lowers powder resistivity | Higher shear force improves PTFE fibrillation and conductive network [89] |
| Powder Resistivity | Lower value at same pressure indicates better mixing | Indicator of conductive network quality before calendering [89] |
| Electrode Roll Pressing Force | Higher force lowers sheet resistivity & improves COV | Promotes closer particle contact and a more consistent electrode structure [89] |
| Electrical Connection Resistance | < 10 Ω (for conductive paths) | Verifies integrity of electrode and shaft [85] |
| Electrical Isolation Resistance | Infinity (open circuit) | Confirms isolation between separate electrode elements (e.g., ring and disk) [85] |
The Scientist's Toolkit: Essential Research Reagents & Materials
Table 2: Key Materials for Electrode Fabrication and Testing
| Material / Equipment | Function / Application | Key Consideration |
|---|---|---|
| Solid-Contact Materials (PEDOT, PPy) [9] | Ion-to-electron transducer in solid-contact ISEs. Stabilizes potential by redox capacitance. | Hydrophobicity is critical to prevent water layer formation and potential drift. |
| PTFE Binder [89] | Binder in dry electrode process; fibrillates under shear to form a self-supporting network. | The degree of fibrillation critically impacts electrode film impedance and mechanical strength. |
| Ion Exchange Resin [87] | Purifies water in electrolyzer test loops by removing ionic contaminants. | Maximum operating temperature must be higher than the water temperature to avoid decomposition. |
| High-Purity DI Water (>1 MΩ·cm) [87] | Electrolyte solvent for PEM electrolyzers and other aqueous systems. | Essential to avoid contaminating the electrolyzer cell and fouling electrode surfaces. |
| Potentiostat/Galvanostat [87] | High-precision power supply for techniques like EIS and cyclic voltammetry. | Required for accurate electrochemical diagnostics; boosters may be needed for high-current tests. |
Diagnostic Diagram: Investigating Potentiometric Drift
The following diagram outlines a logical workflow for diagnosing the root causes of potentiometric drift, connecting the troubleshooting guides and methodologies presented in this document.
Troubleshooting Guides
Guide: Diagnosing and Resolving Potentiometric Drift in Solid-Contact ISEs
Problem: Gradual drift in measured potential over time, leading to inaccurate readings.
Explanation: Potential drift indicates an unstable interface between the ion-selective membrane and the underlying electron-conducting substrate. This is often caused by an inadequate ion-to-electron transduction layer, which fails to maintain a stable electrochemical potential [90].
Diagnostic Steps:
- Perform Chronopotentiometry (CP): Apply a small constant current (e.g., ±1 nA for 60 s) and measure the resulting potential drift. A lower potential change (∆E/∆t) indicates a higher capacitance and more stable transducer [90] [91].
- Conduct Electrochemical Impedance Spectroscopy (EIS): Use EIS to evaluate the transducer's bulk resistance (Rb) and double-layer capacitance (Cdl). A low Rb and high Cdl are desirable for stable potential [90].
- Check for Water Layer Formation: Examine the interface between the membrane and transducer for a water layer, which can cause drift. Hydrophobic transducers like graphene help prevent this [91].
Solutions:
- If Drift is High: Select a transducer material with higher hydrophobicity and capacitance. Graphene has demonstrated superior performance with a low short-term drift of 2.6 µV/s [91].
- If Capacitance is Low: Consider multi-walled carbon nanotubes (MWCNTs) or conductive polymers like PEDOT, which create a large interfacial area for high double-layer capacitance [90].
- Ensure Proper Adherence: The transducer must have strong adherence to both the electrode substrate and the ion-selective membrane to prevent delamination and drift [92].
Guide: Addressing Poor Sensor Sensitivity and Selectivity
Problem: Sensor response does not follow the Nernstian equation (non-ideal slope) or shows interference from other ions.
Explanation: Sensitivity and selectivity are primarily governed by the ion-selective membrane's composition. However, an inefficient transducer can lead to signal instability and high resistance, masking the true performance of the membrane [93].
Diagnostic Steps:
- Calibrate the Sensor: Perform a calibration with standard solutions across a range of concentrations. A slope significantly less than the theoretical Nernstian value (e.g., 59.2 mV/decade for monovalent ions at 25°C) indicates poor sensitivity [91].
- Perform a Selectivity Test: Use the separate solution method or fixed interference method to determine the potentiometric selectivity coefficients (K_Pot) for common interfering ions.
Solutions:
- For Poor Sensitivity: Verify the ion-selective membrane composition and deposition. Ensure the transducer layer does not add excessive resistance. Graphene-based transducers have shown Nernstian slopes of 61.9 mV/decade for Li+ [91].
- For Poor Selectivity: Optimize the ionophore, plasticizer, and lipophilic additive in the membrane. The transducer's role is to provide a stable potential, not to confer selectivity.
- Improve Signal Stability: A transducer with high capacitance, like MWCNTs, provides a more stable baseline, which can improve the reliable detection limit [90].
Frequently Asked Questions (FAQs)
Q1: What is the fundamental difference between redox and double-layer capacitance transduction mechanisms?
A1: The mechanism differs based on the transducer material. Redox capacitance is exhibited by conducting polymers (e.g., PEDOT, PANi) and materials like ferrocene. Here, ion-to-electron transduction occurs through reversible oxidation/reduction (redox) reactions of the material itself. The electrical charge is stored in the bulk of the polymer via its doping level [90]. In contrast, double-layer capacitance is exhibited by carbon-based nanomaterials (e.g., graphene, MWCNTs). Here, charge separation occurs at the electrochemical interface between the transducer and the ion-selective membrane, forming an electrical double layer that stores energy electrostatically. No faradaic reactions are involved [90] [91].
Q2: Which transducer material is best for preventing water layer formation?
A2: Materials with high hydrophobicity are most effective. Research has shown that graphene provides a highly hydrophobic surface, which significantly reduces the risk of water layer formation between the transducer and the ion-selective membrane. This hydrophobicity contributes to excellent long-term potential stability [91].
Q3: Why is chronopotentiometry a critical test for solid-contact transducers?
A3: Chronopotentiometry (CP) is used to measure the electrical capacitance of the solid-contact layer and its resulting potential drift. A high capacitance translates to a smaller potential change (∆E/∆t) when a constant current is applied. This high capacitance is crucial for stabilizing the electrode potential against disturbances, such as changes in current, and is a key indicator of a high-performance transducer [90] [91].
Q4: Our lab prioritizes ease of fabrication. What is a simple method for transducer deposition?
A4: Drop-casting is a straightforward and practical method suitable for mass sensor production. This technique involves depositing a solution of the transducer material (e.g., commercial PEDOT:PEG, MWCNT dispersion) directly onto the electrode surface and allowing the solvent to evaporate [93]. It eliminates the need for more complex processes like in-situ electrochemical polymerization.
Quantitative Data Comparison of Transducer Materials
The following table summarizes key performance metrics for various transducer materials, as reported in recent studies. This data aids in the evidence-based selection of materials for specific applications.
Table 1: Electrochemical Performance of Different Ion-to-Electron Transducer Materials
| Transducer Material | Transduction Mechanism | Specific Capacitance (Cp) | Potential Drift (∆E/∆t) | Slope (mV/decade) | Key Findings |
|---|---|---|---|---|---|
| Graphene [91] | Double-Layer Capacitance | 383.4 ± 36.0 µF | 2.6 ± 0.3 µV/s (short-term) | 61.9 ± 1.2 (for Li+) | Highest hydrophobicity and capacitance; lowest drift. |
| Multi-Walled Carbon Nanotubes (MWCNTs) [90] | Double-Layer Capacitance | Not Specified | 34.6 µV/s | 56.1 ± 0.8 (for VEN) | Good electrochemical behavior with a near-Nernstian slope. |
| PEDOT (e.g., PEDOT:PEG) [93] | Redox Capacitance | Not Specified | Low drift (best in study) | Near-Nernstian (for H+) | Excellent sensitivity, reproducibility, and lifetime for pH sensing. |
| Polyaniline (PANi) [90] | Redox Capacitance | Not Specified | Higher than MWCNTs | Lower than MWCNTs | Performance varies based on chemical and physical properties. |
| Ferrocene [90] | Redox Capacitance | Not Specified | Higher than MWCNTs | Lower than MWCNTs | -- |
Table 2: Comparison of Deposition Methods for Different Transducer Materials
| Material | Common Deposition Methods | Notes on Fabrication |
|---|---|---|
| Conducting Polymers (PEDOT, PANi) | Electropolymerization, Drop-Casting [93] [91] | Electropolymerization offers controlled thickness; drop-casting is simpler for mass production [93]. |
| Carbon Nanotubes (MWCNTs) | Drop-Casting, Dispersion Coating [90] | Requires stable dispersion in solvent; method is simple and versatile. |
| Graphene & Derivatives | Using pre-modified Screen-Printed Electrodes (SPEs), Drop-Casting [91] | Commercially available graphene-modified SPEs can simplify the fabrication process. |
| Layer-by-Layer Assemblies (e.g., PEI/PEDOT:PSS) | Sequential Immersion [93] | Provides a controlled, layered structure but involves multiple steps. |
Experimental Protocols for Transducer Evaluation
Protocol: Fabrication of a Drop-Cast Solid-Contact ISE
Objective: To fabricate a solid-contact ion-selective electrode using a drop-cast transducer layer.
Materials:
- Electrode substrates (e.g., Gold, Glassy Carbon, or Screen-Printed Electrodes)
- Transducer material (e.g., PEDOT:PEG dispersion, MWCNT suspension)
- Ion-selective membrane components: Polymer (e.g., PVC, polyurethane), plasticizer (e.g., DOS, o-NPOE), ionophore, lipophilic salt (e.g., KTpClPB)
- Solvents (e.g., Tetrahydrofuran (THF), nitromethane)
- Microsyringe
Procedure:
- Substrate Preparation: Clean the electrode substrate according to standard protocols (e.g., polishing for glassy carbon, plasma treatment for gold to improve adhesion) [93].
- Transducer Deposition:
- Prepare a stable dispersion of the transducer material in the appropriate solvent [93].
- Using a microsyringe, deposit a precise volume (e.g., 5-10 µL) of the dispersion onto the electrode surface.
- Allow the solvent to evaporate, potentially on a heated plate to increase the evaporation rate, forming a thin, solid transducer layer [93].
- Membrane Deposition:
- Prepare the ion-selective membrane cocktail by dissolving the polymer, plasticizer, ionophore, and additives in THF.
- Deposit a volume of the membrane cocktail (e.g., 5 µL) over the solid-contact layer using a microsyringe.
- Allow the THF to evaporate fully, forming a uniform membrane. For photocurable membranes, expose to UV light for the required time (e.g., 50 s) [93].
Protocol: Electrochemical Characterization via Chronopotentiometry and EIS
Objective: To evaluate the capacitance and stability of the solid-contact transducer.
Materials:
- Potentiostat/Galvanostat
- Fabricated SC-ISE
- Reference Electrode (e.g., Ag/AgCl)
- Counter Electrode (e.g., Platinum wire)
- Electrolyte solution (e.g., 0.1 M KCl)
Procedure:
- Chronopotentiometry (CP) for Capacitance:
- Place the SC-ISE, reference, and counter electrodes in a quiet electrolyte solution.
- Apply a constant current of ±1 nA for a set duration (e.g., 60 seconds).
- Record the potential change (∆E) during the current pulse.
- Calculate the capacitance (C) using the formula: C = i / (dE/dt), where
iis the current anddE/dtis the slope of the potential transient [90] [91].
- Electrochemical Impedance Spectroscopy (EIS) for Resistance:
- In the same setup, run an EIS experiment.
- Set a frequency range from high (e.g., 100 kHz) to low (e.g., 0.1 Hz) with a small amplitude sinusoidal perturbation (e.g., 10 mV).
- Analyze the resulting Nyquist plot to determine the bulk resistance (Rb) of the electrode system [90].
Signaling Pathway and Experimental Workflow Diagrams
Diagram 1: Transducer Material Evaluation Workflow
Diagram 2: Core Signal Transduction Pathways
The Scientist's Toolkit: Key Research Reagent Solutions
Table 3: Essential Materials for SC-ISE Fabrication and Characterization
| Item Name | Function / Role | Example from Literature |
|---|---|---|
| PEDOT:PEG | Conducting polymer for redox-based transduction; offers good sensitivity and reproducibility. | Used as a solid-contact layer in low-cost pH-SCISEs, showing best overall results [93]. |
| Graphene | Carbon nanomaterial for double-layer capacitance; provides high hydrophobicity and capacitance. | Used as a transducer for Li+-ISEs, yielding high capacitance (383 µF) and low drift [91]. |
| Multi-Walled Carbon Nanotubes (MWCNTs) | Carbon nanomaterial for double-layer capacitance; creates a large interfacial area. | Acted as a transducer for venlafaxine sensors, showing a near-Nernstian slope and low drift [90]. |
| Polyaniline (PANi) | Conducting polymer for redox-based transduction. | Used in a comparative study of transduction mechanisms for drug detection [90]. |
| High Purity PVC & Plasticizers (e.g., o-NPOE) | Forms the ion-selective membrane matrix; plasticizer determines membrane dielectric constant and ionophore mobility. | Standard components for fabricating the selective membrane in numerous SC-ISE studies [90]. |
| Ionophores & Lipophilic Salts | Provides selectivity for the target ion; lipophilic salt reduces membrane resistance and improves selectivity. | Critical for determining the sensor's analytical performance (e.g., H+ Ionophore I, KTpClPB) [93]. |
| Tetrahydrofuran (THF) | Common solvent for dissolving membrane components before deposition. | Used for preparing ion-selective membrane cocktails [93] [90]. |
Potentiometric sensors are essential tools in analytical chemistry, converting ion activity into measurable electrical potential under zero-current conditions. These sensors are widely used across pharmaceutical development, clinical diagnostics, and environmental monitoring due to their selectivity, sensitivity, and cost-effectiveness [94]. However, potential drift—the gradual change in sensor output over time despite constant analyte concentration—remains a significant challenge that compromises analytical accuracy, particularly when benchmarking against reference methods.
This technical support center addresses the causes and solutions for potentiometric drift within research contexts, providing troubleshooting guidance to help scientists maintain data integrity throughout their experimental workflows.
Troubleshooting Guides
FAQ: What are the primary factors causing drift in my potentiometric measurements?
Drift in potentiometric measurements stems from multiple sources, including sensor material properties, environmental conditions, and measurement practices. The table below summarizes common culprits and their mechanisms.
Table 1: Primary Causes of Potentiometric Drift
| Category | Specific Cause | Effect on Signal |
|---|---|---|
| Sensor Material & Design | Formation of an aqueous layer between solid contact and ion-selective membrane [9] | Unstable potential, long-term drift |
| Redox interference from oxygen in solution [95] | DC offset and signal drift | |
| Suboptimal solid-contact materials (low capacitance/hydrophobicity) [9] | Poor ion-to-electron transduction, increased noise | |
| Reference System | Clogged or contaminated diaphragm [96] | Unstable potential, erratic readings |
| Evaporation or contamination of reference electrolyte [96] | Altered junction potential, baseline drift | |
| Measurement Practice | Variation in ionic strength during titration [97] | Shift in activity coefficients and measured potential |
| Inconsistent temperature [98] | Changes in equilibrium constants and Nernstian slope | |
| Inadequate sensor conditioning or maintenance [96] | Sluggish response, loss of accuracy |
FAQ: How can I determine if the drift originates from my indicator or reference electrode?
A systematic isolation protocol helps pinpoint the source of drift.
Experimental Protocol: Electrode Isolation Test
- Prepare Reference Solutions: Use at least two standard buffer or calibration solutions with well-defined and stable pH/ion activities.
- Baseline with Test Electrode: Immerse your entire sensor setup (indicator and reference electrode) in the first solution. Record the potential until stable.
- Substitute Reference Electrode: Replace the experimental reference electrode with a new, high-quality, and certified reference electrode.
- Repeat Measurement: Place both the original indicator and the new reference electrode into the same first solution. Record the potential.
- Compare Results: If the drift is eliminated or significantly reduced with the new reference electrode, the original reference electrode is likely the fault. If drift persists, the issue lies with the indicator electrode.
- Cross-Check: Repeat steps 2-4 with the second standard solution to confirm findings across different activity levels.
Resolving Specific Drift Issues
FAQ: How can I minimize drift in solid-contact ion-selective electrodes (SC-ISEs)?
The formation of a thin water layer between the ion-selective membrane and the underlying solid contact is a major cause of drift in SC-ISEs [9]. Employing hydrophobic, high-capacitance materials as intermediate layers is the most effective strategy.
Experimental Protocol: Fabricating a Stable MWCNT-Modified Solid-Contact Electrode
This protocol, adapted from recent research, details the creation of a stable SC-ISE using multi-walled carbon nanotubes (MWCNTs) to prevent water layer formation [99].
Solid-Contact Preparation:
- A graphite rod is used as the electrode body.
- The sensing end is coated with a mixture of MWCNTs (0.01 g), PVC (0.10 g), and the plasticizer Dioctyl phthalate (DOP, 0.4 mL), dissolved in Tetrahydrofuran (THF, 6.0 mL) and sonicated to homogeneity [99].
- The electrode is dipped repeatedly into this mixture to build a layer >0.01 cm thick and allowed to dry overnight at room temperature.
Ion-Selective Membrane (ISM) Application:
- The specific ion-selective cocktail is prepared. For a drug like Piroxicam, this might include a metal complex (e.g., Cu(II)-Piroxicam) as an ionophore, PVC, a plasticizer, and lipophilic additives [49].
- This ISM cocktail is then applied over the dried MWCNT layer.
Conditioning and Storage:
FAQ: My potentiometric sensor shows super-Nernstian response and drift in aggressive media. What are my options?
Metal oxide sensors, like Iridium oxide (IrOx), offer robustness in harsh environments (e.g., non-aqueous solvents) but can suffer from drift and a super-Nernstian response (sensitivity > |−59| mV/pH) [95]. A FET-based compensation method can mitigate this.
Experimental Protocol: FET-Based Drift Compensation for Metal Oxide Sensors
This advanced method derives a stable signal by leveraging the properties of a Metal-Oxide-Semiconductor Field-Effect Transistor (MOSFET) [95].
Device Fabrication:
- A MOSFET is fabricated using standard processes.
- A sputtered Iridium oxide (SIROF) film is deposited as the gate contact, which also serves as the pH-sensitive electrode [95].
Measurement and Signal Processing:
- The traditional potentiometric potential (E) of the IrOx gate is measured against a reference electrode.
- Simultaneously, the threshold voltage (V_T) of the MOSFET is measured. This parameter is independent of the troublesome electrode potential drift.
- The compensated, drift-corrected output signal is calculated as (E − V_T). This differential signal has been proven to provide an ideal Nernstian response and is immune to drift caused by varying oxygen concentrations [95].
The following diagram illustrates the logical workflow for diagnosing and addressing the most common sources of potentiometric drift.
Diagram: Potentiometric Drift Troubleshooting
Experimental Protocols for Validation
Standardized Electrode Performance Check
Routine performance checks are critical for ensuring data accuracy and are a key part of benchmarking against reference methods.
Experimental Protocol: Routine Sensor Validation
Standardized Titration:
- Perform a routine, standardized titration (e.g., a weekly titer determination) where all parameters (sample size, titrant concentration, volume) are kept constant [96].
- Monitor and record key performance metrics over time.
Performance Metrics Evaluation:
- For Metal Electrodes (e.g., Ag): Titrate a known standard (e.g., HCl with AgNO₃). Evaluate:
- Titrant volume at the equivalence point (EP).
- Time to reach the EP.
- Potential jump (ΔE) between 90% and 110% of the EP volume [96].
- Slope & Detection Limit: Regularly calibrate the sensor with standard solutions. A deviation from the theoretical Nernstian slope (e.g., 59.16 mV/decade for monovalent ions at 25°C) or a worsening detection limit indicates performance degradation [94].
- Response Time: A steadily increasing response time signals a sluggish sensor, often due to membrane fouling or an aging electrode [96].
- For Metal Electrodes (e.g., Ag): Titrate a known standard (e.g., HCl with AgNO₃). Evaluate:
Table 2: Quantitative Benchmarks for Electrode Performance
| Parameter | Optimal Performance Indicator | Action Threshold |
|---|---|---|
| Potential Drift | < 10 µV/h over 8 days [9] | > 100 µV/h |
| Response Time | Seconds to a few minutes [94] | Significant and consistent increase over baseline |
| Nernstian Slope | ~59.2 mV/dec (monovalent, 25°C) [94] | Deviation > ±2 mV/decade |
| Potential Jump (ΔE) | Consistent, high value (e.g., > 30 mV for Ag titration) [96] | Significant decrease from baseline |
Protocol for Assessing Uncertainty in Stability Constants
Computer-assisted simulations are powerful for deconvoluting experimental uncertainty from data processing biases.
Experimental Protocol: Evaluating Stability Constant Sensitivity
Data Simulation:
- Use software to generate a series of simulated titration curves (e.g., for a model system like Zn²⁺-EDTA) that are free of experimental noise [97].
Data Processing with Introduced Errors:
- Process these ideal data sets using different non-linear least squares fitting software and strategies.
- Intentionally introduce systematic errors into the input data, such as offsets in electrode potential, slight inaccuracies in titrant concentration, or variations in ionic strength [97].
Uncertainty Analysis:
- Analyze the sensitivity of the refined stability constants to the different data handling strategies and introduced errors.
- This process identifies which parameters (e.g., electrode potential measurement) contribute most significantly to the overall uncertainty in the final constants [97].
The Scientist's Toolkit: Key Research Reagent Solutions
The performance of a potentiometric sensor is highly dependent on the materials used in its construction. The table below details key components and their functions.
Table 3: Essential Materials for Potentiometric Sensor Fabrication
| Material Category | Specific Examples | Function & Rationale |
|---|---|---|
| Ion-to-Electron Transducers | Multi-Walled Carbon Nanotubes (MWCNTs) [99], Poly(3,4-ethylenedioxythiophene) (PEDOT) [9], Polypyrrole (PPy) [9] | Hydrophobic, high-capacitance materials that convert ionic signal to electronic current, minimizing water layer formation and drift. |
| Ionophores | Valinomycin (for K⁺) [94], Cu(II)-Piroxicam complex [49], Molecularly Imprinted Polymers (MIPs) [49] | Selective recognition elements that bind the target ion, dictating sensor selectivity. |
| Membrane Matrix & Plasticizers | Polyvinyl Chloride (PVC) [99], Dioctyl phthalate (DOP) [99], 2-Nitrophenyloctyl ether (NPOE) [49] | Forms the bulk of the sensing membrane; plasticizers adjust viscosity and dielectric constant, influencing ionophore mobility and sensor lifetime. |
| Hydrophobic Nanomaterials | Graphene Nanocomposite (GNC) [49], MWCNTs [49] | Added to the membrane or solid contact to enhance hydrophobicity, block water layer, and improve signal stability. |
The following diagram maps the relationships between these key materials in a typical solid-contact ion-selective electrode design.
Diagram: Solid-Contact ISE Material Architecture
The transition from conventional ion-selective electrodes (ISEs) to solid-contact (SC) ISEs represents a significant advancement in sensor technology, particularly for applications requiring miniaturization and wearability [9]. However, this evolution introduces a critical challenge: potential drift—an unpredictable and gradual change in the sensor's signal over time even when exposed to the same analyte under identical conditions [67]. For researchers validating a 3D-printed sodium sensor in the complex matrix of human saliva, understanding and mitigating drift is paramount for ensuring data reliability and analytical accuracy. This case study examines the performance validation of such a sensor within the broader context of drift causes and solutions.
Experimental Protocol: Sensor Fabrication and Validation
Fabrication of the 3D-Printed Sodium Sensor
The following methodology outlines the fabrication of a fully 3D-printed solid-contact potentiometric sensor for sodium ion determination, as detailed in recent literature [5].
Core Materials:
- Stereolithography (SLA) Resin: Used for printing the ion-selective membrane (ISM).
- Carbon-Infused Polylactic Acid (C-PLA): Used for printing the solid-contact transducer via Fused-Deposition Modelling (FDM).
- Sodium Ionophore X: The selective ionophore embedded within the membrane.
- Plasticizers (e.g., DOS) & Poly(vinyl chloride) (PVC): Standard membrane matrix components.
- Lipophilic Additives (e.g., NaTFPB): Ensure optimal membrane electroneutrality and selectivity.
Fabrication Workflow:
- Transducer Printing: The solid-contact transducer is fabricated from C-PLA using FDM. Studies indicate that print angle and thickness are critical parameters that directly influence the transducer's hydrophobicity and, consequently, the long-term potential stability of the sensor [5].
- Membrane Formulation & Printing: A custom resin is formulated containing the sodium ionophore, plasticizer, and polymer matrix. This resin is then printed via SLA onto the surface of the C-PLA transducer to form the ion-selective membrane.
- Conditioning & Calibration: Prior to use, the sensor is conditioned in a solution containing sodium ions. Calibration is performed using standard NaCl solutions across the physiologically relevant range for saliva (typically 1 mM to 100 mM).
Performance Validation in Human Saliva
To validate sensor performance in a real-world context, its analytical figures of merit must be characterized and compared against a reference method.
- Saliva Sample Collection: Unstimulated whole saliva is collected from participants. For infant studies, a catheter may be used to obtain a small volume (< 400 µL) [100]. Consistent sampling methodology is critical due to variations in salivary composition influenced by the gland type and time of day [100].
- Reference Method Comparison: Sensor readings for sodium concentration in saliva samples are statistically compared against results from a commercial clinical analyzer or flame photometry [100].
- Data Acquisition: A wireless, portable potentiometric circuit with a high-impedance voltmeter is used to record the potential between the 3D-printed sensor and a reference electrode (e.g., Ag/AgCl) [100] [53].
The experimental workflow from fabrication to validation is summarized below.
Results & Discussion: Performance Metrics and Drift Analysis
The validated performance of the 3D-printed sodium sensor is summarized in Table 1. The quantitative data demonstrates that the sensor meets key analytical requirements for salivary sodium detection.
Table 1: Performance Summary of the 3D-Printed Na+ Sensor
| Performance Parameter | Reported Value | Target Range for Saliva Analysis |
|---|---|---|
| Sensitivity (Slope) | 57.1 mV/decade [5] | ~59.16 mV/decade (Nernstian) |
| Linear Range | 240 μM – 250 mM [5] | Covers physiological saliva range (1-40 mM) |
| Limit of Detection (LOD) | 0.0024 mM [5] | Sufficient for low [Na+] in saliva |
| Response Time | Fast (seconds to minutes, typ. for SC-ISEs) | Suitable for rapid screening |
| Potential Drift | ~20 μV/hour [5] | Low drift is critical for stable readings |
| Selectivity (log KNa,K) | Highly selective over K+, NH4+, Ca2+, Mg2+ [5] | Essential for complex saliva matrix |
A primary focus of this case study is the analysis of potential drift. Table 2 breaks down the common causes of drift in solid-contact sensors and the specific solutions implemented in the 3D-printed design.
Table 2: Drift Analysis: Causes and Mitigation Strategies in the 3D-Printed Sensor
| Cause of Drift | Impact on Signal | Mitigation Strategy in 3D-Printed Sensor |
|---|---|---|
| Aqueous Layer Formation | Unstable potential due to unintended ion reservoir between transducer and membrane [9] [17] | Use of hydrophobic C-PLA transducer; optimized print parameters to maximize hydrophobicity [5]. |
| Transducer Instability | Poor ion-to-electron transduction leads to signal drift [9] | Carbon-black infused PLA provides a stable, capacitive solid contact [5]. |
| Temperature Fluctuations | Nernstian response is intrinsically temperature-dependent, causing concentration calculation errors [53] | On-board temperature sensor for real-time compensation (though not in all designs) [53]. |
| Membrane Component Leaching | Loss of sensitivity and selectivity over time | Robust 3D-printed membrane matrix with covalently incorporated components can reduce leaching. |
The relationship between sensor stability, its components, and external factors is a complex system that researchers must manage.
The Scientist's Toolkit: Research Reagent Solutions
Table 3: Essential Materials for Solid-Contact Sodium ISE Development
| Material/Reagent | Function | Example in Case Study |
|---|---|---|
| Sodium Ionophore X | Selective molecular recognition of Na+ ions | Critical component in the SLA-printed membrane [100] [5] |
| Lipophilic Additive (e.g., NaTFPB) | Imparts membrane permselectivity and reduces interference | Standard additive in PVC/ISM formulations [100] |
| Carbon-Infused PLA (C-PLA) | Solid-contact transducer; converts ionic to electronic signal | FDM-printed transducer core [5] |
| Plasticizer (e.g., DOS) | Provides mobility for ionophore and ions within the membrane | Part of the plasticized polymer membrane [100] [5] |
| PEDOT:PSS/Graphene Composite | Advanced ion-to-charge transducer; enhances stability & capacitance | Used in high-performance sensors to minimize drift [53] |
| Nafion | Cation-exchange polymer coating; prevents biofouling & anion interference | Top-coat on sensors for in-vivo or complex samples [53] |
Troubleshooting Guides and FAQs
Frequently Asked Questions
Q1: Our 3D-printed sensor shows a sub-Nernstian response. What could be the cause? A sub-Nernstian slope often indicates an issue with the ion-selective membrane. Potential causes include: (1) Incorrect ratio of ionophore to polymer/plasticizer in the SLA resin, (2) Incomplete curing of the membrane during the SLA printing process, or (3) Aging of the membrane components. Re-optimize your printing parameters and verify the freshness and concentration of your membrane cocktail [5].
Q2: The sensor signal is very noisy and unstable. How can we improve signal stability? Signal instability in solid-contact ISEs is frequently linked to the transducer layer. Ensure your C-PLA transducer is printed with sufficient thickness and optimal orientation to maximize its hydrophobicity and capacitive properties [5]. Also, verify that all electrical connections are secure and that your measurement setup uses a properly screened, high-impedance voltmeter.
Q3: We observe significant drift during long-term measurement in saliva. What are the primary solutions? Drift is a multi-factorial problem. First, ensure your solid-contact is as hydrophobic as possible. Second, incorporate a real-time temperature sensor to dynamically compensate for temperature-induced potential changes, which is a major source of error in wearable applications [53]. Finally, using advanced transducer materials like PEDOT:PSS/graphene composites can significantly enhance long-term stability by increasing capacitance and preventing aqueous layer formation [53].
Q4: How can we validate the selectivity of our sensor for sodium in saliva? Selectivity must be experimentally determined against common interfering ions in saliva (K+, Ca2+, Mg2+, NH4+). Prepare separate solutions of these ions and measure the sensor's potential. Calculate the potentiometric selectivity coefficients (log K) using the Separate Solution Method or Fixed Interference Method, as per IUPAC guidelines [52]. A well-designed sensor should show a strong preference for Na+.
Troubleshooting Guide: Common Issues and Actions
| Problem | Possible Causes | Recommended Actions |
|---|---|---|
| High Background Noise | Poor electrical shielding; Loose connections; Low-quality transducer. | Check and secure all connections; Use shielded cables; Ensure transducer is printed homogeneously. |
| Slow Response Time | Thick ion-selective membrane; Poor membrane hydration. | Optimize SLA printing to achieve a thinner, uniform membrane; Pre-condition sensor adequately. |
| Poor Reproducibility | Inconsistent 3D printing; Variations in membrane composition. | Standardize printing parameters (angle, thickness, curing time); Ensure homogeneous mixing of membrane cocktail. |
| Short Sensor Lifespan | Leaching of membrane components; Biofouling in saliva. | Consider a protective Nafion coating [53]; Store sensors in a dark, cool place in a low-concentration NaCl solution. |
This case study demonstrates that 3D-printing is a viable and powerful technique for fabricating solid-contact sodium sensors capable of accurate analysis in human saliva. The successful validation of such a sensor hinges on a systematic approach to understanding and mitigating potentiometric drift. By leveraging optimized materials like C-PLA for hydrophobic transducers, exploring advanced composites like PEDOT:PSS/graphene, and implementing strategies like real-time temperature compensation, researchers can overcome the key challenges of stability and reliability. The integration of 3D printing not only facilitates rapid prototyping and customization but also paves the way for the cost-effective production of robust sensors for point-of-care diagnostics and continuous health monitoring.
Conclusion
Effectively managing potentiometric drift is paramount for unlocking the full potential of this technology in demanding biomedical and clinical research settings. The journey from understanding fundamental causes like the aqueous layer and temperature sensitivity to implementing advanced solutions—such as hydrophobic nanomaterials, 3D-printed sensors, and dynamic temperature compensation—provides a clear path toward unprecedented signal stability. The convergence of material science, innovative fabrication, and rigorous validation protocols enables the development of highly reliable systems for continuous monitoring and precise analysis. Future directions point toward the wider adoption of intelligent, self-calibrating sensors integrated with AI for real-time data correction, paving the way for more personalized medicine, robust therapeutic drug monitoring, and transformative point-of-care diagnostics.
References
- 1. Pressure Sensor Drift: Causes, Consequences, and Prevention [https://www.measurex.com.au/blog/pressure-sensor-drift-causes-consequences-and-prevention/]
- 2. How Does Sensor Drift Affect Data? → Question [https://pollution.sustainability-directory.com/question/how-does-sensor-drift-affect-data/]
- 3. New trends in potentiometric sensors: From design to ... [https://www.sciencedirect.com/science/article/abs/pii/S0039914025001092]
- 4. What Is pH Drift And How To Fix It? A Complete ... [https://atlas-scientific.com/blog/ph-drift/?srsltid=AfmBOopiICLGUmTYj9lSiKMnLdrI2PNGlQXGii4g3UnaSwXKPXWoFqj6]
- 5. Fully 3D-printed solid-contact potentiometric sensor for ... [https://www.sciencedirect.com/science/article/pii/S0956566325007420]
- 6. Potentiometric microsensor for real-time dynamic monitoring ... [https://pubs.rsc.org/en/content/articlehtml/2025/cc/d5cc05784a?page=search]
- 7. Experimental unified pH scale in 1,2-dichloroethane [https://pubs.rsc.org/en/content/articlehtml/2025/cp/d4cp04397a]
- 8. On the use of drift correction for electrochemical ... [https://www.sciencedirect.com/science/article/abs/pii/S0013468623001469]
- 9. Next-Generation Potentiometric Sensors: A Review of ... [https://www.mdpi.com/2079-6374/15/1/51]
- 10. Stability and reproducibility study for the development of ... [https://www.sciencedirect.com/science/article/pii/S2666831925001572]
- 11. Frequently Asked Questions about ion-selective electrode ... [https://www.nico2000.net/datasheets/faq.html]
- 12. Tips for Accurate and Repeatable ISE Lab Measurements [https://www.ysi.com/ysi-blog/water-blogged-blog/2016/03/tips-for-accurate-and-repeatable-ise-lab-measurements?srsltid=AfmBOorpnxdOITfEKMaZzTQtngE2VXJkfYI6eJAF7ApAf6-Ys_C5fMH4]
- 13. Guide to Ion Selective | Troubleshooting | Support [https://www.turtletoughsensors.com/support/troubleshooting/guide-to-ise]
- 14. General tips for using Ion Selective Electrodes (ISE). [https://www.vernier.com/til/665?srsltid=AfmBOoplhS1jbAjYJxBW96MQ2X_J1TOmtUdCrA2stk-hOMtJcFdcOdPP]
- 15. Innovative sensors with selectivity enhancement by ... [https://pubs.rsc.org/en/content/articlehtml/2025/ra/d5ra02850g]
- 16. Solid-contact ion-selective electrode for the determination ... [https://pmc.ncbi.nlm.nih.gov/articles/PMC12180174/]
- 17. Graphene-cobalt hexacyanoferrate modified sensor doped ... [https://www.nature.com/articles/s41598-025-16259-z]
- 18. A New Way to Use Hydrophobic Deep Eutectic Solvents [https://pmc.ncbi.nlm.nih.gov/articles/PMC12597215/]
- 19. Facile fabrication of anti-fouling polymeric membrane ... [https://pubs.rsc.org/no/content/articlehtml/2025/an/d4an01583e]
- 20. The Guide to Fixing pH Drift [https://www.phionics.com/2020/11/05/the-guide-to-ph-drift/]
- 21. What Is pH Drift And How To Fix It? A Complete ... [https://atlas-scientific.com/blog/ph-drift/?srsltid=AfmBOop_p3ycorCipxnnA-aYYylES7LpEmqlVYak7yYLsUB550XJCBKM]
- 22. 16.4: The Nernst Equation [https://chem.libretexts.org/Bookshelves/General_Chemistry/Chem1_(Lower)/16%3A_Electrochemistry/16.04%3A_The_Nernst_Equation]
- 23. Nernst Equation - Chemistry LibreTexts [https://chem.libretexts.org/Bookshelves/Analytical_Chemistry/Supplemental_Modules_(Analytical_Chemistry)/Electrochemistry/Nernst_Equation]
- 24. Modulated Response of Ion-Selective Electrodes During ... [https://pmc.ncbi.nlm.nih.gov/articles/PMC2827483/]
- 25. Nernst equation [https://en.wikipedia.org/wiki/Nernst_equation]
- 26. DS1845/DS1855 Temperature Coefficient Analysis [https://www.analog.com/en/resources/technical-articles/ds1845ds1855-temperature-coefficient-analysis.html]
- 27. Mastering Selectivity in Analytical Chemistry [https://www.numberanalytics.com/blog/mastering-selectivity-in-analytical-chemistry]
- 28. effects demystified: Strategies for resolving Matrix in... challenges [https://pubmed.ncbi.nlm.nih.gov/37897324/]
- 29. of Effect present in the internal solution or in the... interferents [https://pubmed.ncbi.nlm.nih.gov/16557407/]
- 30. Backside Calibration Potentiometry: Ion Activity ... [https://pmc.ncbi.nlm.nih.gov/articles/PMC2883721/]
- 31. Designing new sulfate ionophores for potentiometric ... [https://www.sciencedirect.com/science/article/abs/pii/S0925400524013935]
- 32. Monolithic vs. particle-based solid-phase extraction for selective ... [https://pubs.rsc.org/en/content/articlelanding/2025/va/d5va00057b]
- 33. Dynamic reaction cell ICP-MS for determination of total As, Cr, Se and... [https://pubmed.ncbi.nlm.nih.gov/21645653/]
- 34. Characterization of a simple potentiometric graphite based ... [https://www.nature.com/articles/s41598-025-25089-y]
- 35. Recent Developments and Challenges in Solid-Contact Ion ... [https://www.mdpi.com/1424-8220/24/13/4289]
- 36. A highly stable and flexible ion-selective patch sensor for real ... [https://mnsl-journal.springeropen.com/articles/10.1186/s40486-025-00235-3]
- 37. Ion-Selective Electrodes Issues and What to Check [https://www.coleparmer.com/blog/ion-selective-electrodes/]
- 38. In situ real-time monitoring of ammonium, potassium, chloride ... [https://pubs.rsc.org/en/content/articlehtml/2025/va/d5va00021a]
- 39. Innovative polymer-based, miniaturized solid-state ... [https://www.sciencedirect.com/science/article/abs/pii/S0378775325007815]
- 40. Common Troubleshooting Tips [https://chem.libretexts.org/Bookshelves/Analytical_Chemistry/Supplemental_Modules_(Analytical_Chemistry)/Analytical_Sciences_Digital_Library/Courseware/Analytical_Electrochemistry%3A_Potentiometry/07_Common_Troubleshooting_Tips]
- 41. A Review of the Carbon-Based Solid Transducing Layer for ... [https://www.mdpi.com/1420-3049/28/14/5503]
- 42. Ion-Selective Electrodes with Solid Contact Based on ... [https://pmc.ncbi.nlm.nih.gov/articles/PMC10346301/]
- 43. Carbon Nanomaterials Embedded in Conductive Polymers [https://pmc.ncbi.nlm.nih.gov/articles/PMC7957790/]
- 44. Advances in Conductive Polymer-Based Flexible ... [https://www.mdpi.com/2504-477X/9/1/42]
- 45. Avoiding the most common mistakes in pH measurement [https://www.metrohm.com/en/discover/blog/20-21/avoiding-the-most-common-mistakes-in-ph-measurement.html]
- 46. A novel miniaturized potentiometric electrode based on ... [https://link.springer.com/article/10.1007/s00604-024-06802-6]
- 47. A Highly Stable Electrochemical Sensor Based on a Metal ... [https://www.mdpi.com/2079-6374/14/12/617]
- 48. Novel Carbon Nanotube-Based Potentiometric Sensor for ... [https://www.sciencedirect.com/science/article/pii/S0925400525013243]
- 49. Molecular imprinted polymer-based metal complex ... [https://pubs.rsc.org/en/content/articlehtml/2025/ra/d5ra03851k]
- 50. Fabrication of screen-printed electrodes with long-term ... [https://www.sciencedirect.com/science/article/pii/S266605392400050X]
- 51. The Current Shortcomings and Future Possibilities of 3D ... [https://pmc.ncbi.nlm.nih.gov/articles/PMC11391405/]
- 52. 3D Printing in the Design of Potentiometric Sensors [https://www.mdpi.com/1424-8220/25/16/4986]
- 53. Wireless Flexible Potentiometric Microsensors for ... [https://pmc.ncbi.nlm.nih.gov/articles/PMC12203469/]
- 54. In Vivo Transdermal Multi-Ion Monitoring with a Potentiometric ... [https://pmc.ncbi.nlm.nih.gov/articles/PMC9887649/]
- 55. an Innovative Tool for Monitoring Hydrolysis of Chemo/Bio ... [https://www.ssrn.com/abstract=3861134]
- 56. Advances in Therapeutic Monitoring of Lithium in the ... [https://www.mdpi.com/1424-8220/22/3/736]
- 57. Wireless wearable potentiometric sensor for simultaneous ... [https://www.nature.com/articles/s41598-024-62236-3]
- 58. What are the proper procedures for post-treatment ... [https://www.linkedin.com/pulse/what-proper-procedures-post-treatment-storage-electrode-gkise]
- 59. pH Electrode Care and Maintenance Procedures [https://www.horiba.com/int/water-quality/support/technical-tips/electrodes/ph-electrode-care-and-maintenance-procedures/]
- 60. Potentiometry - an overview [https://www.sciencedirect.com/topics/medicine-and-dentistry/potentiometry]
- 61. Electrode Polishing Guide [https://pineresearch.com/support-article/electrode-polishing-guide/]
- 62. Investigation of temperature drift compensation technology ... [https://www.spiedigitallibrary.org/conference-proceedings-of-spie/13513/135130C/Investigation-of-temperature-drift-compensation-technology-for-actuator-shaft-displacement/10.1117/12.3045357.full]
- 63. Real-time neural network-based thermal stress ... [https://www.sciencedirect.com/science/article/abs/pii/S0141933125000511]
- 64. Cross-compensation of FET sensor drift and matrix effects ... [https://www.sciencedirect.com/science/article/pii/S0925400521016919]
- 65. BAPTA-based potentiometric polymer sensor - RSC Publishing [https://pubs.rsc.org/en/content/articlehtml/2025/tb/d4tb02586e]
- 66. A novel dynamic compensation method for a contact probe ... [https://www.sciencedirect.com/science/article/abs/pii/S0263224121010629]
- 67. A method of gas sensor drift compensation based on ... [https://www.nature.com/articles/s41598-023-39246-8]
- 68. An eco-friendly potentiometric sensor for in-line monitoring ... [https://www.sciencedirect.com/science/article/abs/pii/S157266572500445X]
- 69. In Situ Drift Monitoring and Calibration of Field-Deployed ... [https://pubmed.ncbi.nlm.nih.gov/37350462/]
- 70. Potentiometric Sensor System with Self-Calibration for ... [https://www.mdpi.com/2227-9040/11/1/48]
- 71. Calibration update strategies for an array of potentiometric ... [https://www.sciencedirect.com/science/article/abs/pii/S0925400516309261]
- 72. Questions and Answers on Current Good Manufacturing ... [https://www.fda.gov/drugs/guidances-drugs/questions-and-answers-current-good-manufacturing-practice-requirements-laboratory-controls]
- 73. The Impact of Measurement Error on Control Charts [https://www.spcforexcel.com/knowledge/measurement-systems-analysis-gage-rr/measurement-error-impact-on-control-charts/]
- 74. A Quantitative Comparison of Calibration Methods for RGB ... [https://pmc.ncbi.nlm.nih.gov/articles/PMC5336030/]
- 75. Potentiometer Wiring Guide: Diagrams, Selection & ... [https://www.nextpcb.com/blog/potentiometer-wiring]
- 76. A novel molecular imprinted polymer-based potentiometric ... [https://www.sciencedirect.com/science/article/abs/pii/S0026265X25014134]
- 77. Innovative sensors with selectivity enhancement by ... [https://pmc.ncbi.nlm.nih.gov/articles/PMC12132094/]
- 78. Molecular imprinted polymer-based potentiometric approach ... [https://bmcchem.biomedcentral.com/articles/10.1186/s13065-025-01392-7]
- 79. Karl Fisher Titration and drift [https://www.scientificgear.com/blog/bid/66071/karl-fisher-titration-and-drift]
- 80. 3 easy tips to avoid measurement drift in analytical balances [https://bitesizebio.com/33245/drift-measurements-analytical-balances/]
- 81. Detection limit [https://en.wikipedia.org/wiki/Detection_limit]
- 82. Limit of Blank, Limit of Detection and Limit of Quantitation [https://pmc.ncbi.nlm.nih.gov/articles/PMC2556583/]
- 83. A method for the determination of potentiometric selectivity ... [https://www.sciencedirect.com/science/article/abs/pii/S0039914099001940]
- 84. 11.2: Potentiometric Methods [https://chem.libretexts.org/Bookshelves/Analytical_Chemistry/Analytical_Chemistry_2.1_(Harvey)/11%3A_Electrochemical_Methods/11.02%3A_Potentiometric_Methods]
- 85. Electrical Testing of Electrodes and Shafts [https://pineresearch.com/support-article/electrical-testing-of-electrodes-and-shafts/]
- 86. A guideline for standardized performance tests for electrodes ... [http://protocolsmethods.springernature.com/posts/a-guideline-for-standardized-performance-tests-for-electrodes-intended-for-neural-interfaces-and-bioelectronics]
- 87. A harmonized protocol to assess the single-cell ... [https://www.frontiersin.org/journals/energy-research/articles/10.3389/fenrg.2025.1549219/full]
- 88. Challenges and opportunities for high-quality battery ... [https://www.nature.com/articles/s41467-025-55861-7]
- 89. New Ideas For Process Testing Of Dry Electrodes [https://iestbattery.com/case/new-idea-for-process-testing-of-dry-electrode/]
- 90. A rational study of transduction mechanisms of different ... [https://pmc.ncbi.nlm.nih.gov/articles/PMC10914792/]
- 91. Critical assessment of different ion-to-electron transducers ... [https://www.sciencedirect.com/science/article/pii/S0026265X25015498]
- 92. Highly sensing and transducing materials for ... [https://www.sciencedirect.com/science/article/abs/pii/S0079642521001092]
- 93. Comparison of Different Commercial Conducting Materials ... [https://www.mdpi.com/1424-8220/20/5/1348]
- 94. 3D Printing in the Design of Potentiometric Sensors [https://pmc.ncbi.nlm.nih.gov/articles/PMC12390291/]
- 95. A method of reducing oxygen induced drift in iridium oxide ... [https://www.sciencedirect.com/science/article/abs/pii/S0925400598002986]
- 96. Best practice for electrodes in titration [https://www.metrohm.com/en/discover/blog/20-21/best-practice-for-electrodes-in-titration.html]
- 97. Uncertainty and biases on the determination of stability ... [https://www.sciencedirect.com/science/article/pii/S0039914025010033?via=ihub]
- 98. Basics of pH Theory | PT Yokogawa Indonesia [https://www.yokogawa.com/id/library/resources/white-papers/basics-of-ph-theory/]
- 99. Bioanalytically validated potentiometric method for deter... [https://www.degruyterbrill.com/document/doi/10.1515/revac-2025-0085/html?lang=en&srsltid=AfmBOoq7fSRNpBPiVSBgQdmivRpnUeL566SSTtBMirSwCXOIB6fSdk3T]
- 100. Development of Flexible Ion-Selective Electrodes for Saliva ... [https://pmc.ncbi.nlm.nih.gov/articles/PMC7956447/]