Background-Inclusive vs. Background-Subtracted Voltammetry: Choosing the Right Method for Electrochemical Analysis in Biomedical Research
This article provides a comprehensive guide to two fundamental approaches in electrochemical analysis for biomedical applications: background-inclusive and background-subtracted voltammetry.
Background-Inclusive vs. Background-Subtracted Voltammetry: Choosing the Right Method for Electrochemical Analysis in Biomedical Research
Abstract
This article provides a comprehensive guide to two fundamental approaches in electrochemical analysis for biomedical applications: background-inclusive and background-subtracted voltammetry. Aimed at researchers, scientists, and drug development professionals, we explore the foundational principles of each method, detail their specific protocols and applications in quantifying analytes like neurotransmitters and pharmaceuticals, and address common troubleshooting and optimization challenges. We then present a critical, data-driven comparison of their validation metrics, including sensitivity, selectivity, and reproducibility. The conclusion synthesizes key decision-making criteria for method selection and discusses future implications for high-throughput drug screening and in vivo biosensing.
Voltammetry Fundamentals: Demystifying Background-Inclusive and Background-Subtracted Signal Analysis
Within the broader thesis on electrochemical methodologies, this article defines and contrasts two fundamental approaches to voltammetric analysis: background-inclusive and background-subtracted voltammetry. Voltammetry is a potent analytical technique for measuring current as a function of applied potential, crucial for quantifying electroactive species in fields ranging from neuroscience to pharmaceutical development. The distinction between these two data processing paradigms is central to accurate interpretation, influencing detection limits, selectivity, and the validity of quantitative results.
Background-Inclusive Voltammetry refers to the direct measurement and reporting of the total Faradaic and non-Faradaic current. The recorded signal includes both the current from the redox event of the target analyte and the background charging current from the electrochemical double layer, as well as any capacitive or pseudocapacitive contributions from the electrode or matrix. This approach is often used in preliminary scans or when the background itself is of interest or is stable and predictable.
Background-Subtracted Voltammetry is a method where a baseline or "background" voltammogram, acquired in the absence of the target analyte or at a known baseline state, is digitally subtracted from the sample voltammogram. This isolates the Faradaic component attributed specifically to the analyte's redox process, enhancing sensitivity and resolution, particularly for low-concentration targets in complex matrices.
Quantitative Data Comparison
Table 1: Key Characteristics of Voltammetry Methods
| Feature | Background-Inclusive Voltammetry | Background-Subtracted Voltammetry |
|---|---|---|
| Signal Output | Total current (Faradaic + Non-Faradaic) | Primarily Faradaic current |
| Primary Use Case | System characterization, stable backgrounds, qualitative analysis | Trace analysis, complex biological/media samples, quantitative analysis |
| Typical LOD (Dopamine Example) | ~50-100 nM | ~1-10 nM |
| Susceptibility to Matrix Effects | High | Reduced (but dependent on background quality) |
| Data Complexity | Lower | Higher (requires background acquisition & processing) |
| Common Techniques | Initial CV scans, some forms of pulse voltammetry | Differential Pulse Voltammetry (DPV), Square Wave Voltammetry (SWV), Fast-Scan Cyclic Voltammetry (FSCV) with background subtraction |
Table 2: Performance Metrics in Neurotransmitter Detection (Model System)
| Parameter | Background-Inclusive (FSCV) | Background-Subtracted (FSCV) | Background-Subtracted (DPV) |
|---|---|---|---|
| Sensitivity (nA/µM) | 2.5 ± 0.3 | 4.8 ± 0.5 | 15.2 ± 1.8 |
| Limit of Detection (LOD) | 85 nM | 6 nM | 2 nM |
| Temporal Resolution | Excellent (10 Hz) | Excellent (10 Hz) | Poor (0.1-1 Hz) |
| Selectivity in Mixtures | Low | Moderate | High |
| Impact of Protein Fouling | Severe | Moderate | Mitigated by surface modification |
Detailed Experimental Protocols
Protocol 1: Background-Subtracted Fast-Scan Cyclic Voltammetry (FSCV) for In Vivo Neurotransmitter Monitoring
Application: Real-time detection of dopamine release in brain tissue.
- Electrode Preparation: Fabricate a carbon-fiber microelectrode (diameter 5-7 µm). Apply a pre-treatment potential waveform (e.g., +1.5 V vs. Ag/AgCl for 10 s, then -1.0 V for 5 s in PBS) to activate the surface.
- Background Acquisition: Place the electrode in artificial cerebrospinal fluid (aCSF) or the target biological matrix without the analyte. Apply the FSCV triangle waveform (e.g., -0.4 V to +1.3 V and back, at 400 V/s, 10 Hz). Record the stable background current for 5-10 seconds. This is your reference background (
i_bg). - Sample Measurement: Introduce the electrode into the sample (e.g., brain region). Apply the identical FSCV waveform. Record the total current (
i_total). - Signal Processing: For each voltammetric cycle, digitally subtract the averaged
i_bgfromi_totalto yield the background-subtracted Faradaic current (i_faradaic = i_total - i_bg). - Data Analysis: Use principal component analysis (PCA) or calibration with known analyte additions to convert
i_faradaicinto concentration, based on oxidation peak potential and current.
Protocol 2: Background-Subtracted Differential Pulse Voltammetry (DPV) for Drug Compound Analysis
Application: Quantifying redox-active drug molecules in pharmaceutical formulations.
- Baseline Buffer Scan: Deoxygenate the supporting electrolyte (e.g., 0.1 M phosphate buffer, pH 7.4) with N₂ for 10 minutes. Using a glassy carbon working electrode, run a DPV scan with optimized parameters (Pulse amplitude: 50 mV, Pulse width: 50 ms, Scan rate: 10 mV/s) over the relevant potential window. Save this as the background scan.
- Standard Addition Calibration: Spike the buffer with known concentrations of the drug analyte (e.g., 1, 5, 10, 20 µM). After each addition, run an identical DPV scan.
- Background Subtraction: For each drug-containing scan, subtract the initial buffer background scan (Step 1). This yields a clean voltammogram showing only the drug's oxidation/reduction peak.
- Quantification: Plot the peak current from the subtracted voltammograms against drug concentration to create a calibration curve. Use linear regression to determine the concentration of unknown samples.
Visualizations
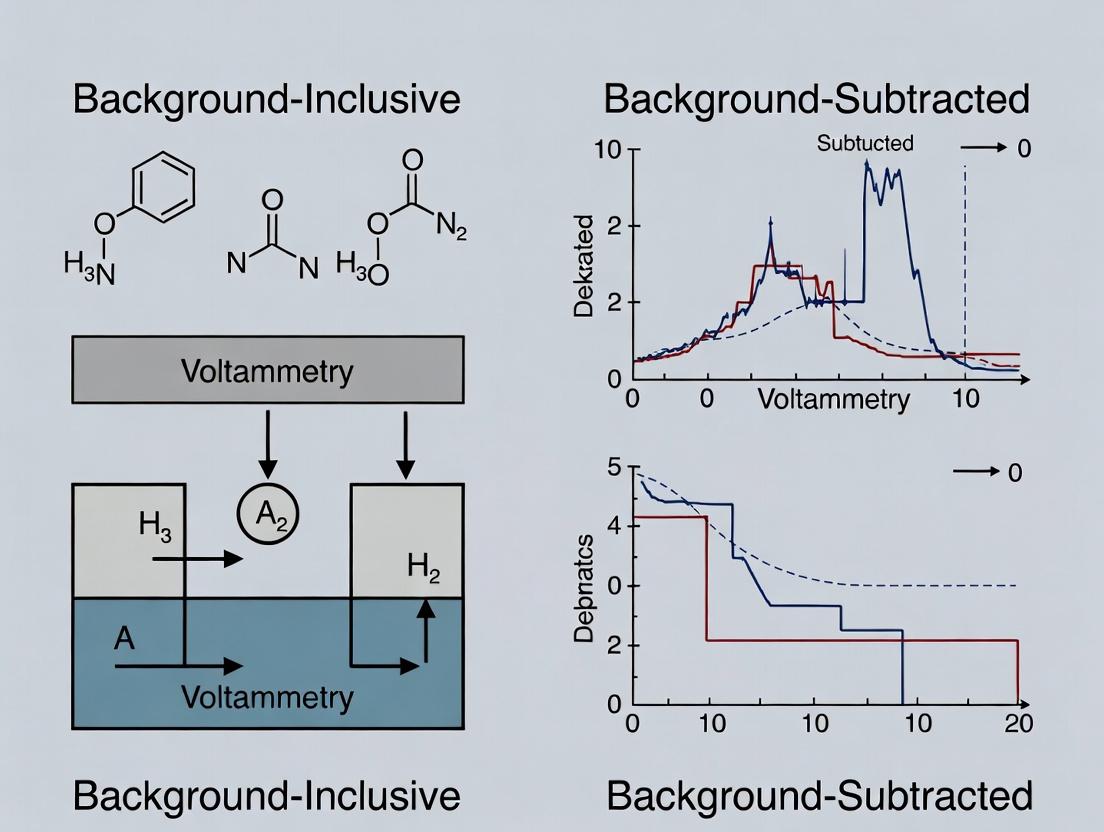
Title: Workflow Comparison of Two Voltammetric Methods
Title: FSCV Background Subtraction Signal Processing
The Scientist's Toolkit: Research Reagent Solutions
Table 3: Essential Materials for Background-Subtracted Voltammetry
| Item | Function & Importance |
|---|---|
| Carbon-Fiber Microelectrode (CFM) | The working electrode for FSCV. Small size minimizes tissue damage, provides fast electron transfer kinetics, and yields low, stable background charging currents essential for subtraction. |
| Ag/AgCl Reference Electrode | Provides a stable, reproducible reference potential against which the working electrode potential is controlled. Critical for consistent peak potentials. |
| Artificial Cerebrospinal Fluid (aCSF) | Ionic background electrolyte for neurochemical experiments. Mimics the extracellular milieu, providing a consistent and physiologically relevant background for acquisition and subtraction. |
| Phosphate Buffer Saline (PBS, 0.1 M) | Standard supporting electrolyte for in vitro drug analysis. Provides ionic strength, controls pH (critical for proton-coupled electron transfers), and establishes a clean baseline. |
| Anti-fouling Membranes (e.g., Nafion) | Coated on electrodes to repel anions (e.g., ascorbate) and large biomolecules (proteins). Reduces contamination and drift of the background current, improving subtraction fidelity. |
| Potentiostat with High Current Sensitivity | Instrument capable of applying precise potential waveforms and measuring nanoampere to picoampere currents. High bandwidth is required for fast techniques like FSCV. |
| Data Acquisition & Processing Software | For controlling the potentiostat, recording high-speed data streams, and performing critical digital signal processing operations like background subtraction and smoothing. |
This application note details the critical distinction between Faradaic and charging currents in electrochemical cells, a fundamental concept for the ongoing research thesis comparing background-inclusive and background-subtracted voltammetry methods. In background-inclusive methods (e.g., direct amperometric detection), the total measured current is analyzed, treating the charging current as an integrated signal component. In contrast, background-subtracted methods (e.g., pulsed voltammetrics) aim to isolate the Faradaic current by minimizing or computationally removing the charging current. Understanding the source, magnitude, and behavior of each current component is essential for selecting and optimizing electrochemical sensing protocols in drug development, particularly for in-vivo neurotransmitter monitoring or pharmaceutical compound detection.
Core Signal Components: Definitions and Origins
Faradaic Current ($i_f$): The current arising from the reduction or oxidation (redox) of electroactive species at the electrode surface. It is a direct measure of the analyte concentration (via Faraday's law) and is the primary signal of interest in quantitative assays.
Charging Current ($i_c$): Also known as capacitive or non-Faradaic current. This current flows to charge or discharge the electrical double layer at the electrode-electrolyte interface, acting as a capacitor. It is a background signal that depends on scan rate, electrode area, and electrolyte composition but not directly on analyte concentration.
Quantitative Comparison Table Table 1: Characteristics of Faradaic and Charging Currents in Voltammetry
| Parameter | Faradaic Current ($i_f$) | Charging Current ($i_c$) |
|---|---|---|
| Origin | Electron transfer across electrode interface (redox reaction). | Charging of the electrode-electrolyte double-layer capacitor. |
| Dependence on Potential Scan Rate ($\nu$) | Proportional to $\nu^{1/2}$ (for diffusion-controlled). | Directly proportional to $\nu$. |
| Dependence on Electrode Area ($A$) | Proportional to $A$. | Proportional to $A$. |
| Dependence on Analyte Concentration | Linear proportional relationship. | No direct dependence. |
| Role in Thesis Methods | Target signal in both method types. | Treated as part of signal (inclusive) or as noise to subtract. |
| Typical Decay Constant | Decays as $t^{-1/2}$ (Cottrell equation). | Decays exponentially with time constant $\tau = RuCd$. |
| Primary Influence in Drug Development | Quantification of drug molecules or biomarkers. | Determines detection limit and usable potential window. |
Experimental Protocols for Signal Component Analysis
Protocol 3.1: Differentiating Currents via Cyclic Voltammetry at Multiple Scan Rates
Objective: To empirically distinguish $if$ and $ic$ contributions by exploiting their different dependencies on potential scan rate ($\nu$). Materials: See "Scientist's Toolkit" (Section 6). Procedure:
- Prepare a standard solution of 1 mM potassium ferricyanide in 1 M KCl supporting electrolyte.
- Using a clean glassy carbon working electrode, record cyclic voltammograms (CVs) from +0.6 V to -0.1 V vs. Ag/AgCl at scan rates: 10, 50, 100, 500 mV/s.
- Repeat CV in 1 M KCl only (no ferricyanide) at the same scan rates.
- Data Analysis:
- For the solution with ferricyanide, measure the peak cathodic current ($i_{pc}$) at ~+0.2 V.
- For the KCl-only background scan, measure the absolute current ($i{total}$) at +0.2 V (where no Faradaic process occurs). This is $ic$.
- Plot $i{pc}$ vs. $\nu^{1/2}$ and $ic$ (from background) vs. $\nu$. Observe linearity in respective plots, confirming origin of currents.
Protocol 3.2: Chronoamperometry for Charging Current Decay Observation
Objective: To visualize the rapid decay of $ic$ relative to the sustained decay of $if$. Procedure:
- In a solution of 1 mM ruthenium hexamine in 0.1 M KNO3, hold the working electrode at +0.8 V vs. Ag/AgCl for 10 s to establish a baseline.
- Apply a potential step to +0.2 V vs. Ag/AgCl for 5 s.
- Record the high-speed current transient immediately after the step.
- Data Analysis: The initial instantaneous current spike is $ic$. The decaying current that follows the $t^{-1/2}$ relationship is the Faradaic component ($if$). Fitting the latter portion of the decay to the Cottrell equation yields analyte concentration.
Application in Voltammetry Methods for Drug Research
Background-Subtracted Methods (e.g., Fast-Scan Cyclic Voltammetry - FSCV):
- Protocol: Apply a high scan rate (≥ 400 V/s). The charging current is enormous but highly reproducible. A background CV (analyte-free) is subtracted from each sample CV to reveal the Faradaic signal of neurotransmitters like dopamine.
- Advantage: Excellent temporal resolution and sensitivity for in-vivo neuroscience applications.
Background-Inclusive Methods (e.g., DC Amperometry):
- Protocol: Hold electrode at a constant oxidizing potential. The total current (including a stable charging current baseline) is monitored for sudden increases due to vesicular release events (e.g., insulin or catecholamine secretion from cells).
- Advantage: Simple, direct measurement of real-time kinetics without complex waveform processing.
Diagrammatic Representations
Diagram Title: Signal Components and Thesis Voltammetry Method Pathways
Diagram Title: Chronoamperometry Current Components Timeline
The Scientist's Toolkit: Research Reagent Solutions & Essential Materials
Table 2: Essential Materials for Electrochemical Signal Component Experiments
| Item Name | Function / Relevance |
|---|---|
| Glassy Carbon Working Electrode | Inert, polished electrode providing a reproducible surface for studying both $if$ and $ic$. |
| Ag/AgCl (3M KCl) Reference Electrode | Provides a stable, well-defined reference potential for accurate potential control. |
| Platinum Wire Counter Electrode | Completes the current loop in the three-electrode cell with minimal interference. |
| Potassium Ferricyanide (K3[Fe(CN)6]) | Reversible, one-electron transfer redox standard for quantifying Faradaic response. |
| High-Purity Potassium Chloride (KCl) | Provides inert supporting electrolyte at high concentration to minimize solution resistance and fix ionic strength. |
| Potassium Nitrate (KNO3) | Alternative supporting electrolyte for experiments where chloride interference is a concern. |
| Faraday Cage | Shields the electrochemical cell from external electromagnetic noise for low-current measurements. |
| Potentiostat with High-Speed Data Acquisition | Instrument capable of applying precise potentials and measuring current transients with microsecond resolution to resolve $i_c$ decay. |
| Nafion Perfluorinated Membrane | Cation-exchange polymer coating for electrodes used in vivo to enhance selectivity (e.g., for dopamine over anions). |
Historical Context and Evolution of Background Handling in Voltammetry
Application Notes
Within the broader thesis research on background-inclusive versus background-subtracted voltammetry, understanding the historical evolution of background handling is critical. Early voltammetry, such as polarography, relied on manual background estimation, where a baseline was drawn by eye preceding the Faradaic region. The advent of digital potentiostats and microcomputers in the 1970s-80s enabled the practice of background subtraction, where a voltammogram of the blank electrolyte is digitally subtracted from the sample voltammogram. This became the de facto standard, aiming to isolate the pure Faradaic current. However, this thesis argues that subtraction can discard critical contextual information about the electrochemical interface and can introduce artifacts if the background is not perfectly reproducible.
Modern advancements, like fast-scan cyclic voltammetry (FSCV) in neurochemistry and sophisticated algorithms for capacitive current correction, have shifted the paradigm. The "background-inclusive" philosophy treats the total current as the primary analytical signal, using multivariate calibration (e.g., Principal Component Analysis) or machine learning models trained on both Faradaic and capacitive features. This is particularly valuable in complex matrices like biological fluids where the background is inherently variable and informative.
Quantitative Evolution of Key Parameters
Table 1: Historical Evolution of Key Voltammetric Parameters Influencing Background
| Era (Decade) | Typical Scan Rate (V/s) | Dominant Electrode Material | Background Handling Paradigm | Primary Correction Method |
|---|---|---|---|---|
| 1950-1970 | 0.01 - 0.1 | Dropping Mercury Electrode (DME) | Visual/Graphical Subtraction | Manual baseline drawing |
| 1980-2000 | 0.1 - 1.0 | Glassy Carbon, Pt Disk | Digital Point-by-Point Subtraction | Blank subtraction, analog current integration |
| 2000-2020 | 10 - 1000 | Carbon Fiber Microelectrode | In-situ & Model-Based Subtraction | Background fitting (e.g., to a polynomial or exponential), FSCV background subtraction |
| 2020-Present | 1 - 10,000+ | Nanostructured, Biosensors | Background-Inclusive Analysis | Multivariate Calibration, Machine Learning, Digital Simulation |
Table 2: Comparison of Background-Subtracted vs. Background-Inclusive Methods
| Aspect | Background-Subtracted Method | Background-Inclusive Method |
|---|---|---|
| Core Philosophy | Background is noise to be removed. | Background is part of the total analytical signal. |
| Primary Output | "Pure" Faradaic current. | Multidimensional current profile (includes capacitive). |
| Data Processing | Simple subtraction; can amplify high-frequency noise. | Complex multivariate analysis; preserves system state info. |
| Matrix Complexity | Struggles with highly variable or irreproducible backgrounds. | Robust to background changes; can use them for diagnostics. |
| Calibration Model | Univariate (peak current vs. concentration). | Multivariate (full waveform vs. concentration/property). |
| Key Risk | Over-/under-subtraction leads to concentration errors. | Model requires extensive, representative training data. |
Experimental Protocols
Protocol 1: Traditional Background Subtraction in Cyclic Voltammetry
This protocol outlines the standard method for obtaining background-subtracted CVs, a cornerstone technique in the historical development of electroanalysis.
Objective: To obtain the Faradaic contribution of an analyte by subtracting the capacitive and other non-Faradaic currents.
Materials & Reagents:
- Potentiostat/Galvanostat: Computer-controlled device for applying potential and measuring current.
- Three-Electrode Cell:
- Working Electrode: 3 mm diameter Glassy Carbon Electrode (GCE).
- Counter Electrode: Platinum wire coil.
- Reference Electrode: Ag/AgCl (3M KCl) electrode.
- Electrolyte Solution: 0.1 M Phosphate Buffer Saline (PBS), pH 7.4.
- Analyte Solution: 1 mM Dopamine hydrochloride in 0.1 M PBS.
- Polishing Supplies: 0.05 μm alumina slurry and microcloth pads.
Procedure:
- Electrode Preparation: Polish the GCE on a microcloth pad with 0.05 μm alumina slurry for 60 seconds. Rinse thoroughly with deionized water and dry.
- Background Scan: Place the cleaned GCE, Pt counter, and Ag/AgCl reference into a cell containing only 10 mL of 0.1 M PBS (blank). Deoxygenate with N₂ gas for 10 minutes. Record a cyclic voltammogram from -0.2 V to +0.6 V vs. Ag/AgCl at a scan rate of 0.1 V/s. Save this as
background.vol. - Sample Scan: To the same cell, add a calculated volume of 10 mM dopamine stock to achieve a final concentration of 50 μM. Stir under N₂ for 1 minute. Record a cyclic voltammogram under identical instrumental parameters. Save as
sample.vol. - Data Processing: Using the potentiostat's software or data analysis software (e.g., Python, Matlab), perform a point-by-point subtraction:
Faradaic_current = sample_current - background_current. - Analysis: Plot both the raw sample voltammogram and the background-subtracted voltammogram. Identify the oxidation and reduction peak potentials and currents.
Protocol 2: Background-Inclusive Calibration using Multivariate Analysis
This modern protocol aligns with the thesis research into methods that utilize the total electrochemical signal.
Objective: To build a partial least squares (PLS) regression model that correlates the entire voltammetric waveform (background + Faradaic) to analyte concentration.
Materials & Reagents:
- Potentiostat & Cell: As in Protocol 1.
- Electrolyte: Synthetic Interstitial Fluid (SIF) to simulate a complex biological matrix.
- Analyte: Paracetamol (acetaminophen).
- Software: Multivariate analysis package (e.g., PLS_Toolbox, scikit-learn).
Procedure:
- Training Set Preparation: Prepare a series of 20 solutions in SIF with paracetamol concentrations ranging from 1 μM to 200 μM in a randomized order.
- Data Acquisition: For each solution, perform a single cyclic voltammogram from +0.2 V to +0.8 V vs. Ag/AgCl at 0.5 V/s without any background subtraction. Ensure consistent electrode conditioning between runs (e.g., 30 s hold at initial potential).
- Data Matrix Assembly: For all
ntraining solutions, extract the current (i) at each of theppotential points in the voltammogram. Create ann x pmatrixX, where each row is a full, unsubtracted voltammogram. The corresponding concentration vector isy(sizen x 1). - Model Building: Mean-center the
Xandydata. Apply PLS regression, using leave-one-out cross-validation to determine the optimal number of latent variables (LVs) that minimizes the prediction error. - Validation: Run a separate set of 5-10 validation samples not used in training. Input their full voltammograms into the PLS model to predict concentration. Compare predicted vs. known concentrations to assess RMSEP (Root Mean Square Error of Prediction).
- Interpretation: Examine the PLS regression coefficients (loadings) to see which regions of the voltammogram (both capacitive and Faradaic) were most weighted for prediction.
The Scientist's Toolkit
Table 3: Key Research Reagent Solutions for Background Handling Studies
| Item | Function in Background Studies |
|---|---|
| High-Purity Supporting Electrolyte (e.g., TBAPF6 in acetonitrile) | Minimizes Faradaic contributions from electrolyte impurities, providing a clean, predictable background. |
| Outer-Sphere Redox Probe (e.g., Ferrocene) | Provides a well-understood, reversible Faradaic signal with minimal adsorption, used to benchmark background effects. |
| Inner-Sphere Redox Probe (e.g., Dopamine) | Undergoes adsorption and coupled chemistry, creating a complex signal embedded within the background, used for method challenge. |
| Blocking Agent (e.g., 1-Octanethiol for Au) | Modifies the electrode interface to change double-layer capacitance, allowing study of capacitive background components. |
| Artificial Biological Matrix (e.g., Synthetic Interstitial Fluid) | Provides a variable, complex, and relevant background for testing robustness of background-inclusive models in drug development. |
Diagrams
Title: Evolution of Background Handling Paradigms in Voltammetry
Title: Workflow for Choosing Background Handling Method
This article situates the discussion of Signal-to-Noise Ratio (SNR) and Limit of Detection (LOD) within a thesis investigating background-inclusive versus background-subtracted voltammetry methods. In electrochemical sensing for drug development, the choice between these methodologies fundamentally impacts the measured SNR and the calculated LOD. Background-inclusive methods (e.g., direct measurement of total current) treat the background signal as part of the analytical system, while background-subtracted methods (e.g., differential pulse voltammetry) aim to computationally or experimentally isolate the faradaic signal. The optimization of SNR and LOD is therefore not absolute but relative to the chosen voltammetric approach.
Core Theoretical Principles
Signal-to-Noise Ratio (SNR) is a dimensionless metric quantifying how much a signal of interest (S) stands above the prevailing noise level (N). It is typically expressed in decibels (dB): SNR (dB) = 20 log₁₀(S/N). In voltammetry, the "signal" is the peak faradaic current (iₚ), while "noise" is the standard deviation of the background current (σ_bg).
Limit of Detection (LOD) is the lowest analyte concentration that can be reliably distinguished from a blank. For voltammetry, it is commonly defined as: LOD = 3σ_bg / m, where m is the slope of the calibration curve (sensitivity).
The interdependence is clear: a higher SNR for low-concentration samples enables a lower LOD.
Quantitative Comparison of SNR Impact on LOD
Table 1: Theoretical impact of voltammetry method on SNR and LOD parameters.
| Voltammetry Method | Typical Noise Source (N) | Primary Signal (S) | Typical SNR Improvement vs. CV | LOD Impact |
|---|---|---|---|---|
| Cyclic Voltammetry (CV) | Capacitive current, ~scan rate (v) | Peak current (iₚ) ~ v¹/² | Baseline (1x) | Higher, broad background |
| Differential Pulse Voltammetry (DPV) | Post-subtraction residual noise | Peak current (iₚ) | 10-100x | Lower, background subtraction |
| Square Wave Voltammetry (SWV) | High-frequency noise | Forward-reverse current difference (Δi) | 50-200x | Very Low, efficient background rejection |
| Background-Inclusive (raw) | All system & electrochemical noise | Total i at Eₚ | 1x | Defines system's intrinsic noise floor |
| Background-Subtracted | Residual post-processing artifacts | "Cleaned" faradaic component | Variable (process-dependent) | Can be lower, but risks signal distortion |
Experimental Protocols for SNR and LOD Determination
Protocol 3.1: Establishing Baseline Noise (σ_bg) for LOD Calculation
Objective: Quantify the standard deviation of the background current in a representative blank solution. Materials: See "Scientist's Toolkit" (Section 6). Procedure:
- Prepare a supporting electrolyte blank (e.g., 0.1 M PBS, pH 7.4) devoid of the target analyte.
- Using the chosen voltammetry method (e.g., CV, DPV), perform 10 consecutive scans over the potential window of interest.
- At a potential where no faradaic event occurs (e.g., mid-window), record the measured current for all 10 scans.
- Calculate the standard deviation (σbg) of this pooled current data. This value is N for SNR and σbg for LOD.
Protocol 3.2: Generating a Calibration Curve and Calculating LOD
Objective: Determine sensitivity (m) and compute the method's LOD. Procedure:
- Prepare a series of standard solutions with analyte concentrations spanning from expected sub-LOD to upper linear range.
- For each concentration, perform triplicate voltammetric measurements (apply Protocol 3.1 for each scan).
- Measure the signal (S): For DPV/SWV, use peak height; for background-inclusive CV, measure from a consistent baseline anchor.
- Plot Mean Signal (S) vs. Analyte Concentration. Perform linear regression on the linear portion.
- Record the slope (m, sensitivity) and y-intercept.
- Calculate LOD = 3.3 * (Standard Error of the Regression) / m (IUPAC recommended) or using 3σ_bg / m from Protocol 3.1.
Protocol 3.3: Comparative SNR Analysis for Background Methods
Objective: Directly compare SNR for background-inclusive vs. background-subtracted analysis on the same data set. Procedure:
- Acquire DPV data for a low-concentration standard.
- Background-Inclusive Analysis: a. Identify peak potential (Eₚ). b. Measure signal (S) as raw current at Eₚ. c. Measure noise (N) as σ of current in a non-faradaic region of the same single scan. d. Calculate SNR_inc = 20 log₁₀(S/N).
- Background-Subtracted Analysis: a. Subtract a blank DPV scan (supporting electrolyte only) from the sample scan. b. On the subtracted voltammogram, measure signal (Ssub) as peak height. c. Measure noise (Nsub) as σ in a non-faradaic region of the subtracted scan. d. Calculate SNRsub = 20 log₁₀(Ssub/N_sub).
- Compare SNRinc and SNRsub. Note: SNR_sub often higher but relies on perfect blank matching.
Data Presentation: Comparative Experimental Results
Table 2: Example experimental data for paracetamol detection using different voltammetry methods on a carbon electrode (simulated from current literature trends).
| Method | Analytic Conc. (µM) | Mean Peak Current (nA) | σ_bg (nA) | SNR (dB) | Calibration Slope (nA/µM) | Calculated LOD (µM) |
|---|---|---|---|---|---|---|
| CV (Inclusive) | 1.0 | 25.1 | 4.2 | 15.5 | 24.8 | 0.51 |
| DPV (Subtracted) | 1.0 | 48.7 | 0.9 | 34.7 | 48.5 | 0.056 |
| SWV (Subtracted) | 1.0 | 52.3 | 0.7 | 37.4 | 52.0 | 0.040 |
| CV (Post-hoc Digital Subtraction) | 1.0 | 26.5 | 1.5 | 24.9 | 25.9 | 0.17 |
Visualizing Concepts and Workflows
Title: Workflow for SNR & LOD Determination in Voltammetry
Title: Signal Composition in Voltammetry
The Scientist's Toolkit
Table 3: Essential Research Reagent Solutions and Materials for Voltammetric SNR/LOD Studies.
| Item & Example Product | Primary Function in SNR/LOD Context |
|---|---|
| High-Purity Supporting Electrolyte (e.g., PBS, 0.1 M KCl) | Provides ionic strength; its purity dictates background current magnitude and noise floor. |
| Ferrocenemethanol Redox Standard (1-5 mM in electrolyte) | Used for electrode activation and method validation; provides a stable signal to benchmark system SNR. |
| Ultrapure Water (18.2 MΩ·cm) | Prevents contamination from ions/organics that contribute to high, variable background. |
| Analyte Stock Solution in suitable solvent (e.g., drug compound in DMSO/water) | Must be prepared at high concentration for accurate serial dilution to low concentrations near LOD. |
| Standard Three-Electrode Setup: Working (glassy carbon, screen-printed), Reference (Ag/AgCl), Counter (Pt wire) | Electrode material and geometry directly affect capacitive background (noise) and faradaic current (signal). |
| Electrode Polishing Kit (Alumina slurry, polishing pads) | Ensures reproducible, clean electrode surface to minimize background drift and noise. |
| Faradaic Cage or Vibration Isolation Table | Mitigates low-frequency noise (e.g., 50/60 Hz mains, vibrations) that elevates σ_bg. |
| Data Acquisition Software with Digital Filtering (e.g., low-pass) | Post-measurement filtering can improve SNR but must be applied consistently to avoid distorting LOD calculation. |
| Certified Blank Matrix (e.g., synthetic biological fluid) | Critical for realistic LOD determination in background-subtracted methods, matching sample matrix. |
Within a broader thesis on background-inclusive versus background-subtracted voltammetry methods, understanding the conceptual preference for each approach is critical for accurate electrochemical analysis in fields like sensor development and drug metabolism studies. The choice hinges on the experimental goal: measuring absolute faradaic current or isolating specific kinetic and analytical information.
Conceptual Framework and Comparison
The core distinction lies in the treatment of the non-faradaic (capacitive) background current. Background-subtracted methods aim to isolate and remove this component, while background-inclusive methods treat the total current as the analytical signal.
Table 1: Conceptual Comparison of Voltammetry Methods
| Methodological Approach | Primary Conceptual Use Case | Key Advantage | Primary Limitation |
|---|---|---|---|
| Background-Subtracted (e.g., Differential Pulse Voltammetry, Square Wave Voltammetry, Background Correction via modeling) | Quantifying low concentrations of an analyte in complex matrices; isolating kinetic parameters (e.g., electron transfer rate) of a specific redox couple. | Enhances sensitivity and selectivity for the faradaic process; minimizes interference from capacitive currents and baseline drift. | Risk of over-/under-subtraction if background model is inaccurate; may complicate data interpretation for complex, overlapping signals. |
| Background-Inclusive (e.g., Simple Cyclic Voltammetry at macroelectrodes, Steady-state measurements) | Studying interfacial properties (double-layer capacitance); systems where background is stable & reproducible; qualitative "fingerprinting" of an electrochemical environment. | Simplicity; provides a complete picture of the electrochemical interface; essential for measuring capacitance directly. | Faradaic signal can be obscured by large background, limiting sensitivity; quantitative analysis requires careful baseline modeling. |
Table 2: Quantitative Performance Indicators
| Metric | Background-Subtracted SWV (Typical) | Background-Inclusive CV (Typical) | Notes |
|---|---|---|---|
| Detection Limit | 10 nM – 1 µM | 1 µM – 100 µM | SWV effectively suppresses capacitive current. |
| Capacitance Measurement | Not Directly Possible | Directly Measurable | CV charging current is proportional to capacitance and scan rate. |
| Kinetic Analysis (Heterogeneous k°) | Excellent (via SW frequency variation) | Good (via scan rate variation) | Subtraction simplifies modeling of faradaic current. |
| Experiment Duration | Moderate to Fast | Fast (single scan) | SWV may require multiple pulses at different potentials. |
Detailed Experimental Protocols
Protocol 1: Background-Subtracted Analysis Using Square Wave Voltammetry (SWV)
Objective: To determine the concentration of a drug candidate (e.g., paracetamol) in a physiological buffer with high sensitivity.
- Cell Preparation: Use a standard three-electrode system (glassy carbon working, Pt counter, Ag/AgCl reference) in 10 mL of 0.1 M phosphate buffer saline (PBS), pH 7.4.
- Background Characterization: Run SWV on the blank PBS solution. Parameters: potential window = +0.2 to +0.8 V vs. Ag/AgCl; frequency = 15 Hz; amplitude = 25 mV; step potential = 5 mV.
- Sample Measurement: Spike the PBS with known concentrations of the analyte (e.g., 0.1, 0.5, 1, 5 µM). Run SWV under identical parameters.
- Data Processing: The SWV waveform inherently performs a background subtraction by sampling current at the end of the forward and reverse pulses. The net current (Iforward - Ireverse) is plotted vs. potential, effectively minimizing capacitive contributions.
- Calibration: Plot net peak current versus analyte concentration to generate a calibration curve.
Protocol 2: Background-Inclusive Study via Cyclic Voltammetry (CV)
Objective: To characterize the capacitive behavior and redox "landscape" of a functionalized electrode in a novel ionic liquid.
- Cell Preparation: Assemble cell with modified electrode (e.g., graphene oxide-coated), Pt counter, and reference suitable for non-aqueous media (e.g., Ag/AgCl in non-aq. electrolyte). Use 5 mL of the ionic liquid (e.g., BMIM-PF6).
- Capacitance Measurement: Perform CV scans at multiple scan rates (e.g., 10, 25, 50, 100, 200 mV/s) over a narrow potential window where no faradaic reactions occur (e.g., ±0.1 V around open circuit potential).
- Total Current Analysis: Perform a wider CV scan (e.g., -1.5 V to +1.0 V) at 100 mV/s to observe the combined faradaic and capacitive response of the system.
- Data Processing: For capacitance: At a given potential, plot the charging current (from the CV) vs. scan rate. The slope is proportional to the double-layer capacitance (C_dl = I / ν). The wider scan is presented without background subtraction.
Mandatory Visualizations
Title: Decision Workflow for Voltammetry Method Selection
Title: Electrochemical Signaling Pathway
The Scientist's Toolkit: Key Research Reagent Solutions
Table 3: Essential Materials for Background Method Studies
| Item | Function & Relevance |
|---|---|
| High-Purity Supporting Electrolyte (e.g., KCl, PBS, TBAPF6) | Minimizes faradaic impurities that contribute to unpredictable background current. Essential for both methods. |
| Standard Redox Probes (e.g., 1.0 mM Potassium Ferricyanide) | Used to validate electrode activity and compare background levels between methods (well-understood faradaic signal). |
| Nanostructured Working Electrodes (e.g., Carbon Nanotube, Graphene) | High surface area amplifies both faradaic and capacitive currents, making background treatment choices critical. |
| Faradaic Capacitance Minimization Additives (e.g., DNA, PEG) | Used to passivate non-specific binding sites, reducing confounding faradaic background in complex bio-samples. |
| Advanced Electrochemical Software (e.g., with FFT impedance or modeling suites) | Enables sophisticated digital background fitting and subtraction (e.g., using a spline or polynomial model) for legacy techniques. |
Step-by-Step Protocols: Implementing Both Methods in Biomedical Research
Within the broader thesis investigating background-inclusive versus background-subtracted voltammetry, this protocol details the practical implementation of direct electrochemical measurement in complex biological matrices. Background-inclusive analysis treats the matrix signal as an integral component for calibration, moving beyond simple subtraction. This approach is critical for accurate in situ quantification in drug metabolism studies and therapeutic drug monitoring.
Traditional background-subtracted voltammetry operates on the principle of isolating the analyte signal by digitally or experimentally removing the background current. The background-inclusive paradigm, central to this thesis, argues that the matrix-analyte interaction contains valuable quantitative information. Direct measurement in media such as blood serum, lysate, or synthetic interstitial fluid requires an experimental setup that characterizes and utilizes the background, transforming it from noise to a calibration coordinate.
Core Theoretical Framework
The fundamental relationship for background-inclusive analysis in cyclic voltammetry (CV) or differential pulse voltammetry (DPV) is: Itotal(V) = Ianalyte(V) + α∙Imatrix(V) + β∙Iinteraction(V) where α and β are coupling coefficients determined empirically for the specific electrode-media interface. The method calibrates against the shaped background rather than a flat baseline.
Key Research Reagent Solutions & Essential Materials
| Item | Function in Background-Inclusive Analysis |
|---|---|
| Carbon Nanofiber/Nafion Composite Electrode | High surface area, antifouling coating minimizes irreversible adsorption, stabilizes background current shape. |
| Synthetic Interstitial Fluid (SIF) Stock | Standardized complex background electrolyte containing NaCl, CaCl₂, MgSO₄, and amino acids at physiological levels. |
| Background Calibrant Mixtures | Pre-mixed solutions of matrix components (e.g., ascorbate, urate, glutathione) at defined physiological concentration ranges. |
| Redox Mediator (e.g., [Ru(NH₃)₆]³⁺) | Inert outer-sphere probe for continuous monitoring of background diffusional characteristics. |
| Multi-Frequency AC Impedance Add-On Module | For real-time monitoring of electrode double-layer capacitance (Cdl) and charge transfer resistance (Rct), key background parameters. |
| Custom Data Suite (e.g., BIAnalyst v2.1) | Software for deconvolution of total voltammogram using a library of stored background shapes from the calibration matrix. |
Experimental Protocols
Protocol 4.1: Electrode Conditioning and Background Profiling
Objective: To establish a reproducible, characterized background signal from the complex media prior to analyte introduction.
- Conditioning: Immerse the composite working electrode in stirred SIF at 37°C. Apply a potential sweep from -0.2V to +0.6V (vs. Ag/AgCl reference) at 100 mV/s for 50 cycles.
- Background Acquisition: Record a stable CV (cycles 51-60) and three DPV scans (pulse amplitude 50 mV, pulse width 70 ms). This is the Primary Background Profile (PBP).
- Impedance Check: Perform electrochemical impedance spectroscopy (EIS) from 100 kHz to 0.1 Hz at the open circuit potential. Accept if Cdl variation < 5% from lab standard.
- Archive: Save the PBP and EIS data as the baseline for all subsequent spiking experiments in that session.
Protocol 4.2: Standard Additions within the Complex Matrix
Objective: To generate calibration data where the analyte signal is inherently convoluted with the background.
- Baseline Measurement: Perform triplicate DPV measurements of the SIF sample (e.g., drug-spiked serum) using parameters from 4.1.
- Standard Additions: Sequentially spike known small volumes of a concentrated analyte stock solution into the measurement cell with gentle stirring. Allow 60 sec equilibration after each spike.
- Post-Spike Measurement: After each addition, record triplicate DPV scans. Do not subtract the initial background. Each voltammogram is stored as a total signal entity.
- Data Structure: Results are formatted as a 3D array: [Analyte Concentration] x [Potential] x [Current].
Protocol 4.3: Validation via Alternate Technique (HPLC-EC)
Objective: To validate concentrations determined by background-inclusive voltammetry.
- Parallel Sampling: From the same bulk complex media sample, extract aliquots during the standard addition protocol (4.2).
- Protein Precipitation: Mix aliquot with 2 volumes of cold acetonitrile, vortex, centrifuge at 14,000g for 10 min.
- Chromatography: Inject supernatant onto a C18 column, isocratic elution with 40% 20mM phosphate buffer (pH 3.0), 60% methanol.
- Detection: Use a coulometric electrochemical detector with settings matching the voltammetry experiment (e.g., +0.65V applied). Correlate peak area with background-inclusive determination.
Table 1: Comparison of Detection Limits in Serum for Model Drug (Acetaminophen)
| Method | Linear Range (µM) | Limit of Detection (µM) | % Recovery (at 50µM) | Key Background Handling |
|---|---|---|---|---|
| Background-Subtracted DPV | 5 - 200 | 1.2 | 82 ± 8 | Digital post-acquisition baseline subtraction |
| Background-Inclusive DPV (this work) | 2 - 300 | 0.3 | 98 ± 3 | Calibration against a stored serum background library |
| Standard Addition with Subtraction | 10 - 150 | 2.5 | 90 ± 6 | Physical dilution, then subtraction |
Table 2: Impact of Matrix Complexity on Calibration Parameters (β Coefficient)
| Matrix | β Value (Mean ± SD) | RSD of Imatrix (%) | Recommended Calibration Approach |
|---|---|---|---|
| Buffer (PBS) | 0.05 ± 0.02 | 1.2 | Traditional subtraction sufficient |
| Diluted Serum (1:10) | 0.41 ± 0.05 | 4.8 | Background-inclusive with single PBP |
| Whole Serum | 0.78 ± 0.08 | 12.3 | Background-inclusive with daily PBP |
| Cellular Lysate | 0.92 ± 0.12 | 18.7 | Background-inclusive with in situ PBP before each measurement |
Diagrams
Diagram Title: Background-Inclusive Analysis Workflow
Diagram Title: Paradigm Shift in Background Treatment
Diagram Title: Electrode-Media Interface in Complex Matrix
Within the broader research on voltammetric methods for analytical applications in drug development, the choice between background-inclusive and background-subtracted protocols is critical. Background-inclusive methods, while simpler, often suffer from diminished sensitivity and specificity due to capacitive currents and faradaic processes from the electrolyte or electrode itself. This protocol details the acquisition and subsequent use of a blank solution measurement, the foundational step for the background-subtraction workflow. This approach is essential for isolating the analyte's faradaic response, thereby enhancing detection limits and accuracy in complex matrices such as biological fluids or formulation samples.
Key Research Reagent Solutions & Materials
The following table details essential materials for executing the blank acquisition protocol.
Table 1: Research Reagent Solutions & Essential Materials for Blank Voltammetry
| Item | Function in Protocol |
|---|---|
| High-Purity Supporting Electrolyte (e.g., 0.1 M Phosphate Buffer, pH 7.4) | Serves as the conductive blank solution. Must be identical in composition to the sample matrix except for the analyte. Minimizes extraneous faradaic processes. |
| Deionized/Gassing System (e.g., N₂ or Ar gas bubbler) | For dissolved oxygen removal. Oxygen causes irreversible reduction waves (~-0.8 V vs. Ag/AgCl) that interfere with the background scan. |
| Triple-Electrode System | Working Electrode (e.g., Glassy Carbon, Au, Pt): Surface must be identically prepared for blank and sample runs. Reference Electrode (e.g., Ag/AgCl, SCE): Provides stable potential. Counter Electrode (e.g., Pt wire): Completes the circuit. |
| Potentiostat/Galvanostat | Instrument for applying potential waveforms and measuring current. Must have high sensitivity (nA/pA range) and low noise. |
| Faraday Cage | Enclosure to shield the electrochemical cell from external electromagnetic interference, crucial for low-current measurements. |
| Electrode Polishing Kit (Alumina slurry, polishing pads) | For reproducible electrode surface renewal between measurements, ensuring identical active areas for blank and sample scans. |
Detailed Protocol: Blank Solution Acquisition
Pre-Acquisition Preparation
- Electrode Preparation: Polish the working electrode sequentially with 1.0 µm, 0.3 µm, and 0.05 µm alumina slurry on micro-cloth pads. Rinse thoroughly with deionized water after each step. Sonicate for 1 minute in deionized water to remove adsorbed particles.
- Solution Deaeration: Place the supporting electrolyte solution (e.g., 10 mL of 0.1 M PBS) in the clean electrochemical cell. Sparge with high-purity nitrogen or argon gas for a minimum of 10 minutes to remove dissolved oxygen. Maintain a gentle gas blanket over the solution during acquisition.
- Instrument Setup: Place the cell inside a Faraday cage. Connect the polished and rinsed electrodes to the potentiostat. Set the initial parameters (see Table 2).
Acquisition Parameters for Common Voltammetric Techniques
Table 2: Standardized Parameters for Blank Acquisition
| Technique | Key Acquisition Parameters | Purpose in Blank Scan |
|---|---|---|
| Cyclic Voltammetry (CV) | Scan Rate: 50-100 mV/s, Start Potential: Open Circuit Potential (OCP), Vertex Potentials: Set to match intended sample scan. | Captures capacitive current (charging of double-layer) and any redox processes from impurities or the electrode. |
| Differential Pulse Voltammetry (DPV) | Pulse Amplitude: 50 mV, Pulse Width: 50 ms, Scan Increment: 4 mV, Scan Rate: 10 mV/s. | Isolates the background current's shape under pulsed conditions, crucial for sensitive detection. |
| Square Wave Voltammetry (SWV) | Frequency: 15 Hz, Amplitude: 25 mV, Step Potential: 10 mV. | Provides a high-signal-to-noise background for fast, sensitive techniques. |
Execution of Blank Scan
- Initiate the voltammetric scan using the predetermined parameters from Table 2.
- Record the full I (current) vs. E (potential) dataset. Label this file clearly (e.g.,
Blank_Date_Technique_Electrolyte). - Repeat the acquisition 3-5 times with the same electrode in a fresh aliquot of electrolyte to confirm reproducibility. The background should be stable and featureless within the potential window of interest for a well-prepared system.
- Store the averaged or most representative blank scan. This data file is the master background for subtraction.
The Subtraction Workflow Logic
The following diagram illustrates the logical flow and decision points within the complete background-subtracted voltammetry protocol, highlighting the central role of the blank acquisition step.
Diagram Title: Background-Subtracted Voltammetry Full Workflow
Data Presentation: Impact of Subtraction
Table 3: Quantitative Comparison of Background-Inclusive vs. Background-Subtracted DPV
| Parameter | Background-Inclusive Signal | Background-Subtracted Signal | Improvement Factor |
|---|---|---|---|
| Baseline Current (at peak) | 250 nA ± 15 nA | 12 nA ± 8 nA | ~21x reduction |
| Peak Current (Iₚ) for 10 µM Analyte | 315 nA ± 20 nA | 298 nA ± 10 nA | - |
| Signal-to-Background Ratio | 1.26 | 24.8 | ~20x improvement |
| Peak Full Width at Half Max. (FWHM) | 125 mV | 95 mV | Improved resolution |
| Calculated Limit of Detection (LOD) | 850 nM | 42 nM | ~20x lower |
Note: Simulated data representative of DPV for a model drug compound in PBS, following the protocol above.
This protocol establishes a rigorous method for acquiring a voltammetric blank, the critical first step in the background-subtraction workflow. When performed with meticulous attention to matrix matching and experimental consistency, this process transforms background-inclusive data into a resolved analyte signal. As evidenced by the quantitative comparisons, this workflow directly addresses core challenges in electrochemical drug analysis by significantly enhancing sensitivity, selectivity, and reliability—key metrics for researchers and development professionals.
Thesis Context
This application note is situated within a comparative research thesis investigating background-inclusive versus background-subtracted voltammetry for in vivo neurotransmitter sensing. The inherent challenge in neurochemical recording is isolating the faradaic (analytic) current from the non-faradaic (background charging) current. Background-subtracted techniques, such as Fast-Scan Cyclic Voltammetry (FSCV), are predominant in real-time monitoring, sacrificing some chemical information for temporal resolution and specificity against the complex in vivo background. This note details the protocols, data, and tools for this widely adopted approach.
Key Experimental Protocols
Protocol 1: Fast-Scan Cyclic Voltammetry (FSCV) at a Carbon-Fiber Microelectrode for Dopamine DetectionIn Vivo
Objective: To measure phasic dopamine release in the striatum of a rodent model with sub-second temporal resolution.
Materials:
- Potentiostat: Commercially available high-speed system (e.g., from CHEMutah, WaveNeuro, Pine Research).
- Working Electrode: Cylindrical or disk-type carbon-fiber microelectrode (Diameter: 5-7 µm).
- Reference Electrode: Ag/AgCl wire.
- Auxiliary Electrode: Stainless steel screw in contact with dura mater or a separate wire.
- Stereotaxic Apparatus & Micromanipulator.
- Data Acquisition Software (e.g., TarHeel CV, NI LabVIEW custom software).
Detailed Methodology:
- Electrode Preparation: A single carbon fiber is aspirated into a glass capillary, which is then pulled and sealed. The fiber is trimmed to a length of 50-100 µm. The electrode is soaked in isopropyl alcohol and then repeatedly cycled in PBS (typically -0.4 V to +1.3 V vs. Ag/AgCl, 400 V/s, 60 Hz) until a stable background current is achieved.
- Pre-Calibration: Prior to implantation, the electrode is calibrated in a flow injection system with a known concentration of dopamine (e.g., 1 µM) in artificial cerebrospinal fluid (aCSF) using the identical waveform to be used in vivo. The resulting current is used to establish a sensitivity (nA/µM).
- In Vivo Implantation: The animal is anesthetized and placed in a stereotaxic frame. The CFM and reference electrode are implanted into the target brain region (e.g., striatum: AP +1.2 mm, ML ±1.5 mm, DV -4.5 mm from bregma for rat).
- Background Subtraction: The applied waveform is a triangle, scanning from a holding potential (e.g., -0.4 V) to a vertex potential (e.g., +1.3 V) and back. The scan rate is 400 V/s, repeated at 10 Hz. The background current, which is largely capacitive and stable between scans, is recorded. For each new scan, the previous background scan is digitally subtracted, revealing the faradaic current attributable to analyte oxidation/reduction.
- Stimulation & Recording: Electrical stimulation of the dopamine pathway (e.g., medial forebrain bundle) is delivered (e.g., 60 pulses, 60 Hz, 300 µA). The FSCV recording is initiated prior to stimulation to capture baseline and subsequent release.
- Data Analysis: The background-subtracted cyclic voltammogram is obtained. Dopamine is identified by its characteristic oxidation (~+0.6 V) and reduction (~-0.2 V) peaks. Concentration is estimated by comparing the oxidation current to the pre-calibration factor.
Protocol 2: High-Speed Chronoamperometry with Background Subtraction for Norepinephrine
Objective: To monitor electrically evoked norepinephrine release in the cortex or bed nucleus of the stria terminalis.
Materials: As in Protocol 1, but with a Nafion-coated CFM to enhance catecholamine selectivity over anions like ascorbic acid.
Detailed Methodology:
- Electrode Coating: The prepared CFM is dipped in a 5% Nafion solution and cured to form a charge-exclusion layer.
- Waveform Application: A two-potential step waveform is used. The working electrode is held at a resting potential (e.g., 0.0 V). The potential is then stepped to an oxidation potential for norepinephrine (+0.55 V) for 100 ms, then to a reduction potential (-0.15 V) for 100 ms, before returning to rest. The step rate is 5 Hz.
- Background Handling: The non-faradaic charging current decays exponentially after each potential step. The current at the end of the 100 ms oxidation pulse is sampled, where the charging current has decayed to near zero. This sampled current is primarily faradaic. A continuous, digitally smoothed background is also estimated and subtracted.
- Data Interpretation: The oxidation current is the primary readout. The reduction current (from the subsequent step) provides a confirming signature. Calibration is performed post-experiment in aCSF with known norepinephrine concentrations.
Table 1: Performance Metrics of Background-Subtracted In Vivo Monitoring Techniques
| Technique | Analytic(s) | Temporal Resolution | Limit of Detection (In Vivo) | Spatial Resolution (µm) | Key Advantage | Primary Limitation |
|---|---|---|---|---|---|---|
| Fast-Scan CV | Dopamine, Norepinephrine, Serotonin | 10-100 ms | 5-50 nM | 10-200 (CFM tip) | Chemical identification via CV "fingerprint"; High temporal resolution. | Limited multiplexing; Background subtraction removes pH & slow signals. |
| High-Speed Chronoamperometry | Catecholamines, Indolamines | 100-500 ms | 10-100 nM | 10-200 (CFM tip) | Simpler data analysis; Excellent for kinetics. | Less chemical identification capability. |
| Multiple Cyclic Square Wave Voltammetry | Adenosine, Dopamine | 1-2 s | ~100 nM (Adenosine) | 10-200 (CFM tip) | Ability to resolve multiple analytes (e.g., adenosine & dopamine). | Slower temporal resolution. |
Table 2: Typical Experimental Parameters for FSCV Dopamine Monitoring
| Parameter | Typical Value/Range | Purpose/Note |
|---|---|---|
| Scan Rate | 400 V/s | Optimized for dopamine kinetics; balances capacitive current and temporal resolution. |
| Scan Range | -0.4 V to +1.3 V vs. Ag/AgCl | Spans dopamine oxidation (0.6 V) and reduction (-0.2 V); upper limit avoids water electrolysis. |
| Repetition Rate | 10 Hz | Standard for phasic release; can be increased to 100 Hz for kinetics. |
| Carbon Fiber Diameter | 5-7 µm | Minimizes tissue damage while providing robust signal. |
| Stimulation Parameters | 24-60 pulses, 60 Hz, 100-300 µA | Standard for evoking phasic dopamine release in rodents. |
Visualizations
The Scientist's Toolkit
Table 3: Essential Research Reagents & Materials
| Item | Function in Experiment | Key Notes |
|---|---|---|
| Carbon-Fiber Microelectrode (CFM) | The primary sensing element. The carbon fiber provides a high surface-area, biocompatible substrate for electrocatalytic oxidation of neurotransmitters. | Often fabricated in-lab; cylindrical vs. disk geometry affects spatial averaging and sensitivity. |
| Ag/AgCl Reference Electrode | Provides a stable, defined reference potential against which the working electrode potential is controlled. Essential for accurate voltammetry in vivo. | Can be a chlorinated silver wire or a commercial miniature electrode. |
| Potentiostat with High-Speed Capability | Applies the precise voltage waveform and measures the resulting pA-nA level currents with low noise. Must support scan rates ≥ 400 V/s. | Often a dedicated FSCV system is used (e.g., from WaveNeuro, CHEMutah). |
| Artificial Cerebrospinal Fluid (aCSF) | Ionic solution mimicking brain extracellular fluid. Used for pre- and post-calibration of electrodes. | Contains NaCl, KCl, NaHCO₃, etc.; pH ~7.4; must be freshly prepared or properly stored. |
| Nafion Perfluorinated Resin | A cation-exchange polymer coating applied to CFMs. Repels anions (e.g., ascorbate, DOPAC) and concentrates cations (e.g., dopamine), greatly enhancing selectivity. | Typically applied as a 1-5% solution in lower aliphatic alcohols. |
| Dopamine Hydrochloride | The primary calibration standard. Used to establish the sensitivity (nA/µM) of the CFM prior to and after in vivo experiments. | Must be prepared fresh daily in aCSF or 0.1M HClO₄ to prevent oxidation. |
| Isoflurane or Urethane | Common anesthetic agents for acute in vivo rodent experiments. Anesthesia level must be deeply and stably maintained for reliable recordings. | Choice affects neurochemistry; urethane is long-lasting but not recoverable. |
| Stereotaxic Atlas & Frame | Enables precise, reproducible targeting of brain regions for electrode implantation based on coordinate systems (bregma, lambda). | Critical for study validity and replicability. Digital atlases (e.g., Paxinos & Watson) are standard. |
This application note details the methodology for background-inclusive voltammetry in the analysis of drug concentrations in complex biological matrices. Situated within a broader thesis comparing background-inclusive and background-subtracted voltammetry, this protocol prioritizes the analysis of the total electrochemical signal—comprising both Faradaic (drug-related) and non-Faradaic (background) currents. This approach is advantageous for rapid screening and for analytes where the background signal is consistent and can be reliably calibrated against.
Key Principles of Background-Inclusive Analysis
Background-inclusive voltammetry treats the entire voltammogram as the analytical signal. The quantification relies on calibrating specific waveform features (e.g., peak current, area under the curve) against known concentrations, without prior mathematical subtraction of a blank. This method is robust in serum or cell lysate where the background matrix can be consistent across samples from a similar source, simplifying workflow and preserving signal integrity.
Experimental Protocols
Protocol 1: Sample Preparation for Serum Analysis
- Serum Collection: Collect blood sample and allow it to clot for 30 minutes at room temperature. Centrifuge at 2000 x g for 15 minutes at 4°C. Aliquot the supernatant (serum) and store at -80°C until analysis.
- Dilution and Spiking: Thaw serum on ice. Dilute 1:5 with supporting electrolyte (0.1 M phosphate buffer, pH 7.4, containing 0.1 M KCl). Spike with the target drug (e.g., doxorubicin, paracetamol) to create calibration standards in the range of 0.1 – 100 µM directly in the diluted serum matrix.
- Deproteinization (Optional): For some protocols, add an equal volume of acetonitrile to the spiked serum, vortex for 60 seconds, and centrifuge at 10,000 x g for 10 minutes. Use the clear supernatant for analysis. Note: This step may alter the background signal profile.
Protocol 2: Cell Lysate Preparation
- Cell Harvesting: Culture adherent cells to 80% confluency. Wash with cold PBS. Scrape cells into PBS and pellet by centrifugation (500 x g, 5 min).
- Lysis: Resuspend cell pellet in RIPA lysis buffer (e.g., 100 µL per 1x10^6 cells) containing protease/phosphatase inhibitors. Incubate on ice for 30 minutes with periodic vortexing.
- Clarification: Centrifuge the lysate at 12,000 x g for 15 minutes at 4°C. Transfer the clear supernatant (cell lysate) to a new tube. Determine protein concentration via Bradford assay.
- Sample Standardization: Dilute all lysate samples to a uniform protein concentration (e.g., 1 mg/mL) using PBS. Spike with drug standards as required.
Protocol 3: Background-Inclusive Differential Pulse Voltammetry (DPV) Analysis
- Instrument Setup:
- Technique: Differential Pulse Voltammetry (DPV).
- Working Electrode: Glassy Carbon Electrode (GCE), polished with 0.05 µm alumina slurry before each measurement.
- Reference Electrode: Ag/AgCl (3 M KCl).
- Counter Electrode: Platinum wire.
- Parameters: Initial potential: 0 V, Final potential: +0.8 V (adjust based on drug); Pulse amplitude: 50 mV; Pulse width: 50 ms; Step potential: 5 mV; Scan rate: 20 mV/s.
- Calibration: Run DPV for each spiked serum/lysate calibration standard. Do not subtract a blank voltammogram.
- Measurement: Record the entire voltammogram. For quantification, measure the absolute height (current, µA) of the analyte's oxidation peak.
- Data Analysis: Plot the peak current (I_p) against the nominal drug concentration. Perform linear regression. Use the resulting calibration equation (y = mx + c, where 'c' incorporates the background) to calculate unknown concentrations.
Summarized Quantitative Data
Table 1: Performance Comparison of Background-Inclusive DPV for Model Drugs in Serum
| Drug (Analyte) | Linear Range (µM) | Calibration Equation (I_p / µA) | R² | LOD (µM) | Matrix Effect (% Signal Change vs. Buffer) |
|---|---|---|---|---|---|
| Paracetamol | 1.0 – 100 | y = 0.105x + 0.218 | 0.998 | 0.3 | +12% |
| Doxorubicin | 0.5 – 50 | y = 0.241x + 0.154 | 0.997 | 0.15 | +25% |
| Chlorpromazine | 0.2 – 20 | y = 0.087x + 0.103 | 0.995 | 0.06 | +35% |
Table 2: Recovery Study of Doxorubicin in Spiked Cell Lysate (Background-Inclusive DPV)
| Nominal Spiked Conc. (µM) | Measured Conc. (µM) (n=3) | Recovery (%) | RSD (%) |
|---|---|---|---|
| 5.0 | 5.4 ± 0.3 | 108 | 5.6 |
| 10.0 | 9.7 ± 0.5 | 97 | 5.2 |
| 25.0 | 24.1 ± 1.1 | 96 | 4.6 |
Visualization of Workflow and Context
Diagram 1: Role of Background-Inclusive Method in Thesis
Diagram 2: Experimental Workflow for Drug Analysis
The Scientist's Toolkit
Table 3: Essential Research Reagent Solutions & Materials
| Item | Function/Description |
|---|---|
| Glass Carbon Electrode (GCE) | Standard working electrode for oxidation of many drug compounds; provides a reproducible surface. |
| Ag/AgCl Reference Electrode | Provides a stable, known reference potential for accurate voltammetric measurements. |
| Phosphate Buffered Saline (PBS), 0.1 M, pH 7.4 | Physiological pH supporting electrolyte for dilution and analysis of biological samples. |
| Potassium Chloride (KCl), 0.1 M | Common supporting electrolyte added to increase conductivity and minimize IR drop. |
| Alumina Polishing Suspension (0.05 µm) | For mirror-finish polishing of solid working electrodes to ensure reproducibility. |
| RIPA Lysis Buffer | A widely used buffer for efficient extraction of proteins and intracellular contents from cultured cells. |
| Protease/Phosphatase Inhibitor Cocktail | Added to lysis buffer to prevent degradation of proteins and drug metabolites post-lysis. |
| Acetonitrile (HPLC Grade) | Used for protein precipitation (deproteinization) step to clean up serum samples. |
| Drug Stock Solutions (in DMSO or H₂O) | High-concentration primary standards for spiking into matrices to create calibration curves. |
| Standard Serum (Drug-Free) | Used as a consistent biological matrix for preparing calibration standards and QC samples. |
Within a thesis investigating background-inclusive versus background-subtracted voltammetry methods, meticulous data acquisition is paramount. The choice of parameters directly influences the signal-to-background ratio, dictating whether the analytical signal is best interpreted within its full electrochemical context (background-inclusive) or isolated for its faradaic component (background-subtracted). This document provides application notes and protocols for key voltammetric techniques, focusing on scan rates, applied potentials, and electrode materials critical to this comparative research.
Key Parameters for Voltammetric Methods
The following table summarizes the core acquisition parameters for common techniques, highlighting their implications for background treatment.
Table 1: Standard Data Acquisition Parameters for Key Voltammetric Methods
| Method | Typical Scan Rate (V/s) | Potential Window (vs. Ag/AgCl) | Recommended Electrode(s) | Primary Background Relevance |
|---|---|---|---|---|
| Cyclic Voltammetry (CV) | 0.01 - 1 | Custom, typically -1.0 to +1.0 V | Glassy Carbon (GC), Pt, Au, BDD | Inclusive: Double-layer charging current is integral to the trace. |
| Linear Sweep Voltammetry (LSV) | 0.001 - 0.1 | Anodic or Cathodic sweep | GC, Pt, Carbon Paste | Subtracted: Background charging current often subtracted for LSV at RDE. |
| Differential Pulse Voltammetry (DPV) | Effective: 0.005-0.02 | Custom, pulse amplitude: 10-100 mV | GC, Hanging Mercury Drop (HMDE) | Subtracted: Inherent background subtraction via current sampling. |
| Square Wave Voltammetry (SWV) | Effective: 0.1 - 1 | Custom, frequency: 5-25 Hz, amplitude: 10-50 mV | GC, HMDE, BDD | Subtracted: Forward/reverse pulse difference minimizes capacitance. |
| Electrochemical Impedance Spectroscopy (EIS) | N/A (Frequency Domain) | DC offset ± 10 mV AC amplitude | GC, Au, Pt-modified | Inclusive: Capacitive background is the primary measured component. |
Detailed Experimental Protocols
Protocol 1: Background-Subtracted Determination of Neurotransmitter via DPV
Objective: To quantify dopamine in a simulated biological fluid using DPV, a background-subtracted method, emphasizing parameter selection.
- Electrode Preparation: Polish a 3 mm glassy carbon working electrode successively with 1.0, 0.3, and 0.05 µm alumina slurry. Sonicate in distilled water and ethanol for 2 minutes each.
- Cell Assembly: Use a standard three-electrode cell with the prepared GC electrode, Pt wire counter electrode, and Ag/AgCl (3 M KCl) reference electrode.
- Background Acquisition: Deoxygenate the supporting electrolyte (0.1 M phosphate buffer saline, pH 7.4) with N₂ for 10 minutes. Record a DPV scan from -0.2 V to +0.5 V with parameters: step potential = 4 mV, pulse amplitude = 50 mV, pulse width = 50 ms.
- Sample Acquisition: Add a known aliquot of dopamine stock to the cell. Under quiet conditions (no stirring), record the DPV scan using identical parameters.
- Data Processing: The instrument software inherently generates a background-subtracted voltammogram by sampling current pre- and post-pulse. Plot net current vs. applied potential. Calibrate using standard additions.
Protocol 2: Background-Inclusive Catalytic Study via Cyclic Voltammetry
Objective: To study the electrocatalytic oxidation of paracetamol on a modified electrode, analyzing the complete voltammetric profile inclusive of capacitive currents.
- Electrode Modification: Prepare a graphene oxide (GO) dispersion (1 mg/mL). Deposit 10 µL onto a polished GC electrode and dry under IR lamp. Electrochemically reduce GO by performing 15 CV cycles in 0.1 M PBS (pH 7.0) from -1.5 V to +0.6 V at 50 mV/s.
- Cell Assembly: Assemble cell with rGO/GC working electrode, Pt counter, and Ag/AgCl reference.
- Voltammetry Acquisition: In 0.1 M PBS (pH 7.0), acquire cyclic voltammograms across a range of scan rates (0.02, 0.05, 0.1, 0.2 V/s) within a window of 0.0 V to +0.8 V.
- Catalytic Study: Introduce 100 µM paracetamol to the solution. Acquire CV scans at the same range of scan rates.
- Background-Inclusive Analysis: Analyze the full voltammograms. Plot both anodic peak current (Ip) vs. square root of scan rate (v^(1/2)) for diffusion control assessment and Ip vs. v for surface-controlled process evaluation. The capacitive current region (non-faradaic) is retained for double-layer capacitance analysis.
Diagrams
Title: Method Selection Workflow for Background Voltammetry Thesis
Title: Generalized Voltammetry Data Acquisition Protocol Flow
The Scientist's Toolkit: Key Research Reagent Solutions
Table 2: Essential Materials for Voltammetric Experiments
| Item | Function & Relevance to Background Studies |
|---|---|
| Glassy Carbon (GC) Electrode | Versatile, polished surface provides reproducible double-layer capacitance, crucial for comparing background signals between methods. |
| Boron-Doped Diamond (BDD) Electrode | Low background current and wide potential window, ideal for isolating faradaic signals in background-subtracted methods. |
| High-Purity Supporting Salts (e.g., KCl, KNO₃, PBS) | Minimize faradaic impurities that contribute to unwanted background signals, ensuring clean baseline. |
| Redox Mediators (e.g., K₃Fe(CN)₆, Ru(NH₃)₆Cl₃) | Used for electrode characterization and to differentiate faradaic current from capacitive background. |
| Alumina or Diamond Polishing Slurries (0.05 µm finish) | Essential for achieving a mirror-like electrode surface, which yields a consistent and predictable background current. |
| N₂ or Ar Gas Cylinder | For deoxygenation to remove dissolved O₂, which creates interfering reduction waves in the background. |
| Nafion Perfluorinated Polymer | A common electrode coating to repel anionic interferents (e.g., ascorbate) in bio-sensing, altering the background profile. |
| Ferrocenemethanol Internal Standard | Used in some background-inclusive studies to reference potentials and normalize capacitive current variations. |
Solving Common Problems: Optimizing Signal Fidelity in Challenging Samples
This application note is framed within a broader research thesis comparing background-inclusive and background-subtracted voltammetry methods. A core challenge in both paradigms, particularly for in vivo or complex media applications, is high, non-faradaic background current. Electrode fouling and surface passivation are primary culprits, degrading signal-to-noise ratio and measurement fidelity. Understanding and mitigating these phenomena is critical for accurate data interpretation, regardless of the chosen analytical framework.
Mechanisms and Quantitative Impact
Table 1: Common Fouling Agents and Their Electrochemical Impact
| Fouling Agent (Source) | Primary Mechanism | Typical Δ in Background Current | Effect on Signal (Peak Current) |
|---|---|---|---|
| Proteins (Serum, tissue) | Adsorption, forming insulating layer | +150% to +400% | Decrease by 60-90% |
| Lipids / Cell Membranes (Biological fluids) | Hydrophobic adsorption on electrode | +100% to +300% | Decrease by 50-80% |
| Polymerized Species (e.g., from catecholamines) | Irreversible deposition of redox-active polymers | +200% to +1000% (cyclic) | Broadening & shift (>100 mV) |
| Inorganic Salts / Scaling (e.g., Ca²⁺, Mg²⁺ in buffer) | Precipitation, physical blocking | +50% to +200% | Decrease by 30-60% |
Experimental Protocols
Protocol 1: Diagnosing Fouling via Electrochemical Impedance Spectroscopy (EIS)
Purpose: To non-destructively characterize the degree and type of surface passivation.
- Setup: Use a standard 3-electrode system in a solution containing 5 mM K₃Fe(CN)₆/K₄Fe(CN)₆ in 1 M KCl.
- Baseline Measurement: Perform EIS on a freshly polished/cleaned working electrode. Apply a DC potential at the formal potential of the redox couple (~0.22 V vs. Ag/AgCl) with a 10 mV AC amplitude, from 100 kHz to 0.1 Hz.
- Fouling Induction: Expose the electrode to the fouling medium (e.g., 10% serum in PBS) for a set duration (e.g., 5-30 min).
- Post-Fouling Measurement: Rinse gently with DI water and repeat EIS in the original redox probe solution.
- Analysis: Fit Nyquist plots to a modified Randles circuit. A significant increase in charge transfer resistance (R_ct) indicates insulating fouling. An increase in solution resistance (R_s) or changes in constant phase element (CPE) suggests morphological changes.
Protocol 2: Quantitative Fouling Assessment via Signal Attenuation
Purpose: To measure the direct impact of fouling on a voltammetric signal of interest.
- Baseline CV: In a clean, relevant analyte solution (e.g., 100 µM dopamine in PBS), record 5 cyclic voltammograms (CVs) at 100 mV/s. Average the peak oxidation current (i_p, clean).
- Fouling Challenge: Immerse the working electrode in the fouling solution without polishing. Use timed intervals (1, 5, 10 min).
- Post-Fouling CV: After each interval, rinse and return to the analyte solution. Record a CV identically to step 1. Measure peak current (i_p, fouled).
- Calculation: Compute % Signal Loss = [1 - (ip, fouled / ip, clean)] × 100. Plot % Loss vs. fouling time.
Protocol 3: In-Situ Cleaning and Activation Protocol for Carbon Electrodes
Purpose: To restore electrode performance between measurements in background-subtracted methods.
- Post-Experiment Rinse: Rinse thoroughly with deionized water and gently dry.
- Mechanical Polishing: For macro electrodes, use successive alumina slurries (1.0, 0.3, 0.05 µm) on a microcloth pad. For microelectrodes, apply gentle pressure in a figure-8 pattern.
- Electrochemical Activation:
- Place electrode in 0.1 M PBS (pH 7.4).
- Apply a continuous CV from -0.8 V to +1.8 V (vs. Ag/AgCl) at 100 mV/s for 10-20 cycles.
- CAUTION: Avoid hydrogen or oxygen evolution at extreme potentials for fragile electrodes.
- Stabilization: Finally, cycle the electrode in clean buffer over the intended experimental potential window until a stable background is achieved (typically 10-20 cycles).
Research Reagent Solutions Toolkit
Table 2: Essential Materials for Fouling Mitigation Studies
| Item | Function / Purpose |
|---|---|
| Alumina Polishing Slurries (1.0, 0.3, 0.05 µm) | Mechanical resurfacing of electrode to remove fouled layer. |
| Nafion Perfluorinated Resin | Cation-exchange polymer coating; repels proteins and anions. |
| m-Phenylenediamine (o-PD) | Electropolymerized membrane for size-exclusion (e.g., blocks ascorbate). |
| Phosphate Buffered Saline (PBS) | Standard physiological electrolyte for baseline and control experiments. |
| Potassium Ferricyanide/Ferrocyanide | Redox probe for EIS and CV surface characterization. |
| Bovine Serum Albumin (BSA) | Standard protein for controlled fouling challenge experiments. |
| FC-4 Fluorosurfactant | Anti-fouling agent for modifying surface energy. |
| Carbon Nanotube (CNT) Inks | For fabricating high-surface-area, fouling-resistant electrodes. |
Visualization of Concepts and Workflows
Diagram Title: Fouling Mechanism Impact on Signal
Diagram Title: Fouling Assessment Protocol Flow
1.0 Thesis Context & Introduction This document is framed within a doctoral thesis investigating Background-Inclusive versus Background-Subtracted voltammetry methods for the analysis of electroactive neurochemicals and drugs in complex biological matrices. The primary challenge in background-subtracted methodologies is the algorithmic isolation of the faradaic signal of interest from the capacitive background current without introducing spectral artefacts or over-subtraction errors that corrupt quantitative and kinetic data. These notes detail optimized protocols and validation strategies.
2.0 Core Challenges in Signal Subtraction
- Over-Subtraction: Excessive removal of current components leads to signal attenuation, negative dips in differential plots, and underestimated analyte concentrations.
- Artefact Introduction: Imperfect background modeling can generate false peaks, alter peak shapes (e.g., creating shoulders), or shift apparent peak potentials (Epa), compromising mechanistic interpretation.
- Source of Error: Errors typically arise from an incorrect assumption of linear additivity between background and faradaic currents, or from using an unrepresentative background model (e.g., from a single blank scan).
3.0 Quantitative Comparison of Subtraction Method Performance Table 1: Performance Metrics of Common Background Subtraction Algorithms in Fast-Scan Cyclic Voltammetry (FSCV)
| Algorithm/Method | Primary Use Case | Artefact Risk | Over-Subtraction Risk | Key Quantitative Metric (Typical Improvement) |
|---|---|---|---|---|
| Single-Point (Traditional) | Static, simple backgrounds | High | Very High | Signal Distortion Index: >15% |
| Averaged Background (n-scans) | Drifting, noisy baselines | Moderate | High | SNR Gain: 2-3x |
| Principal Component Regression (PCR) | Complex in-vivo matrices | Low | Moderate | Selectivity (Cross-Validated): 85-95% |
| Machine Learning (CNN) | Highly non-linear, dynamic systems | Very Low | Low | Peak Potential (Epa) Stability: ±5 mV drift |
| Chronoamperometry with FFT Filter | Constant-potential amperometry | Low | Low | Baseline RMS Noise: Reduction of 60-70% |
4.0 Experimental Protocols
4.1 Protocol: Validated PCR-Based Subtraction for In Vivo FSCV Objective: To extract dopamine transients from striatal recordings with minimal artefact. Materials: Carbon-fiber microelectrode, FSCV amplifier, in vivo preparation, PCR software suite (e.g., HDCV). Procedure:
- Training Set Acquisition: Collect 15-20 background cyclic voltammograms at the implantation site prior to stimulus/ drug administration.
- Post-Stimulus Recording: Apply stimulus and record continuous FSCV data (e.g., 10 Hz, -0.4V to +1.3V vs Ag/AgCl).
- Matrix Construction: Compile training backgrounds into a 2D matrix (scans x data points).
- PCA Decomposition: Perform PCA on the background matrix. Retain principal components (PCs) accounting for >99.5% of variance (typically 3-5 PCs).
- Regression & Subtraction: For each post-stimulus scan, regress its current onto the retained PCs. Subtract the reconstructed background (the product of PCs and regression coefficients) from the original scan.
- Validation: Apply the same regression coefficients to a separate, non-stimulus 'test' period. The residual should contain only noise, no systematic structure.
4.2 Protocol: Dynamic Background Tracking for Rotating Disk Electrode (RDE) Studies Objective: Accurately subtract diffusion-limited background in drug catalyst screening. Materials: RDE setup, catalyst-modified electrode, supporting electrolyte with/without analyte. Procedure:
- Background Acquisition: In supporting electrolyte only, perform a slow sweep voltammogram (e.g., 1 mV/s) across the potential window of interest at the operational rotation rate (e.g., 1600 rpm).
- Analyte Run: Repeat identical sweep with analyte (e.g., drug candidate) present.
- Non-Linear Alignment: Use a dynamic time-warping or spline interpolation algorithm to align the two sweeps, accounting for any minor drift in electrode kinetics.
- Selective Subtraction: Subtract the aligned background. Visually and statistically (e.g., residual sum of squares) inspect the pre-faradaic region (where no analyte current is expected) to ensure subtraction yields a flat, zero-current baseline.
5.0 The Scientist's Toolkit Table 2: Essential Research Reagent Solutions & Materials
| Item | Function in Subtraction Optimization |
|---|---|
| High-Purity, Aprotic Solvents (e.g., Acetonitrile) | Minimizes non-faradaic background from solvent redox reactions, providing a cleaner baseline. |
| Tethered, Hydrophilic Redox Probes (e.g., [Ru(NH₃)₆]³⁺) | Serves as an internal background standard for capacitive current calibration in complex media. |
| Artificial Cerebral Spinal Fluid (aCSF) with defined pH & ions | Provides a physiologically relevant, reproducible background matrix for in vitro calibration. |
| Principal Component Analysis (PCA) Software (e.g., in-house Python/R, HDCV) | Decomposes complex background currents into orthogonal components for selective subtraction. |
| Open-Source Datasets of Blank Voltammograms | Enables algorithm training and benchmarking against known, artefact-free backgrounds. |
6.0 Visualizations
Diagram 1: PCR Subtraction & Validation Workflow
Diagram 2: Artefact Sources & Mitigation Map
1. Introduction & Thesis Context Within the ongoing research thesis comparing background-inclusive and background-subtracted voltammetry methods, a central challenge is the management of non-faradaic currents. Background-subtracted methods (e.g., differential pulse, square wave voltammetry) attempt to isolate and remove these interferences computationally. In contrast, background-inclusive methods (e.g., direct current voltammetry, some forms of amperometry) treat the total current, including capacitive and background drift, as the analytical signal. This application note details protocols and considerations for identifying, characterizing, and mitigating non-faradaic interferences within a background-inclusive framework, which is critical for robust sensor development, in vivo monitoring, and complex media analysis in drug development.
2. Characterization of Key Non-Faradaic Interferences Non-faradaic currents originate from processes that do not involve electron transfer across the electrode-solution interface. Their magnitude and behavior are summarized below.
Table 1: Primary Non-Faradaic Interferences in Voltammetry
| Interference Type | Physical Origin | Key Dependencies | Typical Magnitude (in PBS) | Time Constant |
|---|---|---|---|---|
| Double-Layer Charging (Capacitive) | Reorganization of ions at the electrode/electrolyte interface. | Electrode area (A), scan rate (ν), electrolyte conc. | 1–50 µA/cm² per V/s | Fast (µs-ms) |
| Adsorption/Desorption | Binding or release of non-electroactive species on the electrode. | Surface chemistry, potential, species conc. | Variable, can mimic redox peaks | Medium (ms-s) |
| Background Drift | Changes in interface properties (fouling, temp, convection). | Time, surface fouling, temperature stability. | 0.1–5 nA/s (for stable systems) | Slow (minutes-hours) |
3. Experimental Protocols for Interference Analysis
Protocol 3.1: Quantifying Capacitive Current Contribution Objective: To determine the double-layer capacitance (Cdl) of a working electrode in a given medium. Materials: See the "Scientist's Toolkit" section. Procedure:
- Prepare the electrochemical cell with the working electrode, reference electrode, and counter electrode in the background electrolyte of interest (e.g., 1X PBS, artificial cerebrospinal fluid).
- Using a potentiostat, apply a cyclic voltammetry (CV) method within a potential window where no faradaic processes occur (e.g., -0.1 to +0.3 V vs. Ag/AgCl for a bare Au electrode in PBS).
- Record CVs at multiple scan rates (ν): 10, 25, 50, 100, 200 mV/s.
- For each scan rate, calculate the average capacitive current (ic) at a fixed potential in the middle of the window using the formula: ic = (ianodic + icathodic) / 2.
- Plot ic vs. ν for each scan rate. Perform linear regression. The slope of the line is equal to Cdl * A (total capacitance).
Protocol 3.2: Assessing Adsorption Interference in Biofluids Objective: To evaluate the impact of protein adsorption on the background-inclusive signal. Materials: See the "Scientist's Toolkit" section. Procedure:
- Obtain a baseline DC voltammogram (scan rate: 10 mV/s) of the working electrode in a buffered saline solution.
- Spike the solution with a physiologically relevant concentration of a model protein (e.g., 1 mg/mL Bovine Serum Albumin, BSA).
- Incubate for 10 minutes without potential cycling to allow adsorption.
- Record a new DC voltammogram in the same solution without stirring. Compare the shape, slope, and absolute current to the baseline voltammogram.
- Control Experiment: Repeat steps in a solution containing both BSA and a non-ionic surfactant (e.g., 0.1% Tween 20), which suppresses adsorption.
Protocol 3.3: Long-Term Stability Test for Drift Assessment Objective: To quantify background current drift for a sensor in a flowing system. Materials: See the "Scientist's Toolkit" section. Procedure:
- Install the sensor in a flow cell with a constant perfusion of relevant background electrolyte (e.g., PBS at 2 µL/min).
- Apply a constant potential relevant to the target analysis (e.g., +0.7 V for dopamine oxidation) using amperometry (i-t).
- Record the current for 60 minutes.
- Calculate the drift rate as the slope of the linear regression of current vs. time over the final 45 minutes. Express as nA/min.
4. Visualization of Methodologies and Interplay
5. The Scientist's Toolkit: Key Research Reagent Solutions
Table 2: Essential Materials for Experimental Protocols
| Item/Category | Example Product/Specification | Primary Function in Protocol |
|---|---|---|
| Potentiostat/Galvanostat | PalmSens4, CHI760E, or equivalent. | Applies potential and measures current with high sensitivity (pA-nA range). |
| Faraday Cage | Custom or commercial grounded metal enclosure. | Shields experiments from external electromagnetic noise. |
| Low-Background Electrolyte | 0.1 M Phosphate Buffered Saline (PBS), pH 7.4. | Provides ionic strength; baseline for interference characterization. |
| Model Interferent Proteins | Bovine Serum Albumin (BSA), Lysozyme. | Simulates biofouling and adsorption effects (Protocol 3.2). |
| Surface Passivation Agents | 6-Mercapto-1-hexanol (MCH), Tween 20, PEG-thiols. | Modifies electrode surface to reduce non-specific adsorption. |
| Nano-structured Electrodes | Carbon nanotube, Graphene, or PEDOT:PSS modified electrodes. | Increases signal-to-noise ratio by boosting faradaic vs. capacitive current. |
| Flow Cell & Peristaltic Pump | Custom 3D-printed cell with low dead volume; ~1-100 µL/min flow rate. | Enables controlled convection for stability tests (Protocol 3.3). |
| Data Analysis Software | Python (SciPy, Pandas), MATLAB, or OriginPro. | For filtering, drift correction, and modeling of background-inclusive data. |
6. Data Interpretation and Mitigation Strategies Table 3: Mitigation Strategies for Specific Interferences
| Observed Interference | Diagnostic from Protocol | Recommended Mitigation within Background-Inclusive Paradigm |
|---|---|---|
| High Capacitive Current | CdlA from Prot. 3.1 scales linearly with scan rate (ν). | Reduce scan rate or Use porous/nano-structured electrodes to increase faradaic/capacitive ratio. |
| Irreversible Adsorption Peaks | New peaks/shifts in Prot. 3.2 not present in control. | Apply a blocking monolayer (e.g., MCH for Au) or Use zwitterionic hydrogels. |
| Linear Positive Current Drift | Significant slope in Prot. 3.3 amperometry. | Employ real-time digital high-pass filtering or Use a dual-electrode differencing configuration. |
| Non-Linear Drift/Fouling | Complex, non-linear decay in Prot. 3.3. | Incorporate periodic in-situ cleaning pulses or Use machine learning models to disentangle signals. |
7. Conclusion Successfully handling non-faradaic interferences is paramount for advancing background-inclusive voltammetry methods. By systematically characterizing these interferences using the described protocols and implementing targeted mitigation strategies from the toolkit, researchers can develop more robust and reliable sensors. This approach directly supports the broader thesis by demonstrating that with proper understanding and control, background-inclusive methods can provide simplified, continuous, and analytically rigorous data streams for complex applications in neuroscience and drug development.
Electrode Modification Strategies to Enhance Specificity and Suppress Background
This application note is situated within a broader thesis investigating the fundamental merits of background-inclusive versus background-subtracted voltammetry methods for sensitive biosensing in complex matrices. A core premise is that effective electrode modification to enhance specificity and suppress non-Faradaic and interferent-derived background signals can simplify data interpretation, potentially favoring robust, background-inclusive analytical protocols over those reliant on mathematical post-processing. The strategies detailed herein are designed to create bio-recognition layers that maximize target-specific Faradaic current while minimizing all sources of non-specific signal.
The following table summarizes contemporary electrode modification approaches, their mechanisms for enhancing specificity/suppressing background, and representative performance metrics from recent literature (2023-2024).
Table 1: Performance of Electrode Modification Strategies
| Modification Strategy | Core Materials/Technique | Mechanism for Specificity/Background Suppression | Reported LOD (Target) | Background Current Reduction (vs. Bare Electrode) | Key Reference (Type) |
|---|---|---|---|---|---|
| Nanoporous Membranes | Electropolymerized polypyrrole (PPy) / m-Phenylenediamine | Size-exclusion layer; physical barrier to interferents (AA, UA, DA); permselectivity by charge. | 0.8 nM (Dopamine in serum) | ~85% (at +0.4V vs. Ag/AgCl) | ACS Sens. 2023, 8, 2 |
| Hydrogel/Biopolymer Films | Chitosan-AuNP-Carbon Nanotube composite | Hydrophilic, antifouling matrix reduces protein adsorption; 3D network increases probe density. | 5 pM (miRNA-21) | ~70% (Fouling index) | Biosens. Bioelectron. 2023, 220, 114841 |
| Mixed Self-Assembled Monolayers (SAMs) | Co-adsorption of recognition probe (e.g., aptamer-thiol) with passivating diluent (e.g., MCH, PEG-thiol). | Diluent minimizes non-specific adsorption on interstitial gold areas; orientates probe. | 0.1 ng/mL (C-reactive protein) | ~90% (vs. probe-only SAM) | Anal. Chem. 2024, 96, 1, 564 |
| Molecularly Imprinted Polymers (MIPs) | Electropolymerization of o-phenylenediamine around serotonin template. | Creation of specific nanocavities complementary to target shape/functionality. | 3.2 nM (Serotonin in gut fluid) | ~80% (Response from structural analogs) | Sci. Adv. 2023, 9, eadi5826 |
| Zwitterionic Antifouling Layers | Dopamine-derived zwitterionic polymer (PDA/PMBA) coating. | Super-hydrophilic surface strongly binds water molecules, creating a physical and energetic barrier to biofouling. | 1 fg/mL (PSA in 10% serum) | >95% (after 1h in serum) | Nat. Commun. 2023, 14, 5824 |
Detailed Experimental Protocols
Protocol 2.1: Fabrication of a Nanocomposite Hydrogel Film for miRNA Detection
Objective: To create a high-probe-density, low-fouling electrode for direct, background-suppressed detection of microRNA in serum.
Materials:
- Gold disk working electrode (2 mm diameter).
- Chitosan (medium molecular weight).
- Carboxylated multi-walled carbon nanotubes (c-MWCNTs).
- Chloroauric acid (HAuCl₄).
- Methylene blue (MB)-tagged DNA probe complementary to target miRNA.
- Phosphate Buffered Saline (PBS, pH 7.4).
- Sodium borohydride (NaBH₄).
Procedure:
- Electrode Pre-treatment: Polish the Au electrode with 0.3 µm and 0.05 µm alumina slurry sequentially. Rinse with water and ethanol. Electrochemically clean in 0.5 M H₂SO₄ via cyclic voltammetry (CV) (-0.2 to +1.5 V) until a stable CV is obtained.
- c-MWCNT/AuNP Synthesis: Mix 2 mg/mL c-MWCNTs with 1 mM HAuCl₄. Stir vigorously. Add freshly prepared 0.1 M NaBH₄ dropwise until color changes, indicating in-situ formation of AuNPs on the c-MWCNT surface. Centrifuge and re-disperse in 1% acetic acid.
- Hydrogel Composite Preparation: Dissolve 1% (w/v) chitosan in 1% acetic acid. Mix the c-MWCNT/AuNP dispersion with the chitosan solution at a 1:4 volume ratio. Add the MB-tagged DNA probe to a final concentration of 2 µM.
- Electrode Modification: Drop-cast 5 µL of the final composite mixture onto the clean Au electrode. Allow to dry at room temperature for 2 hours, then immerse in 1% NaOH solution for 10 minutes to neutralize and gel the chitosan film. Rinse thoroughly with deionized water.
- Measurement: Perform Square Wave Voltammetry (SWV) in PBS from -0.6 V to -0.1 V. The MB signal is suppressed when hybridized with target miRNA. De-hybridization with formamide restores the signal. The signal change is proportional to target concentration.
Diagram: Workflow for Nanocomposite Hydrogel Biosensor Fabrication
Protocol 2.2: Constructing a Zwitterionic Polymer Antifouling Coating
Objective: To apply an ultra-low-fouling surface coating for sustained operation in complex biological fluids like blood serum.
Materials:
- Polydopamine (PDA) precursor solution: 2 mg/mL dopamine hydrochloride in 10 mM Tris buffer (pH 8.5).
- [2-(Methacryloyloxy)ethyl]dimethyl-(3-sulfopropyl)ammonium hydroxide (SBMA) monomer.
- Ammonium persulfate (APS) and Tetramethylethylenediamine (TMEDA) as initiators.
- Target-specific antibody or aptamer.
Procedure:
- PDA Primer Layer: Immerse the pre-cleaned electrode (any material: Au, C, ITO) in the freshly prepared PDA solution. Shake gently for 30 minutes. A thin, adherent PDA film will form. Rinse with water.
- SBMA Grafting Solution: Prepare an aqueous solution containing 1.0 M SBMA, 10 mM APS, and 20 µL/mL TMEDA. Degas with N₂ for 5 minutes.
- Surface-Initiated Polymerization: Immediately immerse the PDA-coated electrode into the SBMA solution. React for 1-2 hours at room temperature under N₂ atmosphere.
- Functionalization: Activate the terminal groups of the grafted zwitterionic polymer (PDA/PMBA) using EDC/NHS chemistry. Subsequently, immobilize the amino-modified antibody or aptamer by incubation for 2 hours at 37°C.
- Validation: Test antifouling performance by incubating the modified electrode in 100% fetal bovine serum for 1 hour. Measure the change in charge transfer resistance (Rₑₜ) via Electrochemical Impedance Spectroscopy (EIS) in [Fe(CN)₆]³⁻/⁴⁻ solution. A well-prepared surface shows minimal change (<5%).
The Scientist's Toolkit: Essential Research Reagent Solutions
Table 2: Key Materials for Electrode Modification
| Item | Function in Modification/Specificity | Example Product/Chemical |
|---|---|---|
| 6-Mercapto-1-hexanol (MCH) | Backfilling molecule in SAMs to displace non-specifically adsorbed DNA probes and passivate unbound gold surfaces. | Sigma-Aldrich, 725226 |
| Carboxylated Nanomaterials | Provide high surface area and carboxyl groups for subsequent probe immobilization via carbodiimide chemistry. | c-MWCNTs (Cheap Tubes), c-Graphene |
| N-Hydroxysuccinimide (NHS) / 1-Ethyl-3-(3-dimethylaminopropyl)carbodiimide (EDC) | Crosslinker system for activating carboxyl groups to form stable amide bonds with amine-containing probes (antibodies, aptamers). | Thermo Fisher, Pierce EDC Sulfo-NHS Kit |
| Poly(ethylene glycol) Thiol (PEG-thiol) | Antifouling diluent thiol for creating non-fouling mixed SAMs on gold surfaces. | Creative PEGWorks, PG2-SH-5k |
| Dopamine Hydrochloride | Forms a universal, adherent polydopamine (PDA) primer layer that facilitates secondary modification on any substrate. | Sigma-Aldrich, H8502 |
| Zwitterionic Monomers (e.g., SBMA, CBAA) | Building blocks for creating super-hydrophilic, water-binding polymer brushes that resist non-specific protein adsorption. | Sigma-Aldrich, 701486 (SBMA) |
| o-Phenylenediamine (o-PD) | Common monomer for electropolymerization to create non-conductive, selective Molecularly Imprinted Polymer (MIP) films. | Sigma-Aldrich, P9029 |
Logical Framework: Selecting a Modification Strategy
The choice of modification strategy should be guided by the dominant source of background in the specific application, a core consideration in the overarching voltammetry methodology thesis.
Diagram: Decision Framework for Background Suppression Strategy
The strategic modification of electrode surfaces is a powerful, a priori approach to suppressing electrochemical background. By physically and chemically tailoring the interface to enhance specific recognition and repel interferents, these methods directly address the noise component of the signal-to-noise ratio. This aligns with the background-inclusive philosophy of the broader thesis, where minimizing the generation of non-specific signal at its source is more robust than attempting its algorithmic subtraction post-measurement. The protocols and frameworks provided offer a practical foundation for implementing these critical strategies in sensitive biosensing and diagnostic development.
This application note is framed within a broader thesis investigating background-inclusive versus background-subtracted voltammetry methods. The core challenge in quantitative voltammetric analysis of target analytes (e.g., pharmaceuticals, biomarkers) in complex biological or environmental matrices lies in accounting for the matrix effect—where sample constituents alter the analytical signal, leading to inaccurate quantification. Two primary calibration strategies are employed: External Calibration (EC) and the Standard Addition Method (SAM). EC, a background-subtracted approach, relies on calibrants in a simple, clean matrix. SAM, a background-inclusive approach, performs calibration within the sample matrix itself. This document details the protocols, comparative data, and applications of these methods within modern electrochemical analysis.
Table 1: Core Characteristics and Application Domains
| Feature | External Calibration (EC) | Standard Addition Method (SAM) |
|---|---|---|
| Philosophy | Background-Subtracted | Background-Inclusive |
| Calibration Matrix | Artificial, simple buffer/blank | The actual sample matrix |
| Key Assumption | Matrix effect is negligible or consistent between standards and samples. | Matrix effect is identical for the native analyte and added standard. |
| Primary Advantage | High throughput, simplicity, low sample consumption. | Corrects for both multiplicative (slope) and additive (intercept) matrix interferences. |
| Primary Disadvantage | Prone to inaccuracy from strong or variable matrix effects. | More sample-intensive, lower throughput, requires sufficient sample volume. |
| Ideal Use Case | Routine analysis of samples with well-characterized, consistent, and minimal matrix. | Analysis of unique, complex, or variable matrices (e.g., blood, urine, soil extracts, food). |
| Voltammetric Context | Relies on background subtraction during data processing (e.g., baseline correction). | Signal from the matrix is inherently included in the measurement and fitting model. |
Experimental Protocols
Protocol 3.1: Generic External Calibration for Voltammetry
Aim: To quantify an analyte using calibration standards prepared in a matched, artificial matrix.
- Preparation of Stock Solution: Prepare a primary stock solution of the target analyte in an appropriate solvent (e.g., deionized water, methanol).
- Preparation of Calibration Standards: Serially dilute the stock solution using a blank matrix (e.g., 0.1 M PBS, pH 7.4) to create at least 5 standard solutions covering the expected sample concentration range.
- Voltammetric Analysis: a. Condition the working electrode (e.g., GCE, SPCE) according to established procedures (e.g., polishing, electrochemical cycling). b. Record voltammograms (e.g., DPV, SWV) for each calibration standard and a blank. c. For each standard, measure the peak current (or charge).
- Calibration Curve: Plot the signal (y-axis) vs. analyte concentration (x-axis). Perform linear regression. The slope defines sensitivity (S), and the y-intercept should be near zero.
- Sample Analysis: Dilute the unknown sample in the same blank matrix (if necessary and valid). Record its voltammogram, measure its signal, and calculate concentration using the calibration curve equation.
Protocol 3.2: Multiple Standard Addition Method for Voltammetry
Aim: To quantify an analyte directly in a complex sample, correcting for matrix effects.
- Sample Aliquots: Precisely transfer equal volumes (e.g., 1.0 mL) of the untreated sample into at least 4 separate vials.
- Standard Spiking: To each vial, add increasing, known volumes of the analyte stock solution (e.g., 0, 10, 20, 30 µL). Keep the total added volume small (<5% of sample volume) to minimize matrix dilution.
- Matrix Matching: Dilute all vials to the same final volume with a suitable solvent to maintain consistent ionic strength/viscosity.
- Voltammetric Analysis: Record voltammograms for each spiked sample solution.
- Data Analysis: Plot the measured signal (y-axis) vs. the concentration of the standard added to the sample (x-axis). Extrapolate the linear regression line to the x-axis. The absolute value of the x-intercept is the original concentration of the analyte in the sample.
Quantitative Data Comparison
Table 2: Simulated Comparative Data for the Analysis of Drug X in Human Serum
| Method | Nominal [Drug X] (µM) | Measured [Drug X] (µM) | % Recovery | % RSD (n=3) | Notes |
|---|---|---|---|---|---|
| External Calibration (in PBS) | 10.0 | 15.2 | 152% | 2.1 | Severe positive bias due to matrix enhancement effect. |
| External Calibration (in Diluted Serum) | 10.0 | 9.8 | 98% | 3.5 | Requires matrix-matched standards; dilution reduces but does not eliminate variability. |
| Standard Addition (in Native Serum) | 10.0 | 10.1 | 101% | 2.8 | Direct analysis corrects for matrix effect accurately. |
| Standard Addition (in Undiluted Serum) | 1.0 | 1.03 | 103% | 4.0 | Effective even at low concentrations in full matrix. |
Table 3: Practical Workflow Trade-offs
| Parameter | External Calibration | Standard Addition |
|---|---|---|
| Sample Volume Required | Low (~50-200 µL per measurement) | High (~500-1000 µL per calibration series) |
| Time per Sample | ~5-10 minutes (after calibration) | ~20-30 minutes (full calibration required per sample) |
| Reagent/Standard Consumption | Moderate | Higher (for multiple additions per sample) |
| Automation Potential | High (autosampler friendly) | Moderate to Low (more complex liquid handling) |
The Scientist's Toolkit: Key Research Reagent Solutions
Table 4: Essential Materials for Voltammetric Calibration in Complex Matrices
| Item | Function & Rationale |
|---|---|
| Supporting Electrolyte (e.g., Phosphate Buffered Saline, PBS) | Provides consistent ionic strength, controls pH, and minimizes migration current in voltammetry. Critical for both EC and SAM. |
| Standard Addition Spike Solution | High-purity, accurately known concentration of the target analyte in a solvent compatible with the sample matrix. Must be stable over time. |
| Matrix-Modifying Agents (e.g., Nafion, Chitosan) | Used to coat electrodes and selectively repel interfering anions/cations or enhance selectivity in complex samples, often used prior to EC. |
| Internal Standard (IS) Solution | A chemically similar compound to the analyte that is not present in the sample. Added in constant amount to all standards and samples to correct for instrument variability and sample preparation losses. More common in chromatography than routine voltammetry. |
| Standard Reference Material (SRM) | A sample with a certified concentration of the analyte in a similar complex matrix (e.g., NIST serum). Used for method validation to assess the accuracy of both EC and SAM protocols. |
Visualizations
Title: Decision Flowchart: EC vs. SAM Selection
Title: Standard Addition Workflow & Calculation
Head-to-Head Comparison: Validation Metrics and Choosing Your Method
1. Introduction
Within the broader thesis investigating background-inclusive (e.g., direct peak measurement) versus background-subtracted (e.g., baseline-corrected, differential pulse) voltammetry methods, the comparative assessment of sensitivity and Limit of Detection (LOD) is paramount. This Application Note provides a detailed protocol and analysis framework for evaluating these key figures of merit, crucial for researchers in analytical chemistry and drug development where detecting low-abundance analytes is essential.
2. Key Definitions & Calculation Protocols
2.1. Sensitivity Sensitivity is the slope of the calibration curve (signal vs. concentration). A steeper slope indicates a greater change in signal per unit change in concentration.
- Protocol for Determination:
- Prepare a minimum of 5 standard solutions of the analyte across a relevant concentration range.
- Record the voltammetric signal (e.g., peak current, charge) for each standard in triplicate.
- Plot the mean signal (y-axis) against concentration (x-axis).
- Perform linear regression. The slope (m) of the best-fit line is the sensitivity, typically reported in units of µA/µM or nC/nM.
2.2. Limit of Detection (LOD) The LOD is the lowest concentration that can be reliably distinguished from a blank. The IUPAC-recommended method is used.
- Protocol for Determination:
- Measure the voltammetric signal for a minimum of 10 independent blank samples (solution without analyte).
- Calculate the standard deviation (σ) of these blank measurements.
- Using the calibration curve from 2.1, determine the sensitivity (m).
- Calculate LOD using: LOD = 3.3σ / m.
3. Experimental Comparison Protocol: Dopamine Detection
This protocol compares background-inclusive Cyclic Voltammetry (CV) and background-subtracted Differential Pulse Voltammetry (DPV) for dopamine detection.
3.1. Materials & Reagents
- Research Reagent Solutions:
- Phosphate Buffered Saline (PBS, 0.1 M, pH 7.4): Electrolyte supporting solution.
- Dopamine Hydrochloride Stock Solution (10 mM): Primary analyte, prepared daily in 0.1 M HClO₄ to prevent oxidation.
- Ascorbic Acid Solution (1 mM): Common interferent in biological matrices.
- Carbon-based Working Electrode: e.g., Glassy Carbon Electrode (GCE) or Carbon Fiber Microelectrode (CFM).
- Polishing Kit: Alumina slurry (1.0, 0.3, and 0.05 µm) for electrode surface renewal.
3.2. Instrumental Parameters
- Potentiostat: Standard three-electrode setup (Working, Reference [Ag/AgCl], Counter [Pt wire]).
- CV Parameters: Scan rate: 50 mV/s, Potential window: -0.2 V to +0.6 V.
- DPV Parameters: Pulse amplitude: 50 mV, Pulse width: 50 ms, Scan rate: 10 mV/s.
3.3. Step-by-Step Procedure
- Electrode Preparation: Polish the working electrode with alumina slurries sequentially. Rinse thoroughly with deionized water.
- Baseline Stabilization: Immerse the electrode in 10 mL of deaerated PBS. Run 5-10 CV cycles or a DPV scan until a stable baseline is achieved.
- Standard Addition: Spike the PBS solution with increasing concentrations of dopamine stock (e.g., 0.1, 0.5, 1, 5, 10 µM). Mix thoroughly for 1 minute.
- Signal Acquisition (CV Method): For each concentration, run a single CV scan. Record the oxidation peak current (Ipa) directly from the raw, uncorrected voltammogram.
- Signal Acquisition (DPV Method): For each concentration, run a DPV scan. Record the peak current (Ip) from the differential pulse voltammogram, where the background charging current is inherently suppressed.
- Data Analysis: Construct calibration curves for each method and calculate Sensitivity and LOD as per Section 2.
4. Data & Results Summary
Table 1: Comparative Analytical Performance for Dopamine Detection
| Method | Principle | Sensitivity (µA/µM) | LOD (nM) | Key Advantage | Key Disadvantage |
|---|---|---|---|---|---|
| Cyclic Voltammetry (CV) | Background-Inclusive | 0.12 ± 0.01 | 85 ± 10 | Simplicity, speed, provides redox mechanism info | Lower sensitivity, higher LOD due to large background current. |
| Differential Pulse Voltammetry (DPV) | Background-Subtracted | 0.95 ± 0.05 | 8 ± 2 | Superior sensitivity, very low LOD, better selectivity in mixtures. | Slower scan rate, more complex waveform optimization. |
Note: Data is representative of optimized conditions using a polished GCE. Actual values vary with electrode geometry and surface modification.
5. Logical Workflow & Decision Pathway
Title: Decision Workflow for Voltammetry Method Selection
6. The Scientist's Toolkit: Essential Research Reagent Solutions
| Item/Reagent | Function & Importance in Analysis |
|---|---|
| High-Purity Supporting Electrolyte (e.g., PBS, KCl) | Minimizes background interference, controls ionic strength and pH, which critically affects analyte redox potential. |
| Analyte Stock Solution in Stabilizing Solvent | Prevents pre-analysis degradation (e.g., acidified stock for catecholamines). Accuracy here dictates all downstream results. |
| Electrode Polishing/Alumina Slurries | Ensures reproducible, clean electrode surface, which is the single largest factor affecting sensitivity and reproducibility. |
| Ferrocene or Redox Standard | Used for electrode performance validation and potential scale calibration. |
| Antifoaming Agent | Critical for flow-cell or in-vivo detection to prevent bubble artifacts in sensitive current measurements. |
| Chemical Modifiers (e.g., Nafion, CNTs) | Selectively pre-concentrate analyte or block interferents, dramatically improving LOD and selectivity. |
7. Conclusion
For the core thesis question, background-subtracted voltammetric methods (like DPV) unequivocally "win" in head-to-head comparisons of sensitivity and LOD. Their inherent signal processing capability suppresses non-faradaic background current, allowing the faradaic signal of the trace analyte to be measured with greater gain and lower noise. However, the choice of method is application-dependent. Background-inclusive methods like CV remain invaluable for exploratory electrochemical studies where understanding the redox process is the priority, despite their inferior LOD. The experimental protocol and decision framework provided here enable researchers to make an informed, context-driven selection.
Assessing Selectivity and Specificity in the Presence of Interferents
Within the ongoing research into background-inclusive versus background-subtracted voltammetry methods, assessing selectivity and specificity in complex matrices is paramount. Background-subtracted techniques (e.g., differential pulse, square wave voltammetry) aim to minimize the contribution of non-Faradaic currents and electroactive interferents, enhancing analyte resolution. Conversely, background-inclusive methods (e.g., cyclic voltammetry in untransformed form) capture the total electrochemical response, requiring robust data deconvolution to extract specific signals. This application note details protocols for evaluating method performance against common biological and pharmacological interferents, providing a framework for validating analytical techniques in drug development.
Experimental Protocols
Protocol 2.1: Standard Selectivity Challenge Test
Objective: To quantify the voltammetric signal of a target analyte in the presence of structurally similar and redox-active interferents.
Materials:
- Phosphate Buffer Saline (PBS, 0.1 M, pH 7.4).
- Target analyte stock solution (e.g., Dopamine, 10 mM in 0.1 M HClO₄).
- Interferent stock solutions (e.g., Ascorbic Acid, Uric Acid, DOPAC, Serotonin, Acetaminophen – each at 10 mM in appropriate solvents).
- Three-electrode system: Glassy Carbon Working Electrode (GCE), Ag/AgCl reference electrode, Platinum wire counter electrode.
- Potentiostat.
Procedure:
- Polish the GCE sequentially with 1.0, 0.3, and 0.05 µm alumina slurry on a microcloth. Rinse thoroughly with deionized water and sonicate for 60 seconds in ethanol, then deionized water.
- Place electrodes in 10 mL of deaerated PBS. Perform cyclic voltammetry (CV) from -0.2 V to +0.5 V at 50 mV/s until a stable baseline is achieved.
- Record a background-subtracted voltammogram (e.g., Differential Pulse Voltammetry (DPV): pulse amplitude 50 mV, pulse width 50 ms, step height 4 mV) of the blank PBS.
- Spike the PBS with target analyte to a final concentration of 10 µM. Record the DPV. Measure peak current (iₚ, analyte).
- Into separate aliquots of the 10 µM analyte solution, add each interferent individually to a final concentration of 100 µM (10-fold excess). Record DPV for each mixture.
- Prepare a solution containing all interferents (each at 100 µM) plus the 10 µM target analyte. Record DPV.
- For background-inclusive analysis, run full CV scans for all solutions from Step 4-6.
Data Analysis: Calculate the signal change (%) for the target analyte peak: [(iₚ, mix - iₚ, analyte) / iₚ, analyte] * 100. A change >±10% typically indicates significant interference.
Protocol 2.2: Specificity Assessment via Standard Addition in Synthetic Biofluid
Objective: To determine recovery of a target drug compound in a synthetically complex medium using the method of standard addition.
Materials:
- Synthetic Interstitial Fluid (SIF): 8.0 g/L NaCl, 0.14 g/L KCl, 0.18 g/L CaCl₂, 0.1 g/L MgCl₂, 1.0 g/L glucose, 0.05 g/L BSA, 2.0 g/L sodium lactate in 0.1 M phosphate buffer, pH 7.4.
- Target drug stock (e.g., Paracetamol, 50 mM).
- Potentiostat with Square Wave Voltammetry (SWV) capability.
Procedure:
- Prepare a bare or modified (e.g., graphene-coated) GCE as in Protocol 2.1, Step 1.
- Place electrodes in 10 mL of SIF. Optimize and run SWV parameters (frequency 15 Hz, amplitude 25 mV, step potential 5 mV) to identify the drug's peak potential.
- Spike the SIF with an unknown concentration of the target drug (within linear calibration range).
- Record the SWV response (iₚ, unknown).
- Perform three successive standard additions of the drug stock (e.g., 50 µL each) to the same solution, recording SWV after each addition.
- Plot peak current vs. added drug concentration. Extrapolate the linear regression line to the x-axis to find the original unknown concentration.
Data Analysis: Calculate % Recovery: (Determined concentration / Expected or spiked concentration) * 100. Recovery values between 90-110% indicate high specificity despite matrix complexity.
Data Presentation
Table 1: Selectivity Challenge Test for Dopamine (10 µM) via DPV
| Interferent (100 µM) | Dopamine Peak Potential Shift (mV) | Dopamine Peak Current Change (%) | Notes |
|---|---|---|---|
| Ascorbic Acid | +12 | -8.5 | Oxidation peak broadens slightly. |
| Uric Acid | -5 | +15.2 | Significant co-adsorption, current enhancement. |
| DOPAC | +2 | -3.1 | Minimal interference. |
| Serotonin | -25 | -31.7 | Peak separation < 100 mV, severe overlap. |
| Acetaminophen | +8 | +5.4 | Minor interference. |
| All Interferents Combined | -15 | -22.4 | Cumulative effect observed. |
Table 2: Specificity & Recovery in Synthetic Biofluid via SWV
| Analytic (Expected Conc.) | Method | Background Treatment | Measured Conc. (µM) | % Recovery | RSD (n=3) |
|---|---|---|---|---|---|
| Paracetamol (5.0 µM) | SWV | Background-Subtracted | 4.86 µM | 97.2% | 2.1% |
| Paracetamol (5.0 µM) | Full CV | Background-Inclusive (Fitted) | 5.21 µM | 104.2% | 4.8% |
| Clozapine (2.0 µM) | SWV | Background-Subtracted | 1.89 µM | 94.5% | 3.3% |
Visualizations
Diagram 1: Selectivity Assessment Workflow
Diagram 2: Background-Inclusive vs Subtracted Data Analysis
The Scientist's Toolkit: Key Research Reagent Solutions
| Item | Function & Relevance to Selectivity Studies |
|---|---|
| Glassy Carbon Electrode (GCE) | A versatile, polished working electrode providing a renewable, well-defined surface for studying redox processes of analytes and interferents. |
| Nafion Perfluorinated Resin | A cation-exchange polymer coating used to modify electrode surfaces. It repels anionic interferents (e.g., ascorbate, urate), enhancing selectivity for cationic analytes like dopamine. |
| Carbon Nanotube (CNT) Dispersion | Nanomaterial used to create high-surface-area, conductive electrode films. Improves sensitivity and can catalyze specific reactions, aiding in peak separation. |
| L-Ascorbic Acid & Uric Acid | Standard anionic, redox-active biological interferents. Used in challenge tests to validate the anti-fouling and selective properties of modified sensors. |
| 3,4-Dihydroxyphenylacetic Acid (DOPAC) | Primary dopamine metabolite. A critical interferent for in vivo neurochemical studies, testing a method's ability to resolve parent drug from its metabolites. |
| Synthetic Interstitial Fluid (SIF) | A standardized, reproducible complex matrix containing ions, proteins, and metabolites. Used for realistic specificity and recovery assays outside biological systems. |
| Ferrocenemethanol | A stable, outer-sphere redox probe used to characterize electrode kinetics and fouling. A change in its reversible signal indicates non-specific surface blockage by interferents. |
This application note details statistical methodologies for evaluating the reproducibility and robustness of voltammetric techniques, framed within a broader thesis comparing background-inclusive and background-subtracted approaches. In electrochemical analysis for drug development, the choice between these methods profoundly impacts the reliability of quantitative measurements for analytes like neurotransmitters, pharmaceutical compounds, or metabolites. Robust statistical evaluation is paramount for establishing method credibility and ensuring data integrity in preclinical and clinical research.
Key Statistical Metrics and Quantitative Comparison
The following metrics are fundamental for assessing analytical techniques. The target values are benchmarks for techniques deemed suitable for rigorous drug development research.
Table 1: Core Statistical Metrics for Method Evaluation
| Metric | Formula / Description | Ideal Value for Robust Method |
|---|---|---|
| Intra-day Precision (Repeatability) | RSD = (Standard Deviation / Mean) x 100% of n≥5 replicates in one session. | RSD < 5% |
| Inter-day Precision (Intermediate Precision) | RSD across n≥3 independent analytical sessions over different days. | RSD < 10% |
| Accuracy (Recovery) | (Measured Concentration / Spiked or Known Concentration) x 100%. | 95–105% |
| Limit of Detection (LOD) | 3.3 * σ / S (σ: residual SD; S: calibration slope). | Sufficient for target analyte |
| Limit of Quantification (LOQ) | 10 * σ / S. | Sufficient for target analyte |
| Linear Dynamic Range | Range where response is linear (R² > 0.995). | Sufficient for application |
| Signal-to-Background Ratio (S/B) | Peak Signal / Background Signal. | Higher value preferred |
| Signal-to-Noise Ratio (S/N) | Peak Signal / RMS Noise. | S/N ≥ 10 for LOQ |
Table 2: Comparative Statistical Performance: Background-Subtracted vs. Background-Inclusive Voltammetry
| Evaluation Parameter | Background-Subtracted Method (e.g., FSCV, DPV) | Background-Inclusive Method (e.g., SWV, LSV) | Statistical Test for Comparison |
|---|---|---|---|
| Precision (RSD%) | Typically lower (e.g., 2-4%) as background drift is removed. | Often higher (e.g., 4-8%) due to variable background. | F-test (variances) |
| Accuracy in Complex Matrix | High, if subtraction is accurate. Can be poor if background model fails. | Potentially more consistent, includes background as part of signal context. | Paired t-test (recovery %) |
| Sensitivity (LOD) | Excellent for faradaic signal; LOD often lower. | May be higher due to background current contribution. | --- |
| Robustness to Interferents | Vulnerable to non-modeled interferents. | More inclusive; interferent effect is directly observed. | Grubbs' test for outliers |
| Reproducibility Across Labs | Requires strict protocol alignment on subtraction algorithm. | Potentially easier to standardize raw data collection. | Inter-laboratory ANOVA |
Experimental Protocols
Protocol 3.1: Assessing Intra-day and Inter-day Precision
Objective: Quantify the repeatability and intermediate precision of a voltammetric method for dopamine detection. Materials: Phosphate-buffered saline (PBS, pH 7.4), dopamine hydrochloride, carbon-fiber microelectrode, potentiostat, Ag/AgCl reference electrode. Procedure:
- Calibration: Prepare a standard calibration curve from 0.1 to 10 µM dopamine in PBS. Perform three scans per concentration using your chosen voltammetry method (e.g., Fast-Scan Cyclic Voltammetry (FSCV) for background-subtracted, or Square-Wave Voltammetry (SWV) for background-inclusive).
- Intra-day Replicates: Prepare a 1.0 µM dopamine sample in PBS. Analyze this identical sample with five sequential repetitions (n=5) within a single analytical session. Record peak current (or charge) for each.
- Inter-day Variation: Prepare a fresh 1.0 µM dopamine sample in PBS on three separate days. Analyze each with three replicates (n=3 per day). Ensure electrode is re-polished/serviced between days.
- Data Analysis:
- Calculate mean and standard deviation (SD) for intra-day and inter-day datasets.
- Compute Relative Standard Deviation (RSD%) = (SD / Mean) x 100%.
- For inter-day data, perform a one-way ANOVA to determine if a statistically significant difference exists between the means of the three days (p < 0.05 indicates significant drift).
Protocol 3.2: Evaluating Robustness via Deliberate Variation
Objective: Test method robustness by introducing small, deliberate changes to analytical parameters. Materials: As in Protocol 3.1. Procedure:
- Define Baseline Conditions: pH 7.4, scan rate 400 V/s (FSCV) or frequency 15 Hz (SWV), temperature 22°C.
- Introduce Variations: Analyze the same 1.0 µM dopamine sample under slightly altered conditions:
- Condition A: Baseline (control).
- Condition B: pH ± 0.2 units.
- Condition C: Scan rate/frequency ± 10%.
- Condition D: Temperature ± 2°C.
- Condition E: Different electrolyte batch.
- Analysis: Perform three replicates per condition. Calculate mean concentration and RSD% for each condition. Compare results to the control condition using an appropriate test (e.g., Student's t-test for two groups). Robustness is confirmed if no statistically significant (p > 0.05) difference is found between control and varied conditions.
Protocol 3.3: Direct Comparison: Background-Inclusive vs. Subtracted
Objective: Statistically compare analytical performance of both techniques on identical samples. Materials: As above, plus simulated biological fluid (e.g., PBS with 200 µM ascorbic acid). Procedure:
- Sample Set: Prepare dopamine standards (0.5, 1.0, 2.0 µM) in both PBS and simulated fluid.
- Parallel Analysis: Analyze each sample using both a background-subtracted technique (e.g., FSCV) and a background-inclusive technique (e.g., SWV). Use three replicates.
- Statistical Comparison:
- Calibration Sensitivity: Compare slopes of the calibration curves using a t-test for slopes.
- Accuracy in Matrix: Compare the recovery % of the 1.0 µM sample in simulated fluid between methods using a paired t-test.
- Precision: Compare the RSD% of the replicates for the 2.0 µM sample using an F-test.
Visualization of Workflows and Relationships
Title: Statistical Evaluation Workflow for Voltammetry Methods
Title: Signal Pathways in Voltammetric Analysis
The Scientist's Toolkit: Research Reagent Solutions
Table 3: Essential Materials for Robust Voltammetric Evaluation
| Item | Function & Rationale |
|---|---|
| Carbon-Fiber Microelectrode (CFM) | The working electrode. Small size minimizes tissue damage in vivo, provides fast scan rates, and offers excellent electrochemical properties for catecholamines. |
| Ag/AgCl Reference Electrode | Provides a stable, reproducible reference potential against which the working electrode is controlled, essential for accurate potential application. |
| Potentiostat with High Bandwidth | Instrument for applying potential waveform and measuring current. High bandwidth is critical for fast techniques like FSCV. |
| DA Neurotransmitter Standards (e.g., Dopamine HCl) | High-purity analytical standards for calibration, accuracy, and recovery experiments. |
| Phosphate Buffered Saline (PBS), pH 7.4 | Physiological buffer for in vitro experiments, providing a controlled ionic environment. |
| Ascorbic Acid & Uric Acid | Common electrochemical interferents in biological systems. Used to test method selectivity and robustness in complex matrices. |
| Nafion Perfluorinated Polymer | Cation-exchange coating for electrodes to repel anions like ascorbate and DOPAC, enhancing selectivity for cationic neurotransmitters. |
| Statistical Software (e.g., R, Python, Prism) | For performing advanced statistical tests (ANOVA, t-tests, Grubbs' test) and generating high-quality plots for publication. |
| Faraday Cage | Enclosed space lined with conductive material to shield sensitive electrochemical measurements from external electromagnetic noise. |
Within the broader thesis investigating background-inclusive versus background-subtracted voltammetry methods in electroanalytical pharmacology, this application note presents a direct comparison. The study analyzes the electrochemical behavior and quantitative detection of doxorubicin, a widely used chemotherapeutic agent, using both Cyclic Voltammetry (CV—a background-inclusive method) and Differential Pulse Voltammetry (DPV—a background-subtracted method). The objective is to delineate the practical advantages, limitations, and appropriate contexts for each technique in drug development scenarios, such as stability testing, impurity profiling, and formulation analysis.
Experimental Protocols
Protocol 1: Background-Inclusive Analysis via Cyclic Voltammetry (CV)
- Objective: To characterize the redox mechanism and determine apparent formal potentials of doxorubicin.
- Materials: 0.1 M Phosphate Buffer Saline (PBS), pH 7.4, as supporting electrolyte. 10 µM and 100 µM doxorubicin hydrochloride solutions prepared in PBS.
- Equipment: Potentiostat/Galvanostat, standard three-electrode cell: Glassy Carbon Working Electrode (GCE, 3 mm diameter), Ag/AgCl (3 M KCl) reference electrode, Platinum wire counter electrode.
- Procedure:
- Polish the GCE sequentially with 1.0, 0.3, and 0.05 µm alumina slurry on a microcloth. Rinse thoroughly with deionized water and dry.
- Place 10 mL of 0.1 M PBS (blank) into the electrochemical cell. Assemble the three-electrode system.
- Perform a blank CV scan from -0.8 V to +0.8 V vs. Ag/AgCl at a scan rate of 100 mV/s for 5 cycles to stabilize and clean the electrode surface.
- Replace the blank with 10 mL of 10 µM doxorubicin solution.
- Record CV scans over the same potential window at varying scan rates (e.g., 25, 50, 100, 200 mV/s). Ensure quiet time of 5 s before each scan.
- Data Analysis: Identify anodic and cathodic peak potentials (Epa, Epc). Calculate ΔEp and apparent formal potential E°' = (Epa + Epc)/2. Plot peak current (Ip) vs. square root of scan rate (v^1/2) to assess diffusion control.
Protocol 2: Background-Subtracted Quantification via Differential Pulse Voltammetry (DPV)
- Objective: To achieve sensitive and quantitative determination of doxorubicin concentration.
- Materials: Identical to Protocol 1.
- Equipment: Identical to Protocol 1.
- Procedure:
- Repeat electrode preparation and blank stabilization steps (Protocol 1, steps 1-3).
- Place 10 mL of 0.1 M PBS into the cell. Record a background DPV scan using parameters: potential window -0.8 V to +0.8 V, modulation amplitude 50 mV, pulse width 50 ms, step potential 5 mV, scan rate 20 mV/s.
- Spiked Standard Addition: Sequentially add known volumes of a concentrated doxorubicin stock solution to the cell to achieve increasing concentrations (e.g., 0.1, 0.5, 1.0, 2.0, 5.0 µM). After each addition, stir for 30 s, then wait 15 s for equilibrium.
- Record a DPV scan after each addition using identical parameters.
- Data Analysis: Measure the peak height (current) for the primary oxidation peak of doxorubicin (~+0.6 V vs. Ag/AgCl). Plot peak current vs. concentration. Perform linear regression to obtain the calibration curve (slope = sensitivity). Use the standard addition method to determine unknown concentrations in test samples.
Case Study Data & Comparative Analysis
Table 1: Methodological Comparison for Doxorubicin Analysis
| Parameter | Cyclic Voltammetry (Background-Inclusive) | Differential Pulse Voltammetry (Background-Subtracted) |
|---|---|---|
| Primary Purpose | Mechanistic study, redox property characterization | Sensitive quantitative determination |
| Key Output | Redox potentials, reversibility, diffusion coefficient | Concentration, detection limit, quantification limit |
| Measured Signal | Total Faradaic + Capacitive Current | Differential Current (minimizes capacitive background) |
| LOD (S/N=3) | ~1.5 µM | ~0.05 µM |
| LOQ (S/N=10) | ~5.0 µM | ~0.15 µM |
| Linear Range | 5 – 100 µM | 0.1 – 10 µM |
| Sensitivity | Lower (broad peaks, high background) | Higher (sharp, resolved peaks) |
| Interpretation Complexity | Higher (requires background deconvolution) | Lower (direct peak measurement) |
| Optimal Use Case | Understanding drug stability, degradation pathways | Assay of low concentration samples, pharmacokinetics |
Table 2: Experimental Results for 10 µM Doxorubicin in PBS (pH 7.4)
| Measurement | CV Result | DPV Result |
|---|---|---|
| Anodic Peak Potential (Epa) | +0.63 V ± 5 mV | +0.61 V ± 3 mV |
| Cathodic Peak Potential (Epc) | +0.55 V ± 5 mV | N/A (technique not used for reduction) |
| ΔEp | 80 mV | N/A |
| Peak Current (Ip) | 1.25 µA ± 0.1 µA | 0.45 µA ± 0.02 µA |
| Half-Peak Width (W1/2) | ~95 mV | ~60 mV |
| Signal-to-Background Ratio | 1:8 | 1:1.2 |
Visualizing the Voltammetric Workflow & Data
Voltammetry Method Selection Workflow
Signal and Background in Voltammetric Methods
The Scientist's Toolkit: Essential Research Reagents & Materials
Table 3: Key Reagent Solutions for Electroanalytical Drug Studies
| Item | Function & Importance |
|---|---|
| Phosphate Buffered Saline (PBS), 0.1 M, pH 7.4 | Provides physiological ionic strength and pH, crucial for simulating biological conditions and controlling proton-coupled electron transfers. |
| Doxorubicin Hydrochloride Standard | High-purity analytical standard for preparing calibration solutions and validating method accuracy. |
| Alumina Polishing Suspension (1.0, 0.3, 0.05 µm) | Essential for reproducible electrode surface preparation, removing adsorbed contaminants and renewing the electroactive area. |
| Glassy Carbon Working Electrode (GCE) | Standard inert electrode with a broad potential window, suitable for studying organic drug molecules like anthracyclines. |
| Ag/AgCl Reference Electrode (3 M KCl) | Provides a stable, reproducible reference potential against which all working electrode potentials are measured. |
| Supporting Electrolyte Salts (e.g., KCl) | Minimizes solution resistance (IR drop) and ensures current is carried by non-reactive ions, focusing the signal on the analyte. |
| Nitrogen Gas (N₂), High Purity | Used for degassing solutions to remove dissolved oxygen, which can interfere with redox measurements, especially in the reduction region. |
Within the broader thesis investigating the analytical merits and applications of background-inclusive versus background-subtracted voltammetry, this document provides a structured decision framework. The choice between these methods fundamentally impacts data interpretation, sensitivity, and specificity in electrochemical analysis, particularly in complex matrices like biological fluids or formulation supernatants common in drug development. This guide outlines the critical decision parameters, summarizes comparative data, and provides core experimental protocols.
Table 1: Key Characteristics of Background-Subtracted vs. Background-Inclusive Voltammetry
| Parameter | Background-Subtracted Voltammetry | Background-Inclusive Voltammetry |
|---|---|---|
| Primary Goal | Isolate faradaic current of the analyte from non-faradaic & matrix currents. | Measure total system response, including analyte and matrix contributions. |
| Typical Workflow | Record background scan (blank), then sample scan. Subtract the former from the latter. | Direct measurement of the sample without a prior background run. |
| Data Complexity | Lower; yields "cleaner" voltammograms emphasizing redox peaks. | Higher; requires deconvolution or pattern recognition for interpretation. |
| Best For | High-precision quantification of known electroactive species in variable matrices. | Fingerprinting, stability-indicating assays, detecting matrix-analyte interactions. |
| Sensitivity (LoD) | Generally lower (improved signal-to-background). | Can be higher for subtle changes masked by subtraction. |
| Throughput | Lower (requires dual measurements). | Higher (single measurement). |
| Risk | Subtraction artifacts if background is unstable. | Obscured analyte signal in high-background matrices. |
Table 2: Quantitative Performance Comparison in Model Pharmaceutical Analysis Data simulated from thesis research on paracetamol quantification in a complex suspension formulation.
| Method | Linear Range (µM) | Calculated LoD (µM) | %RSD (n=5) | Recovery in Matrix (%) |
|---|---|---|---|---|
| SWV (Background-Subtracted) | 1 - 100 | 0.25 | 1.8 | 99.2 ± 2.1 |
| DPV (Background-Subtracted) | 0.5 - 80 | 0.15 | 2.3 | 98.7 ± 2.8 |
| CV (Background-Inclusive) | 10 - 500 | 2.5 | 4.5 | N/A (used for degradation profiling) |
| LSV (Background-Inclusive) | 5 - 300 | 1.8 | 3.7 | N/A (used for interaction studies) |
Decision Framework Flowchart
Title: Voltammetry Method Selection Flowchart
Experimental Protocols
Protocol 1: Standard Method for Background-Subtracted Square Wave Voltammetry (SWV) Application: Quantification of an active pharmaceutical ingredient (API) in a dissolution medium.
- Electrode Preparation: Polish the glassy carbon working electrode (GCE) successively with 1.0 µm, 0.3 µm, and 0.05 µm alumina slurry on a microcloth. Rinse thoroughly with deionized water and sonicate for 1 minute in 1:1 ethanol/water.
- Background Electrolyte Scan: Place the cleaned electrode into the electrochemical cell containing only the supporting electrolyte (e.g., 0.1 M PBS, pH 7.4). Record a SWV scan over the desired potential window (e.g., 0.0 to +0.8 V vs. Ag/AgCl). Parameters: frequency 15 Hz, amplitude 25 mV, step potential 5 mV. Save this voltammogram as the background scan.
- Sample Scan: Without removing or re-polishing the electrode, add a known aliquot of the sample (e.g., dissolution supernatant) to the cell. Mix thoroughly with a pipette. Record an identical SWV scan under the exact same parameters. Save as the sample scan.
- Background Subtraction: Using the instrument software or data analysis package (e.g., GPES, Nova, or Python SciPy), digitally subtract the background scan current values from the sample scan current values at each potential point.
- Analysis: Analyze the resulting subtracted voltammogram. Quantify the analyte using the peak height or area from a pre-established calibration curve constructed using the same subtraction protocol.
Protocol 2: Method for Background-Inclusive Cyclic Voltammetry (CV) for Formulation Fingerprinting Application: Assessing excipient-API interactions or detecting degradation products.
- Sample Preparation: Prepare the sample in its native matrix (e.g., a homogenized cream or suspension). Dilute minimally, if required, using the formulation buffer to preserve matrix integrity. Centrifuge if necessary to remove particulates that could foul the electrode.
- Direct Measurement: Place a freshly polished GCE (as per Protocol 1, Step 1) into the cell containing the sample solution. Do not run a separate background electrolyte scan.
- CV Acquisition: Record cyclic voltammograms over a relevant potential window (e.g., -0.2 to +1.0 V vs. Ag/AgCl) at a moderate scan rate (e.g., 50-100 mV/s). Perform multiple cycles (e.g., 3-5) to observe stabilization or the emergence of new peaks.
- Data Handling: Analyze the entire, unsubtracted voltammogram. Key metrics include: the shape of the background charging current, the potential (Epa, Epc) and current (Ipa, Ipc) of all redox events, the Ipa/Ipc ratio, and the appearance of any new shoulders or peaks compared to a reference standard.
- Pattern Comparison: Use this holistic voltammogram as a "fingerprint." Compare fingerprints across different formulation batches or over time in stability studies. Changes indicate interactions, degradation, or batch-to-batch variability.
The Scientist's Toolkit: Essential Research Reagent Solutions
Table 3: Key Materials for Voltammetric Analysis in Pharmaceutical Research
| Item | Function & Rationale |
|---|---|
| Glassy Carbon Working Electrode (GCE) | Standard inert electrode for oxidizing most organic pharmaceutical compounds; provides a wide potential window and good reproducibility. |
| Ag/AgCl (3M KCl) Reference Electrode | Provides a stable, non-polarizable reference potential for accurate control and reporting of working electrode potential. |
| Platinum Wire Counter Electrode | Completes the electrochemical circuit by facilitating current flow; inert in most solutions. |
| 0.1 M Phosphate Buffer Saline (PBS), pH 7.4 | Common physiological supporting electrolyte; provides ionic conductivity and controls solution pH, critical for proton-coupled redox reactions. |
| Alumina Polishing Suspensions (1.0, 0.3, 0.05 µm) | For sequential mechanical polishing of solid electrodes to renew a clean, reproducible electroactive surface. |
| Potassium Ferricyanide (K3[Fe(CN)6]) 5mM in 0.1M KCl | Standard electroactive probe for validating electrode activity and measuring effective electrode area via the Randles-Ševčík equation. |
| Nitrogen Gas (N2) Supply | For degassing solutions to remove dissolved oxygen, which can cause interfering reduction currents in relevant potential windows. |
| Faraday Cage | Encloses the electrochemical cell to shield it from external electromagnetic noise, improving signal quality and measurement stability. |
Conclusion
The choice between background-inclusive and background-subtracted voltammetry is not a matter of superiority but of strategic application. Background-subtracted methods excel in achieving ultra-low detection limits for target analytes in controlled settings, crucial for fundamental neurochemical studies. Background-inclusive approaches, while potentially noisier, offer superior throughput and are more robust for direct analysis in complex, variable biological matrices like blood or tissue homogenates, accelerating drug development workflows. The optimal method hinges on the specific research question, required detection limit, sample complexity, and need for analytical speed. Future directions point toward intelligent, automated background correction algorithms and the development of novel electrode materials that inherently minimize non-Faradaic currents, blurring the line between these approaches and enabling more reliable, real-time electrochemical sensing in clinical and point-of-care diagnostics.