Anodic Stripping Voltammetry vs. Polarography: A Modern Guide for Trace Metal Analysis in Biomedical Research
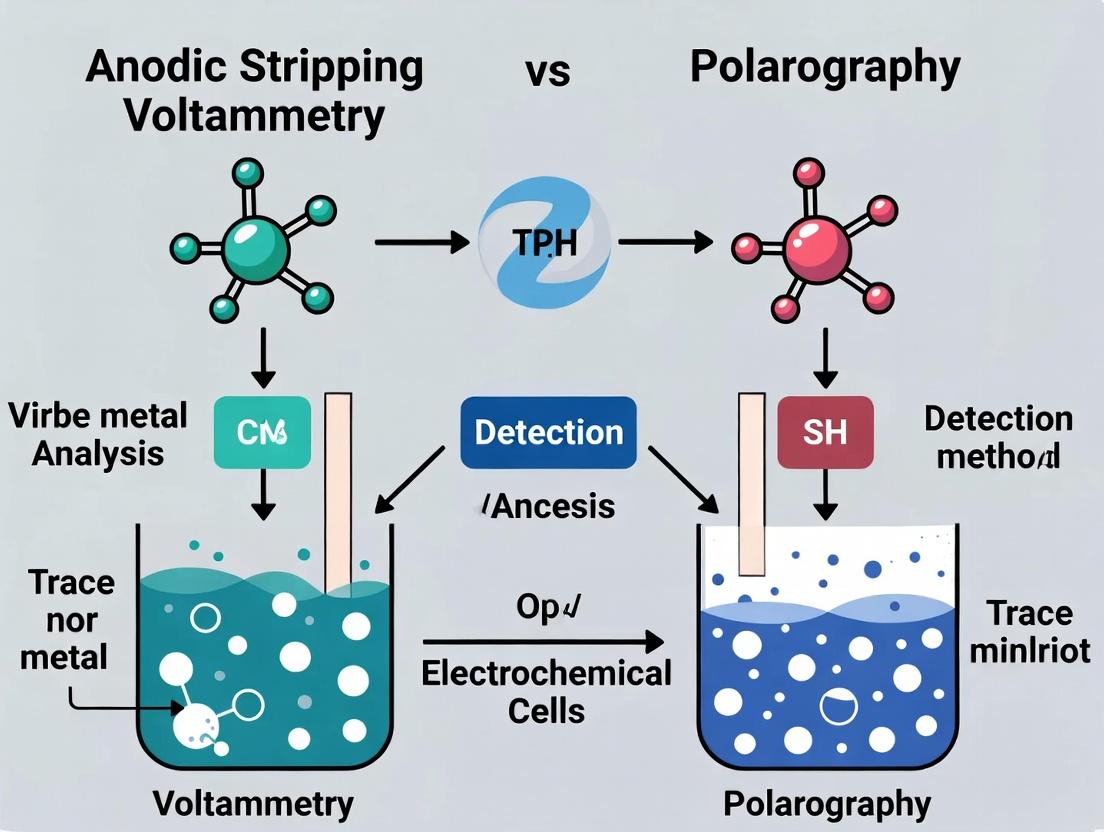
This comprehensive guide compares two foundational electroanalytical techniques—Anodic Stripping Voltammetry (ASV) and Polarography—for the trace and ultratrace determination of metals critical to drug development and biomedical research.
Anodic Stripping Voltammetry vs. Polarography: A Modern Guide for Trace Metal Analysis in Biomedical Research
Abstract
This comprehensive guide compares two foundational electroanalytical techniques—Anodic Stripping Voltammetry (ASV) and Polarography—for the trace and ultratrace determination of metals critical to drug development and biomedical research. We explore their fundamental principles, modern methodological adaptations, and practical applications in analyzing metals in pharmaceuticals, biological fluids, and environmental samples. The article provides a detailed troubleshooting framework, optimization strategies for sensitivity and selectivity, and a critical comparative analysis to guide researchers in selecting and validating the optimal technique for their specific analytical challenges in compliance with contemporary regulatory standards.
Understanding the Core Principles: How ASV and Polarography Detect Trace Metals
Within the context of a thesis comparing Anodic Stripping Voltammetry (ASV) and Polarography for trace metals research, this primer establishes the fundamental principles. Both techniques are subsets of voltammetry, where current is measured as a function of applied potential, but they differ significantly in sensitivity, application, and methodology. This document provides application notes, detailed protocols, and comparative data to guide researchers in selecting the appropriate method for ultratrace metal analysis in environmental monitoring, pharmaceutical development, and clinical research.
Core Principles and Comparative Framework
Voltammetry encompasses electroanalytical techniques using a three-electrode system. Polarography, the historical predecessor, uses a dropping mercury electrode (DME). ASV, a more modern and sensitive technique, employs a stationary mercury or solid electrode and involves a preconcentration step.
Table 1: Fundamental Comparison of Polarography and Anodic Stripping Voltammetry
| Parameter | Classical DC Polarography | Anodic Stripping Voltammetry (ASV) |
|---|---|---|
| Primary Electrode | Dropping Mercury Electrode (DME) | Stationary Hg (film or drop) or Solid Electrodes |
| Key Process | Reduction of metal ions during potential scan | 1. Preconcentration (reduction & amalgamation). 2. Stripping (re-oxidation) |
| Typical Detection Limit | 10⁻⁵ to 10⁻⁶ M (~1 ppm) | 10⁻⁹ to 10⁻¹¹ M (~0.1 ppb) |
| Key Advantage | Wide potential window, renewable surface | Exceptional sensitivity due to preconcentration |
| Key Disadvantage | Lower sensitivity, capacitive current from DME | Longer analysis time, more complex optimization |
| Ideal For | Qualitative analysis, fundamental studies | Quantitative trace/ultratrace metal analysis |
Experimental Protocols
Protocol 1: Standard Method for Differential Pulse Polarography (DPP) of Trace Metals
Objective: Determine the concentration of Cd²⁺ and Pb²⁺ in a simulated water sample.
Materials & Reagents:
- Supporting Electrolyte: 0.1 M Acetate buffer (pH 4.5). Provides constant ionic strength and pH.
- Oxygen Scavenger: High-purity Nitrogen gas (>99.99%). Deaerates solution to remove interfering O₂.
- Standard Solutions: 1000 ppm stock solutions of Cd²⁺ and Pb²⁺ for standard addition.
- Working Electrode: Dropping Mercury Electrode (DME).
- Reference Electrode: Saturated Calomel Electrode (SCE) or Ag/AgCl (3M KCl).
- Counter Electrode: Platinum wire.
Procedure:
- Solution Preparation: Transfer 25 mL of 0.1 M acetate buffer to the electrochemical cell. Add an aliquot of the sample.
- Deaeration: Bubble nitrogen gas through the solution for at least 10 minutes to remove dissolved oxygen. Maintain a nitrogen blanket over the solution during measurement.
- Instrument Setup: Configure the potentiostat for Differential Pulse Polarography mode. Typical parameters: initial potential = -0.1 V, final potential = -1.0 V vs. SCE; pulse amplitude = 50 mV; pulse duration = 50 ms; drop time = 0.5 s.
- Baseline Run: Record a polarogram of the supporting electrolyte alone.
- Sample Run: Record the polarogram of the sample. Note peak potentials (E_p): Cd ~ -0.6 V, Pb ~ -0.4 V vs. SCE.
- Standard Addition: Add known, small aliquots of Cd²⁺ and Pb²⁺ standard solutions. Record a polarogram after each addition.
- Data Analysis: Plot peak current (height) vs. standard concentration. Extrapolate to the x-intercept to determine the original sample concentration.
Protocol 2: Anodic Stripping Voltammetry (ASV) using a Thin Mercury Film Electrode (MFE)
Objective: Ultratrace determination of Zn²⁺, Cd²⁺, Pb²⁺, and Cu²⁺ in a pharmaceutical buffer.
Materials & Reagents:
- Electrode Substrate: Glassy Carbon Electrode (GCE). Polished to a mirror finish (0.05 µm alumina).
- Mercury Film Source: 500 ppm Hg²⁺ solution in 0.1 M HNO₃. Forms the amalgam film in situ.
- Supporting Electrolyte: 0.1 M HCl. Common for simultaneous multi-metal analysis.
- Oxygen Scavenger: High-purity Nitrogen or Argon gas.
- Standard Solutions: Appropriate low-concentration stock solutions for standard addition.
Procedure:
- Electrode Preparation: Polish the GCE sequentially with 1.0 µm and 0.05 µm alumina slurry on a microcloth. Rinse thoroughly with deionized water.
- Mercury Film Plating: Place the polished GCE into a cell containing the supporting electrolyte and Hg²⁺ solution. Stir vigorously. Apply a deposition potential of -1.0 V vs. Ag/AgCl for 60-300 s to co-deposit a thin Hg film and any target metals present.
- Analysis Step Preparation: Transfer the plated electrode to the sample cell containing 0.1 M HCl and the unknown sample. Decorate with nitrogen for 10 min.
- Preconcentration (Deposition): Under stirred conditions, apply a deposition potential (e.g., -1.2 V vs. Ag/AgCl) for a precise time (60-600 s). Metals are reduced and concentrated into the Hg film.
- Equilibration: Stop stirring and allow the solution to become quiescent for 15 seconds.
- Stripping (Quantification): Initiate a positive potential scan (e.g., -1.2 V to +0.1 V) using a sensitive waveform (e.g., Square Wave ASV). Parameters: frequency 25 Hz, amplitude 25 mV, step potential 5 mV. Record the current.
- Peak Identification & Quantification: Identify metals by characteristic stripping potentials. Use the method of standard additions (as in Protocol 1, Step 6 & 7) for quantification.
Visualization of Techniques
Diagram 1: Voltammetry Technique Decision Workflow
Diagram 2: The Three-Step ASV Measurement Cycle
The Scientist's Toolkit: Essential Research Reagents & Materials
Table 2: Key Materials for Voltammetric Trace Metal Analysis
| Item | Primary Function in Experiment | Critical Notes for Trace Analysis |
|---|---|---|
| High-Purity Supporting Electrolyte | Carries current, fixes pH/ionic strength, can complex analytes. | Must be ultrapure (e.g., Merck Suprapur) to minimize blank contributions. |
| Mercury (for Electrodes) | Forms amalgams with metals, provides renewable surface (DME) or film (ASV). | Use triple-distilled grade. Handling requires strict safety protocols. |
| Oxygen Scavenger Gas (N₂/Ar) | Removes dissolved O₂, which causes interfering reduction currents. | Must be >99.99% pure; use in-line scrubbers for final purification. |
| Standard Addition Stocks | For calibration via the method of standard additions, which compensates for matrix effects. | Prepare daily from certified stock solutions in acidic, metal-free containers. |
| Electrode Polishing Supplies | Maintains reproducible electrode surface activity (for GCE, Pt). | Alumina or diamond suspensions (1.0, 0.3, 0.05 µm). Follow consistent routine. |
| Metal-Free Labware | Sample containers, cells, pipettes. | Soak in >10% HNO₃ (v/v) for 48 hours, rinse with 18.2 MΩ·cm water. |
Quantitative Performance Data
Table 3: Comparative Analytical Figures of Merit for Trace Metal Detection
| Metal Ion | Technique | Typical Detection Limit (M) | Linear Dynamic Range (M) | Common Interferences |
|---|---|---|---|---|
| Cadmium (Cd²⁺) | DC Polarography | 5.0 x 10⁻⁷ | 1.0 x 10⁻⁶ to 1.0 x 10⁻⁴ | Zn²⁺, Tl⁺, high Cu²⁺ |
| DPP | 5.0 x 10⁻⁸ | 1.0 x 10⁻⁷ to 1.0 x 10⁻⁵ | As above, but less affected | |
| ASV (Hg-film) | 2.0 x 10⁻¹⁰ | 5.0 x 10⁻¹⁰ to 1.0 x 10⁻⁷ | Intermetallic compound with Cu/Zn | |
| Lead (Pb²⁺) | DC Polarography | 1.0 x 10⁻⁶ | 2.0 x 10⁻⁶ to 2.0 x 10⁻⁴ | Sn²⁺, Tl⁺ |
| DPP | 1.0 x 10⁻⁸ | 5.0 x 10⁻⁸ to 5.0 x 10⁻⁶ | As above | |
| ASV (Hg-film) | 5.0 x 10⁻¹¹ | 1.0 x 10⁻¹⁰ to 1.0 x 10⁻⁷ | Intermetallic with Cu, Bi | |
| Zinc (Zn²⁺) | DC Polarography | Not feasible in air (O₂ interference) | - | - |
| ASV (Hg-film) | 1.0 x 10⁻⁹ | 5.0 x 10⁻⁹ to 1.0 x 10⁻⁶ | Intermetallic with Ni, Cu |
This primer delineates the operational foundations of polarography and ASV. For a thesis focused on trace metals research, the data unequivocally demonstrates that ASV, with its preconcentration step, offers orders of magnitude superior sensitivity (sub-ppb) compared to classical polarography, making it the indispensable tool for modern ultratrace analysis. However, polarographic methods retain value for fundamental studies of redox processes. The choice of technique is dictated by the required detection limit, sample matrix, and the specific research question in pharmaceutical or environmental science.
Application Notes
Polarography, founded on the Dropping Mercury Electrode (DME), remains a cornerstone of electrochemical analysis. Within the context of comparing Anodic Stripping Voltammetry (ASV) and polarography for trace metal analysis, the evolution of polarographic techniques offers distinct advantages and limitations. ASV typically provides lower detection limits (often sub-ppb) due to the pre-concentration step, while classical DC polarography offers detection limits in the ~10⁻⁵ M range. However, modern polarographic variations bridge this gap significantly.
The key application of modern polarography is in the analysis of electroactive species in pharmaceutical development, including active pharmaceutical ingredients (APIs), impurities, and metal catalysts in drug substances. Its ability to handle complex matrices with minimal pretreatment is a significant advantage over some ASV protocols.
Table 1: Comparison of Polarographic Techniques & ASV for Trace Metal Analysis
| Technique | Typical Detection Limit (for Metals) | Key Advantage | Primary Limitation | Best For |
|---|---|---|---|---|
| DC Polarography (DME) | ~10⁻⁵ - 10⁻⁶ M | Simplicity, renewable surface, good reproducibility. | Low sensitivity, capacitive current interference. | Redox potential determination. |
| Differential Pulse Polarography (DPP) | ~10⁻⁷ - 10⁻⁸ M | High sensitivity, excellent resolution of peaks. | Slower than DC. | Trace analysis in pharmaceuticals, environmental samples. |
| Square Wave Polarography (SWP) | ~10⁻⁸ M | Very fast, extremely sensitive, effective background suppression. | More complex instrumentation. | Ultra-trace analysis, kinetic studies. |
| Anodic Stripping Voltammetry (on HMDE/Thin Film) | ~10⁻⁹ - 10⁻¹¹ M | Exceptional sensitivity for amalgam-forming metals. | Requires pre-concentration time, prone to intermetallic compounds. | Ultra-trace metals in water, biological fluids. |
Table 2: Recent Representative Applications in Drug Development
| Analyte | Matrix | Technique Used | Key Finding | Reference (Type) |
|---|---|---|---|---|
| Antibiotic Drug (Furazolidone) | Pharmaceutical Formulation | SW-Adsorptive Cathodic Stripping Polarography | Achieved LOD of 2.1 × 10⁻¹⁰ M, suitable for quality control. | Journal of Electroanal. Chem., 2023 |
| Trace Metal Impurities (Pb²⁺, Cd²⁺) | Active Pharmaceutical Ingredient (API) | DPP on SMDE | Quantified metals below ICH Q3D Option 1 limits without digestion. | ACS Pharmacol. & Transl. Sci., 2022 |
| Anticancer Platinum Complexes | Serum Simulant | Adsorptive Stripping Polarography | Monitored drug degradation kinetics with high sensitivity. | Bioelectrochemistry, 2023 |
Experimental Protocols
Protocol 1: Differential Pulse Polarography (DPP) Determination of Trace Lead and Cadmium in an API
Objective: To quantify trace levels of Pb²⁺ and Cd²⁺ in a powdered drug substance without exhaustive digestion. Principle: Metal ions are reduced and form amalgams at a hanging mercury drop electrode (HMDE). The differential pulse waveform minimizes capacitive current, enhancing the faradaic peak current.
Materials & Reagents:
- Supporting Electrolyte: 0.1 M Ammonium Acetate buffer (pH 4.5). Provides consistent ionic strength and pH.
- Complexing Agent: 0.01 M Sodium Diethyldithiocarbamate (NaDDTC). Forms adsorbable complexes with metals, enabling adsorptive stripping if pre-concentration is needed.
- Standard Solutions: 1000 mg/L stock solutions of Pb²⁺ and Cd²⁺ in 2% HNO₃. Diluted daily.
- API Sample: High-purity drug substance powder.
- Oxygen Scavenger: High-purity Nitrogen or Argon gas.
Procedure:
- Sample Preparation: Accurately weigh 100 mg of API into a 50 mL volumetric flask. Dissolve in 30 mL of the ammonium acetate buffer. Sonicate if necessary. Dilute to mark with buffer.
- Deaeration: Transfer 10 mL of the sample solution to the polarographic cell. Purge with nitrogen gas for at least 10 minutes to remove dissolved oxygen.
- Instrument Setup: Configure the polarograph/voltammeter.
- Working Electrode: Static Mercury Drop Electrode (SMDE) or HMDE.
- Mode: Differential Pulse.
- Parameters: Pulse amplitude: 50 mV; Pulse time: 50 ms; Scan rate: 5 mV/s; Initial potential: -0.2 V; Final potential: -1.0 V.
- Blank Run: Record a polarogram of the blank (sample solution).
- Standard Addition: Perform at least three successive standard additions (e.g., 50 µL, 100 µL, 150 µL) of a mixed Cd²⁺/Pb²⁺ standard solution (e.g., 10 mg/L). Deaerate for 1 min after each addition.
- Quantification: Measure peak currents at approximately -0.45 V (Cd) and -0.55 V (Pb). Plot peak current vs. standard addition concentration. Extrapolate to determine original concentration in the sample.
Protocol 2: Square-Wave Polarographic (SWP) Assay of a Nitro-Group Containing API
Objective: To directly determine the concentration of an electroactive API (containing an reducible nitro group) in tablet formulation. Principle: The nitro group undergoes a multi-electron reduction at the DME. Square-wave voltammetry's rapid scanning and efficient background suppression yield sharp, sensitive peaks.
Procedure:
- Stock Solution: Crush and homogenize 10 tablets. Weigh an equivalent of one tablet, extract into 100 mL of methanol/0.04 M BR buffer (pH 7.0) (1:1 v/v) via sonication for 15 min. Filter.
- Deaeration: Place 10 mL of filtrate in the cell, deaerate for 8 min with N₂.
- Instrument Setup:
- Electrode: DME (drop time: 0.5 s).
- Mode: Square-Wave Polarography.
- Parameters: Frequency: 50 Hz; Step potential: 2 mV; Amplitude: 25 mV; Initial potential: 0.0 V; Final potential: -1.2 V.
- Calibration: Run SW polarograms for a series of standard API solutions in the same matrix. Record the reduction peak current (typically between -0.6 to -1.0 V).
- Analysis: Measure the peak current for the sample solution and calculate the API content from the linear calibration curve.
The Scientist's Toolkit: Key Research Reagent Solutions
| Item | Function in Polarographic Analysis |
|---|---|
| High-Purity Mercury | The essential material for the Dropping Mercury Electrode (DME) or static mercury drop. Must be double-distilled to avoid trace metal contamination. |
| Supporting Electrolyte (e.g., KCl, Acetate Buffer) | Suppresses migration current, provides a conductive medium, and can control pH to optimize the half-wave potential (E₁/₂) of the analyte. |
| Oxygen Scavenger (N₂/Ar Gas) | Removes dissolved oxygen, which produces two large, interfering reduction waves (~ -0.1 V and ~ -0.9 V vs. SCE). Critical for trace analysis. |
| Maximum Suppressor (e.g., Triton X-100) | A surface-active agent added in tiny amounts (0.001-0.01%) to suppress polarographic maxima—irregular current increases that distort waves. |
| Standard Addition Stocks | Precise, acidified aqueous standards of target analytes (e.g., metal ions, organic molecules) for the method of standard additions, which compensates for matrix effects. |
| pH Buffer Solutions (BR, Acetate, Ammonia) | Essential for analytes whose reduction potential is pH-dependent. Buffers ensure reproducible half-wave potentials and prevent hydrogen wave interference. |
Diagrams
Diagram Title: Evolution of Polarographic Techniques from DME
Diagram Title: DPP Trace Metal in API Protocol Workflow
Within the broader thesis comparing Anodic Stripping Voltammetry (ASV) and Polarography for trace metals research, the defining advantage of ASV lies in its preconcentration step via electrodeposition. This step selectively accumulates target metal ions onto the working electrode, reducing detection limits by 2-3 orders of magnitude compared to direct polarographic methods. This application note details the protocols and quantitative data underpinning this critical advantage, designed for researchers and pharmaceutical scientists engaged in ultra-trace metal analysis in drug substances and environmental monitoring.
Core Principle & Quantitative Comparison
Electrodeposition applies a controlled negative potential to reduce target metal ions (Mⁿ⁺) to their metallic state (M⁰) onto the electrode surface. This is followed by anodic stripping where the metal is re-oxidized, generating a measurable current peak. The table below contrasts key performance metrics with Polarography.
Table 1: ASV vs. Classical DC Polarography for Trace Metal Analysis
| Parameter | Anodic Stripping Voltammetry (with Electrodeposition) | Classical DC Polarography |
|---|---|---|
| Typical Detection Limit | 0.1 – 1.0 µg/L (ppb) | 50 – 100 µg/L (ppb) |
| Preconcentration Factor | 100 – 1000x | Not Applicable |
| Typical Analysis Time | 3 – 10 minutes (incl. deposition) | 1 – 3 minutes |
| Interference Susceptibility | Moderate (managed by choice of electrode & potential) | High (e.g., overlapping polarographic waves) |
| Primary Electrode | Static Mercury Drop (SMDE), Hg Film, or Bismuth/Carbon | Dropping Mercury Electrode (DME) |
| Key Advantage | Extreme sensitivity for trace/ultra-trace analysis. | Rapid screening, study of metal complexes. |
Detailed Experimental Protocol: ASV for Lead and Cadmium in Buffered Solution
This protocol outlines the determination of trace Cd(II) and Pb(II) using a mercury film electrode.
Materials & Reagents (The Scientist's Toolkit)
Table 2: Essential Research Reagent Solutions
| Item | Function & Specification |
|---|---|
| Supporting Electrolyte | 0.1 M Acetate Buffer (pH 4.6). Minimizes migration current, fixes pH, complexes interfering ions. |
| Metal Ion Standard Solutions | 1000 mg/L stock solutions of Cd²⁺ and Pb²⁺ in 2% HNO₃. Used for calibration and spiking. |
| Mercury(II) Nitrate Solution | 100 mg/L Hg²⁺. Forms the in-situ mercury film on the glassy carbon working electrode. |
| Oxygen-Free Nitrogen Gas | High-purity grade. For deaeration of solution to remove dissolved O₂, which interferes. |
| Glassy Carbon Working Electrode | Polished to a mirror finish. Substrate for mercury film formation and metal deposition. |
| Electrochemical Cell | 10-20 mL volume, with ports for Working, Reference (Ag/AgCl), and Counter (Pt wire) electrodes. |
Step-by-Step Procedure
- Electrode Preparation: Polish the glassy carbon electrode with 0.05 µm alumina slurry on a microcloth, rinse thoroughly with deionized water.
- Solution Preparation: In the electrochemical cell, add 10 mL of 0.1 M acetate buffer and 100 µL of 100 mg/L Hg(NO₃)₂ solution.
- Deaeration: Purge the solution with nitrogen gas for 8-10 minutes. Maintain a nitrogen blanket over the solution during analysis.
- Mercury Film Formation (Plating): Apply a potential of -1.0 V vs. Ag/AgCl for 60 seconds with stirring to co-deposit the mercury film.
- Sample Addition & Deposition: Add an aliquot of the sample/standard solution. Under stirred conditions, apply a deposition potential of -1.2 V vs. Ag/AgCl for a precise time (e.g., 120 seconds). Target metals (Cd, Pb) are reduced and amalgamated into the Hg film.
- Equilibration: Stop stirring and allow the solution to become quiescent for 15 seconds.
- Stripping Scan: Initiate a positive-going potential scan from -1.2 V to -0.1 V using Differential Pulse Voltammetry (DPV) mode (pulse amplitude 50 mV, step potential 5 mV). Record the current.
- Peak Identification & Quantification: Identify Cd and Pb stripping peaks at approximately -0.8 V and -0.5 V, respectively. Use standard addition method for quantification.
Visualization of Workflow and Interference Management
Diagram 1: ASV Workflow and Interference Control Logic
Diagram 2: Electrode Choices for ASV Preconcentration
The electrodeposition preconcentration step is the cornerstone of ASV's superior sensitivity over polarography for trace metals. By integrating optimized protocols, appropriate choice of working electrode, and interference management strategies as detailed, researchers can reliably achieve detection at the parts-per-billion level, a requirement in rigorous pharmaceutical quality control and environmental research.
Within trace metals research, analytical technique selection is critical. Anodic Stripping Voltammetry (ASV) and Polarography are foundational electrochemical methods. For biomedical analysis of Zn, Cu, Pb, Cd, Hg, and Pt-group drugs, ASV is often preferred due to its superior sensitivity (nanomolar to picomolar detection limits) achieved through a preconcentration step. This application note details protocols for quantifying these metals in biological matrices using ASV, framed within the thesis that ASV offers enhanced sensitivity and speciation capability over classical polarography for complex biomedical samples.
Table 1: Key Metals in Biomedicine - Roles, Toxicity, and Analytical Targets
| Metal | Biological Role / Use | Toxicological Concern / Challenge | Typical Conc. in Serum (Healthy) | ASV Detection Limit (in buffer) |
|---|---|---|---|---|
| Zn | Enzyme cofactor, immune function | Deficiency & excess disrupt homeostasis | 12-18 µM | ~0.1 µg/L (1.5 nM) |
| Cu | Redox enzyme cofactor (e.g., Cytochrome c oxidase) | Wilson's disease, oxidative stress | 12-22 µM | ~0.2 µg/L (3 nM) |
| Pb | None (non-essential) | Neurotoxin, cardiovascular effects | <0.1 µg/dL (<5 nM) | ~0.05 µg/L (0.2 nM) |
| Cd | None (non-essential) | Carcinogen, nephrotoxin | <0.1 µg/L (<1 nM) | ~0.02 µg/L (0.2 nM) |
| Hg | None (non-essential) | Neurotoxin (especially MeHg) | <1 µg/L (<5 nM) | ~0.1 µg/L (0.5 nM) |
| Pt (as Cisplatin) | Chemotherapeutic drug (DNA binding) | Nephrotoxicity, drug level monitoring | Therapeutic: ~1-10 µM (post-infusion) | ~0.5 µg/L (2.5 nM) |
Application Notes & Protocols
Protocol 1: ASV Determination of Zn, Cu, Cd, Pb, and Hg in Serum Ultrafiltrate
Objective: Simultaneous trace-level quantification of essential and toxic metals in the bioavailable fraction.
Research Reagent Solutions & Materials:
| Item | Function |
|---|---|
| Screen-printed Carbon Electrode (SPCE) with Bi-film | Disposable sensor; Bismuth film provides a non-toxic amalgam for metal deposition. |
| 0.1 M Acetate Buffer (pH 4.5) | Supporting electrolyte; optimal pH for deposition of target metals. |
| 400 ppb Bi(III) stock solution | In situ bismuth film formation. |
| Standard stock solutions (1000 ppm) of Zn, Cu, Cd, Pb, Hg | For calibration. |
| Centrifugal Ultrafiltration Device (10 kDa MWCO) | Separates low-molecular-weight, bioavailable metal fraction from serum proteins. |
| 0.1 M HNO₃ (trace metal grade) | Diluent and cleaning solution. |
| Nitrogen Gas (N₂) | For deaeration to remove dissolved oxygen. |
Detailed Methodology:
- Sample Prep: Dilute 500 µL of human serum with 500 µL of 0.1 M acetate buffer (pH 4.5). Load into a 10 kDa centrifugal filter. Centrifuge at 14,000 × g for 20 min at 4°C. Collect the ultrafiltrate.
- Electrode Pretreatment: Apply a conditioning potential of +0.6 V for 30 s to the SPCE in clean acetate buffer.
- Bismuth Film Plating: Mix 1 mL of ultrafiltrate with 50 µL of 400 ppb Bi(III) solution. Deposition potential: -1.4 V vs. Ag/AgCl reference. Deposition time: 180 s with stirring.
- Stripping Scan: After a 10 s equilibration period, run a square-wave anodic stripping scan from -1.4 V to +0.3 V. Parameters: Frequency 25 Hz, step potential 4 mV, amplitude 25 mV.
- Calibration & Quantification: Spike the sample matrix with increasing concentrations of standard metals. Use standard addition method to plot peak current (µA) vs. concentration (µg/L). Analyze via linear regression.
Protocol 2: Quantification of Pt from Pt-group Anti-cancer Drugs in Plasma
Objective: Therapeutic drug monitoring of cisplatin or carboplatin.
Detailed Methodology:
- Sample Digestion: Mix 200 µL of plasma with 200 µL of concentrated trace-metal-grade HCl. Heat at 70°C for 1 hour to digest proteins and release protein-bound Pt. Cool and dilute to 5 mL with ultrapure water. Adjust final pH to 2.0 using NaOH.
- Electrode System: Use a rotating glassy carbon disc working electrode (vs. Ag/AgCl, Pt counter).
- Deposition: Deposition potential: -1.0 V. Deposition time: 300 s with electrode rotation. This reduces Pt(II) to Pt(0) on the electrode surface.
- Stripping Scan: Perform a differential pulse anodic stripping scan from -0.8 V to +1.2 V. Pt oxidizes at ~+0.6 V. Parameters: Pulse amplitude 50 mV, pulse width 50 ms.
- Analysis: Use the method of standard additions in a matched, digested plasma matrix to account for complex matrix effects.
Visualizations
Title: ASV Advantages for Biomedical Metal Analysis
Title: ASV Workflow for Biological Samples
Within the analytical framework of a thesis comparing Anodic Stripping Voltammetry (ASV) and Polarography for trace metals research, a rigorous understanding of three critical parameters—Limit of Detection (LOD), Sensitivity, and Resolution—is paramount. This document provides detailed application notes and protocols to guide researchers in quantifying and optimizing these parameters, ensuring reliable data for applications ranging from environmental monitoring to pharmaceutical impurity analysis.
Defining Core Parameters: A Comparative Table
Table 1: Definitions and Key Equations for Critical Parameters
| Parameter | Formal Definition | Typical Equation (Electrochemical Context) | Primary Influence in ASV vs. Polarography |
|---|---|---|---|
| Limit of Detection (LOD) | The lowest concentration of analyte that can be reliably distinguished from the background noise. | ( LOD = \frac{3 \times \sigma_{blank}}{S} ) where (\sigma) is std. dev. of blank, (S) is calibration slope. | ASV: Enhanced by pre-concentration step; can reach sub-ppb. Polarography: Limited by capacitive current; typically higher LOD. |
| Sensitivity | The change in signal per unit change in analyte concentration (calibration slope). | ( S = \frac{dI}{dC} ) where (I) is signal current, (C) is concentration. | ASV: Very high due to signal amplification from stripping. Polarography: Governed by Ilkovič equation; moderate sensitivity. |
| Resolution | The ability to distinguish between two adjacent peaks (e.g., different metal species). | ( \Delta E_{p} \approx \frac{0.059}{n} \, V ) (at 25°C) for reversible systems. | ASV: Can suffer from intermetallic compound formation. Polarography: Good for distinct half-wave potentials. |
Experimental Protocols
Protocol 3.1: Determining LOD and Sensitivity for Cd²⁺ via ASV
Objective: To establish the calibration curve, sensitivity, and LOD for trace Cadmium using a Mercury Film Electrode (MFE) in ASV.
Materials: See "The Scientist's Toolkit" below.
Procedure:
- Electrode Preparation: Polish the glassy carbon working electrode (GCE) with 0.05 µm alumina slurry on a microcloth. Rinse thoroughly with deionized water.
- Mercury Film Deposition: Deoxygenate the supporting electrolyte (0.1 M acetate buffer, pH 4.6) with N₂ for 10 min. Deposit a Hg film by holding the GCE at -1.0 V vs. Ag/AgCl in a solution containing 20 mg/L Hg(NO₃)₂ for 300 s with stirring.
- Pre-concentration & Stripping: a. Transfer the electrode to the sample cell containing the deoxygenated standard Cd²⁺ solution in supporting electrolyte. b. Apply a deposition potential of -1.2 V vs. Ag/AgCl for a fixed time (e.g., 120 s) with constant stirring. c. After a 15 s equilibration period without stirring, perform an anodic potential sweep from -1.2 V to -0.2 V using Square Wave Voltammetry (SWV) parameters: frequency 25 Hz, amplitude 25 mV, step potential 5 mV.
- Calibration: Repeat Step 3 for a series of standard Cd²⁺ solutions (e.g., 0.5, 1, 2, 5, 10 µg/L). Measure the peak current (I_p) at approximately -0.65 V.
- Data Analysis:
- Plot I_p (µA) vs. concentration (µg/L). Perform linear regression; the slope is the experimental Sensitivity (µA/µg/L).
- Run 10 replicates of a blank (supporting electrolyte only). Calculate the standard deviation (σ) of the blank signal.
- Calculate ( LOD = \frac{3 \times \sigma}{Slope} ).
Protocol 3.2: Assessing Resolution for Pb²⁺ and In³⁺ via Differential Pulse Polarography (DPP)
Objective: To evaluate the resolution between two metals with similar reduction potentials using DPP.
Materials: See "The Scientist's Toolkit" below.
Procedure:
- Cell Setup: Use a dropping mercury electrode (DME) as the working electrode. Fill the reservoir with triple-distilled Hg. Use a Pt counter electrode and Ag/AgCl (3M KCl) reference.
- Solution Preparation: Prepare a deoxygenated supporting electrolyte of 0.1 M HCl. Prepare individual 10 mg/L standard solutions of Pb²⁺ and In³⁺.
- DPP Parameter Setup: Set DPP parameters: pulse amplitude 50 mV, pulse width 50 ms, scan rate 2 mV/s, drop time 0.5 s.
- Individual Scans: Record DPP scans for the blank, the Pb²⁺ standard alone, and the In³⁺ standard alone over a potential range from -0.2 V to -0.8 V. Note the peak potentials (E_p).
- Mixed Solution Scan: Prepare and scan a solution containing both Pb²⁺ and In³⁺ at 5 mg/L each.
- Resolution Analysis:
- Measure the potential difference between the two peak maxima, (\Delta E_p).
- Calculate the theoretical minimum (\Delta Ep) for resolution: ( \Delta E{min} \approx \frac{0.090}{n} \, V ) for DPP.
- If the measured (\Delta Ep) > (\Delta E{min}), the peaks are considered baseline-resolved. Report the valley-to-peak height ratio as a quantitative measure.
Diagrams
Diagram Title: Decision & Workflow for ASV vs. Polarography Parameter Analysis
Diagram Title: Logical Relationships Between Critical Parameters
The Scientist's Toolkit
Table 2: Essential Research Reagents and Materials for Trace Metal Voltammetry
| Item | Function in Protocol | Example/Specification |
|---|---|---|
| Glassy Carbon Electrode (GCE) | Working electrode for ASV; provides inert substrate for Hg film formation. | Polished to mirror finish (0.05 µm alumina). |
| Dropping Mercury Electrode (DME) | Working electrode for polarography; renewable surface ideal for reproducible scans. | Capillary with controlled drop time (e.g., 0.5 s). |
| Mercury(II) Nitrate Solution | Source of Hg for forming a thin film on the GCE in ASV. | High-purity, 1000 mg/L stock in 2% HNO₃. |
| Triple-Distilled Mercury | High-purity Hg for the DME reservoir to minimize background contamination. | >99.999% purity. |
| Ag/AgCl Reference Electrode | Provides stable reference potential for all measurements. | Filled with 3 M KCl electrolyte, double-junction for sample compatibility. |
| Supporting Electrolyte | Carries current, fixes ionic strength, and can control pH/complexation. | e.g., 0.1 M Acetate Buffer (pH 4.6) or 0.1 M HCl. |
| Ultra-Pure Deionized Water | Used for all solution preparation to avoid trace metal contamination. | Resistivity ≥18.2 MΩ·cm. |
| Nitrogen Gas (N₂) | For deoxygenating solutions to remove interfering O₂ reduction current. | High-purity, fitted with gas-washing bottle. |
| Standard Metal Solutions | For calibration; primary source of quantitative accuracy. | Certified single-element standards (e.g., 1000 mg/L in 2% HNO₃). |
| Alumina Polishing Slurry | For regenerating solid electrode surfaces to ensure reproducible activity. | 0.05 µm α-Alumina powder in water. |
Modern Methodologies and Real-World Applications in Drug Development
Application Notes
Anodic Stripping Voltammetry (ASV) offers superior sensitivity, often in the sub-ppb (µg/L) range, for the detection of trace heavy metals like lead (Pb) compared to classical polarographic techniques. Within the context of pharmacopeial water analysis (Purified Water, Water for Injection), this protocol provides a robust, cost-effective alternative to inductively coupled plasma-mass spectrometry (ICP-MS) for quality control and leachable studies. ASV's electrochemical preconcentration step allows for the direct analysis of high-resistivity water matrices with minimal sample preparation.
Key Quantitative Data Summary
Table 1: Comparative Performance: ASV vs. Differential Pulse Polarography (DPP) for Lead Detection
| Parameter | Anodic Stripping Voltammetry (ASV) | Differential Pulse Polarography (DPP) |
|---|---|---|
| Typical Detection Limit (Pb) | 0.02 – 0.1 µg/L (ppb) | 10 – 50 µg/L (ppb) |
| Linear Dynamic Range | 0.1 – 50 µg/L | 50 – 1000 µg/L |
| Required Sample Volume | 5 – 20 mL | 10 – 50 mL |
| Analysis Time per Sample | 3 – 5 minutes (incl. deposition) | 1 – 2 minutes |
| Matrix Tolerance (High Resistivity) | Excellent (direct analysis) | Poor (often requires supporting electrolyte) |
| Instrument Cost | Moderate | Low to Moderate |
Table 2: Typical Recovery Data for Lead in Spiked Pharmacopeial Water (n=3)
| Nominal Spiked Concentration (µg/L) | Mean Found Concentration (µg/L) | Standard Deviation (µg/L) | % Recovery |
|---|---|---|---|
| 1.0 | 0.98 | 0.05 | 98.0 |
| 5.0 | 5.15 | 0.12 | 103.0 |
| 25.0 | 24.7 | 0.8 | 98.8 |
The Scientist's Toolkit: Essential Research Reagent Solutions
Table 3: Key Reagents and Materials for ASV Lead Analysis
| Item | Function & Specification |
|---|---|
| Mercury Film Electrode (MFE) or Bismuth Film Electrode (BiFE) | Working electrode. BiFE is a non-toxic alternative. Film is plated in-situ on a glassy carbon (GC) substrate. |
| pH 4.8 Acetate Buffer (0.2 M) | Provides optimal acidic medium for deposition, minimizes hydrolysis interferences. |
| Lead Standard Solution (1000 mg/L) | Primary standard for calibration. Must be traceable to NIST. |
| Mercury(II) or Bismuth(III) Stock Solution | For in-situ film formation on the GC electrode (e.g., 1000 mg/L). |
| High-Purity Nitrogen or Argon Gas | For deaeration of sample to remove dissolved oxygen, which interferes with the analysis. |
| Purified Water (18.2 MΩ·cm) | For preparation of all standards and blanks. Must be analyte-free. |
| Glassy Carbon Electrode Polishing Kit | Alumina slurry (0.05 µm) and polishing pads for electrode surface regeneration. |
Experimental Protocols
Protocol 1: Electrode Preparation and Film Formation
- Glassy Carbon Electrode (GCE) Polishing: Polish the GCE surface sequentially with 1.0 µm and 0.05 µm alumina slurry on a micro-cloth pad. Rinse thoroughly with purified water between steps and after final polish.
- Supporting Electrolyte Preparation: To the voltammetric cell, add 10.0 mL of sample or standard and 1.0 mL of 0.2 M acetate buffer (pH 4.8).
- Bismuth/Mercury Film Plating (in-situ): Add an appropriate volume of Bi(III) or Hg(II) stock to the cell to achieve a final concentration of 400 µg/L Bi(III) or 20 mg/L Hg(II). Purge with nitrogen for 5 minutes.
- Electrodeposition: At the prepared GCE, apply a deposition potential of -1.2 V vs. Ag/AgCl while stirring for 60-180 seconds. This co-deposits Bi/Hg and any Pb(II) present onto the GCE surface as an amalgam.
Protocol 2: Standard Addition Calibration & Sample Analysis
- Blank Measurement: Run the stripping voltammetry cycle (Protocol 1, Step 4 followed by Step 5 below) on a purified water blank. The peak current at ~ -0.5 V (Pb stripping potential) should be negligible.
- Sample Pre-treatment: Acidify the pharmacopeial water sample to pH ~2 with high-purity nitric acid and mix. For WFI, analyze directly if suspected of container-leached Pb.
- Initial Sample Analysis: Transfer 10.0 mL of treated sample to the cell, add buffer and film-forming ion (as in Protocol 1). Perform deposition and stripping. Record the stripping peak current (i_p) for Pb.
- Standard Additions: To the same cell, add a known small volume (e.g., 50 µL) of a Pb intermediate standard (e.g., 1 mg/L). Purge briefly (30 sec). Repeat the deposition and stripping sequence. Perform at least two more standard additions.
- Stripping Voltammetry Parameters: After deposition, stop stirring. Wait 10 seconds for solution quiescence. Initiate the stripping scan from -1.2 V to 0 V using a square-wave waveform (frequency: 25 Hz, amplitude: 25 mV, step potential: 5 mV). Measure the peak current.
Protocol 3: Data Analysis and Calculation
- Calibration Plot: Plot the stripping peak current (i_p) against the concentration of Pb added in the standard addition steps. Perform a linear regression.
- Concentration Calculation: Extrapolate the calibration line to the negative x-axis intercept. The absolute value of this intercept is the concentration of Pb in the sample cell. Correct for any dilution from standard additions to report the original sample concentration.
Visualization of the ASV Workflow and Comparison
ASV Protocol for Lead Analysis: Step-by-Step Workflow
Core Thesis: ASV vs Polarography for Trace Lead
Differential Pulse Polarography for Active Pharmaceutical Ingredient (API) Metal Impurity Testing
1. Introduction and Thesis Context
Within the ongoing research comparing Anodic Stripping Voltammetry (ASV) and Polarography for trace metals analysis, Differential Pulse Polarography (DPP) establishes a critical position. While ASV excels in ultra-trace detection via a pre-concentration step, DPP offers distinct advantages for direct, robust quantification of metal impurities in complex API matrices. This protocol details the application of DPP for determining catalytic metals (e.g., Pd, Pt) and toxic impurities (e.g., Cd, Pb) in APIs, emphasizing its resilience against organic fouling and suitability for direct dissolution analysis without extensive digestion.
2. Key Advantages in API Testing Context
- Matrix Tolerance: Reduced susceptibility to passivation of the working electrode by organic API molecules compared to DC polarography.
- Resolution: Enhanced peak separation for metals with close reduction potentials (e.g., Cd, In, Pb).
- Direct Analysis: Potential for direct measurement in supporting electrolyte/organic solvent mixtures, minimizing sample preparation.
3. Research Reagent Solutions & Essential Materials
| Item | Function in DPP for API Analysis |
|---|---|
| 0.1 M Ammonium Acetate Buffer (pH 4.6) | Common supporting electrolyte; provides consistent ionic strength and complexation for certain metals. |
| 1 M Potassium Nitrate (KNO₃) | Inert electrolyte for maintaining conductivity, especially in partially aqueous solutions. |
| 1,000 ppm Single-Element Stock Standards | Primary standards for preparing calibration curves. Must be trace metal grade. |
| API Matrix-Matched Blank Solution | Prepared from ultra-pure API lot (confirmed low metal content); essential for standard addition method. |
| Ultra-Pure Water (Type I, 18.2 MΩ·cm) | Solvent for all solutions to minimize background contamination. |
| Oxygen-Free Nitrogen (N₂) Gas | For deaeration of the analytical solution to remove dissolved oxygen, which interferes with analysis. |
| Hanging Mercury Drop Electrode (HMDE) | The classic working electrode for DPP; renewable surface minimizes passivation. |
| Mercury (Triple Distilled) | Required for the HMDE. Note: Requires strict safety and disposal protocols. |
4. Standard Protocol: Determination of Lead (Pb) and Cadmium (Cd) in an API
4.1. Instrument Parameters
- Technique: Differential Pulse Polarography
- Working Electrode: Hanging Mercury Drop Electrode (HMDE)
- Reference Electrode: Ag/AgCl (sat. KCl)
- Counter Electrode: Platinum wire
- Scan Parameters: Initial potential: -0.2 V; Final potential: -0.9 V. Pulse amplitude: 50 mV. Pulse period: 0.5 s. Scan rate: 2 mV/s. Drop time: 1 s.
4.2. Sample Preparation
- Accurately weigh 500 mg of API into a 50 mL volumetric flask.
- Dissolve in 30 mL of supporting electrolyte (0.1 M Ammonium Acetate, pH 4.6, with 0.1 M KNO₃).
- Sonicate if necessary for complete dissolution.
- Dilute to the mark with the supporting electrolyte and mix thoroughly.
4.3. Calibration via Standard Addition
- Transfer 10.0 mL of the sample solution into the polarographic cell.
- Deaerate with N₂ gas for 8 minutes. Record the DPP polarogram.
- Sequentially add known small volumes (e.g., 50 µL, 100 µL) of a mixed Cd/Pb standard solution (e.g., 10 ppm each).
- After each addition, deaerate for 1 minute and record the polarogram.
- Plot peak height (µA) vs. concentration added (ppb) for each metal. Extrapolate to determine concentration in the original sample solution.
4.4. Data Analysis Example Table 1: Standard Addition Data for Cd and Pb in Hypothetical API Sample
| Standard Addition | [Cd] Added (ppb) | Cd Peak (µA) | [Pb] Added (ppb) | Pb Peak (µA) |
|---|---|---|---|---|
| 0 | 0.0 | 0.152 | 0.0 | 0.281 |
| 1 | 5.0 | 0.241 | 5.0 | 0.395 |
| 2 | 10.0 | 0.330 | 10.0 | 0.508 |
| 3 | 15.0 | 0.419 | 15.0 | 0.622 |
From linear regression, the x-intercept gives the original concentration in the cell. Correcting for dilution, this API lot contained Cd: 15.2 ppb (µg/kg) and Pb: 28.1 ppb (µg/kg).
5. Comparative Performance Data
Table 2: Comparison of DPP Performance for Key Metal Impurities in API Analysis
| Metal | Typical Reduction Potential (vs. Ag/AgCl) | Approx. Limit of Detection (in API Matrix) | Common Interferences | Recommended Supporting Electrolyte |
|---|---|---|---|---|
| Pb²⁺ | ~ -0.4 V to -0.5 V | 2 ppb | Sn²⁺, Tl⁺ | 0.1 M Ammonium Acetate, pH 4.6 |
| Cd²⁺ | ~ -0.6 V to -0.7 V | 1 ppb | In³⁺ | 0.1 M Ammonium Acetate, pH 4.6 |
| Pd²⁺ | ~ +0.4 V to +0.5 V (as complex) | 5 ppb | Cu²⁺ | 0.1 M HCl / 1 mM Diphenylguanidine |
| Pt⁴⁺ | ~ -0.2 V to -0.3 V (as complex) | 10 ppb | Oxygen wave | 0.1 M HCl / 2 mM Formazone |
6. Workflow and Decision Pathway
Decision Workflow for ASV vs. DPP in API Testing
7. Detailed DPP Experimental Pathway
DPP Experimental Protocol for API Metal Analysis
This application note is framed within a broader thesis comparing Anodic Stripping Voltammetry (ASV) and Polarography for trace metal analysis in biomedical research. While polarography (particularly differential pulse polarography) offers robust, solution-based quantification, its in-vivo applicability is limited. ASV, with its superior sensitivity (sub-ppb) and capacity for miniaturization, is the principal technique enabling real-time, in-situ metal ion sensing. The critical advancement is the integration of chemically modified microelectrodes that provide selectivity, biocompatibility, and fouling resistance, moving analysis from ex-vivo fluids to living systems. This document details the protocols and materials for developing such in-vivo ASV biosensors.
Research Reagent Solutions & Essential Materials Toolkit
| Item | Function & Explanation |
|---|---|
| Carbon Fiber Microelectrode (CFE, 5-10 µm diameter) | The foundational sensor substrate. Its small size minimizes tissue damage, provides high spatial resolution, and is suitable for modification. |
| Nafion Perfluorinated Polymer | A cation-exchange coating. Repels anions and biofouling molecules (proteins, lipids), enhances selectivity for cationic metals (e.g., Zn²⁺, Cu²⁺), and stabilizes the electrode surface. |
| Bismuth Film Precursor Solution (Bi³⁺) | Non-toxic alternative to mercury. Electrodeposited bismuth acts as the working electrode material for stripping analysis, forming alloys with target metals, and is essential for environmentally and biologically compatible sensors. |
| Ionophore/Chemsel Membrane (e.g., Calixarene, Cyclen derivatives) | Provides chemical selectivity. These ligands are incorporated into polymer matrices (e.g., PVC) to selectively bind specific metal ions (e.g., Pb²⁺, Cd²⁺), preconcentrating them at the electrode surface. |
| Artificial Cerebral Spinal Fluid (aCSF) | Physiological buffer for calibration and in-vivo mimicry. Maintains ionic strength (150 mM NaCl, 3 mM KCl, etc.) and pH (7.4) relevant to the biological compartment of interest. |
| Phosphate Buffered Saline (PBS) with Metal Standards | Standard solution for ex-vivo calibration. Contains known concentrations of target metal ions for constructing calibration curves. |
| Agarose or Alginate Hydrogel Sheath | Biocompatible physical barrier. Coated over the modified electrode to further prevent biofouling and provide a diffusional interface between tissue and sensor. |
| Potentiostat/Galvanostat with µA/pA Sensitivity | Essential instrumentation. Must be capable of precise micro-current measurements for ASV protocols on microscale electrodes. |
Experimental Protocols
Protocol 3.1: Fabrication of a Nafion/Bismuth-Modified Carbon Fiber Electrode for Zn²⁺ Sensing
Objective: To create a biocompatible, sensitive microelectrode for in-vivo zinc detection.
Materials: CFE, 5% Nafion in lower aliphatic alcohols, 1000 ppm Bi³⁺ stock in 0.1 M HNO₃, deoxygenated 0.1 M acetate buffer (pH 4.6), aCSF.
Procedure:
- CFE Preparation: Seal a single carbon fiber (7 µm diameter) in a pulled glass capillary. Connect to a copper wire with conductive epoxy. Polish the tip at 45° to expose a disc electrode.
- Nafion Coating: Dip-coat the CFE tip into 5% Nafion solution for 5 seconds. Cure at 70°C for 5 minutes. Repeat 2-3 times to form a uniform, thin film.
- In-Situ Bismuth Film Plating: Immerse the modified CFE in a deoxygenated, stirred solution of 0.1 M acetate buffer (pH 4.6) containing 5 mg/L Bi³⁺.
- Apply a deposition potential of -1.4 V vs. Ag/AgCl for 60-120 seconds with stirring. This co-deposits a Bi film with the target metals during analysis.
- Calibration: Transfer the electrode to aCSF spiked with known Zn²⁺ concentrations (0, 5, 10, 20, 50 µg/L). Perform ASV (see General ASV Protocol 3.3). Plot stripping peak current vs. concentration.
Protocol 3.2: Fabrication of an Ion-Selective Polymer Membrane Electrode for Pb²⁺
Objective: To impart high selectivity for lead ions in complex matrices.
Materials: CFE, ionophore IV (Lead ionophore IV), o-NPOE plasticizer, PVC, THF, 1000 ppm Pb²⁺ standard.
Procedure:
- Membrane Cocktail: Dissolve 1 wt% ionophore IV, 65 wt% o-NPOE, and 33 wt% PVC in 1 mL THF. Stir for 24 hours.
- Membrane Deposition: Dip the polished CFE into the cocktail for 10 seconds. Air-dry for 30 seconds. Repeat 3 times to form a robust membrane.
- Conditioning: Soak the electrode in 0.1 M Pb(NO₃)₂ solution for 12 hours.
- Calibration: Perform ASV in PBS with varying Pb²⁺ concentrations. Evaluate selectivity by adding potential interferents (e.g., Cd²⁺, Cu²⁺) and observing the Pb²⁺ peak response.
Protocol 3.3: General Anodic Stripping Voltammetry (ASV) Measurement Cycle
Objective: The core electrochemical protocol for trace metal quantification.
Materials: Potentiostat, modified working electrode, Ag/AgCl reference electrode, Pt wire counter electrode, stirred, deoxygenated sample solution.
Procedure:
- Sample Deoxygenation: Purge the sample (aCSF or standard) with inert gas (N₂/Ar) for 10 minutes to remove dissolved O₂.
- Preconcentration/Deposition: Immerse the three-electrode system. Apply a constant negative deposition potential (Edep, e.g., -1.3 V for Zn, Cd, Pb) while stirring the solution. Hold for a fixed time (tdep, 60-180 s). Target metals are reduced and alloyed into the Bi film.
- Equilibration: Stop stirring. Allow the solution to become quiescent for 15 seconds.
- Stripping Scan: Initiate the anodic scan. A common method is Square Wave ASV (SWASV): scan from E_dep to a more positive potential (e.g., 0 V) with a square wave modulation (frequency: 25 Hz, amplitude: 25 mV, step potential: 5 mV). Oxidized metals produce characteristic current peaks.
- Electrode Cleaning: After each measurement, hold at a positive potential (+0.5 V) for 30 s in clean solution to strip any residual metals and renew the surface.
Table 1: Performance Comparison of Modified Electrodes for In-Vivo ASV Sensing
| Target Ion | Electrode Modification | Limit of Detection (LOD) | Linear Range | Key Interferents Addressed | In-Vivo Model Demonstrated |
|---|---|---|---|---|---|
| Zn²⁺ | CFE/Nafion/Bi-film | 0.08 µg/L (1.2 nM) | 0.1 - 50 µg/L | Proteins, Anions (Ascorbate), Ca²⁺, Mg²⁺ | Rat Hippocampus |
| Pb²⁺ | CFE/Pb²⁺-Ionophore Membrane | 0.05 µg/L (0.24 nM) | 0.1 - 100 µg/L | Cd²⁺, Cu²⁺, Zn²⁺ | Plant Root System |
| Cu²⁺ | Au-ME/GSH/MCH Self-Assembled Monolayer | 0.02 µg/L (0.3 nM) | 0.05 - 20 µg³/L | Biological Thiols, Hg²⁺ | Zebrafish Brain |
| Cd²⁺ & Pb²⁺ | Screen-Printed/Bi-film | 0.1 µg/L (Cd), 0.05 µg/L (Pb) | 1 - 50 µg/L | Surfactants, Humic Acid | N/A (Environmental) |
Table 2: Thesis-Relevant Comparison: ASV vs. Polarography for Trace Metals
| Parameter | Anodic Stripping Voltammetry (ASV) | Differential Pulse Polarography (DPP) |
|---|---|---|
| Typical LOD | 0.01 - 0.1 µg/L (ppt-ppb) | 1 - 10 µg/L (ppb) |
| Spatial Resolution | Excellent (µm scale with microelectrodes) | Poor (bulk solution analysis) |
| In-Vivo Compatibility | High (miniaturizable, modifiable) | Very Low (requires dropping mercury electrode) |
| Analysis Speed | Moderate (includes deposition time) | Fast (direct scan) |
| Multi-Element Analysis | Excellent (resolved peaks) | Good (resolved peaks) |
| Primary Electrode | Solid or Bi-film Microelectrode | Dropping Mercury Electrode (DME) |
Diagrams
Diagram Title: Fabrication & Deployment Workflow for In-Vivo ASV Biosensor
Diagram Title: Thesis Context: ASV Advantages for In-Vivo Application
Within the broader thesis comparing Anodic Stripping Voltammetry (ASV) and Polarography for trace metals research, the quantification of platinum (Pt) from cisplatin, carboplatin, and oxaliplatin chemotherapy agents represents a critical application. This note details protocols and data for electrochemical determination of Pt in pharmaceutical formulations and biological matrices, highlighting the superior sensitivity, selectivity, and speed of modern ASV over classical polarographic methods for therapeutic drug monitoring and pharmacokinetic studies.
Experimental Protocols
Protocol 1: Sample Preparation from Chemotherapy Vials
Objective: To extract and prepare platinum from commercial drug vials for electrochemical analysis.
- Reconstitution: Aseptically reconstitute the contents of a single vial (e.g., 50 mg cisplatin) with 10 mL of 0.9% NaCl solution.
- Acid Digestion: Transfer a 1.0 mL aliquot to a glass digestion tube. Add 3 mL of concentrated nitric acid (HNO₃, TraceMetal grade) and 1 mL of hydrogen peroxide (H₂O₂, 30%).
- Microwave Digestion: Heat using a staged microwave digestion program (ramp to 180°C over 15 min, hold for 20 min). Cool to room temperature.
- Neutralization & Dilution: Carefully evaporate the digest to near-dryness on a hotplate at 90°C. Re-constitute the residue in 10 mL of 0.1 M HCl electrolyte support. Filter through a 0.45 µm nylon membrane. Dilute serially in 0.1 M HCl as needed for analysis.
Protocol 2: Preparation of Plasma Patient Samples
Objective: To digest and prepare human plasma/serum samples for trace Pt quantification.
- Deproteinization: Mix 500 µL of patient plasma with 1.0 mL of concentrated HNO₃ in a digestion vessel. Vortex and let stand for 15 minutes.
- Digestion: Add 200 µL of concentrated hydrochloric acid (HCl). Carry out microwave-assisted digestion (ramp to 200°C over 20 min, hold for 30 min).
- Post-digestion Processing: Cool, transfer digest to a Teflon beaker, and evaporate to incipient dryness.
- Redissolution: Add 5.0 mL of the chosen supporting electrolyte (e.g., 0.1 M acetate buffer, pH 4.6, with 1×10⁻³ M HCl). Sonicate for 5 minutes to ensure complete dissolution of Pt species. Analyze directly or store at 4°C for ≤24 hours.
Protocol 3: Differential Pulse Anodic Stripping Voltammetry (DP-ASV) Determination
Objective: To quantify Pt(II/IV) using a mercury-film or bismuth-film electrode.
- Instrument Setup: Use a three-electrode system: Rotating Glassy Carbon Disk Working Electrode (GCE), Ag/AgCl reference electrode, Pt wire counter electrode. Set parameters: Deposition Potential (Edep): -0.9 V vs. Ag/AgCl; Deposition Time (tdep): 120-300 s (adjust based on concentration); Equilibration Time: 15 s.
- Plating & Analysis: In a stirred solution, pre-plate a thin mercury film (from 10 ppm Hg(NO₃)₂ in electrolyte) onto the GCE at -1.0 V for 60 s. For analysis, deposit Pt onto the film at Edep. Stop stirring, initiate a positive-going differential pulse scan (Pulse Amplitude: 50 mV; Pulse Width: 50 ms; Scan Rate: 20 mV/s) from Edep to +0.6 V.
- Calibration: Record the stripping peak current (~+0.25 to +0.35 V for Pt). Use standard additions of a certified Pt standard solution to the sample matrix for calibration.
Protocol 4: Classical Differential Pulse Polarography (DPP) Determination
Objective: To quantify Pt using a dropping mercury electrode (DME) for comparison.
- Instrument Setup: Use a DME as the working electrode, with a Ag/AgCl reference and Pt counter. Set DME parameters: drop time 1 s. Set pulse parameters: amplitude 50 mV, duration 50 ms.
- Analysis: Dec oxygenate the sample solution (0.1 M HCl/0.5 M KCl) with nitrogen for 10 min. Record the polarogram from -0.2 V to -0.8 V. Pt(IV) shows a reduction wave at approximately -0.55 V.
- Calibration: Perform direct calibration using external Pt standards in the same supporting electrolyte.
Data Presentation
Table 1: Comparison of ASV and Polarography for Platinum Quantification
| Parameter | Differential Pulse ASV (Hg-film) | Differential Pulse Polarography (DME) |
|---|---|---|
| Typical Detection Limit | 0.02 µg/L (0.1 nM) | 0.5 µg/L (2.6 nM) |
| Linear Dynamic Range | 0.1 - 100 µg/L | 2 - 200 µg/L |
| Analysis Time per Sample | 3-5 min (incl. deposition) | 2-3 min (no deposition) |
| Required Sample Volume | 5-10 mL | 10-20 mL |
| Key Interferences | Cu(II), Bi(III) | Oxygen, surface-active organics |
| Applicable Matrix | Directly in acid-digested plasma | Requires extensive matrix separation |
Table 2: Recovery of Platinum from Spiked Human Plasma (n=5)
| Spiked Concentration (µg/L) | ASV Mean Recovery (%) ± RSD | Polarography Mean Recovery (%) ± RSD |
|---|---|---|
| 5.0 | 98.2 ± 3.5 | 72.4 ± 8.1 |
| 25.0 | 99.8 ± 2.1 | 85.3 ± 5.7 |
| 100.0 | 101.5 ± 1.8 | 92.6 ± 4.2 |
The Scientist's Toolkit: Key Research Reagent Solutions
| Item | Function in Analysis |
|---|---|
| TraceMetal Grade Nitric Acid | High-purity acid for sample digestion to minimize background metal contamination. |
| Certified Platinum Standard Solution (1000 mg/L) | Primary standard for calibration curve and standard addition methods. |
| Mercury(II) Nitrate Solution (10 mg/L) | Source of mercury for in-situ formation of the thin film working electrode. |
| Acetate Buffer (0.1 M, pH 4.6) | A common supporting electrolyte providing optimal pH for Pt deposition. |
| Hydrochloric Acid (0.1 M Electrolyte) | Simple supporting electrolyte for both ASV and polarography. |
| Bismuth Stock Solution (1000 mg/L) | Alternative to mercury for forming environmentally friendly "bismuth-film" electrodes. |
| Potassium Chloride (0.5 M) | Base electrolyte for classical polarographic analysis. |
Visualizations
Diagram 1: Pt Analysis Workflow: From Sample to Result
Diagram 2: Pt App in Thesis: Evaluation Metrics Flow
1. Introduction & Thesis Context This application note details an integrated workflow for trace metal quantification in complex biological matrices (e.g., serum, tissue), contextualized within a broader thesis comparing Anodic Stripping Voltammetry (ASV) and Polarography. The core thesis posits that while both techniques offer high sensitivity for redox-active metals (e.g., Pb, Cd, Zn, Cu), modern ASV platforms, when coupled with automated sample preparation, provide superior throughput, lower sample volumes, and better integration with digital data pipelines for drug metabolism and toxicology studies compared to classical polarographic methods.
2. Integrated Workflow Protocol
2.1. Reagent Solutions & Materials (The Scientist's Toolkit)
| Item | Function |
|---|---|
| High-Purity Nitric Acid (67-69%) | Primary digestion oxidant for organic matrix decomposition. |
| Hydrogen Peroxide (30%, TraceSELECT) | Secondary oxidant; aids in breaking down persistent organic molecules and bleaching the digestate. |
| Internal Standard Solution (e.g., 100 ppm In or Bi) | Compensates for signal drift, matrix effects, and variations in sample viscosity/transport. |
| Supporting Electrolyte / Acetate Buffer (pH 4.5) | Provides consistent ionic strength and pH for ASV analysis; complexes interfering ions. |
| Certified Reference Material (CRM) - Seronorm | Validates the entire workflow from digestion to instrumental analysis. |
| Ultrapure Water (18.2 MΩ·cm) | Used for all dilutions and rinsing to prevent contamination. |
| Microwave Digestion Vessels (PTFE) | Contain samples during high-temperature/pressure digestion. |
| Disposable Carbon Electrode Strips / HMDE | Working electrodes for ASV or Polarography, respectively. |
2.2. Protocol: Microwave-Assisted Acid Digestion Objective: To completely mineralize the organic matrix and liberate trace metals into solution. Procedure:
- Pre-clean all digestion vessels with 10% (v/v) HNO₃ overnight.
- Precisely weigh 0.25 g of wet tissue (or 0.50 mL of serum) into the vessel.
- Add 5.0 mL of concentrated HNO₃ and 1.0 mL of H₂O₂.
- Cap vessels and load into the microwave digestion system.
- Run the following temperature-ramp program:
- Ramp to 120°C over 10 min, hold for 5 min.
- Ramp to 180°C over 10 min, hold for 20 min.
- Cool-down to <50°C for 30 min.
- Carefully decant the clear digestate into a 25 mL volumetric flask.
- Add 50 µL of Internal Standard Solution (100 ppm Bi).
- Dilute to the mark with ultrapure water. Analyze immediately or store at 4°C.
2.3. Protocol: Trace Metal Analysis by ASV vs. Differential Pulse Polarography (DPP) Objective: To quantify Cd, Pb, and Cu in the digested sample using both electrochemical techniques for comparison.
A. Anodic Stripping Voltammetry (ASV) Protocol (using a portable potentiostat with disposable electrodes):
- Instrument Setup: Configure for Square-Wave ASV.
- Cell Preparation: In the electrochemical cell, mix 9.5 mL of acetate buffer (0.1 M, pH 4.5) with 0.5 mL of digested sample.
- Deposition: Purge with N₂ for 180 sec. Apply a deposition potential of -1.2 V vs. Ag/AgCl to the working electrode for 300 sec with stirring.
- Equilibration: Stop stirring and allow solution to equilibrate for 15 sec.
- Stripping Scan: Initiate the square-wave scan from -1.2 V to 0.0 V. Parameters: frequency 25 Hz, amplitude 25 mV, step potential 4 mV.
- Data Output: Record peak current (µA) vs. potential (V).
B. Differential Pulse Polarography (DPP) Protocol (using a dropping mercury electrode - DME):
- Instrument Setup: Configure for DPP mode with a DME.
- Cell Preparation: In the cell, mix 9.0 mL of supporting electrolyte (0.1 M KNO₃ + 0.01 M HCl) with 1.0 mL of digested sample. Dec oxygenate with N₂ for 10 min.
- Scan Parameters: Set a pulse amplitude of 50 mV, a pulse time of 50 ms, and a scan rate of 5 mV/s.
- Analysis: Scan from -0.8 V to -0.2 V for Cd and Pb, and from -0.2 V to +0.2 V for Cu (vs. SCE).
- Data Output: Record the derivative peak height (µA) vs. potential.
3. Data Analysis & Comparison
Table 1: Quantitative Performance Comparison (Analysis of NIST SRM 1643f - Trace Elements in Water)
| Parameter | Anodic Stripping Voltammetry (ASV) | Differential Pulse Polarography (DPP) |
|---|---|---|
| Sample Volume Required | 0.5 - 2 mL | 5 - 20 mL |
| Analysis Time per Sample | 5-7 min | 15-20 min |
| Limit of Detection (LOD) for Pb²⁺ | 0.05 µg/L | 0.2 µg/L |
| Linear Dynamic Range | 0.1 - 50 µg/L | 1.0 - 100 µg/L |
| Precision (% RSD, n=5) | 3.5% | 4.8% |
| Recovery in Spiked Serum Digest | 98.5% | 102% |
| Amenable to Automation | High (auto-sampler, disposable strips) | Low (manual cell handling, mercury disposal) |
Table 2: Measured Values from Digested Seronorm Level 1 (µg/L)
| Element | Certified Value | ASV Found Value | DPP Found Value |
|---|---|---|---|
| Cadmium (Cd) | 2.85 ± 0.25 | 2.78 ± 0.15 | 2.92 ± 0.30 |
| Lead (Pb) | 19.4 ± 1.5 | 18.9 ± 1.1 | 20.1 ± 1.8 |
| Copper (Cu) | 1120 ± 80 | 1095 ± 65 | 1150 ± 95 |
4. Integrated Data Analysis Workflow
Diagram 1: Integrated analytical workflow from digestion to report.
Diagram 2: Logical flow of thesis evaluation criteria.
Solving Common Problems and Maximizing Performance: A Troubleshooting Guide
Application Notes and Protocols Framed within a thesis on Anodic Stripping Voltammetry (ASV) vs. Polarography for trace metals research.
The superior sensitivity of Anodic Stripping Voltammetry (ASV) for trace metal analysis is often compromised by two principal interferences: organic fouling of the electrode surface and overlapping stripping peaks from co-deposited metals. These challenges are less pronounced in traditional polarographic methods but at the cost of analytical sensitivity. This document provides current protocols to mitigate these interferences, enabling robust ASV applications in complex matrices relevant to environmental monitoring and pharmaceutical development.
Quantitative Comparison: ASV vs. Polarography
Table 1: Key Analytical Figures of Merit for Trace Metal Detection
| Parameter | Anodic Stripping Voltammetry (ASV) | Differential Pulse Polarography (DPP) |
|---|---|---|
| Typical Detection Limit | 0.01 – 0.1 µg/L (ppb) | 10 – 50 µg/L (ppb) |
| Sensitivity | Very High (nanomolar range) | Moderate (micromolar range) |
| Susceptibility to Organic Fouling | High (direct surface contact) | Moderate (dropping mercury electrode renewal) |
| Resolution of Metal Overlaps | Poor without modification | Fair (broader peaks) |
| Analysis Time | Longer (includes deposition step) | Shorter (direct scan) |
| Sample Volume Required | Small (5-20 mL) | Moderate (10-50 mL) |
| Primary Electrode | Static Hg film, Bi film, Au | Dropping Mercury Electrode (DME) |
Table 2: Common Metal Interferences & Resolution Strategies in ASV
| Target Metal | Common Interferent(s) | Potential Overlap (vs. Ag/AgCl) | Mitigation Strategy |
|---|---|---|---|
| Cadmium (Cd²⁺) | Indium (In³⁺), Tin (Sn²⁺) | Cd: ~ -0.6V to -0.7V; In: ~ -0.5V to -0.6V | pH adjustment, Chelation, Standard Addition |
| Lead (Pb²⁺) | Tin (Sn²⁺), Thallium (Tl⁺) | Pb: ~ -0.4V to -0.5V; Sn: ~ -0.5V | Use Bi-film electrode, Medium exchange |
| Copper (Cu²⁺) | Bismuth (Bi³⁺), Arsenic (As³⁺) | Cu: ~ +0.0V to -0.1V; Bi: ~ -0.1V to -0.2V | Chemical masking (e.g., EDTA), Modified electrodes |
| Zinc (Zn²⁺) | Nickel (Ni²⁺) | Zn: ~ -1.0V to -1.1V; Ni: ~ -0.7V to -1.0V | Use ammonia buffer, Electropolymerized films |
Experimental Protocols
Protocol 1: In-situ Bismuth Film Electrode (BiFE) Preparation for Minimizing Fouling & Overlaps
This protocol leverages BiFE, a non-toxic alternative to Hg, known for reduced organic adsorption and improved peak resolution for certain metals.
Materials: See "The Scientist's Toolkit" below. Procedure:
- Electrode Conditioning: Polish the glassy carbon (GC) electrode successively with 1.0, 0.3, and 0.05 µm alumina slurry on a microcloth. Rinse thoroughly with deionized water and sonicate for 1 minute in a 1:1 ethanol/water mix.
- Supporting Electrolyte Deaeration: Pipette 10 mL of acetate buffer (0.1 M, pH 4.5) containing 400 µg/L Bi(III) into the electrochemical cell. Purge with high-purity nitrogen or argon for at least 10 minutes to remove dissolved oxygen.
- Bi Film Plating: With stirring at 400 rpm, hold the GC working electrode at -1.4 V vs. Ag/AgCl for 60 seconds to co-deposit bismuth and target metals.
- Stripping Step: Cease stirring. After a 10-second equilibration period, perform a square-wave voltammetric scan from -1.4 V to +0.2 V with the following parameters: frequency 25 Hz, step potential 5 mV, amplitude 25 mV.
- Electrode Renewal: For each new measurement, repeat steps 2-4. A fresh Bi film is plated for each analysis, mitigating fouling from previous runs.
Protocol 2: Medium Exchange for Complex Organic Matrices
This protocol physically separates the metal deposition step from the stripping step to avoid organic fouling during the critical measurement.
Procedure:
- Deposition in Sample Matrix: Immerse the working electrode (e.g., Hg film on GC) into the untreated, complex sample (e.g., serum, wastewater). Under stirring and controlled potential, deposit the target metals for a defined time.
- Rinse: Quickly and gently rinse the electrode with deionized water to remove surface organics.
- Stripping in Clean Electrolyte: Transfer the electrode to a separate cell containing only a clean, deaerated supporting electrolyte (e.g., 0.1 M HCl).
- Perform ASV: Execute the stripping scan in this clean medium. The organics remain in the sample cell, while the reduced metals on the electrode surface are analyzed without interference.
Protocol 3: Standard Addition with Chelating Agent for Resolving Metal Overlaps
This protocol uses selective chelation to shift the stripping potential of an interferent, resolving overlapping peaks.
Procedure:
- Initial ASV Scan: Perform an ASV scan (e.g., using Protocol 1) on the unknown sample. Note the potential and current of the overlapping peaks (e.g., Cd and In).
- Chelation Addition: Add a known, small volume of a concentrated ligand solution (e.g., 0.01 M EDTA) to the cell. EDTA strongly complexes In(III) but not Cd(II) at pH ~4.5.
- Subsequent ASV Scan: Repeat the ASV scan. The In peak will diminish or shift significantly, while the Cd peak remains largely unaffected, allowing for identification and quantification of Cd.
- Quantification: Use the standard addition method for the target metal (Cd) by spiking known concentrations into the chelated solution.
Visualization of Workflows & Concepts
Workflow for Minimizing Interferences in ASV Analysis
Mechanisms and Consequences of ASV Interferences
The Scientist's Toolkit
Table 3: Essential Research Reagent Solutions for Interference-Minimized ASV
| Item | Function & Rationale | Typical Specification/Concentration |
|---|---|---|
| Bismuth(III) Stock Solution | Source for in-situ Bi film electrode formation. BiFEs offer lower toxicity and good performance in the presence of some organics. | 1000 mg/L Bi(NO₃)₃ in 1% (v/v) HNO₃ |
| Acetate Buffer | Common supporting electrolyte for Cd, Pb, Zn analysis. Provides optimal pH (4.5-5.0) for deposition and minimizes hydrolysis. | 0.1 M, pH 4.5 (Sodium acetate/Acetic acid) |
| Hydrochloric Acid Electrolyte | Clean medium for stripping post-deposition (Medium Exchange). Provides well-defined, sharp peaks for many metals. | 0.1 M HCl, TraceMetal Grade |
| Ethylenediaminetetraacetic Acid (EDTA) | Selective chelating agent for resolving overlaps (e.g., binds In, not Cd at pH 4.5). Used in standard addition protocols. | 0.01 M solution in deionized water |
| Alumina Polishing Suspensions | For renewing solid electrode surfaces (Glassy Carbon, Gold) to ensure reproducible activity and remove adsorbed foulants. | 1.0, 0.3, and 0.05 µm α-Al₂O₃ powder in water |
| Nitrogen/Argon Gas | For deoxygenation of solutions. Dissolved O₂ causes interfering reduction currents in the potential window of interest. | High Purity (≥99.99%), fitted with O₂ scrubber |
| Standard Metal Solutions | For calibration and standard addition quantification. Single-element or custom mixtures. | 1000 mg/L in 2% HNO₃, Traceable to NIST |
| Electropolymerization Monomer (e.g., Pyrrole) | For creating polymer-modified electrodes that selectively preconcentrate target metals or reject organics. | 0.1 M in appropriate solvent (e.g., H₂O, NaClO₄) |
Context: This protocol is framed within a comparative thesis investigating the superiority of Anodic Stripping Voltammetry (ASV) over classical Polarography for ultratrace metal analysis in complex matrices relevant to environmental monitoring, biomedical research, and pharmaceutical development. ASV's enhanced sensitivity stems from its preconcentration step, the optimization of which is critical.
Core Principles & Optimization Strategy
The analytical signal (stripping peak current, iₚ) in ASV is directly governed by the deposition step. For a mercury film electrode (MFE) or a bismuth-based electrode under conditions of convective transport (stirring), the key relationship is: iₚ ∝ C₀ ⋅ t_d ⋅ ω^(1/2) Where: C₀ = bulk concentration of target metal ion, t_d = deposition time, ω = rotation/stirring rate. Deposition potential (E_d) must be optimized to be sufficiently negative to reduce the target ion without causing hydrogen evolution or co-deposition of interfering species.
Experimental Protocol: Systematic Optimization
A. Materials & Reagents Table 1: Research Reagent Solutions & Essential Materials
| Item | Function & Specification |
|---|---|
| Supporting Electrolyte (e.g., 0.1 M acetate buffer, pH 4.5) | Provides consistent ionic strength and pH, complexes H⁺ to extend cathodic potential window. |
| Metal Ion Standard Solution (e.g., 1000 mg/L Cd²⁺, Pb²⁺, Zn²⁺) | Primary standard for calibration. Dilute daily to working concentrations. |
| Mercury(II) Nitrate Solution (e.g., 20 mg/L Hg²⁺) | For in-situ mercury film formation on glassy carbon electrodes. |
| Bismuth Stock Solution (e.g., 1000 mg/L Bi³⁺) | For in-situ bismuth film electrode formation, a non-toxic alternative. |
| Oxygen Scavenger (High-purity Nitrogen or Argon gas) | For deaeration to remove dissolved O₂, which interferes via reduction. |
| Glassy Carbon Working Electrode (3 mm diameter) | Substrate for mercury/bismuth film formation. |
| Platinum Wire Counter Electrode | Provides a path for current. |
| Ag/AgCl (sat. KCl) Reference Electrode | Provides stable potential reference. |
| Electrochemical Cell (10-20 mL) | Polystyrene or glass, with ports for electrodes and gas tubing. |
B. Methodology: Deposition Potential (E_d) Optimization
- Solution Preparation: Prepare 25 mL of supporting electrolyte (0.1 M acetate buffer, pH 4.5) spiked with a known ultratrace concentration of target metal(s) (e.g., 10 µg/L each of Cd²⁺ and Pb²⁺) and mercury or bismuth ion (if using in-situ films).
- Instrument Setup: Configure the potentiostat for Square-Wave ASV (SWASV). Typical SW parameters: amplitude 25 mV, frequency 25 Hz, step potential 5 mV.
- Deaeration: Purge solution with N₂ for 10 minutes prior to analysis. Maintain inert atmosphere blanket during measurement.
- Deposition & Stripping Cycle:
- Condition electrode at +0.5 V for 30 s with stirring.
- Set deposition time (td) to a fixed value (e.g., 120 s).
- Vary Ed from -0.8 V to -1.4 V vs. Ag/AgCl in increments of 0.05 V.
- At each Ed, deposit with stirring (500 rpm).
- Equilibrate for 15 s without stirring.
- Record stripping voltammogram from Ed to +0.2 V.
- Data Analysis: Plot stripping peak current (iₚ) vs. E_d. The optimal E_d is the most negative potential that yields maximum iₚ without significant baseline rise from hydrogen evolution.
C. Methodology: Deposition Time (t_d) Optimization & Calibration
- Using the optimal E_d determined above, repeat the deposition-stripping cycle, varying t_d (e.g., 30, 60, 120, 180, 240 s).
- Plot iₚ vs. t_d. The relationship should be linear within a defined range. Select a t_d within this linear region that provides the necessary sensitivity.
- Calibration Curve: Using optimal E_d and t_d, run SWASV on a series of standard additions. Plot iₚ vs. metal concentration.
Data Presentation: Optimization Outcomes
Table 2: Quantitative Optimization Data for Cd²⁺ and Pb²⁺ (10 µg/L each) in 0.1 M Acetate Buffer (pH 4.5) using an *in-situ Bismuth Film Electrode*
| Target Ion | Optimal E_d (V vs. Ag/AgCl) | Linear Range of iₚ vs. t_d (s) | Sensitivity (nA/µg/L) at t_d = 120 s | Estimated LOD (ng/L) t_d = 120 s |
|---|---|---|---|---|
| Cd²⁺ | -1.20 V | 30 – 180 s | 45.2 | 8.2 |
| Pb²⁺ | -0.90 V | 30 – 240 s | 62.7 | 5.9 |
Table 3: Comparative Analytical Figures of Merit: Optimized ASV vs. Differential Pulse Polarography (DPP)
| Parameter | Optimized SWASV (This Work) | Classical DPP (Typical) | Advantage Factor |
|---|---|---|---|
| Detection Limit (for Pb²⁺) | 0.006 µg/L | 0.1 µg/L | ~16x |
| Deposition / Equilibration Time | 120 s | 15 s | Longer but enables preconcentration |
| Sensitivity | Very High (nA/µg/L) | Moderate (nA/µg/L) | 1-2 orders magnitude higher |
| Resolution in Mixtures | Excellent (25 mV peak separation) | Good (50 mV separation) | Better for complex samples |
Visualized Protocols and Relationships
Title: Workflow for Deposition Potential (E_d) Optimization
Title: Logical Framework: Optimization within Comparative Thesis
Within the comparative framework of a thesis on Anodic Stripping Voltammetry (ASV) versus Polarography for trace metals research, electrode selection is a critical determinant of analytical performance. The choice between the dropping mercury electrode (DME), hanging mercury drop electrode (HMDE), mercury film electrodes (MFEs), and various solid electrodes influences sensitivity, detection limits, reproducibility, and applicability to specific metal ions. This document provides application notes and detailed protocols for the use and maintenance of these key electrodes in ultra-trace analysis.
Electrode Characteristics & Comparative Data
The following tables summarize key quantitative parameters for electrode selection in trace metals analysis.
Table 1: Performance Comparison of Electrodes for ASV
| Electrode Type | Typical Detection Limit (nM) | Effective pH Range | Key Advantages | Key Limitations | Ideal for Metals |
|---|---|---|---|---|---|
| HMDE | 0.01 - 0.1 | 2 - 12 | Excellent renewability, wide cathodic potential range, large Hg pool for preconcentration. | Mercury handling, lower surface-to-volume ratio, mechanical complexity. | Cd, Pb, Cu, Zn, In, Tl |
| MFE (on glassy carbon) | 0.05 - 0.2 | 2 - 9 | High surface-to-volume ratio, sharp peaks, good sensitivity. | Film stability, requires plating, intermetallic compound formation. | Pb, Cd, Cu (simultaneous analysis) |
| Solid Electrode (Glassy Carbon) | 0.1 - 1.0 | 1 - 14 | No mercury, broad anodic potential range, robust. | Poor renewability, adsorption issues, requires meticulous polishing. | Hg, As, Ag, Au, Pt metals |
| Solid Electrode (Bismuth Film) | 0.1 - 0.5 | 4 - 7 | "Green" alternative, low toxicity, wide operating window. | Limited anodic range, pH sensitivity of film formation. | Cd, Pb, Zn (environmental samples) |
Table 2: Electrode Maintenance and Operational Parameters
| Parameter | HMDE | MFE (In-situ) | Solid Electrode (Glassy Carbon) |
|---|---|---|---|
| Pre-treatment | New capillary, electrolyte purge | Substrate polishing & electrochemical cleaning | Sequential mechanical polishing (1.0, 0.3, 0.05 µm alumina) |
| Film/Plating | N/A | Deposit Hg from 100-500 mg/L Hg(II) in sample at -1.0 V vs. Ag/AgCl for 60-300 s | N/A (or Bi film plating from separate solution) |
| Lifetime | Capillary: months; Mercury: per OSHA limits | Single plating per analysis or series | Surface lasts 1-5 runs before repolishing |
| Cleaning Protocol | Acid wash (0.1 M HNO3), water rinse, dry air purge | Anodic stripping in blank electrolyte at +0.5 V to remove film | Ultrasonic bath in water/ethanol post-polishing |
| Critical QC Check | Drop symmetry, regular drop size | Peak shape and reproducibility (RSD <5%) | Cyclic voltammetry of standard redox probe (e.g., 1 mM Fe(CN)₆³⁻/⁴⁻) |
Experimental Protocols
Protocol 3.1: HMDE Setup and Standard ASV for Trace Lead and Cadmium
Objective: Determine Pb²⁺ and Cd²⁺ concentrations in a simulated water sample using HMDE and Differential Pulse ASV (DPASV).
The Scientist's Toolkit:
| Reagent/Material | Function |
|---|---|
| 0.1 M Acetate Buffer (pH 4.5) | Provides consistent pH and ionic strength, complexes hydroxides. |
| 1000 mg/L Hg(II) Stock | Source for mercury drop formation in HMDE. |
| Oxygen-Free Nitrogen (N₂) Gas | Decxygenates solution to prevent O₂ reduction interference. |
| 1.0 g/L Standard Stock Solutions (Pb²⁺, Cd²⁺) | Primary standards for calibration. |
| 0.1 M KNO₃ | Supporting electrolyte for some protocols. |
| Triply Distilled Mercury | High-purity mercury for electrode. |
| 0.05 M HNO₃ (TraceMetal Grade) | For capillary and cell cleaning. |
Procedure:
- Cell Preparation: Clean the glass electrochemical cell with 10% HNO₃ (v/v, TraceMetal grade) for 24 hours, followed by repeated rinsing with ultrapure water (18.2 MΩ·cm).
- Electrode Assembly: Fill the HMDE capillary reservoir with triply distilled mercury. Prime the capillary according to manufacturer instructions to ensure no air bubbles are present.
- Solution Preparation: Pipette 10 mL of 0.1 M acetate buffer (pH 4.5) into the cell. Add an appropriate volume of sample or standard solution.
- Decxygenation: Purge the solution with oxygen-free N₂ gas for at least 10 minutes. Maintain a gentle N₂ blanket over the solution during the experiment.
- Preconcentration (Deposition): At the HMDE, form a new mercury drop. With solution stirring, hold the potential at -1.2 V vs. Ag/AgCl (KCl sat'd) for a selected time (e.g., 60-300 s) to reduce and amalgamate metal ions.
- Equilibration: Stop stirring and allow the solution to become quiescent for 15 seconds.
- Stripping Scan: Initiate a differential pulse voltammetric scan from -1.2 V to -0.2 V. Use a pulse amplitude of 50 mV, pulse width 50 ms, and scan rate 10 mV/s.
- Drop Disposal: Dispose of the mercury drop into the waste container.
- Calibration: Repeat steps 3-8 with standard additions of Pb²⁺ and Cd²⁺. Plot peak current (µA) vs. concentration (µg/L).
Protocol 3.2: In-situ Mercury Film Electrode (MFE) Preparation and Analysis
Objective: Form a mercury film on a glassy carbon rotating disk electrode (GCE-RDE) and perform simultaneous analysis of Cu, Pb, and Cd.
Procedure:
- Substrate Preparation: Polish the glassy carbon disk (3 mm diameter) sequentially with 1.0, 0.3, and 0.05 µm alumina slurry on a microcloth. Rigate thoroughly with ultrapure water and sonicate for 1 minute in ethanol, then water.
- Plating Solution: Use the sample or standard solution itself, spiked with Hg(II) to a final concentration of 200 mg/L. Ensure it is buffered to pH ~4.5 with acetate.
- In-situ Mercury Film Formation: Immerse the polished GCE into the stirred, deoxygenated plating/sample solution. Apply a potential of -1.2 V vs. Ag/AgCl for 300 s. Simultaneously, Hg²⁺ is reduced to form a thin film of Hg(0) on the GCE, while target metals co-deposit into the film.
- Equilibration: Stop rotation/stirring, wait 15 s.
- Stripping Scan: Perform a Square Wave ASV scan from -1.2 V to +0.1 V (Frequency: 25 Hz, Amplitude: 25 mV, Step Potential: 5 mV).
- Film Removal: After each measurement, hold the potential at +0.5 V for 60 s in a clean blank electrolyte to oxidively strip the mercury film and residual metals. Polish the electrode before the next film formation if performance degrades.
Protocol 3.3: Maintenance of Solid Electrodes (Glassy Carbon)
Objective: Restore the electrochemical activity of a fouled glassy carbon electrode.
Procedure:
- Mechanical Polishing: On a flat polishing pad, apply a slurry of 0.05 µm alumina powder in ultrapure water. Polish the electrode surface using a figure-8 pattern for 60 seconds. Apply minimal pressure.
- Rinsing: Rinse the electrode surface thoroughly with a jet of ultrapure water from a wash bottle to remove all alumina particles.
- Sonication: Submerge the electrode tip in an ultrasonic bath filled with ultrapure water for 60 seconds, then in ethanol for 60 seconds.
- Electrochemical Activation: In a clean cell with 0.1 M H₂SO₄, perform cyclic voltammetry from -0.5 V to +1.5 V vs. Ag/AgCl at 100 mV/s for 20-50 cycles until a stable, reproducible CV is obtained.
- QC Testing: Record a cyclic voltammogram in a solution of 1.0 mM K₃Fe(CN)₆ / 0.1 M KCl. The peak-to-peak separation (ΔEp) should be ≤ 70 mV at 50 mV/s.
Diagrams
Diagram Title: Electrode Selection Logic for Trace Metal ASV
Diagram Title: Generic ASV Workflow Steps and Data Output
Application Notes
Within trace metals research, the choice between Anodic Stripping Voltammetry (ASV) and Polarography is dictated by the complexity of the biological matrix. Serum, urine, and tissue homogenates present significant challenges including organic interferents, protein binding, and variable viscosity/ph. ASV offers superior sensitivity (ppb to ppt) and speciation capability, crucial for low-abundance metals in serum and tissues. Polarography, while less sensitive, provides robust qualitative analysis in less complex urine matrices. The core challenge is sample preparation to liberate metals without introducing contamination, followed by matrix-matched calibration to ensure accuracy.
Key Quantitative Comparison: ASV vs. Polarography for Trace Metals Table 1: Performance Metrics in Complex Matrices
| Parameter | Anodic Stripping Voltammetry (ASV) | Differential Pulse Polarography (DPP) |
|---|---|---|
| Typical Detection Limit | 0.01 – 0.1 ppb | 10 – 50 ppb |
| Optimal pH Range | 4.0 – 5.5 (Acetate Buffer) | 1.0 – 9.0 (Varies by metal) |
| Analysis Time per Sample | 3-5 min (incl. deposition) | 1-2 min |
| Suitability for Serum | High (with digestion) | Low-Moderate |
| Suitability for Urine | High (often direct) | High (often direct) |
| Suitability for Tissue | High (requires digestion) | Moderate (requires digestion) |
| Speciation Capability | Yes (via deposition potential) | Limited |
| Main Interference | Surface-active organics | Overlapping reduction peaks |
Experimental Protocols
Protocol 1: Acid Digestion of Serum & Tissue Homogenates for ASV
Objective: To mineralize organic matter and release protein-bound metals for accurate ASV determination.
- Sample Prep: Piper 1.0 mL of serum or 0.5 g of wet tissue homogenate into a pre-cleaned Teflon digestion vessel.
- Acid Addition: Add 3.0 mL of concentrated, ultra-pure HNO₃ (67%).
- Microwave Digestion: Seal vessels and digest using a stepped program: 10 min ramp to 150°C, hold 5 min; 10 min ramp to 200°C, hold 15 min.
- Cooling & Transfer: Cool to room temperature (< 30°C). Quantitatively transfer digestate to a 15 mL polypropylene tube.
- Evaporation & Reconstitution: Evaporate to near-dryness at 70°C under a Class-100 laminar flow hood. Reconstitute residue in 5.0 mL of supporting electrolyte (0.1 M Acetate Buffer, pH 4.6).
- Analysis: Proceed to ASV analysis using standard addition method.
Protocol 2: Direct Analysis of Urine by Differential Pulse ASV (DPASV)
Objective: For rapid determination of labile metal fractions in urine.
- Sample Prep: Centrifuge 10 mL of fresh urine at 4000 x g for 10 min to remove particulates.
- pH Adjustment: Piper 5.0 mL of supernatant into the electrochemical cell. Adjust pH to 4.6 ± 0.1 using 2.0 M ultrapure sodium acetate/acetic acid buffer.
- Decxygenation: Sparge with high-purity nitrogen gas for 300 seconds.
- DPASV Parameters:
- Deposition Potential: -1.2 V (vs. Ag/AgCl)
- Deposition Time: 90-180 s (stirred)
- Quiet Time: 15 s
- Scan Mode: Differential Pulse
- Pulse Amplitude: 50 mV
- Scan Rate: 20 mV/s
- Calibration: Employ standard addition with at least 3 spikes of certified metal standard.
Protocol 3: Matrix-Matched Calibration for Tissue Homogenates
Objective: To correct for matrix effects in tissue analysis.
- Prepare Blank Matrix: Use a certified metal-free tissue homogenate or simulate matrix with 5% (w/v) bovine serum albumin in 0.9% NaCl.
- Spike Standards: Into identical aliquots of blank matrix, add known concentrations of target metals (e.g., Cd, Pb, Cu) to span the expected sample range.
- Parallel Processing: Subject all calibration spikes and unknown samples to Protocol 1 simultaneously.
- Plot & Analyze: Plot ASV peak current vs. concentration for each metal. Use the resulting calibration curve to determine unknown concentrations, ensuring slope correction for matrix suppression/enhancement.
Visualizations
Workflow for Trace Metal Analysis
Matrix Interference Pathways in ASV
The Scientist's Toolkit
Table 2: Key Research Reagents & Materials
| Item & Specification | Function in Protocol |
|---|---|
| Ultra-Pure HNO₃ (TraceMetal Grade) | Primary digestion acid for organic matrix oxidation; minimizes background contamination. |
| Sodium Acetate Buffer (0.1 M, pH 4.6) | Supporting electrolyte for ASV; provides optimal pH and ionic strength. |
| Certified Aqueous Metal Standards (1000 ppm) | For calibration curves and standard addition quantification. |
| Nitrogen Gas (High Purity, >99.999%) | Decxygenation of solution to remove O₂ interference prior to ASV. |
| Boron-Doped Diamond (BDD) or Hg-Film Electrode | Working electrode for ASV; BDD avoids mercury use. |
| Ag/AgCl (KCl-sat'd) Reference Electrode | Provides stable reference potential in non-aqueous digests. |
| Teflon Microwave Digestion Vessels | Contain samples during high-temperature/pressure digestion; inert. |
| Metal-Free Polypropylene Tubes (15/50 mL) | For sample storage and handling to prevent exogenous metal introduction. |
| Bovine Serum Albumin (BSA, Fatty Acid-Free) | For preparing matrix-matched calibration standards for serum/tissue. |
| Ultrapure Water (18.2 MΩ·cm resistivity) | Preparation of all solutions to avoid ionic contaminants. |
This document provides critical application notes and protocols for a doctoral thesis investigating the comparative analytical performance of Anodic Stripping Voltammetry (ASV) and Polarography for trace metal analysis (e.g., Pb²⁺, Cd²⁺, Zn²⁺) in complex matrices relevant to environmental and pharmaceutical research. The core challenge in trace analysis is ensuring reproducible, contamination-free results. This work details the cleaning protocols essential for ASV's superior sensitivity and the standard addition method mandatory for matrix effect correction in both techniques.
Cleaning Protocols for Trace Metal Analysis
Critical Importance: For ASV, where pre-concentration occurs at the working electrode, even nanomolar contamination adsorbed on cell or electrode surfaces can cause significant false positives and high background noise. Polarography, while slightly less sensitive to surface contamination, still requires rigorous cleaning for reproducible diffusion-limited currents.
Detailed Electrode & Cell Cleaning Protocol
Objective: To achieve a contaminant-free surface for the working electrode (Mercury Film/Gold Disk for ASV; Dropping Mercury Electrode for Polarography) and the electrochemical cell.
Materials & Reagents:
- Nitric Acid (1M, trace metal grade): Primary oxidizing agent for dissolving metal contaminants.
- Ethanol (Absolute, HPLC grade): For removing organic impurities.
- High-Purity Deionized Water (18.2 MΩ·cm): For all rinsing and solution preparation.
- Nitrogen Gas (High Purity, O₂-free): For drying electrodes and deaerating solutions.
- Polishing Kit (for solid electrodes): Alumina slurry (0.05 µm and 0.3 µm) on microcloth pads.
Step-by-Step Procedure:
- Disassembly: Disassemble the electrochemical cell and remove the working electrode.
- Acid Bath Soak: Immerse all glassware, Teflon parts, and the solid working electrode (if applicable) in 1M HNO₃ for a minimum of 12 hours.
- Rinsing: Thoroughly rinse all components with copious amounts of high-purity deionized water (≥ 3 x 500 mL).
- Electrode Polishing (Solid Electrodes e.g., Au for ASV): On a clean microcloth, polish the electrode sequentially with 0.3 µm and 0.05 µm alumina slurry. Rinse thoroughly with water after each step.
- Organic Clean: Wipe all components with an ethanol-soaked, lint-free wipe, followed by a water rinse.
- Final Rinse & Dry: Perform a final rinse with high-purity water. Dry components in a laminar flow hood or under a stream of clean nitrogen gas.
- Validation: Perform a blank ASV scan (or polarogram) in supporting electrolyte only. A flat, featureless voltammogram confirms a clean system.
Standard Addition Calibration Methodology
Rationale: In complex sample matrices (e.g., serum, soil leachate, drug excipients), the sample background can enhance or suppress the analytical signal (matrix effect). The standard addition method compensates for these effects, providing accurate quantification.
Detailed Experimental Protocol for Standard Addition in ASV/Polarography
Objective: To determine the concentration of target trace metal (Mⁿ⁺) in an unknown sample (X) with matrix effect correction.
Procedure:
- Prepare the Sample Solution: Transfer a known volume (e.g., 10.0 mL) of the filtered, acid-digested unknown sample (X) into the cleaned electrochemical cell. Add a constant volume of supporting electrolyte (e.g., 1.0 mL acetate buffer, pH 4.5).
- De-aerate: Purge the solution with nitrogen gas for 10 minutes to remove dissolved oxygen.
- Analyze Original Sample: Perform the voltammetric scan (ASV: Deposition at -1.2V for 120s, Stripping scan; Polarography: DC scan from -0.2V to -1.0V). Record the peak current (iₚ,₀).
- First Standard Addition: Using a precision micropipette, add a small, known volume (Vₛ, e.g., 50 µL) of a standard solution of Mⁿ⁺ with known, high concentration (Cₛ, e.g., 1000 µg/L). Mix thoroughly.
- Re-analyze: De-aerate briefly (2 min) and perform the voltammetric scan again. Record the new, increased peak current (iₚ,₁).
- Repeat Additions: Repeat steps 4 and 5 at least two more times, for a total of 3-4 standard additions.
- Data Analysis: Plot the measured peak current (iₚ) versus the concentration of the added standard in the cell. Extrapolate the linear calibration line to the x-intercept. The absolute value of the x-intercept is the concentration of Mⁿ⁺ in the original sample solution.
Table 1: Standard Addition Data for Cadmium in Simulated Serum by ASV
| Std Addition # | Vₛ added (µL) | Calculated [Cd²⁺]added in cell (µg/L) | Peak Current, iₚ (µA) |
|---|---|---|---|
| 0 (Unknown) | 0 | 0.0 | 1.25 |
| 1 | 50 | 4.76 | 1.87 |
| 2 | 100 | 9.09 | 2.42 |
| 3 | 150 | 13.04 | 2.94 |
Note: Sample Volume = 10.0 mL, Cₛ = 1000 µg/L. Calculated unknown [Cd²⁺] from x-intercept: 5.2 µg/L.
The Scientist's Toolkit: Essential Reagents & Materials
Table 2: Key Research Reagent Solutions for Trace Metal Voltammetry
| Reagent/Material | Specification/Purpose | Critical Function |
|---|---|---|
| Supporting Electrolyte | 0.1 M Acetate Buffer (pH 4.5) or 0.1 M HNO₃/KNO₃ | Provides ionic strength, controls pH, and defines electrochemical window. |
| High-Purity Water | 18.2 MΩ·cm resistivity, < 5 ppb TOC | Serves as the universal solvent; purity is non-negotiable to prevent contamination. |
| Trace Metal Standards | 1000 mg/L certified single-element stock solutions (e.g., Pb, Cd, Zn in 2% HNO₃) | Used for instrument calibration and the standard addition method. |
| Mercury(II) Nitrate Solution | 1000 mg/L Hg²⁺ for Mercury Film Electrode (MFE) formation in ASV. | Plated in-situ onto a glassy carbon electrode to form the amalgam-working electrode. |
| Nitrogen Gas | High-Purity Grade (≥99.998%), fitted with O₂ scrubbing filter. | Removes dissolved oxygen, which interferes with the reduction of metal ions. |
| Alumina Polishing Slurries | 0.05 µm and 0.3 µm α-Al₂O₃ in high-purity water. | Renews the active surface of solid working electrodes, ensuring reproducible kinetics. |
| Nitric Acid (Cleaning Grade) | Purified by sub-boiling distillation or equivalent (e.g., Seastar Baseline). | Primary agent for dissolving and removing trace metal contaminants from all labware. |
Visualized Workflows
Title: Workflow for Standard Addition with Cleaning Validation
Title: Thesis Context: Reproducibility Pillars
Head-to-Head Comparison and Validation for Regulatory Compliance
Quantitative Comparison Table
| Parameter | Anodic Stripping Voltammetry (ASV) | Polarography (Differential Pulse) |
|---|---|---|
| Typical Sensitivity | Very High (nA/ppb) | Moderate (μA/ppm) |
| Limit of Detection (LOD) | 0.1 – 1.0 µg/L (ppb) for many metals (e.g., Cd, Pb) | 10 – 100 µg/L (ppb) for many metals |
| Analysis Speed | Slow (3-10 min/sample). Includes long deposition step (1-5 min). | Fast (1-2 min/sample). Direct measurement without preconcentration. |
| Instrument Cost | Moderate to High ($20k - $60k) for modern systems. | Low to Moderate ($10k - $30k) for basic systems. |
| Ease-of-Use | Moderate skill required. Electrode preparation (e.g., Hg film) and optimization of deposition time/potential are critical. | Relatively easy. Dropping Mercury Electrode (DME) provides renewable surface; simpler operational parameters. |
| Sample Volume | Small (1-20 mL) | Small (1-20 mL) |
| Multi-Element Analysis | Possible with careful potential control and electrode materials. | Possible, but less effective for very low concentrations. |
Note: Data synthesized from current manufacturer specifications and recent analytical chemistry literature (2023-2024). ASV’s superior LOD comes at the cost of speed and operational complexity.
Experimental Protocols
Protocol 1: Determination of Trace Lead (Pb²⁺) and Cadmium (Cd²⁺) in Water by ASV
Application Note: Ultra-trace metal analysis in pharmaceutical water or environmental samples. Materials: Glassy Carbon Working Electrode, Ag/AgCl Reference Electrode, Pt Counter Electrode, N₂ gas cylinder, 0.1 M Acetate Buffer (pH 4.5), Hg(II) standard solution (for in-situ film formation).
Procedure:
- Electrode Cleaning: Polish Glassy Carbon electrode with 0.05 µm alumina slurry on a microcloth for 60 seconds. Rinse thoroughly with deionized water.
- Mercury Film Formation (in-situ): Add Hg(II) to the sample/standard to a final concentration of 20 mg/L. Place cell on stirrer.
- Deposition Step: Immerse electrode system in 10 mL of degassed (5 min N₂ sparging) sample/buffer. Apply a deposition potential of -1.2 V vs. Ag/AgCl while stirring at 600 rpm for 180 seconds. This reduces and co-deposits Hg, Pb, and Cd onto the electrode.
- Equilibration: Stop stirring and wait 15 seconds.
- Stripping Step: Initiate the anodic scan from -1.2 V to +0.1 V using a Square Wave Voltammetry waveform (frequency: 25 Hz, amplitude: 25 mV, step potential: 5 mV). Dissolved oxygen removal is critical.
- Quantification: Measure peak currents at ~ -0.7 V (Cd) and ~ -0.5 V (Pb). Use standard addition method for quantification in complex matrices.
Protocol 2: Determination of Zinc (Zn²⁺) by Differential Pulse Polarography (DPP)
Application Note: Rapid screening of Zn in drug compound intermediates or supplements. Materials: Dropping Mercury Electrode (DME), SCE Reference Electrode, Pt Counter Electrode, 0.1 M Ammonium Chloride / Ammonia Buffer (pH 9.3).
Procedure:
- Solution Preparation: Add 1.0 mL of sample to 9.0 mL of supporting electrolyte (NH₄Cl/NH₃ buffer) in the polarographic cell. Deoxygenate with N₂ for 3 minutes.
- Instrument Setup: Set DME parameters (drop time: 0.5 s). Set DPP parameters: scan range = -1.0 to -1.4 V, pulse amplitude = 50 mV, pulse duration = 50 ms, scan rate = 5 mV/s.
- Measurement: Start the scan. The Zn reduction peak will appear at approximately -1.25 V vs. SCE in this medium.
- Analysis: Record peak height. Construct a calibration curve using standard additions of Zn(II) stock solution. No deposition step is required.
Diagram: Decision Workflow for Technique Selection
Title: Technique Selection Workflow for Trace Metal Analysis
The Scientist's Toolkit: Essential Reagents & Materials
| Item | Function in Experiment | Critical Note |
|---|---|---|
| Glassy Carbon Electrode | Working electrode for ASV. Provides inert surface for mercury film formation and analyte deposition. | Requires meticulous polishing before each film formation to ensure reproducibility. |
| Dropping Mercury Electrode (DME) | Working electrode for Polarography. Provides continuously renewed, identical Hg surface for each measurement. | Eliminates passivation/fouling issues common in solid electrodes. |
| Ag/AgCl (3M KCl) Reference Electrode | Provides a stable, known potential reference for voltammetric cell. | Essential for both ASV and DPP. Must be checked for clogging and electrolyte level. |
| High-Purity Mercury (Triple Distilled) | Used to create Hg film electrodes (ASV) or as the electrode material in DME. | Purity is paramount to avoid background contamination, especially for Zn/Cd analysis. |
| Supporting Electrolyte (e.g., Acetate Buffer) | Carries current, fixes pH, minimizes migration current, and can complex interfering ions. | Choice depends on target analytes (e.g., acetate for Pb/Cd, ammonia buffer for Zn). |
| Oxygen Scavenger (Nitrogen or Argon Gas) | Removes dissolved O₂, which causes large interfering reduction currents in the cathodic region. | Must be "oxygen-free" grade. Sparging time (3-5 min) is critical for baseline stability. |
| Standard Addition Stocks (1000 ppm Metal Ions) | Used for the method of standard additions, the preferred quantification technique in complex matrices. | Must be in the same acid matrix (e.g., 2% HNO₃) and traceable to NIST standards. |
| Alumina Polishing Suspension (0.05 µm) | For abrasive polishing of solid electrodes (Glassy Carbon) to a mirror finish. | Sequential polishing with different grit sizes (1.0, 0.3, then 0.05 µm) is often necessary. |
The validation of analytical procedures is a regulatory cornerstone for drug substance and product impurity profiling. While high-performance liquid chromatography (HPLC) dominates organic impurity analysis, the quantification of trace elemental impurities—catalysts (e.g., Pd, Pt) or leachables—requires highly sensitive techniques. This application note frames validation within a thesis comparing Anodic Stripping Voltammetry (ASV) and Polarography for trace metal determination in pharmaceuticals. Both are electromalytical techniques offering parts-per-billion (ppb) sensitivity, but with distinct advantages concerning complexity, cost, and compliance with ICH Q2(R1).
ICH Q2(R1) Validation Parameters: Application to Voltammetric Techniques
ICH Q2(R1) defines key validation characteristics. Their interpretation for impurity testing of trace metals via ASV or Polarography is summarized below.
Table 1: Validation Parameters for Trace Metal Impurity Testing by ASV/Polarography
| Validation Characteristic | Objective in Trace Metal Analysis | Typical ASV Protocol | Typical Polarographic Protocol |
|---|---|---|---|
| Specificity/Selectivity | Ability to determine the target metal in presence of matrix, other metals, or supporting electrolyte. | Use standard addition method; check for overlapping stripping peaks. | Utilize differential pulse mode to resolve adjacent reduction waves. |
| Linearity & Range | Proportionality of signal to analyte concentration over the intended range (e.g., 0.1-150% of specification limit). | 5-7 concentrations across range, e.g., 1, 25, 50, 100, 125 ppb. Plot peak current (µA) vs. concentration (ppb). | As per ASV. Plot diffusion current (µA) vs. concentration (ppb). |
| Accuracy (Recovery) | Closeness of measured value to true value (spiked known amount). | Spike placebo/API at LOQ, 50%, 100%, 150% of spec. Average recovery: 85-115%. | Identical to ASV. |
| Precision | 1. Repeatability: Same analyst, same day.2. Intermediate Precision: Different days, analysts, instruments. | 6 independent prep at 100% spec level. RSD ≤ 15% at LOQ, ≤ 10% above. | Identical to ASV. |
| Detection Limit (DL) | Lowest concentration detectable but not necessarily quantifiable. | Signal-to-Noise ≥ 3. Or: 3.3*σ/S (σ=std dev of blank, S=slope). | Identical to ASV. |
| Quantitation Limit (QL) | Lowest concentration quantifiable with suitable precision/accuracy. | Signal-to-Noise ≥ 10. Or: 10*σ/S. Must demonstrate precision (RSD ≤ 20%) and accuracy (80-120%). | Identical to ASV. |
| Robustness | Capacity to remain unaffected by small, deliberate variations in method parameters. | Vary deposition time (±10%), deposition potential (±50 mV), electrolyte pH (±0.5), purge time (±10%). | Vary drop time, pulse amplitude, scan rate (±10%). |
Detailed Experimental Protocols
Protocol 3.1: Instrumental Setup & Calibration for ASV
Methodology for Trace Lead (Pb) in a Drug Substance
- Principle: Pre-concentration of Pb²⁺ onto a working electrode (Hg film or glassy carbon) by cathodic reduction to Pb(0), followed by anodic stripping (re-oxidation) with current measurement.
- Reagents: High-purity deionized water (18.2 MΩ·cm), nitric acid (trace metal grade), mercury(II) acetate (for film formation), acetate buffer (pH 4.5), Pb standard solution (1000 ppm).
- Apparatus: Voltammetric analyzer with three-electrode cell (Glassy Carbon Working Electrode, Ag/AgCl Reference, Pt Counter), magnetic stirrer, nitrogen purge.
- Procedure:
- Electrode Preparation: Clean glassy carbon electrode. Generate in-situ mercury film by adding Hg²⁺ to sample and co-depositing with Pb.
- Sample Preparation: Digest 0.5 g API in 5 mL 1% HNO₃, dilute to 50 mL with acetate buffer.
- Deaeration: Purge with N₂ for 300 seconds.
- Deposition: Apply -1.0 V vs. Ag/AgCl while stirring for 120 seconds.
- Equilibration: Stop stirring, wait 15 seconds.
- Stripping Scan: Sweep potential from -1.0 V to -0.2 V using Differential Pulse waveform (pulse amplitude 50 mV, step potential 4 mV).
- Measurement: Record peak current (µA) at ~ -0.55 V.
- Calibration: Perform Standard Addition by spiking sample aliquot with known volumes of Pb standard.
Protocol 3.2: Method Validation - Linearity & QL Determination
- Procedure:
- Prepare a series of at least 5 standard solutions in supporting electrolyte (e.g., 0.1 M HCl) spanning the range from below QL to 150% of specification limit.
- Analyze each solution in triplicate according to Protocol 3.1.
- Plot mean peak current (y-axis) versus concentration (x-axis). Perform linear regression.
- Acceptance Criteria: Correlation coefficient (r) ≥ 0.995. Residuals randomly scattered.
- To determine QL, prepare a solution at the estimated QL (e.g., via 10*σ/S). Analyze six independent preparations. RSD of the peak current must be ≤ 20% and mean accuracy within 80-120%.
Visualization: Workflow & Decision Logic
Diagram Title: Validation Workflow for Trace Metal Assay
The Scientist's Toolkit: Key Research Reagent Solutions
Table 2: Essential Materials for Trace Metal Analysis by Voltammetry
| Item | Function & Importance | Typical Specification/Grade |
|---|---|---|
| Supporting Electrolyte | Provides ionic conductivity, fixes pH, can complex interfering ions. Critical for peak shape and potential. | High-Purity Salts (e.g., KCl, Acetate Buffer) in Trace Metal Grade. |
| Mercury Standard Solution | For forming the working electrode film in ASV. The quality dictates background noise and reproducibility. | 1000 ppm Hg(II) in 2% HNO₃, Traceable Certified Reference Material (CRM). |
| Single-Element Metal Standards | For calibration, standard addition, and accuracy (recovery) studies. | 1000 ppm or 10 ppm in 2-5% HNO₃, Certified Reference Material (CRM). |
| Ultra-Pure Acids | For sample digestion and cleaning of labware to prevent contamination. | HNO₃, HCl, "TraceSELECT" or equivalent for ultra-trace analysis. |
| High-Purity Deionized Water | Solvent for all solutions. Contaminants directly affect baseline and LOD. | Resistivity ≥ 18.0 MΩ·cm at 25°C, filtered through 0.22 µm membrane. |
| Nitrogen Gas (Purge) | To remove dissolved oxygen, which causes interfering reduction currents. | High-Purity Grade (≥ 99.998%) with inline oxygen scrubber. |
| Working Electrode | Site of analyte deposition and stripping. Choice (Hg-film, HMDE) dictates sensitivity and applicability. | Glassy Carbon, Rotating Disk, or Static Mercury Drop Electrode, polished/clean. |
| Placebo Matrix | Mimics the drug product composition without the API. Essential for validation of accuracy in the correct matrix. | Must contain all excipients at representative ratios, pre-screened for target metals. |
Within the broader investigation comparing Anodic Stripping Voltammetry (ASV) and Polarography for trace metals research, a critical challenge is the validation of electrochemical data, particularly at ultra-trace levels (< 1 ppb). This case study details the complementary use of Inductively Coupled Plasma Mass Spectrometry (ICP-MS) as a definitive cross-verification technique. While ASV offers excellent sensitivity, portability, and speciation capability, and polarography provides foundational voltammetric data, ICP-MS delivers unparalleled multi-element detection limits and isotopic information. The synergistic use of these techniques establishes a robust framework for method validation and data credibility in pharmaceutical impurity profiling and environmental monitoring of toxic metals like Pb, Cd, and As.
Key Experimental Protocol: Cross-Verification of Trace Lead (Pb) in Pharmaceutical Grade Calcium Carbonate
A. Sample Preparation (Common to ASV & ICP-MS)
- Digestion: Accurately weigh 0.5 g of calcium carbonate powder into a PTFE digestion vessel.
- Add 8 mL of concentrated, ultrapure HNO₃ (69%) and 2 mL of ultrapure H₂O₂ (30%).
- Perform microwave-assisted acid digestion using a validated program (e.g., ramp to 180°C over 15 min, hold for 20 min).
- Cool, transfer the digestate to a 50 mL polypropylene volumetric flask, and dilute to mark with 18.2 MΩ·cm deionized water.
- Prepare a 1:10 dilution of this stock for ASV analysis to reduce matrix interference.
B. Anodic Stripping Voltammetry (ASV) Analysis
- Instrument: Computer-controlled potentiostat with a three-electrode system: Thin mercury film or bismuth film working electrode, Ag/AgCl reference electrode, Pt wire counter electrode.
- Supporting Electrolyte: Transfer 10 mL of diluted sample into the electrochemical cell. Add 1.0 mL of 0.5 M acetate buffer (pH 4.5) and 100 µL of 1000 ppm Hg(II) (if forming a Hg film).
- Deposition: Purge with N₂ for 300 seconds. Apply a deposition potential of -1.2 V vs. Ag/AgCl while stirring for 180 seconds.
- Equilibration: Stop stirring and allow solution to equilibrate for 15 seconds.
- Stripping: Initiate a square-wave anodic scan from -1.2 V to -0.1 V. Parameters: frequency 25 Hz, step potential 5 mV, amplitude 25 mV.
- Quantification: Use the standard addition method. Perform three successive spikes of a certified Pb standard (e.g., 10 ppb each). Plot peak current vs. concentration.
C. ICP-MS Analysis for Verification
- Instrument: Quadrupole ICP-MS with collision/reaction cell (e.g., He mode) to mitigate polyatomic interferences.
- Tuning: Optimize instrument daily for sensitivity (Li, Y, Tl), oxide ratio (CeO⁺/Ce⁺ < 2%), and doubly charged ratio (Ba²⁺/Ba⁺ < 3%).
- Analysis: Introduce the original sample digestate (from Step A4) via peristaltic pump and nebulizer.
- Isotopes Monitored: ²⁰⁸Pb (primary), ²⁰⁶Pb (secondary). Include ¹¹⁵In as an internal standard to correct for signal drift and matrix suppression.
- Calibration: Use external calibration with matrix-matched standards (0, 0.1, 0.5, 2.0, 10.0 ppb) in 2% HNO₃.
Data Presentation & Comparative Analysis
Table 1: Cross-Verification Results for Lead (Pb) in Calcium Carbonate (n=5)
| Method | Principle | LOD (ppb) | Measured [Pb] (mean ± SD, ppb) | % RSD | Spiked Recovery (%) |
|---|---|---|---|---|---|
| ASV (Square-Wave) | Electro-oxidation of pre-concentrated metal | 0.05 | 3.42 ± 0.18 | 5.3 | 98.5 |
| ICP-MS (He-KED) | Ionization & mass separation | 0.001 | 3.38 ± 0.07 | 2.1 | 101.2 |
Table 2: Complementary Strengths in Trace Metal Analysis
| Aspect | ASV/Polarography | ICP-MS | Complementary Benefit |
|---|---|---|---|
| Detection Limit | Excellent (sub-ppb) | Exceptional (sub-ppt) | ICP-MS validates ultra-trace ASV data. |
| Speciation | Yes (via potential shift) | Limited (requires hyphenation) | ASV identifies labile species; ICP-MS quantifies total. |
| Matrix Tolerance | Low (requires buffer) | High (with dilution/cell) | ICP-MS verifies ASV results in complex matrices. |
| Sample Throughput | Moderate (minutes/sample) | High (seconds/sample) | ICP-MS rapidly screens samples for ASV detail. |
| Portability | Yes (field deployable) | No (lab-bound) | ASV for field screening; ICP-MS for lab confirmation. |
The Scientist's Toolkit: Key Research Reagent Solutions
Table 3: Essential Materials for Cross-Verification Workflow
| Item | Function | Critical Specification |
|---|---|---|
| Ultrapure HNO₃ (69%) | Sample digestion and acidification for ICP-MS. | Trace metal grade, < 1 ppt Pb background. |
| Acetate Buffer (pH 4.5) | Provides consistent pH and ionic strength for ASV. | Prepared from CH₃COONa and CH₃COOH, purified by Chelex resin. |
| Certified Single-Element Standard (e.g., Pb) | Calibration for both ASV (standard addition) and ICP-MS. | 1000 mg/L in 2% HNO₃, NIST-traceable. |
| Internal Standard Mix (e.g., ¹¹⁵In) | Corrects for signal drift in ICP-MS. | Added online via a T-connector to all samples/calibrants. |
| Bismuth or Mercury Film Precursor | Forms the working electrode film for ASV. | Bi(III) salt preferred for eco-friendly, non-toxic operation. |
| Tuning Solution (Li, Y, Tl, Ce) | Daily performance optimization of ICP-MS. | 1 ppb in 2% HNO₃. |
| High-Purity Calcium Carbonate Blank | Method validation and background subtraction. | Certified reference material or highest purity lab grade. |
Visualized Workflows
Workflow for ASV & ICP-MS Cross-Verification
Logical Case Study Context within Thesis
Within trace metals research, particularly in environmental monitoring, biomedical analysis, and drug development, the choice between Anodic Stripping Voltammetry (ASV) and Polarography is pivotal. This document provides a structured decision matrix and detailed protocols to guide researchers in selecting the optimal electrochemical technique based on specific analytical requirements.
Comparative Decision Matrix
Table 1: Core Technical and Performance Comparison
| Parameter | Anodic Stripping Voltammetry (ASV) | Classical Polarography (DCP) | Modern Polarography (DPP) |
|---|---|---|---|
| Detection Limit | 0.01 – 0.1 µg/L (ppb) | 1 – 10 µg/L (ppb) | 0.1 – 1 µg/L (ppb) |
| Working Electrode | Static Hg drop, Hg film, Bi-film | Dropping Mercury Electrode (DME) | Static Mercury Drop Electrode (SMDE) |
| Analytical Time | Longer (pre-conc. required) | Moderate to Fast | Moderate |
| Resolution (Peak Sep.) | High (narrow peaks) | Low (broad waves) | Moderate to High |
| Sample Volume | Small (5-20 mL) | Larger (>20 mL) | Moderate (10-20 mL) |
| Primary Advantage | Ultra-trace analysis, multi-element | Wide potential window, renewable surface | Improved sensitivity over DCP |
| Key Limitation | Matrix effects, electrode fouling | Poor sensitivity, Hg consumption | Still lower sensitivity than ASV |
| Ideal Use Case | Regulatory compliance (EPA, WHO) for Pb, Cd in water; biomonitoring | Educational studies, fundamental redox potential measurement | Analysis of organic molecules with electroactive groups |
Table 2: Decision Matrix for Research Questions
| Research Question / Goal | Recommended Technique | Rationale |
|---|---|---|
| Ultra-trace detection of Pb²⁺ in drinking water (<1 ppb) | ASV | Unmatched sensitivity at sub-ppb levels required by regulations. |
| Speciation analysis of Cu(I) vs. Cu(II) | ASV with varied deposition potential | Different oxidation states can be selectively pre-concentrated. |
| High-throughput screening of metal impurities in drug excipients | DPP | Good compromise between speed, sensitivity, and automation. |
| Studying reversible redox thermodynamics of a metal complex | DCP | Provides excellent qualitative data on reversibility and E₁/₂. |
| Analysis in complex, protein-rich matrices (e.g., serum) | ASV with Bi-film electrode | Bi-film avoids Hg toxicity concerns and minimizes fouling. |
| Educational demonstration of Ilkovič equation principles | DCP | Directly illustrates the relationship between current and drop time. |
Detailed Experimental Protocols
Protocol 1: ASV for Trace Lead (Pb) and Cadmium (Cd) in Water (EPA Method 7472)
- Objective: Quantify Pb and Cd in drinking water at ppb levels.
- Reagents: 1. Supporting Electrolyte: 0.1 M Acetate Buffer (pH 4.5). 2. Standard Stock Solutions: 1000 mg/L of Pb²⁺ and Cd²⁺. 3. High-Purity Deionized Water (18.2 MΩ·cm). 4. Oxygen Scavenger: High-purity Nitrogen or Argon gas.
- Equipment: Potentiostat, Mercury Film Electrode (MFE) or Rotating Disc Electrode, Ag/AgCl reference electrode, Pt counter electrode.
- Procedure:
- Sample Prep: Mix 10 mL of filtered sample with 10 mL of 0.1 M acetate buffer.
- Decxygenation: Purge the solution with N₂ for 10 minutes.
- Pre-concentration: Deposit at -1.2 V vs. Ag/AgCl while stirring for 60-300 seconds.
- Equilibration: Stop stirring, wait 15 seconds.
- Stripping Scan: Apply a positive potential sweep from -1.2 V to -0.2 V using Square Wave Voltammetry (frequency: 25 Hz, amplitude: 25 mV, step: 5 mV).
- Calibration: Repeat with standard additions of Pb²⁺ and Cd²⁺.
- Data Analysis: Measure peak currents at ~ -0.5 V (Cd) and ~ -0.3 V (Pb). Plot standard addition curve to determine original concentration.
Protocol 2: Differential Pulse Polarography (DPP) for Zinc in Pharmaceutical Formulations
- Objective: Determine zinc content in a multivitamin tablet.
- Reagents: 1. Supporting Electrolyte: 1 M Ammonium Chloride / Ammonia Buffer (pH 9). 2. Zn Standard Solution. 3. Tablet digestate (in 0.1 M HNO₃, neutralized).
- Equipment: Potentiostat with DPP capability, Static Mercury Drop Electrode (SMDE).
- Procedure:
- Sample Prep: Digest a powdered tablet in dilute HNO₃, dilute to volume with supporting electrolyte.
- Decxygenation: Purge with N₂ for 5 minutes.
- DPP Parameters Set: Initial potential: -1.0 V, Final potential: -1.5 V. Pulse amplitude: 50 mV. Pulse duration: 50 ms. Scan rate: 2 mV/s.
- Run Analysis: Record the DPP polarogram.
- Calibration: Record polarograms for a series of Zn standards.
- Data Analysis: Measure peak height at approximately -1.33 V. Construct a calibration curve of peak height vs. concentration.
Visualization of Workflow and Logic
Diagram Title: Decision Workflow for ASV vs. Polarography
Diagram Title: Core Workflow Comparison: ASV vs DPP
The Scientist's Toolkit: Essential Research Reagent Solutions
Table 3: Key Reagents and Materials for Electrochemical Trace Metal Analysis
| Item | Function/Description | Primary Use Case |
|---|---|---|
| High-Purity Mercury (Triple Distilled) | Forms the working electrode droplet or film. Essential for its high hydrogen overpotential and renewable surface. | DME, SMDE, Hg-film electrodes for ASV. |
| Bismuth Nitrate | Source of Bi³⁺ to form a bismuth-film electrode (BiFE). A non-toxic alternative to Hg with similar performance. | ASV in environmental and biomedical labs. |
| Acetate Buffer (pH 4.5) | Common supporting electrolyte for ASV. Provides optimal pH for deposition of many trace metals (Cd, Pb, Zn). | ASV analysis of heavy metals in water. |
| Ammonium Chloride/Ammonia Buffer | Supporting electrolyte for metals that form stable amine complexes (e.g., Zn, Cd). | Polarographic analysis of zinc. |
| Standard Reference Materials (SRMs) | Certified materials (e.g., NIST 1640a - Trace Elements in Water) for method validation and calibration. | Quality control/assurance for both ASV & polarography. |
| Ultrapure Acids & Water | For cleaning glassware, preparing standards, and digesting samples to prevent contamination. | All trace-level analyses. |
| Oxygen Scavenging Gas (N₂/Ar) | Removes dissolved O₂, which interferes by reducing at the electrode, causing large background current. | Mandatory pre-step for both techniques. |
| Chelating Resins | Used for pre-concentration or matrix separation (e.g., removing NaCl from seawater samples). | ASV analysis in high-ionic-strength matrices. |
This document provides application notes and protocols for advanced electroanalytical techniques, framed within a thesis comparing Anodic Stripping Voltammetry (ASV) and Polarography for trace metals research. While polarography, with its dropping mercury electrode (DME), established the foundation for trace metal analysis, modern demands for sensitivity, throughput, and field-deployability have driven the evolution towards sophisticated ASV systems. The integration of ASV with microfluidic lab-on-a-chip devices and full automation represents the current frontier, offering unparalleled advantages in drug development (e.g., metallodrug analysis, impurity screening), environmental monitoring, and clinical diagnostics.
Comparative Data: ASV vs. Polarography
Table 1: Key Performance Metrics for Trace Metal Detection
| Parameter | Classical Polarography (DME) | Modern ASV (Stationary Electrode) | Automated Microfluidic ASV System |
|---|---|---|---|
| Typical Detection Limit | 10⁻⁶ – 10⁻⁸ M | 10⁻⁹ – 10⁻¹¹ M | 10⁻¹¹ – 10⁻¹³ M |
| Analysis Time | 5-10 minutes per sample | 3-5 minutes per sample | < 2 minutes per sample (with automation) |
| Sample Volume | 1-10 mL | 0.5-5 mL | 1-100 µL |
| Multiplexing Capability | Low | Moderate | High (parallel channel analysis) |
| Field Deployability | Low | Moderate | High (portable, integrated systems) |
| Key Advantage | Wide potential window, renewable surface | Exceptional sensitivity for metals | Ultra-low volume, high throughput, minimal user intervention |
Table 2: Application in Drug Development Research
| Analysis Target | Polarography Suitability | ASV/Microfluidic ASV Suitability | Primary Rationale |
|---|---|---|---|
| Catalytic Metal Impurities (e.g., Pd, Pt) | Moderate (less sensitive) | High | Superior sensitivity for low-ppb impurity detection in APIs. |
| Metallodrug Pharmacokinetics | Low | High | Ability to measure ultra-trace metal concentrations in biological fluids (serum, urine). |
| Disintegration Testing (Metal Release) | Possible | High | Real-time, automated monitoring of metal ion release from implants or nanocarriers. |
Experimental Protocols
Protocol 1: Automated ASV Determination of Lead (Pb) in Synthetic Serum using a Microfluidic Chip
This protocol details the operation of a commercial microfluidic ASV system (e.g., Metrohm DropSens μStat) for bioanalysis.
I. Research Reagent Solutions & Materials
| Item | Function |
|---|---|
| Acetate Buffer (0.1 M, pH 4.5) | Supporting electrolyte; optimizes deposition efficiency for Pb/Cd. |
| Gold Nanoparticle-modified Screen-Printed Electrode (SPE) | Disposable, integrated microfluidic cell working electrode; enhances surface area and sensitivity. |
| Internal Standard (e.g., 50 ppb Bi³⁺) | Corrects for variability in deposition efficiency between runs. |
| Standard Additions Stock (Pb²⁺, 1000 ppm) | For calibration via standard addition method in complex matrices. |
| Ultrapure Water (18.2 MΩ·cm) | Prevents contamination in trace analysis. |
| Synthetic Serum Matrix | Simulates sample matrix for method validation. |
II. Procedure
- System Priming: Load the microfluidic chip (integrated SPE) into the automated reader. Using the syringe pump module, prime the fluidic channel with 50 µL of acetate buffer at a flow rate of 10 µL/s.
- Sample Introduction: Aspirate 20 µL of filtered synthetic serum sample spiked with internal standard into the sample loop. Inject into the buffer stream, allowing it to reach the electrochemical cell.
- Automated Analysis Sequence: a. Pre-concentration/Deposition: Apply a potential of -1.2 V vs. Ag/AgCl reference on the SPE for 120 seconds with solution stirring (via integrated micro-mixer). b. Equilibration: Stop stirring and equilibrate for 10 seconds at -1.2 V. c. Stripping Scan: Perform a square-wave anodic stripping voltammetry scan from -1.2 V to +0.1 V. Key parameters: Frequency: 25 Hz, Step Potential: 4 mV, Amplitude: 25 mV. d. Electrode Cleaning: Apply a potential of +0.5 V for 30 seconds to clean the electrode.
- Calibration: Repeat the sequence (Steps 2-3) for the sample spiked with at least three standard additions of Pb²⁺.
- Data Analysis: The instrument software automatically plots stripping peak current (at ~ -0.5 V for Pb) vs. standard addition concentration. The x-intercept gives the sample concentration, corrected by the internal standard response.
Protocol 2: Comparative Study: Cadmium (Cd) Detection by Differential Pulse Polarography (DPP) vs. ASV
This protocol is designed for a thesis chapter directly comparing the two techniques.
I. Materials
- Polarograph with Dropping Mercury Electrode (DME), hanging mercury drop electrode (HMDE) or static mercury drop electrode (SMDE) for ASV, and a common Ag/AgCl reference and Pt counter electrode.
- Nitrogen gas for deaeration.
- Standard Cd²⁺ solution (100 ppm) in 0.1 M HCl.
II. Procedure for DPP (Polarography)
- Cell Preparation: Add 10 mL of 0.1 M HCl supporting electrolyte to the polarographic cell. Deaerate with N₂ for 10 minutes.
- Background Scan: Using the DME, run a DPP scan from -0.2 V to -1.0 V. Parameters: Drop time: 1 s, Pulse amplitude: 50 mV, Scan rate: 2 mV/s.
- Standard Additions: Add sequential aliquots of Cd²⁺ standard to achieve concentrations of 5, 10, and 20 µM in the cell. Deaerate briefly after each addition and record the DPP wave.
- Measurement: Record the peak current height at approximately -0.65 V for each concentration.
III. Procedure for ASV (using SMDE)
- Cell Preparation: Use the same cell and electrolyte as in Step II.1.
- Pre-concentration: At the SMDE, apply a deposition potential of -1.0 V for 180 seconds with stirring.
- Equilibration: Stop stirring and equilibrate for 15 seconds.
- Stripping Scan: Perform a linear sweep anodic stripping from -1.0 V to -0.2 V at a scan rate of 50 mV/s.
- Standard Additions & Measurement: Repeat Steps 2-4 for the same standard addition series. Measure the stripping peak current at approximately -0.65 V.
- Cleaning: Hold the potential at -0.2 V for 60 seconds with stirring to re-dissolve residual Cd.
Visualization of Systems & Workflows
Diagram 1: Automated Microfluidic ASV System
Diagram 2: Comparative Experiment Workflow
Diagram 3: Electroanalysis Evolution Path
Conclusion
Both Anodic Stripping Voltammetry and Polarography remain indispensable, yet distinctly different, tools in the analytical arsenal for trace metal analysis. ASV, with its superior sensitivity via preconcentration, is often the method of choice for ultratrace monitoring of toxic metals in biological systems or for compliance testing where detection limits are paramount. Modern polarographic techniques, particularly in differential pulse modes, offer robust, reliable quantification for specific applications like metal impurity profiling in APIs. The optimal choice hinges on the specific metal, required detection limit, sample matrix, and regulatory context. For biomedical research, the future lies in the miniaturization and integration of these electrochemical principles into point-of-care sensors and high-throughput screening platforms, enabling real-time monitoring of metal biomarkers and metallodrugs, thereby accelerating discoveries in metallomics and personalized medicine.