Advanced Thallium Detection: Harnessing Underpotential Deposition at Gold-Film Electrodes for Biomedical and Environmental Applications
This article provides a comprehensive examination of the determination of thallium using underpotential deposition (UPD) at gold-film electrodes, a highly sensitive and selective electroanalytical technique.
Advanced Thallium Detection: Harnessing Underpotential Deposition at Gold-Film Electrodes for Biomedical and Environmental Applications
Abstract
This article provides a comprehensive examination of the determination of thallium using underpotential deposition (UPD) at gold-film electrodes, a highly sensitive and selective electroanalytical technique. Tailored for researchers and scientists in analytical chemistry and drug development, the content explores the foundational principles of Tl UPD, contrasting its behavior on bulk gold versus nanostructured surfaces. It details methodological workflows for sensor fabrication and application in complex matrices like water and food, alongside robust troubleshooting and optimization strategies for interference management and signal enhancement. The discussion extends to the validation of analytical procedures against certified reference materials and a critical comparison with established spectroscopic methods, highlighting the advantages of UPD for portable, low-cost thallium monitoring crucial for public health and clinical research.
Principles and Electrode Behavior: Understanding Thallium Underpotential Deposition on Gold Surfaces
Fundamental Theory of Underpotential Deposition (UPD) and Its Significance for Thallium
Underpotential deposition (UPD) is a fundamental electrochemical phenomenon where a metal ion is deposited onto an electrode surface at a potential more positive than its equilibrium (Nernst) potential for bulk deposition [1] [2]. This process occurs due to a stronger adatom–substrate interaction than adatom–adatom interaction, leading to the formation of a stable monolayer on the dissimilar metal surface [2] [3]. The UPD effect is governed by the thermodynamic principle: ΔGUPD = -nFΔEUPD, where ΔEUPD represents the underpotential shift, providing a quantitative measure of the adsorbate-substrate binding energy. This fundamental interfacial process enables precise control at the nanoscale and serves as a powerful tool for designing and modifying electrode surfaces for analytical applications, including the detection of ultra-trace toxic metals such as thallium [2].
Fundamental Theory and Principles of UPD
The theoretical foundation of UPD rests upon the difference in work functions between the substrate (e.g., Au, Pt) and the depositing metal ion. The underpotential shift, ΔEUPD, is experimentally observed as separated voltammetric peaks corresponding to monolayer formation prior to the bulk deposition signal. The UPD process is characterized by several key features:
- Stoichiometric Monolayer Formation: UPD typically results in a single, ordered atomic layer of the deposited metal, with the surface coverage precisely controllable by the applied potential and charge passed [3].
- Substrate-Dependent Structure: The adlayer structure adopted (e.g., (√3 × √3)R30° on Au(111)) differs from the bulk crystal structure of the depositing metal and is dictated by the atomic arrangement of the substrate [3].
- Surface Alloying and Rearrangement: UPD can induce significant surface reorganization in bimetallic systems. Recent studies demonstrate that Pb UPD on Ag-rich AgAu surfaces induces a swap of Ag atoms with underlying Au atoms to form a Au-rich layer beneath the Pb monolayer [2].
The UPD process provides an exceptionally sensitive probe of surface composition and structure, making it invaluable for both surface characterization and the development of advanced electrochemical sensors.
UPD in Electroanalysis and Sensor Development
In electroanalytical chemistry, UPD serves two primary functions: as a surface probe for characterizing electrode materials and as a sensitization method for enhancing analytical performance. The UPD-modified surfaces exhibit altered electronic properties, work function, and chemical reactivity that can be exploited to improve the detection of challenging analytes [3]. For instance, silver UPD on gold substrates has been shown to significantly change the structural and interfacial properties of self-assembled monolayers (SAMs), affecting their wettability and molecular orientation [3]. These modifications can be strategically employed to create electrodes with enhanced selectivity and sensitivity for specific applications, including environmental monitoring of priority pollutants like thallium [4].
Significance of UPD for Thallium Determination
The Thallium Analysis Challenge
Thallium is an extremely toxic heavy metal, with toxicity exceeding that of mercury, cadmium, and lead [5] [6]. Its status as a "poisoner's poison" stems from being tasteless, odorless, and water-soluble, making its detection analytically challenging yet critically important [4]. Environmental contamination arises from industrial processes like smelting, mining, and coal combustion, with global emissions reaching up to 5000 tons annually [5]. The U.S. Environmental Protection Agency (EPA) has set a maximum contaminant level of 2 µg/L for drinking water, with some regions implementing stricter limits as low as 0.1 µg/L [7] [5]. These regulatory demands necessitate highly sensitive analytical methods capable of detecting thallium at trace and ultra-trace levels.
UPD-Enhanced Thallium Sensing Strategies
UPD contributes significantly to advancing thallium electroanalysis through several mechanisms:
- Signal Amplification: UPD-based sensitization enables ultra-trace detection, with methods achieving limits of detection as low as 8×10⁻¹¹ mol L⁻¹ (approximately 0.016 µg/L) for Tl(I) [8], well below stringent regulatory limits.
- Interference Mitigation: The selective deposition inherent to UPD processes reduces interference from other metal ions, improving measurement accuracy in complex matrices like environmental waters and biological samples [8] [6].
- Surface Engineering: UPD allows for precise control of electrode surface properties, enabling optimization of Tl deposition efficiency and stripping kinetics [2] [3].
Table 1: Analytical Figures of Merit for UPD-Enhanced Thallium Determination
| Method | Electrode System | Linear Range (mol L⁻¹) | LOD (mol L⁻¹) | LOD (µg/L) | Application |
|---|---|---|---|---|---|
| Anodic Stripping Voltammetry [8] | Bi-film/Au microelectrode array | 2×10⁻¹⁰ to 2×10⁻⁷ | 8×10⁻¹¹ | 0.016 | Water samples |
| Flow-Injection DPASV [6] | Mercury film electrode | - | 3.22×10⁻⁸ | 6.58 | Shilajit supplements |
Experimental Protocols for UPD-Based Thallium Determination
Protocol: Bismuth-Film Plated Gold Microelectrode Array for Ultra-Trace Tl(I) Detection
This protocol details the procedure for determining thallium (I) using anodic stripping voltammetry at a bismuth-plated gold-based microelectrode array, achieving exceptional sensitivity [8].
Research Reagent Solutions
Table 2: Essential Reagents and Materials
| Reagent/Material | Specification | Function in Protocol |
|---|---|---|
| Gold Microelectrode Array | 792 holes, 3 mm diameter | Working electrode substrate |
| Bismuth (III) Nitrate Solution | 100 mg/L in 5% HNO₃ | Formation of bismuth film |
| Thallium (I) Nitrate Stock | 1 g/L in deionized water | Primary analyte standard |
| Acetate Buffer | 1 mol L⁻¹, pH 5.3 | Supporting electrolyte/pH control |
| Na₂EDTA Solution | 0.2 mol L⁻¹ | Complexing agent for interference suppression |
| Nitric Acid | Suprapur, 0.01 mol L⁻¹ | Standard solution acidification |
Electrode Preparation and Modification
- Surface Polishing: Polish the gold microelectrode array surface daily with 2500 grit sandpaper, rinse thoroughly with deionized water, and place in an ultrasonic bath for 30 seconds [8].
- Bismuth Film Plating: Transfer the cleaned electrode to an electrochemical cell containing acetate buffer (pH 5.3) and Bi(III) at 500 µg/L.
- Electrodeposition: Apply a deposition potential of -1.0 V vs. Ag/AgCl for 60 seconds with solution stirring to form the bismuth film in situ [8].
Thallium Preconcentration and Measurement
- Solution Preparation: Prepare the sample solution in acetate buffer (pH 5.3) with appropriate dilution. Add Na₂EDTA if interfering ions are present.
- Analyte Preconcentration: At the bismuth-plated electrode, apply a deposition potential of -1.0 V vs. Ag/AgCl for 120-180 seconds with solution stirring.
- Stripping Scan: After a 10-second equilibration period, perform an anodic stripping scan from -1.0 V to -0.2 V using square-wave voltammetry.
- Quantification: Measure the Tl(I) oxidation peak current at approximately -0.6 V to -0.8 V vs. Ag/AgCl and determine concentration from a calibration curve [8].
Method Validation and Quality Control
- Calibration: Establish linear calibration in the range 2×10⁻¹⁰ to 2×10⁻⁷ mol L⁻¹ (R = 0.9988) for 180 s deposition [8].
- Quality Control: Analyze certified reference material TM-25.5 to verify method accuracy.
- Interference Check: Validate recovery in spiked real water samples (98.7-101.8% recovery) [8].
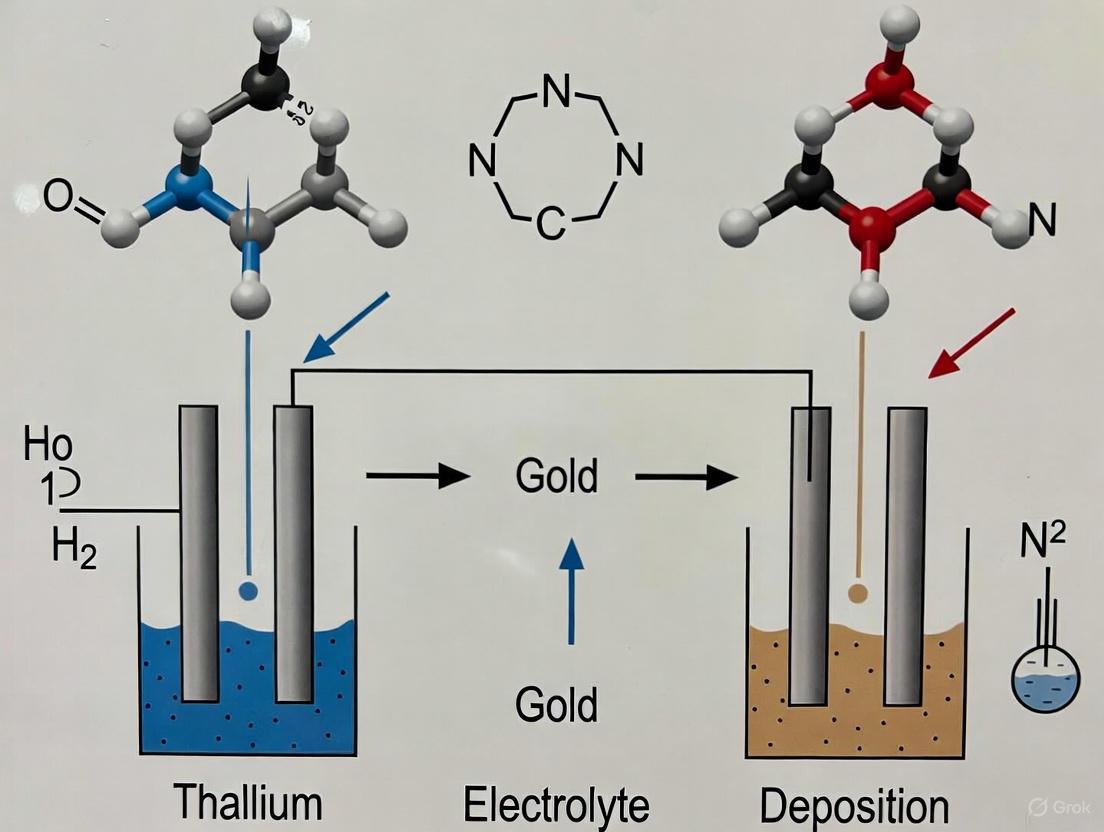
Experimental Workflow Visualization
UPD Fundamentals and Surface Process Visualization
Analytical Performance and Comparison with Other Methods
UPD-enhanced electrochemical methods demonstrate competitive performance compared to established spectroscopic techniques for thallium determination:
Table 3: Comparison of Analytical Methods for Thallium Determination
| Method | Principle | LOD | Linear Range | Advantages | Disadvantages |
|---|---|---|---|---|---|
| UPD-ASV [8] | Electrochemical stripping | 0.016 µg/L | 2×10⁻¹⁰ to 2×10⁻⁷ mol L⁻¹ | Portable, low cost, high sensitivity | Requires electrode preparation |
| ICP-MS [7] | Mass spectrometry | 0.037 ng/mL | 1.25 to 500 ng/mL | Wide linear range, high throughput | Expensive instrumentation |
| GF-AAS [8] | Atomic absorption | Varies | Limited | Established methodology | Susceptible to matrix effects |
| FI-DP-ASV [6] | Flow injection ASV | 6.58×10⁻³ µg/mL | - | Automated analysis | Higher LOD than UPD-ASV |
The exceptional sensitivity of UPD-based methods positions them as ideal for compliance monitoring with stringent regulatory limits and for environmental surveillance where thallium occurs at ultra-trace concentrations.
Underpotential deposition represents a powerful fundamental electrochemical phenomenon with direct practical significance in advancing thallium determination methods. The ability to engineer electrode surfaces at the atomic level through UPD provides unparalleled opportunities for enhancing sensitivity, selectivity, and reproducibility in trace metal analysis. The protocol detailed herein for bismuth-film plated gold microelectrode arrays demonstrates the practical implementation of these principles, achieving detection limits sufficient to monitor thallium at levels well below the most stringent regulatory requirements.
Future research directions should explore novel UPD systems tailored specifically for thallium, investigate multivariate UPD layers for enhanced interference rejection, and develop miniaturized UPD-based sensors for field-deployable thallium monitoring. As industrial uses of thallium continue to evolve, particularly in emerging technologies like lithium-ion batteries [5], the importance of sophisticated, sensitive, and accessible analytical methods will only increase. UPD-enhanced electroanalysis stands poised to meet these challenges, bridging fundamental surface science with practical environmental and public health protection.
Contrasting Tl UPD Behavior: Polycrystalline Bulk Gold vs. Nanostructured Gold Electrodes
Underpotential deposition (UPD), a phenomenon where metal ions are electrodeposited onto a foreign substrate at a potential less negative than their thermodynamic reduction potential, provides a powerful foundation for ultra-sensitive electrochemical detection. The investigation of thallium (Tl) UPD behavior is of significant importance in electroanalysis, particularly for the trace-level detection of this highly toxic metal, often termed the "poisoner's poison" due to its historical use in malicious poisonings [4]. The efficacy of UPD-based sensing is profoundly influenced by the physicochemical properties of the electrode material. This application note delineates the stark contrast in the UPD behavior of Tl between traditional polycrystalline bulk gold electrodes and advanced nanostructured gold electrodes, framing these findings within the broader objective of developing sensitive and robust sensors for thallium determination [9].
The selection of electrode substrate dictates critical analytical parameters, including electron transfer kinetics, signal-to-noise ratio, and overall sensor stability. Understanding the fundamental differences in how Tl interacts with different gold surfaces is a prerequisite for designing next-generation electrochemical sensors. This document provides a detailed experimental protocol for characterizing Tl UPD, summarizes key contrasting behaviors in a readily comparable format, and offers a foundational workflow to guide sensor development for researchers and scientists engaged in drug development and environmental toxicology.
The Scientist's Toolkit: Essential Research Reagents & Materials
The following table catalogs the essential materials and reagents required for the experimental investigation of Tl UPD and the subsequent development of detection protocols.
Table 1: Key Research Reagent Solutions and Essential Materials
| Item | Specification / Function | Key Context from Literature |
|---|---|---|
| Gold Working Electrodes | Polycrystalline bulk gold macroelectrode and nanostructured variants (e.g., AuNP-modified, Bi-plated Au microelectrode array) as the substrate for Tl UPD. | Bulk Au and Au nanoparticle-modified electrodes show contrasting Tl UPD behavior [9]. A Bi-plated Au microelectrode array offers high sensitivity for Tl(I) detection [8]. |
| Thallium Standard Solution | A stock solution of Tl(I) (e.g., TlNO₃) at a known concentration (e.g., 1 g L⁻¹) for preparing calibration standards and spiked samples [8]. | A stock Tl(I) nitrate solution is used for preparing standard additions in analytical procedures [8]. |
| Supporting Electrolyte | A high-purity electrolyte solution (e.g., acetate buffer, EDTA) to provide ionic strength and control pH, ensuring a consistent and reproducible electrochemical environment. | Acetate buffer (pH 5.3) is used for Bi-plated Au microelectrode arrays [8]. EDTA is used as a base electrolyte with AgNP-modified electrodes [10]. |
| Bismuth Film Precursor | A solution of Bi(III) ions (e.g., Bi(NO₃)₃) for the in-situ or ex-situ electroplating of a bismuth film onto gold substrates to enhance analytical signal and sensitivity. | The bismuth-plated gold microelectrode array significantly increases sensitivity for Tl(I) determination [8]. |
| Modifying Agents | Stabilizing agents like potato starch derivatives used to prepare modified electrode surfaces (e.g., for stabilizing silver nanostructures) [10]. | Silver nanostructures stabilized by potato starch derivatives are used to modify glassy carbon electrodes for Tl detection [10]. |
Experimental Protocols & Methodologies
Protocol: Contrasting Tl UPD on Different Gold Electrodes
This protocol is adapted from foundational studies to directly compare the UPD behavior of Tl on polycrystalline bulk gold versus nanostructured gold surfaces [9] [8].
I. Materials and Equipment Setup
- Electrochemical Cell: Standard three-electrode cell.
- Working Electrodes: Prepare a polycrystalline gold macroelectrode and a nanostructured electrode (e.g., a gold nanoparticle-modified electrode or a bismuth-plated gold microelectrode array).
- Reference Electrode: Ag/AgCl/KCl (sat'd) or SCE.
- Counter Electrode: Platinum wire.
- Electrolyte: Deoxygenated 0.1 M HClO₄ or acetate buffer (pH 5.3) containing a known concentration of Tl(I) (e.g., 1-10 µM).
- Instrumentation: Potentiostat capable of performing cyclic voltammetry (CV) and anodic stripping voltammetry (ASV).
II. Electrode Preparation Steps
- Bulk Gold Electrode: Polish the polycrystalline gold macroelectrode successively with finer grades of alumina slurry (e.g., down to 0.05 µm) on a microcloth. Rinse thoroughly with deionized water between each polishing step and after the final polish.
- Nanostructured Electrode:
- Option A (AuNP-modified): Modify a bare substrate (e.g., glassy carbon) with gold nanoparticles via electrodeposition or drop-casting from a synthesized AuNP colloid.
- Option B (Bi-plated Au Array): Polish the gold microelectrode array with sandpaper (2500 grit), rinse, and sonicate. Plate the bismuth film in-situ by adding Bi(III) ions (e.g., 5-20 mg L⁻¹) directly to the measurement solution containing Tl(I) and acetate buffer [8].
III. UPD and Stripping Measurement Procedure
- Transfer the supporting electrolyte containing Tl(I) into the electrochemical cell.
- Purge the solution with high-purity nitrogen or argon for at least 10 minutes to remove dissolved oxygen.
- For the UPD study, run a cyclic voltammogram at a slow scan rate (e.g., 10-50 mV/s) over a potential range that captures the Tl UPD peaks (typically between -0.8 V and -0.3 V vs. Ag/AgCl).
- For analytical detection using stripping voltammetry:
- Deposition Step: Hold the working electrode at a selected UPD potential (e.g., -0.9 V to -1.0 V vs. Ag/AgCl) for a fixed time (e.g., 120-180 s) with stirring to deposit Tl onto the gold surface [8] [10].
- Equilibration Step: Stop stirring and allow the solution to become quiescent for a brief period (e.g., 10-30 s).
- Stripping Step: Apply a positive-going potential scan (using linear sweep, square wave, or differential pulse modes) to oxidatively strip the deposited Tl. The resulting peak current is proportional to the Tl(I) concentration.
Experimental Workflow Visualization
The logical sequence of the experimental process, from electrode selection to data interpretation, is outlined below.
The experimental investigation into Tl UPD reveals critical differences in the electrochemical response and analytical performance of bulk versus nanostructured gold electrodes. The table below synthesizes quantitative and qualitative findings from the literature for direct comparison.
Table 2: Contrasting UPD Behavior and Analytical Performance for Thallium Detection
| Feature | Polycrystalline Bulk Gold Electrode | Nanostructured Gold Electrodes (AuNPs, Bi-plated Au Array) |
|---|---|---|
| UPD Behavior | Distinct, well-defined UPD peaks observed, but behavior can differ from nanoparticles [9]. | Contrasting UPD behavior reported; nanoparticles can alter deposition thermodynamics and kinetics [9]. |
| Typical Deposition Potential | -1.0 V (vs. SCE) for AgNP-modified sensor on GCE [10]. | -1.0 V (vs. Ag/AgCl) for Bi-plated Au microelectrode array [8]. |
| Linear Dynamic Range | ~19 to 410 μg/L (GCE/AgNPs) [10]. | 2×10⁻¹⁰ to 2×10⁻⁷ mol/L (≈ 41 to 41,000 ng/L) for 180 s deposition [8]. |
| Limit of Detection (LOD) | 18.8 μg/L (GCE/AgNPs) [10]. | 8×10⁻¹¹ mol/L (≈ 16 ng/L) for 180 s deposition [8]. |
| Key Advantages | Well-understood, reproducible surface. Good baseline for fundamental UPD studies. | Enhanced sensitivity, lower LODs. Steady-state diffusion, reduced ohmic drop (microelectrode arrays) [8]. |
| Reported Challenges | May exhibit lower sensitivity compared to nanostructured analogues. | Requires more complex fabrication and/or modification procedures [8]. |
Discussion: Implications for Sensor Design
The data presented in Table 2 underscores a clear trend: nanostructured gold electrodes offer superior analytical performance for the trace detection of thallium. The significantly lower detection limits achieved with the bismuth-plated gold microelectrode array highlight the success of this approach [8]. The enhanced sensitivity can be attributed to factors such as the high surface-to-volume ratio of nanostructures, improved mass transport at microelectrodes, and the synergistic effect of using bismuth, which forms a "fused" alloy with thallium during deposition, enhancing the pre-concentration efficiency [8].
The finding that Tl UPD behaves differently on gold nanoparticles compared to bulk gold is a critical insight for sensor optimization [9]. This contrast suggests that the nucleation and growth mechanism of Tl ad-atoms is sensitive to surface structure and defect sites, which are inherently more abundant in nanostructured materials. Therefore, tailoring the nano-morphology (e.g., particle size, shape, and density) presents a direct pathway to fine-tuning the UPD process for maximum analytical signal.
The following diagram conceptualizes the contrasting UPD processes on the two electrode types, linking their physical differences to the observed electrochemical outcomes.
This application note provides clear evidence that the choice of electrode substrate is paramount in designing an effective electrochemical sensor based on Tl UPD. While polycrystalline bulk gold serves as a valuable benchmark, nanostructured gold electrodes, particularly bismuth-plated microelectrode arrays, demonstrate a superior and analytically advantageous UPD behavior, enabling detection at clinically and environmentally relevant trace levels. The detailed protocols and comparative data herein offer a foundation for researchers to further explore and optimize these material-dependent interactions, ultimately advancing the field of electroanalysis for critical toxic metals like thallium.
Gold has established itself as a premier substrate material in electrochemical sensing, particularly for the detection of trace toxic metals such as thallium. Its widespread adoption in electroanalytical chemistry stems from a unique combination of physical and electrochemical properties that enable highly sensitive and reliable measurements. For the determination of thallium by underpotential deposition (UPD) at gold-film electrodes, the substrate's characteristics directly influence the electron transfer kinetics, conductivity, and overall environmental compatibility of the analytical method. Gold electrodes provide fast electron transfer kinetics, high conductivity, and a relatively wide potential window with particularly good anodic range, making them suitable for stripping voltammetry techniques where oxidation processes are critical [11] [8]. Additionally, gold exhibits low reactivity in common supporting electrolytes, reducing corrosion risks and enhancing electrode longevity, while its status as an environmentally friendly material compared to mercury-based electrodes aligns with modern green analytical chemistry principles [11].
The application of UPD for thallium determination leverages the phenomenon where metal ions deposit onto an electrode surface at potentials more positive than their thermodynamic reduction potential, resulting in monolayer formation rather than bulk deposition [1]. This process is particularly effective on gold substrates, where the interaction between thallium ad-atoms and the gold surface facilitates highly sensitive and selective detection. The UPD effect enables efficient accumulation within short time periods while producing sharp, sensitive stripping responses due to the limited surface coverage (typically 0.01–0.1%) [11]. Furthermore, the UPD approach minimizes structural changes to the electrode surface during analysis, resulting in excellent analytical reproducibility and reduced need for frequent surface regeneration between measurements [11].
Key Properties of Gold Electrodes
Electron Transfer Kinetics
The electron transfer kinetics at gold electrodes significantly influence the sensitivity and detection limits achievable in thallium determination. Nanostructured gold environments have demonstrated remarkable capabilities to enhance charge transport kinetics, with research showing up to a 3-fold increase in electron-transfer rates under photoexcitation conditions [12]. This enhancement is particularly pronounced in nanostructured gold compared to flat surfaces, highlighting the importance of substrate morphology in electrochemical applications. The heterogeneous electron-transfer rate (HET), which characterizes electron transfer between electroactive species and electrode surfaces, can be modified through strategic electrode design, with nanostructuring and surface modifications offering pathways to optimize this critical parameter [12].
For thallium detection specifically, the electron transfer kinetics can be further improved through surface modification strategies. The integration of titanium(IV)-oxo-carboxylate clusters with chitosan composites on gold electrodes has demonstrated enhanced electrocatalytic activity, resulting in higher current intensities for thallium redox reactions compared to bare gold electrodes [13]. Characterization through electrochemical impedance spectroscopy revealed decreased charge transfer resistance at modified gold electrodes, confirming improved electron transfer kinetics facilitated by the composite material [13]. Similarly, electrodes modified with silver nanostructures stabilized by potato starch derivatives have shown excellent electroanalytical performance for thallium detection, with well-defined peaks and linear response across concentration ranges [10].
Electrical Conductivity
Gold's exceptional electrical conductivity represents another fundamental advantage for electrochemical sensing applications. This property enables efficient current flow with minimal resistance, contributing to enhanced signal-to-noise ratios and improved detection sensitivity. The development of gold-carbon nanocomposites has further leveraged this intrinsic conductivity, creating hybrid materials with exceptional electrical characteristics [14]. In these composite systems, the carbon matrix provides a high-surface-area scaffold while the integrated gold nanoparticles enhance overall conductivity, facilitating rapid electron transfer that improves the efficacy of electrochemical treatment and detection techniques [14].
The conductivity of gold substrates plays a particularly important role in stripping voltammetry, where the efficiency of both the deposition and stripping steps directly influences analytical sensitivity. Research comparing flat gold versus nanostructured gold electrodes has revealed significant differences in electrochemical behavior attributable to variations in effective surface area and charge transport pathways [12]. The nanostructured gold electrodes, despite having approximately 50% of the effective working area of flat gold due to their porous structure, demonstrated enhanced light-induced current changes, suggesting complex interactions between conductivity, surface morphology, and electrochemical performance [12].
Environmental Friendliness
The environmental profile of gold electrodes presents significant advantages over traditional mercury-based electrodes, which face increasing restrictions due to toxicity concerns. Gold electrodes offer an environmentally friendly alternative that eliminates the disposal and cleanup issues associated with mercury while providing comparable analytical performance for thallium detection [11]. This advantage aligns with the principles of green chemistry and sustainable analytical methods, particularly for routine environmental monitoring applications where large numbers of analyses are performed.
The environmental benefits of gold electrodes extend beyond the elimination of mercury. Recent innovations in gold electrode fabrication have focused on reducing material usage and cost while maintaining performance. Approaches such as gold leaf electrodes and microelectrode arrays have demonstrated potential for applications in low-resource settings, offering simplified manufacturing processes and reduced gold consumption [15]. The development of a gold microelectrode array requiring only approximately 10 mg of gold for fabrication represents a significant advancement in sustainable electrode design, providing a cost-effective and environmentally conscious alternative to conventional gold electrodes [8].
Research Reagent Solutions
Table 1: Essential Research Reagents for Thallium Determination at Gold Electrodes
| Reagent/Material | Function/Purpose | Application Notes |
|---|---|---|
| Gold Film Electrode (AuFE) | Working electrode substrate for Tl UPD | Prepared by electrodeposition on glassy carbon; offers sub-nanoscale morphology and high surface area [11] |
| Titanium(IV)-oxo-carboxylate Cluster | Electrode modifier for enhanced Tl reduction | Used in chitosan composite; improves electrocatalytic activity and charge transfer [13] |
| Bismuth Film | Electrode plating for enhanced Tl sensitivity | Plated onto gold microelectrode arrays; significantly improves analytical signal [8] |
| Citrate Medium | Supporting electrolyte component | Eliminates interference from Pb(II) and Cd(II) ions in Tl determination [11] |
| Silver Nanostructures | Electrode modifier for Tl detection | Stabilized with potato starch derivatives; enables analysis without pre-concentration [10] |
| Chitosan Polymer | Immobilization matrix for modifiers | Forms composite films on gold electrodes; provides adhesion and permeability [13] |
| Acetate Buffer (pH 5.3) | Supporting electrolyte | Optimal pH for Tl detection at bismuth-plated gold microelectrode arrays [8] |
| Potato Starch Derivatives | Nanoparticle stabilizer | Provides green stabilization for silver nanostructures used in Tl sensing [10] |
Quantitative Performance Data
Table 2: Analytical Performance of Gold-Based Electrodes for Thallium Determination
| Electrode Type | Linear Range | Detection Limit | Methodology | Application |
|---|---|---|---|---|
| Rotating Gold-Film Electrode | 5–250 μg·L⁻¹ | 0.6 μg·L⁻¹ (210 s accumulation) | UPD-Stripping Voltammetry | Drinking water, river water, black tea [11] |
| Bismuth-Plated Gold Microelectrode Array | 0.2–2 × 10⁻⁷ mol·L⁻¹ (180 s deposition) | 8 × 10⁻¹¹ mol·L⁻¹ (180 s deposition) | Anodic Stripping Voltammetry | Certified reference material, real water samples [8] |
| TiOxo-Chitosan Modified Gold Electrode | 4.9–20.8 ppm | 1.9 ppm | Square Wave ASV | Coal ash samples [13] |
| AgNPs-Modified Glassy Carbon Electrode | 19–410 ppb | 18.8 ppb | Differential Pulse ASV | Environmental samples [10] |
Experimental Protocols
Protocol 1: Gold-Film Electrode Preparation and Tl UPD-Stripping Voltammetry
This protocol describes the preparation of a rotating gold-film electrode (AuFE) and its application for thallium determination using underpotential deposition-stripping voltammetry, adapted from the method with linear range of 5–250 μg·L⁻¹ and detection limit of 0.6 μg·L⁻¹ [11].
Materials and Equipment:
- Glassy carbon electrode substrate
- 1 mM H[AuCl₄] solution
- Potentiostat with rotating electrode system
- Ag/AgCl (3.5 M KCl) reference electrode
- Platinum counter electrode
- Supporting electrolyte: 10 mM HNO₃ and 10 mM NaCl
- Standard Tl(I) solutions
- Nitric acid (Suprapur quality)
- Citrate medium for interference suppression
Procedure:
- Gold Film Electrodeposition:
- Polish the glassy carbon substrate using standard alumina slurry followed by ultrasonic cleaning in deionized water.
- Place the electrode in 1 mM H[AuCl₄] solution containing 10 mM HNO₃ and 10 mM NaCl as supporting electrolyte.
- Apply a constant potential of −300 mV (vs. Ag/AgCl, 3.5 M KCl) for 300 s under electrode rotation to deposit the gold film.
- Characterize the resulting gold film using microscopy to confirm sub-nanoscale morphology and developed surface area.
System Optimization Using Full Factorial Design:
- Implement a full factorial design to determine optimal instrumental parameters for SW-ASV determination of thallium.
- Optimize Tl accumulation time and potential, electrode rotation rate, and SW pulse amplitude and frequency.
- Identify two potential ranges with well-defined Tl UPD peaks in the supporting electrolyte.
Thallium Determination:
- Transfer 10 mL of sample solution to the electrochemical cell.
- Deoxygenate with high-purity nitrogen for 300 s.
- Apply optimized accumulation potential for 210 s while rotating the electrode.
- Record square-wave anodic stripping voltammograms from the accumulation potential to more positive potentials.
- Measure the Tl stripping peak current for quantification.
Interference Suppression:
- For samples containing Pb(II) and Cd(II) interferences, use citrate medium instead of nitric acid medium.
- Prepare calibration standards in matching matrix to compensate for medium effects.
Validation:
- Apply the method to drinking water, river water, and black tea samples with nanomolar Tl additions.
- Calculate recovery values to validate method accuracy; reported recoveries are satisfactory [11].
Protocol 2: Bismuth-Plated Gold Microelectrode Array for Ultra-Sensitive Tl Detection
This protocol describes the use of a bismuth-plated gold-based microelectrode array for determination of thallium(I) species using anodic stripping voltammetry, achieving detection limit of 8 × 10⁻¹¹ mol·L⁻¹ with 180 s deposition [8].
Materials and Equipment:
- Gold microelectrode array (792 holes in silica preform)
- Bismuth plating solution
- Sandpaper (2500 grit)
- Ultrasonic bath
- µAutolab potentiostat
- Platinum wire counter electrode
- Ag/AgCl/NaCl reference electrode
- Acetate buffer (pH 5.3)
- Standard Tl(I) nitrate solution (1 g·L⁻¹ stock)
Procedure:
- Electrode Pretreatment:
- Polish the microelectrode array surface with 2500 grit sandpaper.
- Rinse thoroughly with deionized water.
- Place in ultrasonic bath for 30 seconds.
Bismuth Film Plating:
- Prepare plating solution containing bismuth ions.
- Apply optimized plating potential and time to deposit bismuth film on gold microelectrode array.
- Rinse the plated electrode with deionized water.
Thallium Determination:
- Transfer 10 mL of sample solution to electrochemical cell.
- Add appropriate volume of acetate buffer (pH 5.3) to achieve 0.1 M final concentration.
- Deoxygenate with high-purity nitrogen for 300 s.
- Apply deposition potential of -1.0 V to -1.3 V (vs. Ag/AgCl) for 120-180 s.
- Record differential pulse or square-wave anodic stripping voltammogram.
- Measure Tl stripping peak current at approximately -0.6 V to -0.8 V.
Interference Studies:
- Test potential interferents including Pb²⁺, Cd²⁺, Zn²⁺, Cu²⁺, and In³⁺.
- Utilize standard addition method for samples with complex matrices.
Validation:
- Analyze certified reference material TM 25.5.
- Perform recovery studies in real water samples; reported recoveries between 98.7% and 101.8% [8].
Advanced Modification Strategies
Titanium-Oxocluster-Chitosan Composite Modification
The modification of gold electrodes with titanium(IV)-oxo-carboxylate cluster-chitosan composites significantly enhances performance for thallium detection in complex matrices like coal ash [13].
Synthesis of Titanium(IV)-oxo-carboxylate Cluster:
- Utilize solvothermal method with biphenyl-2-carboxylic acid (2-bpycH) and titanium(IV) isopropoxide (Ti(OiPr)₄).
- Characterize the resulting material by X-ray diffraction (XRD), scanning electron microscopy (SEM), and infrared spectroscopy.
- Confirm formation of [Ti₆O₆(2-bpyc)₁₀(OiPr)₂] with plate-like microcrystal morphology.
Electrode Modification Procedure:
- Prepare suspension of TiOxo cluster in chitosan solution (0.5% w/v in acetic acid).
- Apply 5 µL aliquot of TiOxo-Chit suspension onto gold electrode surface.
- Allow to dry at room temperature for 24 hours to form stable composite film.
- Characterize modified electrode using cyclic voltammetry and electrochemical impedance spectroscopy.
Analytical Performance:
- Linear response range from 4.9 to 20.8 ppm for thallium.
- Limit of detection of 1.9 ppm.
- Relative standard deviation for repeatability from 1.1% to 5.1%.
- Successful application to coal ash samples with accuracy comparable to ICP-OES [13].
Silver Nanostructure Modification with Potato Starch Stabilization
The modification of electrodes with silver nanostructures stabilized by potato starch derivatives offers an environmentally friendly approach for thallium detection with reduced analysis time [10].
Modification Procedure:
- Prepare silver nanostructures stabilized with potato starch derivatives.
- Apply nanostructures to glassy carbon electrode surface.
- Optimize deposition potential for thallium in the range of -0.8 V to -1.5 V.
- Identify optimal deposition potential of -1.0 V (vs. SCE) for 120 s.
Analytical Characteristics:
- Linear range from 19 to 410 ppb (9.31 × 10⁻⁸ to 2.009 × 10⁻⁶ mol/dm³).
- Detection limit of 18.8 ppb (9.21 × 10⁻⁸ mol/dm³).
- Elimination of time-consuming pre-concentration steps.
- Non-toxic operation compared to mercury-based electrodes [10].
Gold substrates provide an exceptional platform for thallium determination through underpotential deposition-stripping voltammetry, combining superior electron transfer kinetics, high conductivity, and environmental advantages over traditional mercury-based electrodes. The experimental protocols and application notes presented demonstrate that properly engineered gold electrodes, whether as bare films, microelectrode arrays, or composite-modified surfaces, can achieve detection limits suitable for monitoring thallium at environmentally relevant concentrations. The ongoing development of nanostructured gold surfaces and hybrid composite materials continues to enhance the sensitivity, selectivity, and practical applicability of these electrochemical sensors for thallium determination across diverse sample matrices from drinking water to complex environmental samples like coal ash.
Thallium (Tl) is a non-essential, highly toxic heavy metal that presents significant environmental and health hazards even at trace concentrations. Its extreme toxicity, combined with its lack of color, taste, or odor in soluble forms, has led to its historical notoriety as "the poisoner's poison" [16]. The primary threat stems from thallium's insidious chemical behavior – its ionic radius (Tl+: 164 pm) closely resembles that of potassium (K+: 152 pm), allowing it to mimic and disrupt vital potassium-dependent biological processes [11]. This review examines the toxicological profile of thallium and underscores the critical importance of sensitive analytical methods, particularly advanced electrochemical techniques like underpotential deposition at gold-film electrodes, for protecting human health and advancing research.
Toxicological Mechanisms of Thallium
Thallium exerts its devastating toxic effects through multiple interconnected biochemical mechanisms that disrupt fundamental cellular processes.
Key Pathophysiological Pathways
Potassium Mimicry and Disruption: Tl+ ions exploit potassium transport systems, entering cells through sodium-potassium ATPase channels and potassium transporters. Once inside, they inhibit crucial potassium-dependent enzymes, including pyruvate kinase and succinate dehydrogenase, thereby disrupting the Krebs cycle, compromising glucose metabolism, and reducing ATP production [17] [5].
Mitochondrial Dysfunction and Oxidative Stress: Thallium induces reactive oxygen species (ROS) generation and impairs mitochondrial function. It sequesters riboflavin and inhibits flavin adenine dinucleotide, disrupting the electron transport chain and further diminishing cellular energy supplies [17] [16].
Protein Synthesis Disruption and Structural Damage: Thallium has a high affinity for sulfhydryl (-SH) groups, binding to and inactivating vital enzymes and protein complexes. This disrupts disulfide bond formation in cysteine residues, leading to impaired keratin production (manifesting as alopecia) and damage to ribosomal structures, particularly the 60S subunit [17] [16].
Central and Peripheral Nervous System Damage: Thallium causes severe axonal degeneration and myelin disruption in both the central and peripheral nervous systems, though the precise mechanism remains under investigation. The resulting neuropathy is often severely painful and can lead to permanent neurological sequelae [18] [16].
The following diagram illustrates the primary molecular mechanisms of thallium toxicity:
Toxicokinetics and Organ Distribution
Thallium's distribution in the body follows a predictable pattern that informs both clinical presentation and analytical sampling strategies:
- Intravascular Distribution Phase (0-4 hours): Thallium rapidly disseminates to highly perfused organs via the bloodstream following exposure [17].
- CNS Distribution Phase (4-48 hours): Thallium accumulates in the central nervous system, crossing the blood-brain barrier [17].
- Elimination Phase (≥24 hours): Thallium undergoes slow elimination primarily through renal excretion and fecal elimination, with a biological half-life extending up to 30 days due to extensive tissue redistribution and enterolepatic recirculation [17] [16].
The brain demonstrates the highest thallium concentration after the initial distribution phase, explaining the profound and often permanent neurological damage observed in poisoning cases [16].
Exposure Routes and Health Effects
Human exposure to thallium occurs through several routes, with significant variability in absorption efficiency:
- Inhalation Exposure: Occupational exposure in industries such as semiconductor manufacturing, optics, and cement production represents a significant risk. The occupational exposure limit is set at 0.1 mg/m³ of air for 8-hour time-weighted average exposure [18] [17].
- Oral Exposure: The most common route for significant poisoning, with soluble thallium salts being readily absorbed from the gastrointestinal tract. Contaminated water, food (particularly crops from contaminated soils), and traditional medicines have been documented exposure sources [7] [6] [5].
- Dermal Exposure: Though less common, thallium can be absorbed through intact skin, particularly with prolonged contact [17].
Anthropogenic activities including mining, non-ferrous metal smelting, coal combustion, and cement production contribute approximately 5000 metric tons of thallium to the global environment annually [5]. Recent concerns have emerged about thallium release from lithium extraction and battery production processes [5].
Clinical Manifestations of Toxicity
Thallium poisoning presents with multisystem involvement, with symptoms varying based on exposure acuity and dose:
- Acute Poisoning: Initial gastrointestinal symptoms (abdominal pain, nausea, vomiting, diarrhea) appear within 3-4 hours. Neurological manifestations emerge within 2-5 days, characterized by severely painful peripheral neuropathy, distal motor weakness, ataxia, and cranial nerve palsies. Alopecia, a hallmark sign, typically develops 2-3 weeks post-exposure. Mees' lines (transverse white bands on nails) appear approximately one month after exposure [17] [16].
- Chronic Poisoning: More insidious presentation with nonspecific symptoms including fatigue, headache, peripheral neuropathy, and cognitive disturbances. Dermatological findings like alopecia may be less pronounced [17].
The table below summarizes key quantitative toxicity data for thallium:
Table 1: Quantitative Toxicity Parameters for Thallium in Humans
| Parameter | Value | Context | Reference |
|---|---|---|---|
| Lethal Dose (Oral) | 10-15 mg/kg | Estimated for humans | [17] [5] |
| LD₅₀ (Human) | 8-12 mg/kg | Reported range | [6] |
| Mortality Rate | 6-15% | Acute poisoning | [17] [5] |
| Chronic Sequelae | 33-55% | Neurological/visual deficits in survivors | [5] |
| Occupational Limit | 0.1 mg/m³ | 8-hour time-weighted average | [11] [17] |
| IDLH | 15 mg/m³ | Immediately Dangerous to Life/Health | [17] |
| Drinking Water MCL | 2 μg/L | EPA Maximum Contaminant Level | [11] [7] |
Analytical Methods for Thallium Determination
Accurate and sensitive determination of thallium in biological and environmental matrices is essential for clinical diagnosis, exposure assessment, and toxicological research.
Established Analytical Techniques
Several analytical techniques are currently employed for thallium quantification, each with distinct advantages and limitations:
- Inductively Coupled Plasma Mass Spectrometry (ICP-MS): Considered the gold standard for clinical and research applications due to its exceptional sensitivity and specificity. Validated methods demonstrate a lower limit of quantitation (LLOQ) of 1.25 ng Tl/mL plasma with linear range from 1.25 to 500 ng/mL [7]. This technique is particularly suitable for complex biological matrices including plasma, urine, and tissue homogenates.
- Atomic Absorption Spectroscopy (AAS): Offers a more accessible alternative but with higher limits of detection and greater susceptibility to matrix effects compared to ICP-MS [6] [19].
- Anodic Stripping Voltammetry (ASV): Provides excellent sensitivity with the advantages of portability, lower operational costs, and capability for speciation analysis. Traditional ASV often employs mercury film electrodes, though environmental concerns have driven development of alternative substrates [11] [6].
Advanced Electrochemical Approach: Underpotential Deposition at Gold-Film Electrodes
Recent methodological advances have established underpotential deposition-stripping voltammetry (UPD-SWV) at rotating gold-film electrodes (AuFE) as a powerful technique for trace thallium determination [11]. This approach offers several distinct analytical advantages for thallium monitoring in complex samples.
Experimental Protocol: Thallium Determination by UPD-SWV at AuFE
Equipment and Reagents:
- Glassy carbon electrode substrate
- Gold plating solution: 1 mM H[AuCl₄] in appropriate supporting electrolyte
- Supporting electrolytes: 10 mM HNO₃ + 10 mM NaCl, or citrate medium for interference suppression
- Thallium standard solutions
- Nitric acid (Trace Metal Grade)
- All solutions prepared with high-purity deionized water (≥18 MΩ·cm)
Gold-Film Electrode Preparation:
- Polish glassy carbon substrate with alumina slurry (0.05 μm) and rinse thoroughly with deionized water.
- Electrodeposit gold potentiostatically at -300 mV (vs. Ag/AgCl, 3.5 M KCl) for 300 seconds from 1 mM H[AuCl₄] solution.
- Characterize the resulting gold film using microscopy to confirm sub-nanoscale morphology and developed surface area.
Thallium Determination Procedure:
- Transfer prepared sample or standard to electrochemical cell with supporting electrolyte.
- Apply optimized accumulation potential for 210 seconds with electrode rotation to facilitate Tl+ ad-atom deposition via UPD mechanism.
- Record square-wave anodic stripping voltammograms using established parameters (amplitude: 25 mV, frequency: 50 Hz, step potential: 5 mV).
- Measure Tl stripping peak current at approximately -0.45 V (vs. Ag/AgCl).
- Quantify unknown samples using matrix-matched calibration curves.
Analytical Performance:
- Linear range: 5–250 μg·L⁻¹
- Limit of detection: 0.6 μg·L⁻¹ (with 210 s accumulation)
- Coefficient of determination (R²): >0.995
- Interference management: Citrate medium eliminates Pb(II) and Cd(II) interferences
The following workflow diagram illustrates the UPD-SWV method for thallium determination:
Comparative Analytical Method Performance
The table below compares key analytical techniques for thallium determination:
Table 2: Comparison of Analytical Methods for Thallium Determination
| Method | Detection Limit | Linear Range | Key Advantages | Key Limitations | Applicable Matrices |
|---|---|---|---|---|---|
| UPD-SWV at AuFE | 0.6 μg/L | 5–250 μg/L | High sensitivity, interference rejection, portable instrumentation, low cost | Limited multielement capability | Water, tea, biological fluids [11] |
| ICP-MS | 0.037 ng/mL | 1.25–500 ng/mL | Exceptional sensitivity, wide dynamic range, multielement capability | High instrumentation cost, complex operation | Plasma, urine, tissues, water [7] |
| FI-DP-ASV at MFE | 0.0066 μg/mL | 0.02–0.5 μg/mL | Excellent sensitivity for complex matrices | Mercury toxicity concerns | Shilajit, supplements, soils [6] |
| AAS | ~1 μg/L | Varies | Instrument accessibility, operational simplicity | Higher LOD, matrix effects | Water, biological samples [19] |
The Scientist's Toolkit: Essential Research Reagents and Materials
Table 3: Essential Research Reagents and Materials for Thallium Analysis
| Item | Specification/Example | Primary Function | Application Notes |
|---|---|---|---|
| Gold Film Electrode | Rotating disk configuration | Working electrode for UPD-SWV | Prepared by electrodeposition on glassy carbon [11] |
| Reference Electrode | Ag/AgCl (3.5 M KCl) | Stable potential reference | Essential for reproducible deposition potentials [11] |
| Supporting Electrolyte | 10 mM HNO₃ + 10 mM NaCl or citrate buffer | Conductivity medium and interference suppression | Citrate medium eliminates Pb(II) and Cd(II) interferences [11] |
| Thallium Standards | NIST-traceable Tl(I) nitrate | Calibration and quantification | Stock solutions at 1,000 μg/mL, working standards freshly prepared [7] |
| Digestion Reagents | HNO₃ (70%, Trace Metal Grade) | Sample matrix decomposition | Microwave-assisted digestion for complete recovery [7] [6] |
| ICP-MS Tuning Solution | Indium (In) standard | Instrument performance optimization | Verifies sensitivity and mass calibration before analysis [7] |
Regulatory Guidelines and Public Health Implications
Regulatory limits for thallium exposure reflect growing concern about its extreme toxicity, particularly in drinking water:
- United States EPA: Maximum Contaminant Level (MCL) = 2 μg/L; MCL Goal = 0.5 μg/L [11] [7]
- Canada: Guideline value = 0.8 μg/L [5]
- China: Enforcement of one of the strictest limits globally at 0.1 μg/L [5]
- European Union: Member states typically implement limits of 0.1-2 μg/L in groundwater [5]
Environmental monitoring has detected thallium in tap water in more than 30 U.S. states, with reported concentrations as high as 7.2 ng/mL [7]. Concerns extend to natural health products, with thallium detected in Shilajit and its commercial supplements at concentrations up to 0.5 μg/g [6]. Consumption of just one pill of such supplements could introduce up to 0.095 μg of thallium to the body [6].
Thallium remains a significant public health threat due to its extreme toxicity, persistence in the environment, and continued industrial use. The complex multisystem toxicity of thallium, coupled with its nonspecific clinical presentation, necessitates highly sensitive and accurate analytical methods for exposure assessment, clinical diagnosis, and treatment monitoring. Advanced electrochemical techniques like underpotential deposition at gold-film electrodes offer powerful alternatives to traditional spectroscopic methods, providing excellent sensitivity with the advantages of portability, cost-effectiveness, and interference management. Continued development and application of these sensitive monitoring approaches are essential for protecting human health, particularly as emerging industries potentially increase environmental thallium burdens. Future research should focus on refining these analytical methods for point-of-care applications and expanding their utility to more complex biological matrices.
The accurate determination of toxic heavy metals like thallium in environmental samples represents a significant challenge in analytical chemistry, requiring methods that are both highly sensitive and selective [11]. Within this context, underpotential deposition (UPD) has emerged as a powerful electrochemical technique where a metal ion is deposited onto a dissimilar electrode substrate at a potential more positive than its standard reduction potential, forming a monolayer that can be precisely stripped and quantified [11] [9]. The choice of electrode platform critically influences the sensitivity, selectivity, and practical applicability of UPD-based analytical methods. This application note provides a detailed comparison of three principal electrode platforms—bulk electrodes, nanoparticle-modified electrodes, and microelectrode arrays—for the determination of thallium via UPD-stripping voltammetry, framed within ongoing research aimed at optimizing gold-film electrode methodologies [11] [20].
Electrode Platform Comparison
The following table summarizes the key performance characteristics of the different electrode platforms for the detection of thallium and other heavy metals.
Table 1: Performance Comparison of Electrode Platforms for Heavy Metal Detection
| Electrode Platform | Target Analyte | Linear Range | Detection Limit | Key Advantages | Noted Limitations |
|---|---|---|---|---|---|
| Rotating Gold-Film Electrode (Bulk) | Tl(I) [11] | 5–250 µg·L⁻¹ [11] | 0.6 µg·L⁻¹ [11] | Well-developed surface area; good reproducibility; resistant to oxidation [11] | Requires surface preparation; potential interference in certain media [11] |
| Bismuth-plated Gold Microelectrode Array | Tl(I) [20] | 0.0408 - 102.2 µg·L⁻¹ (180 s deposition) [20] | 0.016 µg·L⁻¹ [20] | Very high sensitivity; low capacitive currents; steady-state diffusion; reusable [20] | Requires bismuth film plating; more complex fabrication [20] |
| Gold Nanoparticle-Modified Electrode | Tl(I) [9], As(III) [21] | As(III): 0.37 - 7.49 µg·L⁻¹ [21] | As(III): 0.4 µg·L⁻ [21] | Enhanced electrocatalytic properties; high surface-to-volume ratio [21] | Size-dependent UPD behavior; Tl signal can disappear below ~10 nm nanoparticle size [9] |
| Improved Microelectrode Array (MEMS) | Pb(II), Cu(II) [22] | 0.1 - 3000 µg·L⁻¹ [22] | 0.1 µg·L⁻¹ [22] | Wide detection range; uniform current density; integrated design; antifouling properties [22] | Complex micro-fabrication process required [22] |
Experimental Protocols
Protocol 1: Determination of Tl(I) at a Rotating Gold-Film Electrode
This protocol describes the stripping voltammetric determination of trace thallium using underpotential deposition on a gold-film electrode (AuFE), adapted from the method detailed in [11].
- 1. Electrode Preparation: The rotating gold-film working electrode is prepared by electrodepositing gold onto a glassy carbon substrate from a 1 mM H[AuCl₄] solution. Deposition is performed at a potential of -300 mV (vs. Ag/AgCl, 3.5 M KCl) for 300 seconds. The resulting gold film possesses a sub-nanoscale morphology and a developed surface area [11].
- 2. Supporting Electrolyte and Sample Preparation: Prepare a supporting electrolyte of 10 mM HNO₃ and 10 mM NaCl. For complex matrices like river water or tea, prepare samples in a citrate medium to eliminate potential interferences from Pb(II) and Cd(II). Standard thallium(I) solutions should be prepared in the same supporting electrolyte [11].
- 3. Instrumental Parameters Setup: Configure the square-wave anodic stripping voltammetry (SW-ASV) system with the following optimized parameters, which can be established using a full factorial design [11]:
- Accumulation Potential: Applied in the UPD region for Tl on Au.
- Accumulation Time: 210 seconds for low concentrations.
- Electrode Rotation Rate: Maintained constant during accumulation.
- Square-Wave Parameters: Optimize amplitude and frequency.
- 4. Pre-concentration and Measurement: Immerse the electrode in the stirred sample solution. Apply the predetermined accumulation potential for the selected time to deposit a sub-monolayer of Tl ad-atoms onto the gold surface via UPD. Following the deposition step, terminate stirring and initiate the anodic stripping scan. Record the current as the potential is swept to more positive values, oxidizing (stripping) the deposited thallium back into solution.
- 5. Data Analysis: Identify the characteristic anodic stripping peak for Tl. The height of this peak is proportional to the concentration of Tl(I) in the sample. Construct a calibration curve using standard solutions to quantify the analyte in unknown samples [11].
Protocol 2: Determination of Tl(I) at a Bismuth-Plated Gold Microelectrode Array
This protocol outlines a highly sensitive procedure for determining thallium(I) using a bismuth-film modified gold microelectrode array [20].
- 1. Electrode Pretreatment: Polish the surface of the gold microelectrode array with 2500 grit sandpaper. Rise thoroughly with deionized water and place in an ultrasonic bath for 30 seconds to clean [20].
- 2. Bismuth Film Plating: Plate a bismuth film onto the pretreated gold microelectrode array in-situ from a solution containing Bi(III) ions. The bismuth layer enhances the sensitivity for Tl(I) detection [20].
- 3. Supporting Electrolyte Preparation: Use a 1 mol L⁻¹ acetate buffer at pH 5.3 as the supporting electrolyte [20].
- 4. Anodic Stripping Voltammetry Measurement:
- Deposition Step: Apply a deposition potential of -1.2 V (vs. Ag/AgCl) to the working electrode for 120-180 seconds while the solution is stirred.
- Stripping Step: After a quiet time of 5-10 seconds, initiate a square-wave or differential pulse anodic stripping scan towards more positive potentials to oxidize the accumulated thallium.
- 5. Validation: Validate the analytical procedure by analyzing a certified reference material (e.g., TM 25.5) and spiked real water samples to ensure accuracy and recovery [20].
Schematic Workflows
The following diagrams illustrate the core experimental workflows and the signaling mechanism of UPD-based detection.
UPD-based Stripping Voltammetry Workflow
Signaling Principle of UPD-Stripping
The Scientist's Toolkit: Key Research Reagents & Materials
Table 2: Essential Reagents and Materials for UPD-Based Thallium Determination
| Item | Specification / Example | Primary Function in the Protocol |
|---|---|---|
| Gold Source | H[AuCl₄] solution (1 mM) [11] | Electrochemical deposition of the gold-film working electrode. |
| Supporting Electrolyte | 10 mM HNO₃ + 10 mM NaCl; or Acetate Buffer (pH 5.3) [11] [20] | Provides conductive medium and controls pH; can mitigate interferences. |
| Bismuth Source | Bismuth(III) nitrate pentahydrate [20] [23] | Formation of a bismuth sub-layer to enhance sensitivity and selectivity. |
| Complexing Agent | Citrate medium; Sodium EDTA [11] [20] | Masks interfering ions (e.g., Pb²⁺, Cd²⁺) to improve selectivity. |
| Standard Solution | Tl(I) nitrate solution (e.g., 1 g/L stock) [20] | Used for calibration curve construction and method validation. |
| Reference Electrode | Ag/AgCl (3.5 M KCl) [11] [20] | Provides a stable and reproducible reference potential. |
| Counter Electrode | Platinum wire [20] | Completes the electrical circuit in the three-electrode system. |
| Certified Reference Material | GBW 07401 Soil; TM 25.5 Water [20] [24] | Validates the accuracy and precision of the analytical method. |
Sensor Fabrication and Practical Workflows: From Laboratory to Real-World Sample Analysis
Within the broader scope of research on the determination of thallium by underpotential deposition at gold-film electrodes, the development of reliable and sensitive sensors is paramount. This protocol details the construction of a highly sensitive voltammetric sensor based on a bismuth-plated gold microelectrode array (Bi-AuMEA) for the anodic stripping voltammetric (ASV) determination of trace thallium(I) [20]. The use of a gold microelectrode array provides a superior substrate with benefits such as small capacitive currents, reduced ohmic drop, and steady-state diffusion currents [20]. Subsequent modification with a bismuth film offers an environmentally friendly alternative to mercury electrodes, while maintaining excellent analytical performance for heavy metal detection, particularly for thallium [25] [26]. The procedure described herein allows for the determination of Tl(I) at ultratrace levels, with a documented limit of detection (LOD) of (8 \times 10^{-11}) mol L(^{-1}) [20].
Research Reagent Solutions & Essential Materials
The following table lists the key reagents and materials required for the fabrication and operation of the Bi-AuMEA sensor.
Table 1: Essential Reagents and Materials for Sensor Construction and Analysis
| Item | Specification / Function | Key Details / Purpose |
|---|---|---|
| Gold Microelectrode Array (AuMEA) | Working electrode substrate | 792 gold microdiscs in silica preform; outer diameter: 3 mm [20]. |
| Bismuth(III) Solution | For in-situ bismuth film formation | Prepared from Bi(III) nitrate or certified standard solution [20] [26]. |
| Thallium(I) Standard Solution | Analyte for calibration and quantification | (1 \text{ g L}^{-1}) stock solution in (0.01 \text{ mol L}^{-1} \text{ HNO}_3) [20]. |
| Acetate Buffer | Supporting electrolyte | (1 \text{ mol L}^{-1}, \text{pH } 5.3), prepared from CH(_3)COOH and NaOH (Suprapur) [20]. |
| Sodium EDTA | Complexing agent / Interference masker | Masks multivalent interfering ions (e.g., Pb(II)) [20] [27]. |
| Nitric Acid | For cleaning and solution preparation | (0.01 \text{ mol L}^{-1} \text{ HNO}_3) for diluting Tl(I) stock solutions [20]. |
| Polishing Supplies | For electrode surface regeneration | Sandpaper (2500 grit), Al(2)O(3) slurry (for other electrode types) [20] [26]. |
Sensor Fabrication and Experimental Workflows
Fabrication of the Gold Microelectrode Array (AuMEA)
The AuMEA serves as a robust and reusable substrate. The fabrication process, while specialized, yields an electrode with a long operational lifetime (at least three years) [20].
- Step 1: Preform Preparation. A homemade silica preform containing 792 holes with an outer diameter of 3 mm is used. The holes have a nearly equilateral triangle shape with a side of approximately 18 µm, and a minimal distance of 48 µm between them [20].
- Step 2: Gold Infiltration. The holes in the silica preform are filled with melted gold at a high temperature (about 1140 °C) under a pressure of 20 bars [20].
- Step 3: Polishing and Assembly. The 5 mm preform is polished at both ends and placed in a PEEK housing with a diameter of 6 mm. An electrical contact is established using graphitized carbon black powder and a copper wire [20].
Diagram 1: Gold Microelectrode Array Fabrication Workflow
Daily Sensor Preparation and Bismuth-Plating Protocol
Before each use, the AuMEA requires surface preparation and modification with a bismuth film. This bismuth film is crucial for the effective accumulation of thallium during the analysis [20] [26].
- Step 1: Surface Polishing. Polish the surface of the AuMEA daily with 2500 grit sandpaper. This step ensures a fresh, clean, and electroactive surface [20].
- Step 2: Rinsing and Sonication. Rinse the polished electrode thoroughly with deionized water. Subsequently, keep it in an ultrasonic bath for thirty seconds to remove any residual polishing material [20].
- Step 3: In-Situ Bismuth Film Plating. The bismuth film is formed in-situ by adding Bi(III) ions directly to the sample or standard solution. The Bi(III)-to-Tl(I) concentration ratio ((c{Bi}/c{M})) is a critical parameter. A ratio between 5 and 40 is recommended to balance high sensitivity and good signal precision, avoiding signal suppression at very high ratios [26]. The film is co-deposited with thallium during the accumulation step of the voltammetric measurement.
Analytical Procedure for Thallium(I) Determination
This section outlines the optimized protocol for determining Tl(I) using the fabricated Bi-AuMEA sensor.
Optimized Experimental Conditions
The following table summarizes the key optimized parameters for the anodic stripping voltammetric determination of Tl(I) [20].
Table 2: Optimized Experimental Parameters for Tl(I) Determination via ASV
| Parameter | Optimized Condition | Notes |
|---|---|---|
| Supporting Electrolyte | 0.05 mol L(^{-1}) Acetate Buffer | pH 5.3 [20] [27]. |
| Complexing Agent | 2 mmol L(^{-1}) Na₂EDTA | Masks multivalent interferents like Pb(II) [20] [27]. |
| Deposition Potential (Edep) | -1.2 V vs. Ag/AgCl | Sufficiently negative to reduce Tl(I) and Bi(III) [20]. |
| Deposition Time (tdep) | 120 s - 180 s | Longer times yield lower LODs; 180 s for LOD (8 \times 10^{-11}) mol L(^{-1}) [20]. |
| Equilibrium Time | 60 s | With stirring stopped, prior to stripping [26]. |
| Stripping Technique | Anodic Stripping Voltammetry | Square-wave or differential pulse modes can be used. |
| Solution Deaeration | Recommended | Yields well-shaped Tl peaks and lower background [27]. |
Step-by-Step Measurement Protocol
- Step 1: Solution Preparation. Transfer 10 mL of the sample or standard solution into the electrochemical cell. The solution must contain the supporting electrolyte (0.05 mol L(^{-1}) acetate buffer, pH 5.3), the complexing agent (2 mmol L(^{-1}) Na₂EDTA), and the Bi(III) precursor at the optimized (c{Bi}/c{M}) ratio [20] [27] [26].
- Step 2: Deaeration. Purge the solution with an inert gas (e.g., nitrogen or argon) for approximately 8-10 minutes to remove dissolved oxygen, which can interfere with the stripping signal [27].
- Step 3: Preconcentration / Accumulation. With the solution under stirring, apply the deposition potential of -1.2 V vs. Ag/AgCl for a set time (e.g., 120 s or 180 s). During this step, Tl(I) and Bi(III) are co-deposited onto the AuMEA surface, forming an alloy [20] [26].
- Step 4: Equilibrium. Stop the stirring and allow the solution to become quiescent for a short rest period (e.g., 60 s) [26].
- Step 5: Stripping Scan. Initiate the anodic stripping voltammetry scan from a negative potential to a more positive potential (e.g., from -1.2 V to 0 V). The thallium in the bismuth film is oxidized back to Tl(I), producing a characteristic stripping peak current [20] [25].
- Step 6: Electrode Cleaning. Apply a positive cleaning potential (e.g., +0.2 V to +0.5 V) with stirring to completely remove any residual metals from the electrode surface before the next measurement [20].
Diagram 2: Thallium(I) Determination Analytical Workflow
Calibration and Method Performance
Under the optimized conditions, the Bi-AuMEA sensor exhibits excellent analytical performance for Tl(I) [20]:
- Linearity: A wide linear dynamic range from (2 \times 10^{-10}) mol L(^{-1}) to (2 \times 10^{-7}) mol L(^{-1}) (with a 180 s deposition time).
- Sensitivity: A very good proportionality (correlation coefficient, R = 0.9988) is achieved.
- Limit of Detection (LOD): (8 \times 10^{-11}) mol L(^{-1}) (for a 180 s deposition time).
- Repeatability: The procedure shows good repeatability, with a relative standard deviation (RSD) of 3.6% reported for a similar microelectrode array [27].
Troubleshooting and Notes
- Interference Studies: The presence of Na₂EDTA effectively masks a 100-fold excess of Pb(II). The method has been demonstrated to be highly selective for Tl(I) determination [20] [27].
- Sensor Regeneration: The AuMEA substrate is highly reusable. The bismuth film is removed and renewed during the cleaning step and re-plated in the subsequent analysis cycle [20].
- Validation: The method has been successfully validated using certified reference materials (TM 25.5) and spiked real water samples, with recovery values between 98.7% and 101.8% [20].
Within the framework of advanced research on the determination of thallium by underpotential deposition (UPD) at a gold-film electrode, the precise optimization of instrumental parameters is paramount. Thallium, an extremely toxic heavy metal, requires highly sensitive and selective analytical methods for its trace-level detection in environmental and biological samples [11] [4]. The UPD phenomenon, wherein a metal ion is deposited on a foreign substrate at a potential more positive than its Nernst equilibrium potential, enables the formation of a well-defined submonolayer of ad-atoms. This process is highly sensitive to the electrode surface structure and the conditions of deposition, offering significant advantages for analytical reproducibility and minimizing electrode surface alterations between measurement cycles [11] [28]. This application note details optimized protocols and parameters for the stripping voltammetric determination of Tl(I) using UPD on a rotating gold-film electrode (AuFE), providing a structured guide for researchers and scientists in drug development and environmental analysis.
The Scientist's Toolkit: Research Reagent Solutions
The following table lists the essential materials and reagents required for the preparation of the gold-film electrode and the subsequent determination of thallium.
Table 1: Essential Reagents and Materials for Thallium Determination by UPD at a Gold-Film Electrode
| Reagent/Material | Specification/Concentration | Primary Function |
|---|---|---|
| Gold Deposition Solution | 1 mM H[AuCl4] in supporting electrolyte | Potentiostatic electrodeposition of the gold film onto the glassy carbon substrate [11]. |
| Thallium(I) Standard Solution | Prepared from Tl2SO4 or other Tl(I) salts [29] | Provides the analyte for quantification and method optimization. |
| Supporting Electrolyte (for Tl UPD) | 10 mM HNO3 + 10 mM NaCl [11] | Provides ionic conductivity and a defined medium for the UPD-stripping process. |
| Citrate Medium | e.g., 0.1 M Trisodium citrate [11] | Complexing medium to eliminate interference from Pb(II) and Cd(II) ions. |
| Sulfuric Acid Solution | 0.05 M H2SO4 (95.0 - 98.0 w/w %) [30] | Component of the multi-step electrode pretreatment procedure for surface cleaning. |
| Nitric Acid Solution | 0.05 M HNO3 (70% w/w %) [30] | Component of the multi-step electrode pretreatment and for preparation of bismuth solution. |
| Potassium Hydroxide Solution | 2 M KOH [30] | Initial cleaning solution in the electrode pretreatment procedure to remove residues. |
| Bismuth Modification Solution | 0.025 - 0.25 M Bismuth(III) nitrate pentahydrate in 1 M HNO3 with 1 mM NaCl [30] | Used for underpotential deposition of a bismuth sub-layer to enhance sensitivity for lead detection, demonstrating the UPD principle. |
Workflow for Thallium Determination via UPD-Stripping Voltammetry
The following diagram illustrates the comprehensive experimental workflow, from electrode preparation to sample analysis.
Optimization of Key Instrumental Parameters
A full factorial design was implemented to determine the optimal set of instrumental parameters for the square-wave anodic stripping voltammetry (SW-ASV) determination of thallium [11]. The critical parameters and their optimized values are summarized below.
Deposition Potential and Time
The accumulation of Tl(I) ad-atoms via UPD is a fundamental step governing the sensitivity of the method.
Table 2: Optimized Parameters for Tl(I) Accumulation and Stripping
| Parameter | Optimized Value/Range | Effect and Notes |
|---|---|---|
| Deposition Potential | Defined UPD potential range (more positive than E°) | Occurs in the underpotential region, preventing bulk deposition and ensuring monolayer formation [11] [28]. |
| Deposition (Accumulation) Time | 210 s (for LOD of 0.6 μg·L-1) | Longer accumulation times increase the signal, enhancing sensitivity [11]. |
| Electrode Rotation Rate | Optimized constant rotation | Enhances mass transport of Tl(I) ions to the electrode surface during accumulation [11]. |
| Square-Wave Amplitude | Optimized value (e.g., 25 mV) | Influences the current response and peak shape in SWASV [11]. |
| Square-Wave Frequency | Optimized value (e.g., 50 Hz) | Higher frequencies can increase scanning speed and sensitivity [11]. |
Scan Modes: Square-Wave Anodic Stripping Voltammetry (SWASV)
The stripping step was performed using the square-wave (SW) mode due to its speed and sensitivity. The instrumental parameters of the SW pulse—specifically amplitude and frequency—were optimized using a factorial design to maximize the current of the Tl stripping peak [11]. The optimized linear response range for Tl(I) was found to be 5–250 μg·L-1 with a coefficient of determination R2 > 0.995. Under these optimized conditions, with an accumulation time of 210 s, a remarkable detection limit (LOD) of 0.6 μg·L-1 was achieved [11].
Detailed Experimental Protocols
Protocol: Gold-Film Electrode (AuFE) Preparation
This protocol describes the formation of a gold film on a glassy carbon (GC) substrate with a developed surface area [11].
- Substrate Preparation: Begin with a polished and cleaned glassy carbon electrode.
- Electrodeposition Solution: Prepare a solution of 1 mM H[AuCl4] in a suitable supporting electrolyte.
- Deposition Parameters: Use a standard three-electrode system. Apply a constant potential of -300 mV (vs. Ag/AgCl, 3.5 M KCl) for a deposition time of 300 seconds.
- Outcome: The resulting gold film is characterized by a sub-nanoscale morphology, which provides a highly developed surface area ideal for Tl UPD.
Protocol: Thallium UPD-Stripping Analysis
This protocol covers the core analytical procedure for the determination of Tl(I) [11].
- Supporting Electrolyte: Use a supporting electrolyte composed of 10 mM HNO3 and 10 mM NaCl. For samples containing potential interferents like Pb(II) and Cd(II), use a citrate medium to resolve overlapping stripping peaks.
- UPD Accumulation: Introduce the sample or standard into the electrochemical cell. With the electrode rotating, apply the optimized UPD potential for a controlled accumulation time (e.g., 210 s for high sensitivity) to deposit a Tl ad-atom monolayer.
- Stripping Scan: After the accumulation period, immediately initiate a square-wave anodic stripping voltammetry (SW-ASV) scan in the positive direction. Use the optimized SW amplitude and frequency parameters.
- Measurement: Record the anodic stripping peak current for Tl, which appears at a characteristic UPD potential. The peak height is proportional to the concentration of Tl(I) in the solution.
Protocol: Electrode Pretreatment and Cleaning
A rigorous pre-treatment is crucial for obtaining a reproducible and active electrode surface [30].
- Alkaline Clean: Immerse the gold-film electrode in 2 M KOH solution for 15 minutes.
- Acid Clean (1): Rinse thoroughly with copious amounts of deionized (DI) water for ~30 seconds. Then, place the electrode in a 0.05 M H2SO4 solution for 15 minutes.
- Acid Clean (2): Rinse again with DI water for 30 seconds. Subsequently, place the electrode in a 0.05 M HNO3 solution for 15 minutes.
- Final Rinse and Dry: Perform a final rinse with DI water for 30 seconds and dry the sensor gently in a stream of nitrogen gas. This procedure minimizes charge transfer resistance and enhances analytical reproducibility.
The meticulous optimization of key instrumental parameters—deposition potential, deposition time, and the characteristics of the scan mode—is critical for establishing a highly sensitive and reliable method for the determination of thallium(I) via underpotential deposition on a gold-film electrode. The protocols and optimized data presented herein provide a robust framework for researchers aiming to implement this technique for the trace analysis of thallium in complex matrices such as drinking water, river water, and biological samples, achieving detection limits that comply with stringent regulatory standards.
Analytical Procedure for Tl(I) Detection in Water and Certified Reference Materials
Thallium (Tl) is a highly toxic trace metal, classified as a priority metal pollutant by the USEPA, with contamination increasing worldwide due to mining and smelting activities [31]. In aqueous environments, thallium exists primarily in two oxidation states: Tl(I) and Tl(III). These species exhibit markedly different toxicities and mobilities, with Tl(III) being approximately 50,000 times more toxic than Tl(I) to certain algae [31]. The similar ionic radii of Tl+ and K+ ions (Tl+: 164 pm, K+: 152 pm) enables thallium to substitute for potassium in biological systems, leading to disrupted cellular processes, oxidative stress, and severe poisoning symptoms including vomiting, diarrhea, seizures, and hair loss [32]. The U.S. Environmental Protection Agency has set a permissible Tl contamination level in drinking water at 2 μg·L−1 [32]. This application note details a highly sensitive method for determining trace amounts of Tl(I) using underpotential deposition-stripping voltammetry (UPD-SWV) at a rotating gold-film electrode (AuFE), providing researchers with a robust protocol for monitoring thallium speciation in water and certified reference materials.
Principle of the Method
The method is based on stripping voltammetric determination of Tl(I) via underpotential deposition (UPD) on a rotating gold film electrode. The UPD process involves the formation of a monolayer or submonolayer of Tl ad-atoms on the gold substrate at an electrode potential more positive than the Nernst equilibrium potential, followed by anodic stripping [32]. This approach offers significant analytical advantages over bulk deposition (overpotential deposition, OPD), including efficient accumulation within short time periods, sharp and sensitive stripping responses, reduced interferences from accompanying ions, and excellent analytical reproducibility without requiring frequent electrode surface renewal [32].
Table 1: Comparison of UPD and OPD Modes for Tl(I) Determination
| Feature | UPD Mode | OPD Mode |
|---|---|---|
| Deposition Potential | More positive than E⁰ | More negative than E⁰ |
| Surface Coverage | Monolayer/submonolayer (0.01-0.1%) | Bulk deposition with cluster formation |
| Accumulation Efficiency | High in short time | Requires longer times |
| Signal Characteristics | Sharp, sensitive peaks | Broader peaks, higher signal intensity |
| Interference Resistance | High due to specific UPD peaks | More susceptible to interferences |
| Surface Reproducibility | Excellent, minimal changes | Requires frequent renewal |
| Linear Range | Narrower | Wider |
| Primary Application | Trace analysis in complex matrices | Routine analysis at higher concentrations |
Experimental Protocols
Reagents and Solutions
All solutions should be prepared using high-purity deionized water (resistivity ≥18 MΩ·cm).
- Supporting Electrolyte: 10 mM HNO₃ and 10 mM NaCl in deionized water [32]
- Citrate Medium for Interference Suppression: Prepare 0.1 M citrate buffer (pH ~3-6) for samples containing Pb(II) and Cd(II) interferents [32]
- Tl(I) Stock Standard Solution (1000 mg·L⁻¹): Dissolve TlNO₃ (Sigma-Aldrich) in 0.5 mmol/L HNO₃ [31]. Prepare working standards by serial dilution.
- Gold Film Electroplating Solution: 1 mM H[AuCl₄] in deionized water [32]
- Internal Standard (where applicable): Praseodymium (Pr) solution for ICP-MS analysis [7]
Apparatus and Equipment
- Voltammetric System: Potentiostat/Galvanostat with square wave anodic stripping voltammetry (SW-ASV) capability
- Three-Electrode System:
- Working Electrode: Rotating gold-film electrode (prepared as in Section 3.3)
- Counter Electrode: Platinum wire
- Reference Electrode: Ag/AgCl (3.5 M KCl)
- Electrode Rotation System: Controlled rotation capability (0-3000 rpm)
- pH Meter: For buffer preparation and pH adjustment
- Analytical Balance: Precision ±0.0001 g
Gold-Film Electrode (AuFE) Preparation
The rotating gold-film electrode is prepared through potentiostatic electrodeposition according to the following optimized procedure [32]:
- Substrate Preparation: Polish a glassy carbon electrode substrate with 0.05 μm alumina slurry on a microcloth, then rinse thoroughly with deionized water.
- Electrodeposition Setup: Place the polished electrode in a solution of 1 mM H[AuCl₄].
- Film Formation: Apply a deposition potential of −300 mV (vs. Ag/AgCl, 3.5 M KCl) for 300 seconds while maintaining solution agitation.
- Characterization: The resulting gold film exhibits sub-nanoscale morphology with a highly developed surface area optimal for Tl(I) UPD.
Tl(I) Accumulation and Stripping Measurements
The analytical procedure for Tl(I) determination consists of the following steps:
Sample Pretreatment:
Instrumental Parameters Setup:
- Transfer 10 mL of sample or standard to the electrochemical cell.
- Deoxygenate with high-purity nitrogen or argon for 300 seconds.
- Maintain inert atmosphere during measurements.
UPD Accumulation Step:
- Set electrode rotation rate to 2000 rpm.
- Apply accumulation potential of -0.5 V to -0.8 V (vs. Ag/AgCl) for 60-210 seconds, depending on required sensitivity.
- Note: Optimal accumulation potential should be determined experimentally for each electrode.
Stripping Step:
- After accumulation, stop electrode rotation and wait 10 seconds.
- Record square-wave stripping voltammogram from -1.0 V to +0.2 V (vs. Ag/AgCl) using the following parameters:
- Square wave amplitude: 25 mV
- Frequency: 25 Hz
- Step potential: 5 mV
Calibration:
- Construct calibration curve using standard additions method with at least three standard additions.
- Include blank measurement in each series.
Method Validation and Performance Characteristics
The UPD-SWV method at rotating AuFE was rigorously validated with the following performance characteristics [32]:
Table 2: Analytical Performance Characteristics of UPD-SWV for Tl(I) Determination
| Parameter | Value/Range | Conditions |
|---|---|---|
| Linear Range | 5–250 μg·L⁻¹ | R² > 0.995 |
| Limit of Detection (LOD) | 0.6 μg·L⁻¹ | Accumulation time: 210 s |
| Limit of Quantification (LOQ) | 2.0 μg·L⁻¹ | - |
| Intraday Precision (RSD) | ≤ 0.8% | n=3, at three concentration levels |
| Interday Precision (RSD) | ≤ 4.3% | n=9, over three days |
| Accuracy (Relative Error) | -5.6% to -1.7% | Intraday |
| Accuracy (Relative Error) | -4.8% to -1.3% | Interday |
| Preconcentration Factor | 300-fold | - |
For comparison with other techniques, ICP-MS methods for total thallium analysis demonstrate LODs of 0.037 ng/mL with linear range from 1.25 to 500 ng/mL plasma [7], while two-step direct immersion single-drop microextraction with GFAAS detection shows LODs of 6.3 ng/L for Tl(III) and 8.3 ng/L for Tl(I) [33].
Interference Studies
Interference effects were systematically evaluated for the UPD-SWV method [32]:
- Pb(II) and Cd(II) Interference: Significant peak overlap occurs in nitric acid medium
- Interference Elimination: Successfully overcome using citrate medium
- Other Cations: No significant interference from alkali and alkaline earth metals at environmentally relevant concentrations
- Organic Matter: Minimal effect on Tl(I) UPD signals in citrate medium
The Scientist's Toolkit: Research Reagent Solutions
Table 3: Essential Reagents and Materials for Tl(I) Determination by UPD-SWV
| Reagent/Material | Function/Purpose | Specifications/Notes |
|---|---|---|
| Gold Chloride (H[AuCl₄]) | Gold film electrodeposition | 1 mM solution in deionized water [32] |
| Thallium(I) Nitrate (TlNO₃) | Primary standard for calibration | Dissolve in 0.5 mmol/L HNO₃ [31] |
| Sodium Citrate | Interference suppression buffer | 0.1 M, pH 3-6 for Pb/Cd interference elimination [32] |
| Nitric Acid | Supporting electrolyte component | Trace metal grade, 10 mM concentration [32] |
| Sodium Chloride | Supporting electrolyte component | 10 mM concentration [32] |
| Glassy Carbon Electrode | Substrate for gold film | 3 mm diameter, polished with 0.05 μm alumina [32] |
| Nitrogen/Argon Gas | Deoxygenation of solutions | High purity (≥99.99%) [32] |
Applications to Real Samples
The UPD-SWV method has been successfully applied to the analysis of various sample matrices [32]:
- Drinking Water: Direct analysis after filtration and pH adjustment
- River Water: Requires citrate buffer addition to mitigate interference effects
- Complex Matrices: Tea samples analyzed with nanomolar Tl additions, achieving satisfactory recovery values
For samples requiring speciation analysis, the method can be combined with separation techniques such as the two-step direct immersion single-drop microextraction (TS-DI-SDME), which enables sequential separation of Tl(III) and Tl(I) at pH 6.0 [33].
Troubleshooting and Optimization Guidelines
Quality Assurance and Control
- Method Blanks: Include in each analytical batch to monitor contamination [7]
- Calibration Verification: Analyze independent standard after every 10 samples [7]
- Sample Preservation: For speciation analysis, add DTPA to stabilize Tl(III) [31]
- Recovery Studies: Perform standard additions for complex matrices to validate accuracy
The UPD-SWV method at a rotating gold-film electrode provides a sensitive, reproducible, and interference-resistant approach for determining Tl(I) in water samples and certified reference materials. With a detection limit of 0.6 μg·L⁻¹ and well-defined linear response from 5–250 μg·L⁻¹, this method meets regulatory requirements for thallium monitoring in drinking water. The protocol's effectiveness in various water matrices, combined with its portability and relatively low operational costs, makes it particularly valuable for environmental monitoring and toxicological studies where thallium speciation is critical for accurate risk assessment.
Thallium (Tl) is an extremely toxic heavy metal, with toxicity greater than that of mercury, cadmium, and lead [11]. Its toxicity stems from its ability to mimic potassium ions in biological systems due to similar ionic radii (Tl+: 164 pm, K+: 152 pm), allowing it to disrupt critical cellular processes [11]. The increasing industrial applications of thallium in semiconductor manufacturing, optics, and emerging technologies, coupled with its release through activities like sulfide ore processing and coal combustion, have raised significant environmental and health concerns [34] [11]. Consequently, accurate determination of thallium at trace levels in complex matrices—including food, biological fluids, and industrial effluents—is paramount for human health risk assessment and environmental monitoring. This application note details validated methodologies for thallium determination, with emphasis on the application of underpotential deposition (UPD) at gold-film electrodes within a broader research context.
Analytical Techniques for Thallium Determination
Multiple analytical techniques are employed for the determination of thallium, each offering distinct advantages in terms of sensitivity, selectivity, and applicability to different sample matrices.
Spectrometric Techniques
Inductively Coupled Plasma Mass Spectrometry (ICP-MS) is widely recognized for its exceptional sensitivity and is often used as a reference method. A validated method for determining thallium in foods via ICP-MS demonstrated a method limit of detection (MLOD) ranging from 0.0070 to 0.0498 μg kg⁻¹, with accuracy between 82.06% and 119.81% and precision within 10% [34]. This method was successfully applied to survey 304 various foods in the South Korean market, detecting thallium in 148 samples, with concentrations below 10 μg kg⁻¹ in 98% of the samples [34]. For biological matrices, an ICP-MS method validated for rodent plasma achieved a lower limit of quantitation (LLOQ) of 1.25 ng mL⁻¹ and a limit of detection (LOD) of 0.0370 ng mL⁻¹, with accuracy (Relative Error, RE) within -5.9% to 2.6% and precision (Relative Standard Deviation, RSD) ≤ 4.3% [7].
Graphite Furnace Atomic Absorption Spectrometry (GFAAS) is another sensitive technique, especially when coupled with preconcentration methods. A novel two-step direct immersion single-drop microextraction (TS-DI-SDME) procedure for GFAAS detection achieved LODs of 6.3 ng L⁻¹ for Tl(III) and 8.3 ng L⁻¹ for Tl(I), with a preconcentration factor of 300 [33].
Electroanalytical Techniques
Stripping Voltammetry presents a powerful alternative, offering high sensitivity, relatively inexpensive instrumentation, and portability for field analysis [11] [35]. The core principle involves pre-concentrating thallium onto the working electrode surface followed by an electrochemical stripping step that quantifies the metal.
A significant advancement in this field is the use of the Underpotential Deposition (UPD) phenomenon on gold-film electrodes (AuFE) [11]. UPD involves the formation of a monolayer of thallium ad-atoms on the gold substrate at a potential more positive than its Nernst equilibrium potential. This approach offers several analytical advantages over bulk deposition (Overpotential Deposition, OPD), including sharper stripping peaks, reduced interferences, and excellent analytical reproducibility due to minimal changes in electrode surface structure [11].
Table 1: Comparison of Analytical Techniques for Thallium Determination
| Technique | Principle | LOD | Linear Range | Key Applications |
|---|---|---|---|---|
| ICP-MS [34] [7] | Ionization & mass separation | 0.007-0.05 μg kg⁻¹ (food), 0.037 ng mL⁻¹ (plasma) | Wide dynamic range | Multi-element analysis in food, biological fluids |
| GFAAS with TS-DI-SDME [33] | Atomization & light absorption | 6.3 ng L⁻¹ (Tl(III)), 8.3 ng L⁻¹ (Tl(I)) | Not specified | Speciation analysis in food samples |
| UPD-SW-ASV at AuFE [11] | Electrochemical UPD & stripping | 0.6 μg L⁻¹ | 5–250 μg L⁻¹ | Water, tea samples |
| DPASV at Bi-AuMEA [20] | Electrochemical OPD & stripping | 8 × 10⁻¹¹ mol L⁻¹ (~16 ng L⁻¹) | 2 × 10⁻¹⁰ to 2 × 10⁻⁷ mol L⁻¹ | Ultra-trace analysis in water |
| DPASV at GC/RGO [35] | Electrochemical OPD & stripping | 1.229 μg L⁻¹ | 9.78 × 10⁻⁹ to 9.78 × 10⁻⁸ M | Grain products |
Experimental Protocols
Protocol 1: Determination of Tl(I) by UPD-Stripping Voltammetry at a Rotating Gold-Film Electrode
This protocol is adapted from the procedure for determining trace Tl(I) using underpotential deposition and square wave anodic stripping voltammetry (SW-ASV) on a rotating gold-film electrode (AuFE) [11].
3.1.1 Research Reagent Solutions Table 2: Essential Reagents for UPD-SW-ASV Protocol
| Reagent/Solution | Function | Specifications/Preparation |
|---|---|---|
| Gold Chloride Solution | Electrode substrate preparation | 1 mM H[AuCl₄] solution for AuFE electrodeposition |
| Supporting Electrolyte | Provides conducting medium | 10 mM HNO₃ and 10 mM NaCl, or citrate medium to mitigate Pb/Cd interference |
| Tl(I) Nitrate Stock | Primary standard | 1000 mg L⁻¹ in 1% HNO₃; dilute daily for working standards |
| Nitric Acid | Sample digestion/pH adjustment | Trace metal grade |
3.1.2 Workflow Diagram
3.1.3 Step-by-Step Procedure
Gold-Film Electrode (AuFE) Preparation: Prepare the AuFE by potentiostatic electrodeposition of gold onto a glassy carbon substrate from a 1 mM H[AuCl₄] solution. Apply a potential of -300 mV (vs. Ag/AgCl) for 300 s to form a gold film with a sub-nanoscale morphology and developed surface area [11].
Sample Pre-treatment:
- For solid samples (e.g., food, biological tissues), perform acid digestion. Typically, a sample (0.5 g) is digested with a mixture of 65% nitric acid and 30% hydrogen peroxide, followed by filtration and pH adjustment [35].
- For liquid samples (water, biological fluids), adjust the pH to 6.0 using appropriate buffers if necessary [33].
- To overcome interference from ions like Pb(II) and Cd(II), use a citrate medium instead of nitric acid alone in the supporting electrolyte [11].
UPD Pre-concentration:
- Transfer the prepared sample solution into the electrochemical cell containing the supporting electrolyte.
- Immerse the prepared AuFE, along with the reference (e.g., Ag/AgCl) and counter (e.g., platinum wire) electrodes.
- Under a controlled rotation rate and in a deoxygenated solution, apply a pre-concentration potential for a defined time (e.g., 210 s). This step is performed at a potential within the UPD region, selectively forming a Tl ad-atom monolayer on the AuFE surface [11].
Stripping and Measurement:
- After the deposition period, initiate the square-wave anodic stripping scan.
- Record the voltammogram. The oxidation (stripping) peak current of Tl is measured at approximately -0.6 V to -0.8 V (vs. Ag/AgCl) in the UPD region [11].
- The height of this peak is proportional to the concentration of Tl(I) in the sample.
Data Analysis:
- Quantify Tl(I) concentration using a matrix-matched calibration curve constructed from standard solutions analyzed under identical conditions.
- Under optimized conditions, the method typically offers a linear response from 5 to 250 μg L⁻¹ with a coefficient of determination (R² > 0.995) and a LOD of 0.6 μg L⁻¹ at a 210 s accumulation time [11].
Protocol 2: ICP-MS Determination of Total Thallium in Food and Biological Matrices
ICP-MS is a benchmark method for ultra-trace metal analysis. This protocol summarizes the validated procedures for food and biological matrices [34] [7].
3.2.1 Workflow Diagram
3.2.2 Step-by-Step Procedure
Sample Digestion:
- Food Samples: Accurately weigh ~0.5 g of homogenized sample into a digestion vessel. Add concentrated nitric acid and, if needed, hydrogen peroxide. Heat the mixture using a microwave-assisted digestion system or hot block until a clear digest is obtained [34] [35].
- Biological Fluids/Tissues: Digest plasma, tissue homogenates (e.g., brain, fetus), or urine with concentrated nitric acid using a graphite heating block [7].
Dilution and Matrix Adjustment:
- Cool the digest and dilute to a known volume with high-purity deionized water.
- For high-salt matrices (e.g., sea salt), reduce the sample intake (e.g., to 0.1 g) and/or perform additional dilutions to keep total dissolved solids below 0.2% to minimize matrix effects and instrumental drift [34].
- Add an internal standard (e.g., Praseodymium, Pr) to correct for non-spectral interferences and signal drift [7].
ICP-MS Analysis:
- Analyze the diluted sample solutions using ICP-MS. The instrument is tuned for optimal sensitivity and stability.
- Thallium is typically measured at its major isotope, m/z 205.
- The calibration curve, constructed from matrix-matched standards, should demonstrate excellent linearity (R² > 0.999) [34] [7].
Quality Control:
- Include procedural blanks, certified reference materials (CRMs) (e.g., BCR-679 white cabbage for food, GBW 07401 soil for environmental samples), and spiked recovery samples in each batch to ensure accuracy and precision [34] [35].
- Acceptable recovery ranges for quality control samples are typically between 80-120%, with precision (RSD) ≤ 10% [34] [7].
Applications in Complex Matrices
The validated methods have been successfully applied to determine thallium in a wide range of complex sample matrices.
Food Samples
Comprehensive monitoring of thallium in food is critical for exposure assessment. A South Korean study of 304 food items found detectable Tl levels in nearly half the samples [34]. Key findings include:
- Higher Tl Content in Animal Products: Fisheries and animal products generally contained higher Tl levels than cereals and vegetables [34].
- Specific Food Concentrations: Sweet potatoes showed relatively high levels (up to 13.21 μg kg⁻¹), while sorghum contained 5.27 μg kg⁻¹. Tubers, nuts, and seafood were identified as food groups with elevated Tl concentrations [34].
- Grain Products: Analysis of commercial grain products from Poland confirmed the presence of thallium, with an average content of 0.0268 ± 0.0798 mg kg⁻¹, highlighting the risk of bioaccumulation from regular consumption [35].
- Speciation Analysis: The TS-DI-SDME-GFAAS method enables the separate determination of the more toxic Tl(III) species and the more stable Tl(I) species in food, providing crucial information for accurate risk assessment [33].
Biological Fluids
Monitoring thallium in biological matrices is essential for toxicology studies and biomonitoring.
- Toxicology Studies: The validated ICP-MS method for rodent plasma (LLOQ: 1.25 ng mL⁻¹) is suitable for determining Tl levels in studies investigating the toxicity of thallium(I) sulfate, supporting the filling of chronic toxicity data gaps [7].
- Background Levels: The method detected background levels of Tl in control rat fetal homogenates, brain homogenates, and urine, demonstrating its sensitivity for baseline measurements in biological systems [7].
Industrial and Environmental Waters
Industrial effluents and environmental waters are primary pathways for thallium contamination.
- Ultra-Trace Analysis: A combination of thallium(I)-imprinted polymer and vortex-assisted liquid-liquid microextraction (IIP-VALLME) achieved an ultra-low LOD of 2.1 pg mL⁻¹ and a high preconcentration factor of 2000 for the determination of Tl(I) in water samples, including industrial wastewater and urban sewage [36].
- Electroanalysis Applications: The UPD-SW-ASV method at a AuFE has been successfully applied to the analysis of drinking water, river water, and black tea samples, demonstrating its practicality for environmental monitoring [11].
The accurate determination of thallium in complex matrices is a critical analytical challenge addressed by a range of sophisticated techniques. While ICP-MS provides benchmark sensitivity for multi-element applications in food and biological fluids, electroanalytical techniques, particularly stripping voltammetry, offer a cost-effective and highly sensitive alternative. The UPD-based method at gold-film electrodes represents a significant advancement in electrochemical sensing, providing excellent sensitivity and selectivity for Tl(I) determination in water and food samples. The detailed protocols and application data presented herein provide researchers and analytical professionals with robust methodologies for monitoring this highly toxic element, thereby supporting public health protection and environmental surveillance.
Procedures for Electrode Regeneration, Re-polishing, and Long-Term Stability Assessment
This application note details standardized protocols for maintaining the analytical performance of gold-film electrodes, specifically within the context of research focused on the determination of thallium (Tl) by underpotential deposition (UPD). Gold electrodes are prized for their excellent conductivity, wide potential window, and resistance to corrosion [37] [20]. However, their surface properties can be compromised by repeated use, leading to passivation, contamination, and signal drift. The procedures outlined herein for regeneration, re-polishing, and stability assessment are critical for ensuring the reproducibility, sensitivity, and long-term reliability of electrochemical measurements, particularly in trace analysis of toxic elements like thallium [11].
Experimental Protocols
Electrochemical Regeneration of Gold Electrode Surfaces
This two-step electrochemical cleaning procedure effectively removes organic contaminants, self-assembled monolayers (SAMs), and protein layers without damaging the gold surface, restoring its initial electrochemical activity [37].
Principle: The first step in a dilute sulfuric acid solution serves to clean the surface and may form a gold oxide layer. The second step in potassium ferricyanide provides an oxidative desorption of contaminants, with the cyclic voltammetry sweeps ensuring a thorough cleaning [37].
Materials:
- Potentiostat/Galvanostat
- Standard three-electrode cell
- Working Electrode: Gold-film or gold screen-printed electrode (Au-SPE)
- Counter Electrode: Platinum wire
- Reference Electrode: Ag/AgCl (e.g., 3 M KCl)
- 10 mM Sulfuric Acid (H₂SO₄) solution
- 1 mM Potassium Ferricyanide (K₃Fe(CN)₆) solution
- Deionized water
Procedure:
- Setup: Place the gold working electrode in an electrochemical cell containing the 10 mM H₂SO₄ solution.
- Step 1 - Acid Cleaning:
- Run cyclic voltammetry (CV) for 5-10 cycles between 0 V and +1.2 V (vs. Ag/AgCl) at a scan rate of 100 mV/s.
- Remove the electrode from the H₂SO₄ solution and rinse thoroughly with deionized water.
- Step 2 - Ferricyanide Cleaning:
- Transfer the electrode to a fresh cell containing the 1 mM K₃Fe(CN)₆ solution.
- Run CV for 5-10 cycles between 0 V and +0.8 V (vs. Ag/AgCl) at a scan rate of 100 mV/s.
- Final Rinse: Remove the electrode, rinse thoroughly with deionized water, and dry under a stream of nitrogen gas.
- Validation: Confirm the success of the regeneration by verifying that the CV response in a standard redox probe (e.g., 1 mM K₃Fe(CN)₆ / 0.1 M KCl) matches that of a new, untreated bare gold electrode [37].
Mechanical Re-polishing of Gold-Film Electrodes
For gold-film electrodes on solid substrates (e.g., glassy carbon), mechanical polishing is essential for renewing the surface topography and removing irreversibly adsorbed species or a degraded gold layer.
Principle: Abrasive polishing materials level the electrode surface, exposing a fresh, reproducible gold surface for analysis. This is particularly important when the electrode shows physical damage or when electrochemical cleaning is insufficient.
Materials:
- Polishing alumina slurry (e.g., 0.05 µm particle size) or diamond paste
- Polishing cloths (e.g., microcloth)
- Sonication bath
- Deionized water
Procedure:
- Initial Rinse: Rinse the electrode surface with deionized water to remove loose particles.
- Polishing: Place a small amount of alumina slurry on the polishing cloth. Gently polish the electrode surface using a figure-8 motion for 60 seconds. Apply minimal pressure to avoid damaging the film.
- Rinse: Rinse the electrode thoroughly with deionized water to remove all alumina particles.
- Sonication: Place the electrode in a beaker with deionized water and sonicate for 1-2 minutes to remove any adhered polishing material.
- Final Rinse: Rinse again with deionized water and dry. The electrode is now ready for use or for a subsequent electrochemical regeneration if needed.
Protocol for Thallium UPD and Anodic Stripping Voltammetry
This protocol is optimized for the determination of Tl(I) using a regenerated gold-film electrode [11].
Materials:
- Supporting electrolyte: 10 mM HNO₃ with 10 mM NaCl, or a citrate medium to mitigate Pb(II) and Cd(II) interferences [11].
- Standard Tl(I) solution (e.g., TlNO₃ in 0.01 M HNO₃) [20].
- Nitrogen gas (oxygen-free).
Procedure:
- Electrode Preparation: Regenerate and/or re-polish the gold-film electrode using the procedures described in sections 2.1 and 2.2.
- Deposition: Transfer 10 mL of supporting electrolyte and an appropriate aliquot of the Tl(I) standard to the electrochemical cell. Purge with nitrogen for 300 seconds. While stirring, hold the electrode at the UPD deposition potential (specific potential must be optimized, typically more positive than the Nernst potential for Tl⁺/Tl⁰) for 60-210 seconds [11].
- Stripping: After the deposition time, cease stirring and allow the solution to become quiescent for 10 seconds. Initiate a square-wave anodic stripping voltammetry (SW-ASV) scan from the deposition potential to a more positive potential (e.g., -0.2 V to -0.6 V, depending on medium) using optimized parameters (amplitude: 25 mV, frequency: 25 Hz) [11].
- Analysis: Measure the height of the Tl anodic stripping peak for quantification.
Table 1: Optimized Parameters for SW-ASV Determination of Tl(I) at a Gold-Film Electrode [11].
| Parameter | Optimized Condition |
|---|---|
| Supporting Electrolyte | 10 mM HNO₃ + 10 mM NaCl |
| Deposition Potential | UPD region (vs. Ag/AgCl) |
| Deposition Time | 60 - 210 s |
| Electrode Rotation | 2000 rpm (if using RDE) |
| Square-Wave Amplitude | 25 mV |
| Square-Wave Frequency | 25 Hz |
| Linear Range | 5 – 250 μg·L⁻¹ |
| Limit of Detection (LOD) | 0.6 μg·L⁻¹ (210 s deposition) |
Assessment of Electrode Long-Term Stability
A systematic approach to stability assessment is necessary to validate electrode performance over time and multiple regeneration cycles.
Methods for Stability Assessment:
- Electrochemical Impedance Spectroscopy (EIS): Monitor the charge transfer resistance (Rₜᵣ) in a standard redox probe (e.g., [Fe(CN)₆]³⁻/⁴⁻) after each regeneration cycle. A stable Rₜᵣ indicates maintained electron transfer kinetics [37].
- Cyclic Voltammetry (CV) in H₂SO₄: The characteristic CV profile of gold in sulfuric acid (showing distinct gold oxide formation and reduction peaks) should be reproducible after cleaning, confirming surface integrity [37].
- Analytical Signal Reproducibility: For Tl(I) determination, the peak current and potential from SW-ASV measurements should be consistent. A study on gold screen-printed electrodes demonstrated that repetitive measurement is possible with maintained reproducibility for at least five regeneration cycles [37].
- Surface Inspection: Use optical microscopy to check for physical damage, delamination, or pitting after multiple polishing and regeneration cycles [37].
Table 2: Key Reagents for Electrode Regeneration and Thallium Determination.
| Reagent | Function | Application Note |
|---|---|---|
| Sulfuric Acid (H₂SO₄) | Electrolyte for initial CV cleaning and oxide formation | Use at low concentration (10 mM) for safe, non-toxic cleaning [37] |
| Potassium Ferricyanide (K₃Fe(CN)₆) | Redox probe for oxidative desorption and performance validation | Second step in electrochemical regeneration; also used to validate surface activity [37] |
| Nitric Acid (HNO₃) | Supporting electrolyte for Tl(I) determination | Provides an acidic medium for analysis (10 mM) [11] |
| Alumina Slurry | Abrasive for mechanical polishing | 0.05 µm particle size recommended for fine polishing |
| Citrate Buffer | Complexing agent | Mitigates interference from Pb(II) and Cd(II) during Tl determination [11] |
Workflow and Troubleshooting
The following workflow diagrams the integrated process of electrode use, maintenance, and quality control.
Diagram 1: Electrode lifecycle management workflow.
Common Issues and Troubleshooting:
- Low Stripping Signal: Check deposition potential/time; ensure electrode surface is properly regenerated; verify solution deaeration.
- High Background Current: The electrode may be contaminated; perform a full electrochemical regeneration cycle.
- Poor Reproducibility between Regenerations: The gold film may be degrading; inspect under a microscope and consider re-preparing the gold film if the substrate is reusable [11] [38].
- Peak Broadening or Shift: This can indicate surface passivation or a change in the electrochemical properties of the gold film, necessitating re-polishing [38].
The consistent application of these protocols for electrode regeneration, re-polishing, and stability assessment is fundamental for achieving reliable and reproducible results in the long-term use of gold-film electrodes for thallium determination and other sensitive electrochemical analyses. By integrating these procedures into a regular maintenance schedule, researchers can ensure data quality and extend the functional lifespan of their electrodes.
Enhancing Performance and Overcoming Analytical Challenges in Tl Detection
Strategies for Minimizing Interference from Common Ions (e.g., Using EDTA and Optimized Buffers)
The accurate electrochemical determination of thallium, a highly toxic heavy metal, is critically important in environmental and clinical monitoring [39] [40]. A significant challenge in trace thallium analysis arises from interference by common co-existing ions, which can distort signals and compromise analytical accuracy. This application note details proven strategies, centered on chemical masking and optimized buffer systems, to suppress these interferences. These protocols are developed within the context of advanced research on thallium determination using underpotential deposition at gold-film electrodes, providing researchers with robust methodologies to achieve highly selective and reliable measurements.
Research Reagent Solutions for Interference Minimization
The following table catalogues essential reagents and their specific functions in mitigating interference during thallium analysis.
Table 1: Key Research Reagents for Interference Minimization in Thallium Determination
| Reagent | Function/Application | Key Experimental Detail |
|---|---|---|
| Ethylenediaminetetraacetic Acid (EDTA) | Complexing agent for interfering heavy metal ions (e.g., Bi(III), Cu(II), Pb(II), Cd(II)) [6]. | Used in a 0.2 M concentration in sample preparation; forms stable complexes at pH 4.5, removing interferents from analysis [6]. |
| Ascorbic Acid | Reducing agent for converting Tl(III) to Tl(I) and mitigating oxidative interferents [6]. | Added after sample mineralization (e.g., 2.5 mL of 1 M solution) to ensure analysis of total thallium as Tl(I) [6]. |
| Ammonia Solution | pH adjustment for optimizing complexation and electrochemical conditions [6]. | Used to adjust sample solution pH to 4.5, optimal for EDTA complexation and specific electrochemical cells [6]. |
| Potassium Nitrate / Nitric Acid | Supporting electrolyte components for controlling ionic strength and electrochemical deposition [10]. | Provides a consistent ionic matrix for electrochemical analysis [10]. |
| Calixarene Ionophores | Selective molecular receptors for Tl(I) in ion-selective electrodes [40] [41]. | Synthesized ionophores with tuned cavities offer excellent selectivity over Zn²⁺, Ca²⁺, Cd²⁺, etc., with Ag⁺ as the primary interferent [40]. |
Established Interference Minimization Strategies
Chemical Masking with Complexing Agents
The use of complexing agents to selectively bind and mask interfering ions is a highly effective and widely adopted strategy.
EDTA as a Primary Masking Agent: EDTA is a cornerstone reagent for this purpose. It forms stable complexes with a range of di- and trivalent metal ions at a defined pH of 4.5, effectively removing them from interference. Research confirms that EDTA successfully complexes bismuth (III), copper (II), iron (II), antimony (III), lead (II), and cadmium (II), even when their concentrations are a hundred times higher than that of thallium [6]. This makes it indispensable for analyzing complex matrices like digested Shilajit, grain products, and soil samples [6] [35].
Combination with Reducing Agents: The reducing agent ascorbic acid is often used in conjunction with EDTA. Its primary role is to reduce the more toxic and potentially interfering Tl(III) to the more stable Tl(I) form, ensuring that the total thallium content is measured consistently as Tl(I) [6]. This reduction step also helps mitigate interference from other oxidizing species in the sample matrix.
Sensor Surface Engineering and Ionophore Design
For potentiometric sensors, the design of the sensing element itself is a powerful strategy to achieve selectivity.
Calixarene-Based Ionophores: Tailored calixarene molecules act as synthetic hosts for Tl(I) ions. By "pinching" the aromatic units to create a precise cavity size, these ionophores can discriminate against ions of different sizes. Electrodes incorporating these novel ionophores demonstrate excellent selectivity against Zn²⁺, Ca²⁺, Ba²⁺, Cu²⁺, Cd²⁺, and Al³⁺, with only moderate interference from Pb²⁺, alkali metals (K⁺, Na⁺), and H⁺ [40] [41]. Notably, silver (Ag⁺) remains a significant interferent for this class of ionophores [40].
Nanocomposite-Modified Electrodes: In voltammetric sensing, the electrode surface can be modified with advanced materials to enhance selectivity. For instance, a sensor modified with a MnO₂@Fe₃O₄/Sep/MWCNT nanocomposite was reported to be highly selective for Tl(I) in the presence of various non-target interfering ions [39].
Optimization of Operational Parameters
Fine-tuning electrochemical parameters is crucial for minimizing interference and maximizing signal-to-noise ratio.
- pH Control: Adjusting the pH of the supporting electrolyte is critical. A pH of 4.5 is frequently used with EDTA to ensure optimal complexation of interfering metals [6]. This pH is also compatible with the stable operation of many working electrodes.
- Deposition Potential Control: The potential applied during the pre-concentration or deposition step must be carefully selected. For instance, on a silver nanoparticle-modified electrode, a deposition potential of -1.0 V (vs. SCE) was found to be optimal for thallium, maximizing the signal while minimizing the co-deposition of other metals [10].
Comparative Performance of Analytical Methods
The effectiveness of these interference-minimization strategies is reflected in the performance of the final analytical methods, as summarized below.
Table 2: Quantitative Performance of Thallium Detection Methods Employing Interference Minimization
| Analytical Method / Sensor | Key Interference Strategy | Linear Range | Limit of Detection (LOD) | Primary Interferents Addressed |
|---|---|---|---|---|
| DPASV with EDTA Masking [6] | EDTA complexation at pH 4.5 | N/A | 6.58×10⁻³ µg/mL | Bi(III), Cu(II), Fe(II), Sb(III), Pb(II), Cd(II) |
| Calixarene-Based ISE [40] [41] | Molecular cavity selectivity | 10⁻² – 10⁻⁶ M | 8 nM (≈ 1.63 µg/L) | Zn²⁺, Ca²⁺, Ba²⁺, Cu²⁺, Cd²⁺, Al³⁺ |
| MnO₂@Fe₃O₄/Sep/MWCNT/GCE Sensor [39] | Nanocomposite selectivity | 0.1 – 1500 µg/L | 0.03 µg/L | Various non-target ions (unspecified) |
| GCE/AgNPs-E1451 Sensor [10] | Electrode surface modification | 19 – 410 µg/L | 18.8 µg/L | (Performance in real soil sample demonstrated) |
| GC/Reduced Graphene Oxide Electrode [35] | Electrocatalytic material | ~10⁻⁸ – 10⁻⁷ M | 1.229 µg/L | (Applied to grain product analysis) |
Experimental Protocol: FI-DP-ASV with EDTA Masking for Complex Matrices
This protocol provides a detailed methodology for determining thallium in complex solid samples (e.g., Shilajit, grains, soils) using Flow-Injection Differential-Pulse Anodic Stripping Voltammetry (FI-DP-ASV) with chemical masking, based on established methods [6] [35].
Reagents and Equipment
- Reagents: HNO₃ (65%), H₂O₂ (30%), HF (73%, if silicate matrices are present), Ascorbic Acid, EDTA disodium salt, Ammonia solution (25%), all of analytical grade.
- Equipment: Microwave digestion system, Voltammetric Analyzer (e.g., µAutolab), Three-electrode cell (Mercury Film Electrode or other suitable working electrode, Ag/AgCl reference electrode, Pt counter electrode).
Sample Preparation and Digestion Workflow
The sample preparation process involves digestion, pH adjustment, and chemical masking prior to electrochemical analysis, as illustrated in the following workflow:
Procedure:
- Weighing: Accurately weigh 0.25 g (for supplements) to 0.5 g (for grains) of the homogenized, dried sample into a Teflon microwave digestion vessel [6] [35].
- Digestion: Add 2.0 mL of concentrated HNO₃ and 1.0 mL of H₂O₂ to the vessel. Perform microwave-assisted digestion according to the manufacturer's safety guidelines and a standardized program for organic matrices [6].
- Post-Digestion Treatment: After cooling, evaporate the digest if necessary. Filter the resulting solution to remove any particulates [35].
- Chemical Conditioning: To the filtered digest, add 2.5 mL of 1 M ascorbic acid solution and mix thoroughly to ensure complete reduction of Tl(III) to Tl(I). Then, add 6.25 mL of 0.2 M EDTA solution [6].
- pH Adjustment: Using an ammonia solution, carefully adjust the pH of the mixture to 4.5. This pH is critical for effective EDTA complexation of interferents and for the subsequent electrochemical measurement [6].
- Final Preparation: Quantitatively transfer the solution to a 25 mL volumetric flask and make up to the mark with reverse osmosis or distilled water [35]. The sample is now ready for analysis.
Instrumental Analysis and Measurement
- Electrode Preparation: If using a Mercury Film Electrode (MFE), prepare the film according to standard procedures. Note the movement towards non-toxic alternatives like bismuth or silver nanoparticle-modified electrodes [10].
- Parameters for FI-DP-ASV:
- Measurement: Inject the prepared sample into the flow-injection system. The supporting electrolyte (e.g., 0.05 M EDTA at pH 4.5) can be used as the carrier stream. Record the anodic stripping voltammogram and identify the thallium peak. Use the standard addition method for quantification to account for matrix effects.
The combination of chemical masking with agents like EDTA and ascorbic acid, alongside sensor engineering and optimized electrochemical parameters, provides a robust framework for overcoming ionic interference in the trace determination of thallium. The protocols detailed herein, particularly the sample preparation workflow for complex matrices, enable researchers to achieve the high selectivity and sensitivity required for reliable environmental and toxicological monitoring.
The accurate detection of thallium, a highly toxic heavy metal, is of paramount importance in environmental monitoring and toxicological research. Within the context of advanced electrochemical sensing, particularly for a thesis focused on the determination of thallium by underpotential deposition (UPD) at gold-film electrodes, the composition and architecture of the sensing membrane are critical determinants of performance. This document details the synergistic roles of crown ethers as ionophores and carbon nanotube (CNT) modifications as transducers in optimizing membrane selectivity and sensitivity. The integration of these materials creates a sophisticated sensing interface that enhances the electron-transfer properties and provides molecular recognition capabilities essential for selective thallium(I) detection in complex samples, building upon the foundation of UPD methodologies [42] [43].
The Synergistic Role of Crown Ethers and CNTs
Crown Ethers as Selective Ionophores
Crown ethers are macrocyclic compounds renowned for their ability to form stable, selective complexes with specific metal ions, a property that makes them ideal ionophores in potentiometric sensors. The cavity size of the ether ring dictates ionic selectivity; for thallium(I) (Tl⁺), which has an ionic radius of approximately 1.50 Å, dibenzo-18-crown-6 (DB18C6) with a cavity diameter of 2.6–3.2 Å demonstrates excellent complexation ability [42]. The complex formation constant (log βₘₗ) between DB18C6 and Tl⁺ has been measured at 5.99, indicating strong and stable interaction [42]. This selective binding is the primary mechanism that differentiates Tl⁺ from other commonly coexisting cations in a sample.
The function of the crown ether within a polymeric sensing membrane (typically based on PVC or similar matrices) is to selectively extract the target ion from the aqueous sample phase into the organic membrane phase. This process generates a phase boundary potential, which is measured against a reference potential. The stability of the crown ether-ion complex directly influences the sensor's selectivity coefficients, which quantify the sensor's preference for the primary ion over interferents. The use of DB18C6 has enabled the development of Tl⁺ sensors with a near-Nernstian response of 57.3 mV/decade over a wide activity range [42].
Carbon Nanotubes as Ion-to-Electron Transducers
Carbon nanotubes, particularly multi-walled carbon nanotubes (MWCNTs), serve a crucial function as solid-contact ion-to-electron transducers in modern potentiometric sensors [44] [45] [42]. In a standard configuration, they are applied as a layer between the electronic conductor (e.g., a gold plate) and the ion-selective membrane.
Their effectiveness stems from several key properties:
- High Electrical Conductivity: MWCNTs facilitate rapid electron transfer, minimizing electrode impedance and improving signal stability [45].
- Large Specific Surface Area: This property grants them a high electrical double-layer capacitance, which shields the sensing membrane from potential drifts caused by variable redox couples in the underlying conductor [42].
- Hydrophobicity: The inherently hydrophobic nature of CNTs helps prevent the formation of a thin water layer between the membrane and the transducer, a common source of potential instability and long-term drift in solid-contact electrodes [42].
Electrochemical impedance and chronopotentiometry studies on electrodes using MWCNT transducer layers have demonstrated significantly lower membrane resistance and higher capacitance compared to structures without them, confirming their role in enhancing sensor robustness and performance [42].
Synergy in the Hybrid Composite
The combination of crown ethers and CNTs creates a sensing membrane with complementary functions. The crown ether provides the essential selectivity by acting as a molecular recognition element, while the CNT layer ensures efficient signal transduction and overall sensor stability. This synergy results in a membrane-free or solid-contact sensor design that is more robust, easier to miniaturize, and better suited for disposable, on-site analysis compared to traditional liquid-contact electrodes. This architecture is perfectly suited to be coupled with the high sensitivity of underpotential deposition techniques on gold films for ultra-trace thallium detection [42] [43].
Quantitative Performance Data
The table below summarizes the performance characteristics of a Tl⁺-selective electrode based on a DB18C6/MWCNT composite, alongside other relevant crown-ether-based sensors for ionic comparison.
Table 1: Performance Metrics of Crown Ether-Based Sensors for Metal Ion Detection
| Target Ion | Crown Ether Ionophore | Linear Response Range (M) | Detection Limit (M) | Slope (mV/decade) | Key Composite Material |
|---|---|---|---|---|---|
| Thallium (I) | Dibenzo-18-crown-6 (DB18C6) [42] | ( 4.5 \times 10^{-6} ) to ( 7.0 \times 10^{-4} ) | ( 3.2 \times 10^{-7} ) | 57.3 | Multiwall Carbon Nanotubes (MWCNTs) |
| Potassium (I) | 18-crown-6 [46] | Micromolar ranges | ~1 × 10⁻⁶ | Not Specified | Reduced Graphene Oxide (RGO) |
| Potassium (I) | 1-aza-18-crown-6 [47] | ( 10^{-7} ) to ( 10^{-13} ) | ( 10^{-15} ) | N/A (EIS Sensor) | Graphene Oxide (GO) |
| Cerium (III) | Thiol-surfactant (Custom) [48] | ( 3.25 \times 10^{-10} ) to ( 1.0 \times 10^{-1} ) | ( 3.25 \times 10^{-10} ) | 19.95 | Gold Nanoparticles (GNPs) |
Table 2: Key Advantages of Carbon Nanomaterials in Electrochemical Sensors
| Material Property | Carbon Nanotubes (CNTs) [45] | Graphene [45] | Metal Oxides (e.g., SnO₂) [45] | Impact on Sensor Performance |
|---|---|---|---|---|
| Electrical Conductivity | High (10² – 10⁵ S/m) | High (~10⁴ S/m) | Moderate to Low (~10⁻² – 10⁰ S/m) | Enables fast electron transfer and low impedance. |
| Specific Surface Area | Very High (>1000 m²/g) | High (~2630 m²/g) | Moderate (~10–50 m²/g) | Provides high double-layer capacitance for stable potentials. |
| Mechanical Strength | Exceptional (Young’s modulus ~1 TPa) | High (Young’s modulus ~1 TPa) | Brittle | Allows for robust and flexible sensor designs. |
| Functionalization | Excellent (Covalent & Non-Covalent) | Excellent | Limited (Surface Modification) | Permits tailoring of selectivity and dispersion. |
Experimental Protocols
Protocol 1: Fabrication of a MWCNT-Modified Gold Electrode
This protocol describes the preparation of a solid-contact transducer layer on a gold-film electrode, a foundational step for constructing a thallium(I)-selective sensor [42].
Materials:
- Gold plate or gold-film working electrode
- Purified Multi-Walled Carbon Nanotubes (MWCNTs)
- N,N-Dimethylformamide (DMF) or other suitable solvent
- Ultrasonic bath
- Micro-pipette
Procedure:
- Electrode Pretreatment: Clean the gold electrode surface thoroughly. A common method involves cyclic voltammetry in a 0.5 M H₂SO₄ solution until a stable voltammogram characteristic of clean gold is obtained. Rinse with copious amounts of deionized water.
- MWCNT Dispersion: Weigh approximately 1.0 mg of purified MWCNTs into a glass vial. Add 1.0 mL of DMF. Seal the vial and place it in an ultrasonic bath for 60–90 minutes to achieve a homogeneous, black, and stable dispersion.
- Layer Deposition: Using a micro-pipette, deposit a precise volume (e.g., 5–10 µL) of the MWCNT dispersion directly onto the active surface of the pretreated gold electrode.
- Solvent Evaporation: Allow the electrode to dry at room temperature or under a mild heat lamp until all solvent has evaporated, leaving a uniform, black MWCNT film on the gold surface.
- Quality Inspection: Visually inspect the film for homogeneity. Electrochemical characterization via Cyclic Voltammetry (CV) or Electrochemical Impedance Spectroscopy (EIS) in a solution containing a redox probe (e.g., [Fe(CN)₆]³⁻/⁴⁻) is recommended to confirm the enhanced surface area and conductivity.
Protocol 2: Preparation of Crown Ether-Based Ion-Selective Membrane
This protocol covers the fabrication and application of the ion-selective membrane containing the crown ether ionophore [42].
Materials:
- Dibenzo-18-crown-6 (DB18C6)
- High molecular weight Poly(Vinyl Chloride) (PVC)
- Plasticizer (e.g., 2-Nitrophenyl octyl ether (o-NPOE))
- Potassium tetrakis(4-chlorophenyl)borate (KTpClPB) - lipophilic additive
- Tetrahydrofuran (THF) - solvent
Procedure:
- Membrane Cocktail Formulation: In a glass vial, accurately weigh the following components to make a typical membrane mixture:
- 1.0 wt% Dibenzo-18-crown-6 (Ionophore)
- 0.5 wt% KTpClPB (Ionic Additive)
- 65.5 wt% o-NPOE (Plasticizer)
- 33.0 wt% PVC (Polymer Matrix)
- Dissolution: Add 2-3 mL of THF to the vial. Cap the vial and stir on a magnetic stirrer or vortex mixer until all components are completely dissolved, forming a homogeneous, viscous solution.
- Membrane Deposition: Using a pipette, carefully cast the membrane cocktail onto the previously prepared MWCNT-modified gold electrode. A common technique is to use a glass ring fixed on the electrode surface to contain the solution.
- THF Evaporation: Allow the THF to evaporate slowly overnight at room temperature, covered to prevent rapid evaporation and dust contamination. This forms a flexible, transparent polymer membrane.
- Conditioning: Before the first use and for storage, condition the finished electrode in a solution of ( 1.0 \times 10^{-3} ) M TlNO₃ (or TlCl) for at least 12-24 hours to establish a stable equilibrium at the membrane-sample interface.
Protocol 3: Potentiometric Measurement and Selectivity Determination
This protocol outlines the procedure for calibrating the sensor and evaluating its selectivity, a critical parameter for real-world application.
Materials:
- Fabricated Tl⁺-selective electrode (from Protocol 2)
- Double-junction reference electrode (e.g., Ag/AgCl)
- Standard solutions of Tl⁺ (e.g., ( 10^{-7} ) M to ( 10^{-2} ) M)
- Solutions of potential interfering ions (e.g., Na⁺, K⁺, Ca²⁺, Mg²⁺)
- Potentiometer with high input impedance
Procedure:
- Calibration:
- Immerse the conditioned Tl⁺ sensor and the reference electrode in a beaker containing the lowest concentration Tl⁺ standard solution (e.g., ( 10^{-7} ) M) under gentle stirring.
- Record the stable potentiometric reading (in mV) once the signal has stabilized (response time < 10 s).
- Rinse the electrodes with deionized water and blot dry.
- Repeat the measurement for all standard solutions in order of increasing concentration.
- Plot the measured potential (E) versus the logarithm of Tl⁺ activity (log a_{Tl⁺}). The linear portion of this plot will yield the slope (mV/decade) and detection limit.
- Selectivity Coefficient Determination (Separate Solution Method):
- Measure the potential, ( EA ), for a fixed concentration of the primary ion, Tl⁺ (e.g., ( 1.0 \times 10^{-3} ) M).
- Measure the potential, ( EB ), for the same concentration of an interfering ion, B (e.g., ( 1.0 \times 10^{-3} ) M K⁺).
- Calculate the selectivity coefficient, ( \log K{Tl⁺, B}^{pot} ), using the following equation: [ \log K{Tl⁺, B}^{pot} = \frac{(EB - EA) \cdot zA F}{2.303 RT} ] where ( zA ) is the charge of Tl⁺ (+1), F is the Faraday constant, R is the gas constant, and T is the temperature in Kelvin. A significantly negative log K value indicates high selectivity for Tl⁺ over the interfering ion.
The Scientist's Toolkit: Research Reagent Solutions
Table 3: Essential Materials for Crown Ether/CNT-Modified Sensor Fabrication
| Reagent/Material | Function/Role | Specification Notes |
|---|---|---|
| Dibenzo-18-crown-6 | Primary ionophore for selective Tl⁺ complexation. | Purity ≥ 97%. Store in a desiccator, protected from light. |
| Multiwall Carbon Nanotubes (MWCNTs) | Solid-contact ion-to-electron transducer layer. | Purity > 95%; length 1-10 µm; OD 10-30 nm. Functionalized (COOH) variants may improve dispersion. |
| Poly(Vinyl Chloride) (PVC) | Polymer matrix for the ion-selective membrane. | High molecular weight. Provides mechanical stability. |
| 2-Nitrophenyl octyl ether (o-NPOE) | Plasticizer for the PVC membrane. | Lipophilic, high dielectric constant to improve ionophore mobility and lower membrane resistance. |
| Potassium tetrakis(4-chlorophenyl)borate | Lipophilic anionic additive in the membrane. | Prevents anion interference and optimizes the potentiometric response slope. |
| Tetrahydrofuran (THF) | Volatile solvent for membrane casting. | Anhydrous, inhibitor-free. Use in a fume hood. |
| Thallium(I) Standard Solutions | For sensor calibration and conditioning. | Prepared from TlNO₃ or TlCl salts. Handle with extreme care due to high toxicity. |
Workflow and Signaling Diagram
The following diagram illustrates the sequential fabrication process of the optimized sensing membrane and the signaling mechanism from ionic recognition to electronic signal output.
Diagram 1: Sensor fabrication workflow and signaling mechanism.
The strategic optimization of the sensing membrane through the incorporation of crown ether ionophores and carbon nanotube modifications presents a highly effective pathway to achieving exceptional selectivity and sensitivity for thallium(I) detection. The protocols and data outlined herein provide a reliable framework for the fabrication and characterization of such advanced electrochemical sensors. This optimized membrane architecture, when integrated with the underpotential deposition technique on a gold-film electrode, forms a powerful analytical platform for the precise and reliable determination of trace-level thallium, addressing a significant need in environmental and analytical chemistry.
Electrode fouling presents a significant challenge in electrochemical analysis, particularly when dealing with complex sample matrices such as biological fluids, environmental samples, and industrial process streams. The accumulation of non-specific material on the electrode surface degrades sensor performance through various mechanisms including blocked active sites, impaired electron transfer kinetics, and altered surface properties. For sophisticated techniques like the determination of thallium by underpotential deposition (UPD) at gold-film electrodes, maintaining surface integrity is paramount for obtaining reliable, reproducible data.
This application note provides a comprehensive framework for addressing electrode fouling through targeted cleaning protocols and advanced regeneration strategies. The protocols are specifically contextualized within thallium UPD research, where monolayer deposition processes are exceptionally sensitive to surface contaminants. By implementing these standardized procedures, researchers can significantly enhance measurement accuracy, extend electrode lifespan, and improve the overall robustness of their electrochemical determinations.
Electrode Fouling: Mechanisms and Impact on Thallium UPD
Fouling Mechanisms in Complex Samples
Electrode fouling occurs through several distinct mechanisms, each requiring specific mitigation approaches:
- Adsorptive Fouling: Non-specific adsorption of proteins, lipids, or organic macromolecules onto the electrode surface, physically blocking active sites.
- Precipitative Fouling: Formation of insoluble deposits on the electrode surface, often from saturated solutions or reaction byproducts.
- Polymeric Fouling: In-situ formation of polymer films via electropolymerization of solution constituents.
- Biological Fouling: Accumulation of cellular material, biofilm formation, or bacterial colonization in biological matrices.
In the specific context of thallium UPD determination, fouling manifests through distinct performance degradation indicators: suppressed stripping peak currents, shifted deposition potentials, increased background currents, and diminished reproducibility between measurements. The UPD process is particularly sensitive to surface contaminants because it relies on specific metal-substrate interactions at well-defined crystallographic sites.
Analytical Consequences for Thallium Determination
The underpotential deposition of thallium on gold electrodes involves the formation of a monolayer or submonolayer of thallium atoms at potentials positive of the Nernst potential, a process highly dependent on the atomic-level cleanliness and crystallographic orientation of the gold substrate. Research has demonstrated that thallium forms two distinct underpotential deposited monolayers on single crystal copper electrodes, with the process dependent on substrate orientation and consisting of an initial adsorption process followed by a phase transformation [49]. Similar sensitivity to surface conditions would be expected on gold electrodes. Fouling directly interferes with this precise deposition process by:
- Blocking deposition sites, thereby reducing the measurable charge associated with thallium monolayer formation
- Altering the deposition energetics, resulting in shifted UPD potentials
- Creating heterogeneous surface domains, leading to peak broadening in voltammetric measurements
- Introducing non-specific binding sites that compete with the Faradaic process
Electrode Cleaning and Regeneration Methodologies
Standard Cleaning Protocols for Common Fouling Types
Based on the comprehensive cleaning guidelines from Hamilton Company [50], the following table summarizes targeted cleaning approaches for specific fouling types encountered in complex samples:
Table 1: Standardized Electrode Cleaning Protocols for Common Fouling Types
| Fouling Type | Cleaning Reagent | Procedure | Application Notes |
|---|---|---|---|
| Basic Process Residues | 4% HCl (v/v) | Submerge electrode tip for 5-10 minutes | Effective for carbonate and hydroxide deposits |
| Acidic Process Residues | 4% NaOH (w/v) | Soak for 5-10 minutes | Dissolves acid-based coatings |
| Protein Fouling | 0.4% HCl with 5 g/L pepsin | Soak for several hours | Enzymatic action breaks down protein matrices |
| Fats & Oils | Isopropyl alcohol, detergent, or acetone | Gentle wiping with solvent-soaked cloth | Remove residual solvent with water after cleaning |
| ORP Sensor Oxidation | Mild abrasive (e.g., toothpaste) | Light scrubbing of platinum band | Restores electrochemical activity |
Following any chemical cleaning procedure, a standardized post-treatment protocol must be implemented: (1) Thorough rinsing with potable water to remove cleaning residues, (2) Reconditioning in appropriate storage solution for at least 10 minutes, and (3) Performance verification using standard solutions before sample analysis [50].
Advanced Regeneration Techniques
For severely fouled electrodes or when standard cleaning protocols prove insufficient, advanced regeneration methods can restore electrode performance:
High-Temperature Pulse Annealing: This non-destructive method applies rapid, high-temperature pulses to decompose accumulated byproducts while maintaining the original physicochemical properties of the catalyst. The process has demonstrated capability to regenerate catalytic electrodes for up to 10 cycles with full recovery of electrode performance [51].
Electrochemical Impedance Spectroscopy (EIS) Monitoring: Implementation of EIS as a real-time monitoring tool enables precise assessment of fouling status and cleaning efficacy. This technique can distinguish between different fouling mechanisms affecting ohmic resistance, anion-exchange membrane (AEM) resistance, and cation-exchange membrane (CEM) resistance on different time scales [52].
Electrochemical Cleaning Methods: Application of extreme potentials in supporting electrolytes, potential cycling in aggressive potential windows, or pulsed waveforms designed to oxidize/reduce fouling compounds without damaging the electrode substrate.
Special Considerations for Gold-Film Electrodes in Thallium UPD
Gold-film electrodes used for thallium determination require specialized handling due to the sensitivity of UPD processes to surface structure and cleanliness:
Crystallographic Considerations: Research on related systems has shown that UPD processes are highly dependent on substrate crystallography. For instance, lead UPD on silver electrodes produces distinctly different voltammetric responses on (111), (110), and (100) crystal faces [53]. Similarly, gold electrode surface structure will significantly influence thallium UPD behavior.
Nanoparticle-Modified Electrodes: Studies have demonstrated "the contrasting behaviour of polycrystalline bulk gold and gold nanoparticle modified electrodes towards the underpotential deposition of thallium" [9], highlighting the need for tailored cleaning approaches based on electrode architecture.
Mechanical Cleaning Limitations: Avoid aggressive mechanical cleaning that might alter the surface morphology of gold films, as this changes the distribution of crystallographic orientations and active sites crucial for reproducible UPD measurements.
Experimental Protocols for Thallium UPD at Gold-Film Electrodes
Gold-Film Electrode Preparation and Characterization
Materials:
- Glass slides (cleaning compatible)
- Conductive filament (Prototypista PLA or Multi3D Electrifi)
- Chloroauric acid (99.995%)
- Potassium chloride (99%, supporting electrolyte)
- Gorilla Epoxy glue
- Conductive silver paint
- Copper wire (for electrical connection)
Electrode Fabrication Procedure:
- 3D Printing: Design electrode chassis using CAD software (e.g., Fusion 360) and print directly onto cleaned glass slides using conductive PLA filament with nozzle temperature of 210°C and bed temperature of 60°C [54].
- Electrical Connection: Embed copper wire into predesigned cut-out during printing process, securing with conductive silver paint to ensure reliable electrical contact.
- Surface Area Definition: Apply epoxy glue to connector portion of electrode to control and standardize electrochemical surface area.
- Gold Deposition: Perform electrochemical gold deposition using chronoamperometry at -0.4 V for 15 minutes from solution containing 0.1% HAuCl4 in 0.1 M KCl [54].
- Quality Control: Verify electrode performance using standard redox probes (e.g., potassium ferricyanide) and characterize surface morphology using SEM/EDS.
Thallium UPD Measurement Protocol
Reagents:
- Thallium standard solution (appropriate concentration)
- Perchloric acid (0.1 M, supporting electrolyte)
- High-purity water (>18 MΩ·cm)
- Nitrogen gas (oxygen purging)
Procedure:
- Electrode Pretreatment: Clean gold-film electrode following appropriate protocol from Section 3.1 based on previous use and observed fouling.
- Solution Deaeration: Purge electrochemical cell with nitrogen for at least 10 minutes to remove dissolved oxygen.
- UPD Measurement:
- Initial potential: +0.8 V vs. appropriate reference
- Final potential: -0.2 V vs. reference
- Scan rate: 10-50 mV/s (optimize for system)
- Quiet time: 30 seconds at initial potential
- Data Collection: Record cyclic voltammogram focusing on UPD peaks occurring positive of the bulk deposition potential.
- Post-Measurement Cleaning: Immediately clean electrode after measurement using protocol appropriate for sample matrix.
Fouling Assessment and Cleaning Verification Protocol
Electrochemical Impedance Spectroscopy Method:
- Baseline Measurement: Record EIS spectrum in clean supporting electrolyte before sample exposure (frequency range: 10 kHz to 0.1 Hz, amplitude: 10 mV).
- Post-Exposure Measurement: After sample measurement, rinse electrode and record EIS spectrum under identical conditions.
- Data Analysis: Compare spectra, noting increases in charge transfer resistance and changes in double-layer capacitance.
- Cleaning Verification: Repeat EIS after cleaning procedures to confirm return to baseline parameters.
Table 2: Research Reagent Solutions for Electrode Maintenance
| Reagent/Solution | Composition | Primary Function | Application Notes |
|---|---|---|---|
| Acidic Cleaning Solution | 4% HCl (v/v) in water | Dissolves basic deposits | Use for 5-10 minute immersion |
| Alkaline Cleaning Solution | 4% NaOH (w/v) in water | Removes acidic residues | 5-10 minute soaking period |
| Enzymatic Cleaner | 0.4% HCl with 5 g/L pepsin | Protein degradation | Several hours immersion required |
| Organic Solvent Cleaner | Isopropyl alcohol or acetone | Lipid and oil dissolution | Wipe gently, then rinse thoroughly |
| Electrochemical Deposition Solution | 0.1% HAuCl4 in 0.1 M KCl | Gold film regeneration | 15 min at -0.4 V applied potential |
| Storage Solution | 0.1 M KCl or KNO3 | Electrode preservation | Maintain hydration of active surface |
Systematic Workflow for Fouling Management
The following diagram illustrates the integrated workflow for addressing electrode fouling in thallium UPD measurements:
Effective management of electrode fouling is essential for reliable thallium determination using underpotential deposition at gold-film electrodes. The protocols presented in this application note provide a systematic approach to maintaining electrode performance through targeted cleaning procedures and advanced regeneration strategies. By implementing these methodologies and establishing rigorous monitoring using techniques such as electrochemical impedance spectroscopy, researchers can significantly enhance data quality, measurement reproducibility, and operational efficiency in analyzing complex samples.
The integration of appropriate cleaning protocols specific to sample matrices, coupled with regular verification of electrode performance, ensures that the sensitive UPD process remains uncompromised by surface contamination. This comprehensive approach to fouling management supports the generation of high-quality analytical data for thallium determination across diverse application domains including environmental monitoring, biomedical research, and industrial process control.
Within the framework of research on the determination of thallium by underpotential deposition (UPD) at a gold-film electrode, fine-tuning experimental parameters is critical for achieving optimal analytical performance. The sensitivity and detection power of anodic stripping voltammetry (ASV) are profoundly influenced by the chemical and physical conditions of the measurement system. This application note details the optimized protocols and experimental methodologies for controlling key parameters—specifically the supporting electrolyte composition, pH, and deposition time—to enhance the limit of detection (LOD) for thallium(I) in various sample matrices. The procedures are adapted from validated research on a rotating gold-film electrode (AuFE) and a bismuth-plated gold microelectrode array [11] [20].
The Scientist's Toolkit: Essential Research Reagents and Materials
The following table catalogues the essential materials and reagent solutions required for the determination of thallium(I) via underpotential deposition-stripping voltammetry.
Table 1: Key Research Reagent Solutions and Essential Materials
| Item Name | Function / Application | Specific Example / Notes |
|---|---|---|
| Gold Film Electrode (AuFE) | Working electrode for Tl UPD and stripping; provides a noble metal surface with high conductivity and a wide potential window. | Prepared by electrodeposition of gold onto a glassy carbon substrate from 1 mM H[AuCl4] solution [11]. |
| Bismuth-Plated Gold Microelectrode Array | Alternative working electrode; bismuth film enhances sensitivity for Tl(I) detection in ASV [20]. | Gold array is pre-plated with a bismuth film; offers small capacitive currents and steady-state diffusion [20]. |
| Supporting Electrolyte: Nitric Acid/Chloride | Primary medium for investigating Tl UPD; provides conductivity and defines the electrochemical double layer. | Composed of 10 mM HNO₃ and 10 mM NaCl; identifies well-defined Tl UPD peaks [11]. |
| Supporting Electrolyte: Citrate Medium | Used to eliminate interference from Pb(II) and Cd(II) ions, preventing mutual peak overlap [11]. | -- |
| Supporting Electrolyte: Acetate Buffer | Buffered medium for pH control during Tl(I) determination on bismuth-film electrodes [20]. | pH 5.3, prepared from CH₃COOH and NaOH [20]. |
| Thallium(I) Stock Solution | Primary standard for preparing calibration standards and spiked samples. | e.g., Tl(I) nitrate solution, 1 g L⁻¹ [20]. |
| Nitric Acid (HNO₃), Suprapur | For cleaning and for use in supporting electrolytes and sample acidification. | 0.01 M HNO₃ used for diluting working Tl(I) solutions [20]. |
Impact of Key Parameters on the Limit of Detection
The analytical signal in UPD-stripping voltammetry is a complex function of several interconnected experimental variables. The following table summarizes the optimized conditions and their direct impact on the LOD for thallium(I).
Table 2: Optimization of Key Parameters for Thallium(I) Determination
| Parameter | Optimized Condition | Impact on LOD and Analytical Performance |
|---|---|---|
| Supporting Electrolyte | 10 mM HNO₃ + 10 mM NaCl (for pure Tl solutions); Citrate medium (for complex matrices). | Nitric/chloride medium enables identification of UPD peaks. Citrate eliminates Pb(II) and Cd(II) interferences, improving selectivity and ensuring accurate quantification [11]. |
| pH Control | Acidic conditions (e.g., in 10 mM HNO₃). | The UPD process on gold films is conducted in acidic supporting electrolytes. pH is intrinsically controlled by the electrolyte choice and is crucial for a stable Tl signal and preventing hydrolysis [11]. |
| Deposition Time | 210 s (for LOD of 0.6 μg L⁻¹ on AuFE); 180 s (for LOD of 8×10⁻¹¹ mol L⁻¹ on Bi/Au array). | Longer deposition times lead to lower LODs by increasing the amount of Tl ad-atoms deposited. The relationship is a trade-off between sensitivity and analysis time [11] [20]. |
| Deposition Potential | Optimized via factorial design to be within the UPD region. | Critical for selective monolayer deposition of Tl on the gold surface, avoiding bulk deposition and ensuring a sharp, sensitive stripping peak [11]. |
| Electrode Substrate | Rotating Gold Film Electrode (AuFE) or Bismuth-plated Gold Microelectrode Array. | The AuFE has a developed surface area for efficient accumulation. The Bi/Au array offers high sensitivity and low capacitive currents [11] [20]. |
Experimental Protocol: Optimization of Supporting Electrolyte and pH
Principle: The supporting electrolyte dictates the electrochemical environment, influencing the double-layer structure, the thermodynamics and kinetics of the UPD process, and the resolution of the stripping peak. pH can affect the speciation of both the analyte and the electrode surface.
Materials:
- Supporting electrolyte A: 10 mM HNO₃ + 10 mM NaCl
- Supporting electrolyte B: 0.1 M Citrate buffer, pH ~3-6 (adjusted with NaOH)
- Stock solution of Tl(I) (e.g., 1000 mg L⁻¹)
- Standard solutions of potential interferents (e.g., Pb(II), Cd(II))
- Purified water (e.g., Milli-Q)
- Electrochemical cell, potentiostat, Rotating Gold Film Electrode (AuFE), reference electrode (Ag/AgCl), and counter electrode (Pt wire).
Procedure:
- Electrode Preparation: Prepare a fresh gold film electrode by electrodepositing gold onto a polished glassy carbon substrate from a 1 mM H[AuCl₄] solution at -0.30 V (vs. Ag/AgCl) for 300 s [11].
- Baseline Measurement: Place the electrode in the electrochemical cell containing 10 mL of supporting electrolyte A. Perform a cyclic voltammetry (CV) scan from -0.8 V to +0.4 V (or an appropriate range) at 50 mV s⁻¹ to establish a background voltammogram.
- Tl(I) Measurement in Nitric/Chloride Medium:
- Spike the cell with an aliquot of Tl(I) stock to achieve a final concentration of 50 μg L⁻¹.
- Purge the solution with an inert gas (e.g., N₂) for 300 s to remove oxygen.
- Optimize the deposition potential and time (e.g., -0.6 V for 210 s) while rotating the electrode.
- Record a square-wave anodic stripping voltammetry (SW-ASV) curve by scanning anodically. Note the potential and current of the Tl stripping peak.
- Interference Study:
- To the same solution, add standard solutions of Pb(II) and Cd(II) to achieve concentrations similar to Tl(I).
- Repeat the deposition and stripping measurement (step 3). Observe the overlap of the stripping peaks.
- Measurement in Citrate Medium:
- Replace the electrolyte with supporting electrolyte B (citrate medium).
- Repeat steps 3 and 4 with Tl(I) alone and with the mixture of Tl(I), Pb(II), and Cd(II).
- Observe the separation of the Tl(I) peak from the interferents.
Data Analysis: Compare the peak shape, current, and potential of Tl(I) in the two electrolytes. The citrate medium should resolve the Tl peak from Pb and Cd, confirming its utility for analyzing complex samples [11].
Experimental Protocol: Optimization of Deposition Time
Principle: The deposition (accumulation) time directly controls the amount of Tl(I) reduced and deposited as ad-atoms on the electrode surface during the UPD step, thereby governing the sensitivity of the method.
Materials:
- Optimized supporting electrolyte (e.g., 10 mM HNO₃ + 10 mM NaCl for pure Tl solutions).
- Stock solution of Tl(I) (e.g., 1000 mg L⁻¹).
- Electrochemical cell, potentiostat, and Rotating Gold Film Electrode (AuFE).
Procedure:
- Preparation: Place the prepared AuFE in the cell with 10 mL of optimized supporting electrolyte. Add Tl(I) standard to a final concentration of 10 μg L⁻¹. Purge with N₂.
- Variable Deposition Time Experiment:
- Set a fixed, optimized deposition potential.
- Perform a series of SW-ASV measurements, systematically increasing the deposition time (e.g., 60, 120, 180, 210, 300 s). Keep all other SW parameters (amplitude, frequency) constant.
- For each experiment, record the anodic stripping peak current for Tl(I).
- Calibration at Fixed Time:
- Choose a deposition time (e.g., 210 s) that offers a good compromise between signal and analysis duration.
- Record SW-ASV curves for a series of standard Tl(I) solutions (e.g., 5, 10, 25, 50, 100 μg L⁻¹).
- Plot the peak current versus Tl(I) concentration to generate a calibration curve.
Data Analysis: The plot of peak current vs. deposition time will show an increasing trend, demonstrating the relationship between accumulation and signal. The calibration curve will be used to calculate the limit of detection (LOD), typically defined as 3 times the standard deviation of the blank signal divided by the slope of the calibration curve. Using a 210 s deposition time on a AuFE, an LOD of 0.6 μg L⁻¹ can be achieved, while a 180 s deposition on a Bi/Au microelectrode array can push the LOD to 0.016 μg L⁻¹ (8×10⁻¹¹ mol L⁻¹) [11] [20].
Visualized Workflow: Thallium Determination by UPD-Stripping Voltammetry
The following diagram illustrates the complete experimental workflow for the determination of thallium, from electrode preparation to quantitative analysis, highlighting the key parameters optimized in this note.
Diagram 1: Experimental Workflow for Tl Determination.
This set of application notes provides a detailed protocol for fine-tuning the key parameters in the electrochemical determination of thallium(I) using underpotential deposition on gold-based electrodes. The supporting electrolyte composition is paramount for achieving selectivity, particularly in the presence of common interferents like lead and cadmium. Furthermore, the deposition time is a powerful and direct tool for controlling the method's sensitivity and the ultimate limit of detection. By systematically optimizing these parameters as described, researchers can reliably achieve low LODs required for monitoring thallium in compliance with stringent environmental and health safety standards (e.g., the U.S. EPA limit of 2 μg L⁻¹ in drinking water) [11]. The robustness of these methods is demonstrated by their successful application in analyzing complex real-world samples such as drinking water, river water, and black tea [11] [20].
The accurate determination of trace elements, such as thallium, in complex matrices is a significant challenge in analytical chemistry. Matrix effects, particularly from high-salinity content and organic matter, can severely compromise data quality by suppressing or enhancing the analyte signal [55] [56]. For the specific context of thallium determination via underpotential deposition (UPD) at a gold-film electrode, these effects can interfere with the deposition and stripping steps, leading to inaccurate quantification. This application note details validated protocols for identifying, evaluating, and mitigating matrix effects to ensure the reliability of analytical results in electrochemical analysis.
Theoretical Background: Origins and Consequences of Matrix Effects
Matrix effects occur when co-existing components in a sample alter the analytical response of the target analyte. In mass spectrometry, this is often termed "ion suppression" [55] [56], while in voltammetric techniques like anodic stripping voltammetry (ASV), similar interference can occur during the electrodeposition or stripping process.
- Mechanisms in Electrospray Ionization (ESI): In LC-MS, ion suppression originates from competition for charge and space in the ESI droplet. Compounds with high surface activity or basicity can out-compete analytes for the limited available charge, while non-volatile materials can increase viscosity or precipitate, preventing efficient droplet formation and ion release [55].
- Relevance to Electrochemical Sensing: Although the mechanisms differ, the practical consequence is analogous. High concentrations of organic matter can foul the electrode surface, while inorganic salts can alter the conductivity of the solution or compete for reduction potential, directly interfering with the underpotential deposition process crucial for selective thallium determination [20] [35].
- Primary Consequences: The main detrimental effects include reduced detection capability (higher LODs), poor precision and accuracy, and in severe cases, complete analyte masking leading to false negatives [55] [56].
Evaluation and Detection of Matrix Effects
Before correction, matrix effects must be reliably identified and quantified. The following established protocols are adapted for the context of thallium analysis.
Post-Extraction Spike Experiment
This method compares the analyte response in a clean versus a matrix-containing solution [55] [56].
- Procedure:
- Prepare a neat standard solution of thallium in the supporting electrolyte (e.g., 0.05 M EDTA at pH 4.5) and analyze it using the UPD-ASV method [35].
- Take an aliquot of the blank matrix extract (e.g., digested soil or ash sample) and spike it with the same concentration of thallium standard.
- Analyze the spiked matrix extract using the identical UPD-ASV parameters.
- Evaluation: Calculate the matrix effect (ME) as follows: ME (%) = (Peak Current in Spiked Matrix / Peak Current in Neat Standard) × 100% A value of <100% indicates signal suppression, while >100% indicates enhancement. Signal suppression exceeding 10-15% typically requires corrective action [56].
The Infusion Experiment for Chromatographic Methods
For LC-MS applications, a post-column infusion is the gold standard for pinpointing the chromatographic region of ion suppression [55]. While not directly applicable to a single-step voltammetric measurement, it is critical for coupled techniques.
- Procedure:
- A standard solution of the analyte is continuously infused post-column into the MS mobile flow.
- A blank matrix extract is injected into the LC system and eluted with the standard method.
- The mass spectrometer monitors the analyte signal throughout the run.
- Evaluation: A drop in the otherwise stable baseline signal indicates the retention time window where co-eluting matrix components cause ion suppression, providing a guide for optimizing chromatographic separation [55].
Strategies for the Mitigation of Matrix Effects
A multi-faceted approach is most effective for managing complex matrices. The following strategies can be used in isolation or combination.
Sample Clean-up Techniques
Effective sample clean-up is the most direct way to remove interfering matrix components.
- Solid-Phase Extraction (SPE): Utilizes cartridges with various sorbents to selectively retain either the analyte or the interferents.
- Dispersive Solid-Phase Extraction (dSPE): Commonly used in QuEChERS methods, this involves adding sorbent directly to the sample extract for efficient clean-up [57] [58].
- Sorbent Efficiency: The choice of sorbent is matrix-dependent. A study on fatty fish samples found that EMR-lipid sorbent was most efficient for removing lipids for POPs and PAHs analysis, providing recoveries between 59 and 120% [57]. For inorganic interferents, C18 or ion-exchange sorbents may be more appropriate.
Table 1: Common Clean-up Sorbents and Their Applications
| Sorbent | Primary Function | Typical Application Matrix |
|---|---|---|
| EMR-Lipid | Selective removal of lipids | Fatty foods, biological tissues [57] |
| C18 | Retention of non-polar compounds | Aqueous environmental samples [57] |
| Z-Sep | Removal of polar lipids and pigments | Complex food matrices [57] |
| PSA | Removal of fatty acids, sugars, and polar pigments | Food extracts (e.g., QuEChERS) [57] |
| Silica / Florisil | Retention of polar interferences | Environmental samples, POPs analysis [57] [58] |
Electrode Modification and Sensor Design
The strategic modification of the working electrode can enhance selectivity and mitigate fouling.
- Bismuth-Film Plated Electrodes: Bismuth-film electrodes are a popular eco-friendly alternative to mercury. A bismuth-plated gold microelectrode array achieved a LOD of (8 \times 10^{-11}) mol L⁻¹ for Tl(I) and demonstrated reduced interference from common ions [20].
- Nanomaterial-Based Modifiers: Materials like reduced graphene oxide (RGO) provide a high surface area and excellent electrocatalytic properties. A glassy carbon electrode modified with RGO was successfully applied for thallium determination in grain products with a LOD of (6.01 \times 10^{-9}) M [35].
- Composite Films: A gold electrode modified with a titanium(IV)-oxo-carboxylate cluster and chitosan composite showed enhanced performance for thallium detection in complex coal ash samples, mitigating matrix interference and achieving an LOD of 1.9 ppm [13].
Optimization of Chromatographic and Instrumental Parameters
- Chromatographic Separation: Improving the separation between the analyte and matrix components is a fundamental solution. This can be achieved by optimizing the mobile phase gradient, flow rate, and column temperature to shift the analyte's retention time away from the suppressing region identified in the infusion experiment [55] [56].
- Switching Ionization Modes: In mass spectrometry, changing from electrospray ionization (ESI), which is highly susceptible to suppression, to atmospheric-pressure chemical ionization (APCI) can often reduce matrix effects, as APCI involves gas-phase ionization and is less affected by condensed-phase processes [55].
Table 2: Comparison of Mitigation Strategies for Different Matrix Types
| Matrix Type | Recommended Clean-up | Recommended Analytical Strategy | Reported Efficacy |
|---|---|---|---|
| High Organic Matter (e.g., soil, tissue) | dSPE with EMR-Lipid or Z-Sep [57] | Electrode modification with Bi-film or RGO [20] [35] | Recoveries of 59-120% for POPs in fish [57]; LOD of 1.9 ppm Tl in ash [13] |
| High Salt Content (e.g., seawater, brine) | SPE with C18 or ion exchange | Use of a modified Au electrode with composite film [13] | LOD of (8 \times 10^{-11}) mol L⁻¹ for Tl(I) with Bi/Au electrode [20] |
| Complex Biological Fluids | Protein Precipitation + Selective SPE | Improved chromatographic separation; APCI source [55] [56] | Significant reduction in ion suppression observed in LC-MS [55] |
Experimental Protocols
Protocol: dSPE Clean-up for Fatty Matrices Prior to Thallium Analysis
This protocol is adapted for samples rich in organic matter, such as fish or plant tissues [57].
- Extraction: Homogenize 2 g of sample with 10 mL of ethyl acetate or acetonitrile in a 50 mL centrifuge tube. Shake vigorously for 1 minute.
- Partitioning: Add a salt mixture (e.g., 1 g NaCl, 4 g MgSO₄) to induce phase separation. Vortex for 1 minute and centrifuge at 4000 rpm for 5 minutes.
- Clean-up: Transfer 1 mL of the upper organic layer to a 2 mL dSPE tube containing 150 mg of EMR-Lipid sorbent.
- Dispersive Clean-up: Vortex the dSPE tube for 1 minute to ensure full contact between the extract and the sorbent.
- Clarification: Centrifuge the tube at 10,000 rpm for 3 minutes. Filter the supernatant through a 0.22 µm PTFE syringe filter into a clean vial.
- Analysis: The cleaned extract is now ready for digestion (if necessary) and subsequent electrochemical analysis.
Protocol: Preparation of a Bismuth-Film Gold Electrode for Thallium Determination
This protocol details the modification of a gold electrode to enhance its performance for thallium detection in complex matrices [20].
- Electrode Pretreatment: Polish the gold electrode surface with an alumina slurry (0.3 µm) on a microcloth pad. Rinse thoroughly with deionized water.
- Electrochemical Cleaning: Cycle the electrode in 0.5 M H₂SO₄ between -0.2 V and +1.5 V (vs. Ag/AgCl) until a stable cyclic voltammogram is obtained.
- Bismuth Film Deposition: Immerse the clean electrode in a deaerated solution of 0.1 M acetate buffer (pH 4.5) containing 400 mg L⁻¹ Bi(III). Deposit the bismuth film by applying a potential of -1.0 V for 60-180 seconds under stirring.
- Analysis: The Bi-film modified Au electrode is ready for use in the UPD-ASV determination of thallium.
The Scientist's Toolkit: Essential Research Reagents
Table 3: Key Reagents and Materials for Mitigating Matrix Effects
| Reagent/Material | Function | Application Example |
|---|---|---|
| EMR-Lipid dSPE Sorbent | Selectively removes lipids from sample extracts. | Clean-up of fish or plant tissue extracts prior to Tl analysis [57]. |
| Bismuth Nitrate (Bi(NO₃)₃) | Source of Bi(III) ions for in-situ or ex-situ plating of bismuth-film electrodes. | Preparation of a non-toxic, sensitive working electrode for ASV [20]. |
| Reduced Graphene Oxide (RGO) | Nanomaterial electrode modifier; increases surface area and enhances electron transfer. | Modification of a glassy carbon electrode for sensitive Tl detection [35]. |
| Chitosan | Biopolymer used to form stable composite films for immobilizing catalytic materials on electrodes. | Forming a composite with a Ti-oxocluster for a modified Au electrode [13]. |
| Ethyl Acetate | Extraction solvent for organic compounds; considered environmentally friendly. | QuEChERS-based extraction of persistent organic pollutants from fatty matrices [57]. |
Workflow and Signaling Diagrams
Diagram 1: Matrix effect management workflow for thallium determination.
Method Validation, Performance Benchmarking, and Comparative Analysis with Other Techniques
Within the context of advanced research on the determination of thallium by underpotential deposition (UPD) at gold-film electrodes, the validation of analytical methods against Certified Reference Materials (CRMs) is a critical prerequisite for generating reliable data. This protocol provides a detailed framework for establishing the accuracy and precision of analytical methods, specifically tailored for the quantification of trace thallium. The extreme toxicity of thallium, with an average lethal oral dose estimated at 10–15 mg kg⁻¹, necessitates analytical procedures of the highest metrological quality, particularly for applications in drug development, environmental monitoring, and food safety [59]. UPD at gold electrodes offers a highly sensitive pathway for thallium determination, but its accuracy must be unequivocally demonstrated through rigorous validation against matrix-appropriate CRMs [20] [60].
This document outlines standardized procedures for method validation, encompassing experimental protocols for accuracy and precision studies, data interpretation guidelines, and a comprehensive list of essential research reagents. The workflows are designed to be applicable across various analytical techniques, including electroanalytical methods like anodic stripping voltammetry (ASV) and spectrometric techniques such as inductively coupled plasma mass spectrometry (ICP-MS).
Experimental Design and Principles
The core principle of this validation protocol is to demonstrate that the analytical method produces results that are both correct (accurate) and repeatable (precise). Accuracy is assessed by analyzing a CRM and comparing the measured value to its certified value, while precision is evaluated from the variability of repeated measurements.
For thallium determination via UPD at a gold-film electrode, the process leverages the selective deposition of thallium onto the gold surface at a potential more positive than its thermodynamic reduction potential. This UPD phenomenon provides excellent sensitivity and selectivity for trace analysis [20]. The subsequent anodic stripping step quantifies the deposited thallium, and the accuracy of this entire electrochemical process must be validated.
Diagram 1: Overall Workflow for Method Validation Using CRMs
Materials and Reagents
Research Reagent Solutions
The following table details the essential materials and reagents required for the validation of methods for thallium determination.
Table 1: Essential Research Reagents for Thallium Analysis and Validation
| Item | Function/Description | Example Specification |
|---|---|---|
| Thallium CRM Standard | Primary calibration standard, traceable to SI units. | 1000 mg/L Tl in 0.5 M HNO₃, certified reference material (e.g., Certipur) [61]. |
| Matrix-Matched CRM | Validates method accuracy within a specific sample matrix (e.g., soil, food, water). | White cabbage (BCR-679), GBW 07401 soil [59] [35]. |
| High-Purity Acids | Sample digestion and decomposition (e.g., nitric acid, perchloric acid). | 65% HNO₃, Suprapur grade or equivalent, to minimize trace metal contamination [19] [35]. |
| Supporting Electrolyte | Provides conductive medium for electrochemical analysis. | Acetate buffer (pH 4.5 - 5.3), 0.05 M EDTA for complexation and interference suppression [20] [35]. |
| Gold-Film Electrode | Working electrode for UPD and ASV of thallium. | May be a solid gold microelectrode array or a gold film deposited on a substrate [20]. |
| Deionized Water | Preparation of all solutions to prevent contamination. | Resistance ≥18 MΩ·cm (e.g., from Milli-Q system) [20]. |
Protocol for Establishing Accuracy and Precision
Sample Preparation and Digestion
For solid samples (e.g., soils, grains, biological tissues), a rigorous digestion procedure is required to liberate thallium into solution. The following protocol, adapted from established methods, is recommended [19] [35]:
- Weighing: Accurately weigh 0.5 g of the homogenized CRM or sample into a clean Teflon beaker.
- Acid Addition: Add 5–10 mL of 65% nitric acid (HNO₃). For samples with high silica content, 1–2 mL of hydrofluoric acid (HF) may be added with extreme caution.
- Digestion: Cover the beaker with a watch glass and heat on a hot plate at ~95°C for 3 hours. Avoid boiling.
- Oxidation: After cooling, add 2.5 mL of 30% hydrogen peroxide (H₂O₂) and return to the hot plate for another 30 minutes to complete the oxidation of organic matter.
- Evaporation: Evaporate the solution nearly to dryness.
- Re-dissolution: Add 1 mL of nitric acid and a small volume of deionized water to the residue. Heat gently to re-dissolve the salts.
- Filtration and Adjustment: Filter the solution if necessary. For electrochemical analysis, add ascorbic acid and EDTA, then adjust the pH to 4.5 using an ammonium or sodium hydroxide solution [35].
- Dilution: Transfer the solution quantitatively to a 25 mL volumetric flask and make up to the mark with deionized water.
Instrumental Analysis and Measurement
The analytical procedure will vary depending on the technique used. The following protocol is an example for anodic stripping voltammetry at a gold-based electrode, highly relevant for UPD studies [20].
- Electrode Preparation: Polish the gold-film working electrode with alumina slurry (0.3 µm) on a polishing cloth, then rinse thoroughly with deionized water and dry [20] [35].
- Pre-concentration/Deposition: Transfer an aliquot of the digested and pH-adjusted sample solution to the electrochemical cell. Apply a constant deposition potential of -1.2 V (vs. Ag/AgCl) to the working electrode for a fixed time (e.g., 600 s) while stirring the solution. This step reduces Tl(I) to Tl(0) and deposits it onto the gold electrode.
- Stripping/Measurement: After a brief equilibration period (e.g., 10 s), initiate the anodic scan using a differential pulse waveform. Record the stripping voltammogram. The anodic peak current at approximately -0.8 V to -0.6 V (vs. Ag/AgCl) is proportional to the concentration of thallium in the solution [20].
- Replication: Perform a minimum of six independent replicate analyses of the CRM following the entire sample preparation and analysis procedure.
Diagram 2: Thallium Underpotential Deposition & Stripping Mechanism
Data Analysis and Acceptance Criteria
Calculate the following parameters from the replicate measurements of the CRM to establish method performance.
Table 2: Key Parameters for Assessing Accuracy and Precision
| Parameter | Calculation Formula | Acceptance Criteria |
|---|---|---|
| Accuracy (Recovery %) | (Measured Mean Concentration / Certified Value) × 100% | 80–120% for trace levels [59]. |
| Precision (Repeatability) | Relative Standard Deviation (RSD) = (Standard Deviation / Mean) × 100% | Typically <10% for intermediate precision [59]. |
| Method Limit of Detection (MLOD) | 3.3 × (Standard Deviation of the intercept / Slope of the calibration curve) | Should be sufficiently low for the intended application (e.g., µg kg⁻¹ level) [59]. |
| Method Limit of Quantification (MLOQ) | 10 × (Standard Deviation of the intercept / Slope of the calibration curve) | - |
Representative Validation Data
The following table summarizes exemplary validation data for thallium determination in different matrices, as reported in the literature.
Table 3: Exemplary Validation Data for Thallium Determination in Various Matrices
| Matrix | Analytical Technique | Certified Value (µg kg⁻¹) | Measured Value (Mean ± SD, µg kg⁻¹) | Recovery % | Precision (RSD%) | Reference |
|---|---|---|---|---|---|---|
| White Cabbage (BCR-679) | ICP-MS | ~3.00 | 3.03 ± 0.36 | 101% | 2.94% | [59] |
| Soil (GBW 07401) | DP-ASV / GC-RGO | 1000 ± 200 µg/kg | 900 ± 140 µg/kg | 90%* | ~15.6% | [35] |
| Rice | ICP-MS | Spiked at 0.5 µg kg⁻¹ | 0.51 ± 0.03 µg kg⁻¹ | 102% | - | [59] |
| Aqueous Solution | ASV / Bi-AuMEA | - | LOD: 8×10⁻¹¹ mol/L | 98.7–101.8% (Spike Recovery) | - | [20] |
*Value represents the average from nine independent trials against the certified range.
Troubleshooting and Best Practices
- Low Recovery: Investigate incomplete sample digestion, loss of volatile thallium species during digestion, or matrix interference. Ensure digestion temperatures are controlled and that a full decomposition cycle with oxidizing acids is achieved [19]. For electrochemical methods, verify the electrode surface cleanliness and the absence of competitive ions.
- Poor Precision (High RSD): This often indicates inconsistencies in sample preparation, instrument instability, or inhomogeneity of the sample. Ensure all weighing, dilution, and digestion steps are performed consistently. Check the stability of the electrode response in the electrochemical system.
- Matrix Interference: For samples with high salt content (e.g., sea salt), a significant reduction in recovery can occur due to signal suppression. In such cases, further dilution of the final digestate is recommended to reduce the total dissolved solid content to below 0.2% [59].
- CRM Traceability: Always use CRMs that are produced in accordance with ISO 17034 and are traceable to primary materials from a National Metrology Institute (NMI), such as NIST [61]. This guarantees the metrological integrity of the validation process.
The pursuit of ultra-low detection limits for toxic heavy metals like thallium represents a critical challenge in environmental monitoring, food safety, and clinical toxicology. While spectroscopic techniques such as Inductively Coupled Plasma Mass Spectrometry (ICP-MS) and Graphite Furnace Atomic Absorption Spectrometry (GF-AAS) have traditionally set performance benchmarks, advanced electrochemical techniques utilizing specialized deposition phenomena are emerging as competitive alternatives. This application note situates itself within a broader thesis on the determination of thallium by underpotential deposition (UPD) at gold-film electrodes, providing a detailed performance comparison and standardized protocols for researchers seeking to implement these sensitive methodologies. The exceptional toxicity of thallium—surpassing that of mercury, arsenic, cadmium, and lead—demands analytical methods capable of detecting concentrations at or below the regulatory limit of 2 μg·L⁻¹ for drinking water [11]. We demonstrate that properly optimized UPD-based stripping voltammetry not only meets this requirement but offers a complementary approach to capital-intensive spectroscopic instrumentation.
Analytical Performance Benchmarking
Comparative Method Performance
The following table summarizes the key analytical performance parameters for thallium determination across the primary techniques discussed in this application note.
Table 1: Performance Comparison of Analytical Methods for Thallium Determination
| Method | Detection Limit (μg·L⁻¹) | Linear Range | Key Advantages | Key Limitations |
|---|---|---|---|---|
| UPD-SWV at AuFE [11] | 0.6 (at 210 s accumulation) | 5–250 μg·L⁻¹ | High sensitivity, selective deposition, mercury-free, portable instrumentation | Requires careful parameter optimization, potential interferences |
| ICP-MS [59] | 0.007–0.05 μg·kg⁻¹ (in foods) | Wide dynamic range | Exceptional sensitivity, multi-element capability, high throughput | High instrument cost, complex operation, spectral interferences |
| GF-AAS [62] | ~1 μg·L⁻¹ (estimated) | Limited linear range | Well-established technique, lower capital cost than ICP-MS | Single-element analysis, lower throughput, requires skilled operation |
| DPASV at GC/RGO [35] | 1.229 μg·L⁻¹ | 9.78 × 10⁻⁹ to 97.8 × 10⁻⁹ M | Mercury-free, graphene-enhanced sensitivity, cost-effective | Longer deposition time (600 s), requires electrode modification |
Operational Characteristics
Table 2: Operational Characteristics of Key Analytical Techniques
| Parameter | UPD-SWV at AuFE | ICP-MS | GF-AAS |
|---|---|---|---|
| Analysis Time | Medium (accumulation dependent) | Fast | Slow (sequential analysis) |
| Sample Throughput | Moderate | High | Low |
| Capital Cost | Low to Moderate | High | Moderate |
| Operational Complexity | Moderate | High | Moderate |
| Portability | Possible with miniaturized systems | Laboratory-bound | Laboratory-bound |
| Multi-element Capability | Limited | Excellent | Limited |
The data reveals that UPD-stripping voltammetry achieves detection limits comparable to GF-AAS and approaching ICP-MS performance for many practical applications, while offering the advantages of lower cost and potential portability. The 0.6 μg·L⁻¹ LOD demonstrated by the UPD approach [11] is sufficient for monitoring compliance with the 2 μg·L⁻¹ drinking water standard and represents a significant advancement in electrochemical detection capability.
Experimental Protocols
Underpotential Deposition-Stripping Voltammetry for Thallium
Gold-Film Electrode Preparation
- Substrate Preparation: Polish glassy carbon electrode (GCE) sequentially with 1.0, 0.3, and 0.05 μm alumina slurry on a microcloth pad. Rinse thoroughly with deionized water between polishing steps and sonicate in deionized water for 2 minutes to remove adsorbed particles.
- Gold Electrodeposition: Immerse the prepared GCE in a deaerated solution of 1 mM H[AuCl₄] containing 0.1 M K₂SO₄ as supporting electrolyte. Apply a constant potential of -300 mV (vs. Ag/AgCl, 3.5 M KCl) for 300 seconds with continuous stirring at 500 rpm. The resulting gold film exhibits sub-nanoscale morphology and high surface area [11].
- Electrode Characterization: Validate film quality using cyclic voltammetry in 0.5 M H₂SO₄ between -0.2 and +1.5 V (vs. Ag/AgCl) at 100 mV/s. Characteristic gold oxidation and reduction peaks should be clearly visible.
Thallium UPD-Stripping Analysis
- Supporting Electrolyte: Prepare a solution of 10 mM HNO₃ and 10 mM NaCl as the base electrolyte. For complex matrices containing interfering ions like Pb(II) and Cd(II), use citrate medium to eliminate mutual peak overlap [11].
- Accumulation Step: Apply a deposition potential of -300 mV (vs. Ag/AgCl) for 60-300 seconds while rotating the gold-film electrode at 2000 rpm. The optimal accumulation time is 210 seconds for achieving the lowest detection limit [11].
- Stripping Step: Employ square-wave anodic stripping voltammetry with the following optimized parameters: amplitude 25 mV, frequency 50 Hz, step potential 2 mV. Scan the potential from -0.8 V to -0.1 V (vs. Ag/AgCl) to record the thallium stripping peak at approximately -0.5 V [11].
- Calibration: Construct a calibration curve using standard thallium(I) solutions in the range of 5-250 μg·L⁻¹. The coefficient of determination (R²) should exceed 0.995 [11].
ICP-MS Protocol for Thallium Determination
Sample Preparation
- Digestion Procedure: Accurately weigh 0.2-0.5 g of sample into a Teflon microwave vessel. Add 5 mL concentrated HNO₃ (65%) and 2 mL H₂O₂ (30%). For samples with high silica content, add 1 mL HF (40%). Seal vessels and heat using a stepped temperature program in a microwave digestion system [59] [62].
- Post-Digestion Treatment: After cooling, transfer the digestate to a Teflon beaker. For samples treated with HF, add 5 mL of 4% H₃BO₃ to neutralize excess HF and heat again in the microwave oven. Dilute the final solution to 50 mL with deionized water, maintaining total dissolved solids below 0.2% to minimize matrix effects [59].
- Dilution Strategy: For samples with high salt content (e.g., sea salt), reduce sample mass to 0.1 g and perform additional dilution of the decomposition solution to minimize signal suppression [59].
ICP-MS Instrumentation and Operation
- Instrument Setup: Operate the ICP-MS with the following typical conditions: RF power 1550 W, plasma gas flow 15 L/min, auxiliary gas flow 0.9 L/min, nebulizer gas flow 1.05 L/min, sampling depth 8 mm [59].
- Isotope Selection: Monitor ²⁰⁵Tl for quantification. Use ¹⁵⁹Tb, ¹⁶⁹Tm, ¹⁷⁵Lu, or ¹⁹³Ir as internal standards to correct for matrix effects and instrument drift [59].
- Quality Control: Include method blanks, certified reference materials (e.g., BCR-679 white cabbage), and spiked samples in each analytical batch. Acceptable recovery ranges should be 85-115% for most matrices [59].
GF-AAS Protocol for Thallium Determination
While GF-AAS was not the primary focus of the search results, it remains a relevant comparative technique. Based on general knowledge and the context provided [62], the method typically involves sample digestion similar to ICP-MS, followed by atomization in a graphite furnace with platform technology and Zeeman background correction. Matrix modifiers such as palladium nitrate or ammonium phosphate are commonly employed to stabilize thallium during the asking stage.
Workflow Visualization
Research Reagent Solutions
Table 3: Essential Reagents and Materials for Thallium UPD Analysis
| Reagent/Material | Specification | Function | Application Notes |
|---|---|---|---|
| Gold Chloride Solution | 1 mM H[AuCl₄] in supporting electrolyte | Gold film formation | Electrode substrate preparation |
| Supporting Electrolyte | 10 mM HNO₃ + 10 mM NaCl | Conductivity medium | Base electrolyte for Tl UPD |
| Citrate Buffer | 0.1 M, pH 4.5-5.0 | Interference suppression | Eliminates Pb(II) and Cd(II) interferences |
| Thallium(I) Standard | 1000 mg/L certified reference material | Calibration | Prepare fresh working standards daily |
| Glassy Carbon Electrodes | 3 mm diameter, polished surface | Electrode substrate | Requires meticulous surface preparation |
| Rotating Electrode System | 0-3000 rpm capability | Hydrodynamic control | Enhances mass transport during accumulation |
Applications and Case Studies
The utility of these sensitive analytical methods is highlighted by real-world applications. The UPD-stripping method has been successfully applied to the analysis of drinking water, river water, and black tea samples with satisfactory recovery values [11]. In food safety monitoring, ICP-MS analysis of 304 various foods in the South Korean market revealed thallium concentrations below 10 μg·kg⁻¹ in 98% of samples, with higher levels detected in fisheries and animal products compared to cereals and vegetables [59]. A particularly concerning case involved a family exposure to thallium through contaminated kale chips, where ICP-MS analysis measured thallium concentrations of 1.98 mg/kg and 2.15 mg/kg in the product, resulting in urine thallium levels up to 10.5 μg/g creatinine in children [63]. This incident underscores the importance of sensitive monitoring methods for thallium in the food supply.
This application note demonstrates that underpotential deposition-stripping voltammetry at gold-film electrodes represents a viable alternative to spectroscopic methods for thallium determination at trace levels. While ICP-MS maintains superiority in absolute detection limits and multi-element capability, the UPD approach offers an attractive combination of sensitivity, selectivity, and cost-effectiveness that makes it particularly suitable for routine monitoring applications and field-deployable instrumentation. The detailed protocols provided herein enable researchers to implement these methodologies with confidence, contributing to enhanced monitoring of this highly toxic element across environmental, food, and clinical matrices. As regulatory scrutiny of thallium intensifies globally, these analytical tools will play an increasingly vital role in protecting public health.
The accurate determination of trace levels of thallium, an extremely toxic heavy metal, is a critical challenge in environmental and analytical chemistry. Electrochemical methods, particularly anodic stripping voltammetry (ASV), offer a powerful solution due to their high sensitivity, portability, and cost-effectiveness. The performance of these electroanalytical methods is profoundly influenced by the working electrode material. This application note provides a comparative analysis of three prominent electrode materials—gold, mercury, and bismuth—for the determination of thallium(I), with a specific focus on sensors based on gold-film electrodes within the broader research context of underpotential deposition (UPD). UPD, the electrochemical deposition of a metal monolayer at potentials positive of its thermodynamic reduction potential, is a significant phenomenon for modifying and characterizing electrode surfaces [64] [28]. The selection of an appropriate electrode material is paramount for developing sensitive, reliable, and environmentally friendly analytical methods for trace thallium detection [4] [65].
Performance Comparison of Electrode Materials
The table below summarizes the key analytical performance metrics of thallium(I) determination using sensors based on gold, mercury, and bismuth.
Table 1: Analytical performance of different electrode materials for Tl(I) determination by ASV.
| Electrode Material & Configuration | Limit of Detection (mol L⁻¹) | Linear Range (mol L⁻¹) | Deposition Time | Key Advantages | Key Limitations |
|---|---|---|---|---|---|
| Bismuth-plated Gold Microelectrode Array [8] | ( 8 \times 10^{-11} ) | ( 2 \times 10^{-10} ) to ( 2 \times 10^{-7} ) | 180 s | Excellent sensitivity, eco-friendly, reusable, high stability | Requires a plating step |
| Integrated Screen-Printed Sensor with Bi Film [65] | ( 6.71 \times 10^{-12} ) | Not Specified | 300 s | Ultra-trace detection, portable, disposable, suitable for field analysis | Disposable nature may increase long-term costs |
| Mercury Film on Glassy Carbon [66] | ( 2.2 \times 10^{-8} ) | Not Specified | 240 s | Well-established history, wide potential window | High toxicity, environmental and safety concerns |
| Glassy Carbon / Reduced Graphene Oxide [35] | ( 6.01 \times 10^{-9} ) | ( 9.78 \times 10^{-9} ) to ( 9.78 \times 10^{-8} ) | 600 s | Nanomaterial-enhanced sensitivity, avoids use of metals | Long deposition time required |
The data reveals that bismuth-based sensors, particularly when combined with advanced substrates like gold microelectrode arrays, offer an optimal balance of ultra-high sensitivity and environmental acceptability. Mercury films, while historically prevalent, are hampered by significant toxicity [66]. The modification of electrodes with nanomaterials like reduced graphene oxide can enhance performance, but often requires longer analysis times [35].
Experimental Protocols
Protocol 1: Determination of Tl(I) using a Bismuth-Plated Gold Microelectrode Array
This protocol describes a highly sensitive method for determining ultratrace levels of thallium(I) [8].
Research Reagent Solutions:
- Acetate Buffer (1 M, pH 5.3): Prepared from CH₃COOH and NaOH (Suprapur reagents) as the supporting electrolyte.
- Bismuth Stock Solution: For in-situ plating of the bismuth film onto the gold array.
- Tl(I) Standard Solution: Prepared from Tl(I) nitrate in deionized water.
- Acetate Buffer with EDTA: Used for sample dilution and to minimize interference from other metal ions.
Procedure:
- Electrode Pretreatment: Polish the surface of the gold microelectrode array with 2500 grit sandpaper, rinse thoroughly with deionized water, and place in an ultrasonic bath for 30 seconds.
- Bismuth Film Plating: In a 10 mL electrochemical cell containing the acetate buffer and a known concentration of Bi(III) ions, plate the bismuth film onto the gold array by applying a suitable cathodic potential.
- Analyte Pre-concentration (Deposition): Transfer the sample solution (acetate buffer with EDTA and the target Tl(I)) to the cell. While stirring, apply a deposition potential of -1.0 V to -1.2 V (vs. Ag/AgCl) for 120-180 seconds to reduce and accumulate Tl(I) as Tl(0) onto the bismuth-plated electrode.
- Stripping and Measurement: After a quiet time of 10 seconds, initiate a differential pulse anodic potential scan. Record the stripping voltammogram and measure the anodic peak current for Tl(I) oxidation, which appears at approximately -0.8 V to -0.9 V (vs. Ag/AgCl).
- Calibration: Construct a calibration curve by plotting the peak current against the concentration of standard Tl(I) solutions.
Figure 1: Workflow for Tl(I) determination using a bismuth-plated gold microelectrode array.
Protocol 2: Determination of Tl(I) using a Mercury Film Electrode (MFE)
This classical protocol is included for historical and comparative context, with caution advised due to the toxicity of mercury [66].
Research Reagent Solutions:
- Supporting Electrolyte: Varies with application (e.g., acidic medium).
- Mercury Stock Solution: For the in-situ formation of the mercury film.
- Tl(I) Standard Solution.
Procedure:
- Mercury Film Formation: A mercury film is pre-plated onto a glassy carbon (GC) rotating disc electrode (RDE) from a solution containing Hg(II) ions.
- Analytical Deposition: The MFE is placed in the deaerated sample solution. Under rotation (e.g., 1000 rpm), a deposition potential (e.g., -1000 mV vs. SCE) is applied for a set time (e.g., 4 minutes) to concentrate thallium into the mercury film as an amalgam.
- Stripping and Measurement: After ceasing rotation, the deposited thallium is stripped back into solution using a differential pulse anodic scan. The peak current is proportional to the concentration of Tl(I) in the sample.
The Scientist's Toolkit
Table 2: Essential research reagents and materials for Tl(I) determination via ASV.
| Reagent/Material | Function | Example Use Case |
|---|---|---|
| Gold Microelectrode Array | Conductive, reusable substrate with high stability and low iR drop. | Basis for bismuth-plating; excellent for ultratrace detection [8]. |
| Bismuth (III) Salt | Source for in-situ or ex-situ formation of the bismuth film sensing layer. | Eco-friendly alternative to mercury; forms alloys with Tl [8] [65]. |
| Ethylenediaminetetraacetic Acid (EDTA) | Complexing agent to mask interfering metal ions. | Added to the supporting electrolyte to improve selectivity [35] [65]. |
| Acetate Buffer (pH ~4.5-5.3) | Supporting electrolyte to maintain optimal pH and ionic strength. | Provides a defined electrochemical window for Tl stripping [8] [35]. |
| Amberlite XAD-7 Resin | Hydrophobic resin to adsorb organic surfactants. | Minimizes fouling of the electrode surface in complex samples [65]. |
This application note demonstrates that the choice of electrode material is a decisive factor in the performance of ASV-based thallium sensors. While mercury film electrodes have a long history of use, bismuth-based electrodes now represent the state-of-the-art, combining exceptional analytical sensitivity with a much-improved environmental and safety profile. The integration of bismuth with advanced gold microelectrode arrays exemplifies a powerful and robust platform for the determination of thallium(I) at ultratrace levels. The provided protocols and performance data offer researchers a clear guide for selecting and implementing the most appropriate sensor for their specific application needs.
The underpotential deposition (UPD) of thallium on gold-film electrodes represents a sophisticated electroanalytical technique for the trace determination of this highly toxic element. UPD occurs when a metal deposits onto a foreign metallic substrate at a potential more positive than its thermodynamic reduction potential, resulting in the formation of a monolayer through a self-limiting process [28]. This phenomenon is particularly advantageous for analytical applications as it provides a sharp, sensitive stripping response, reduces interferences from accompanying ions, and minimizes changes to the electrode surface structure, thereby enhancing analytical reproducibility [11]. This document establishes detailed protocols for evaluating the key analytical figures of merit—linearity, limit of detection (LOD), limit of quantification (LOQ), repeatability, and reproducibility—for the determination of thallium(I) using UPD at a gold-film electrode (AuFE), providing a standardized framework for research and method validation.
Experimental Protocols
Reagents and Materials
Supporting Electrolyte (Citrate Medium): To prepare 500 mL of a 0.1 M citrate supporting electrolyte at pH 5.3, dissolve citric acid and its sodium salt in deionized water. This medium is crucial for eliminating interferences from Pb(II) and Cd(II) ions, which cause mutual peak overlap in nitric acid medium [11].
Thallium(I) Stock Solution (1,000 mg/L): Dissolve an appropriate amount of high-purity thallium(I) nitrate (TlNO₃) in deionized water. This stock solution should be stored in a dark glass bottle at 4°C. Working standards are prepared daily by appropriate dilution of the stock solution with the supporting electrolyte [11].
Gold Plating Solution (1 mM HAuCl₄): Dissolve hydrogen tetrachloroaurate(III) hydrate in deionized water to prepare the gold film electrodeposition solution [11].
Instrumentation and Electrode Preparation
- Voltammetric Analyzer: Use a potentiostat capable of performing square-wave anodic stripping voltammetry (SW-ASV).
- Three-Electrode System:
- Working Electrode: Rotating gold-film electrode (AuFE).
- Counter Electrode: Platinum wire.
- Reference Electrode: Ag/AgCl (3.5 M KCl).
- Gold-Film Electrode (AuFE) Preparation Protocol [11]:
- Substrate Preparation: Polish a glassy carbon (GC) electrode substrate successively with finer grades of alumina slurry (e.g., down to 0.05 µm) on a microcloth pad. Rinse thoroughly with deionized water after each polishing step.
- Ultrasonic Cleaning: Sonicate the polished GC electrode in deionized water for 1 minute to remove any adhered alumina particles.
- Electrodeposition: Immerse the prepared GC electrode in a deaerated 1 mM H[AuCl₄] solution. Under conditions of electrode rotation (e.g., 500 rpm), apply a potential of -300 mV vs. Ag/AgCl for 300 seconds to deposit the gold film. The resulting film is characterized by a sub-nanoscale morphology and a highly developed surface area.
SW-ASV Measurement Procedure for Tl(I)
- Solution Deaeration: Purge the electrochemical cell containing the supporting electrolyte and Tl(I) standard/sample with high-purity nitrogen or argon for at least 600 seconds to remove dissolved oxygen.
- Accumulation / UPD Step: While rotating the AuFE (e.g., at 500 rpm), apply a predetermined accumulation potential (Eₐᶜ꜀) for a fixed time (tₐᶜ꜀). This step should be performed in the UPD region, where Tl⁺ ad-atoms form a monolayer on the gold surface without bulk deposition.
- Equilibration: After accumulation, stop electrode rotation and allow the solution to become quiescent for a brief period (e.g., 10 seconds).
- Stripping Step: Initiate a square-wave anodic potential scan from Eₐᶜ꜀ to a more positive switching potential. Record the resulting voltammogram.
- Electrode Cleaning / Renewal: Between measurements, apply a positive potential hold (e.g., +0.6 V vs. Ag/AgCl) for 30-60 seconds in the supporting electrolyte to ensure complete stripping of any residual Tl and refresh the electrode surface.
The following workflow diagram illustrates the complete experimental procedure from electrode preparation to measurement and analysis:
Evaluating Analytical Figures of Merit
Calibration and Linearity
Protocol:
- Prepare a series of at least five standard solutions of Tl(I) spanning the expected concentration range (e.g., from 5 µg·L⁻¹ to 250 µg·L⁻¹) in the citrate supporting electrolyte [11].
- Analyze each standard in triplicate using the SW-ASV procedure outlined in Section 2.3.
- Measure the peak current height (or area) for the Tl UPD stripping signal in each voltammogram.
- Plot the mean peak current (y-axis) against the corresponding Tl(I) concentration (x-axis).
- Perform linear regression analysis to obtain the calibration function (y = a + bx), the coefficient of determination (R²), and the residual plot.
Acceptance Criteria: A linear response is typically indicated by an R² value > 0.995 [11]. The residual plot should show a random scatter of points around zero, confirming the appropriateness of the linear model.
Limit of Detection (LOD) and Limit of Quantification (LOQ)
Protocol:
- Analyze a minimum of 10 independent replicates of a blank solution (supporting electrolyte containing no analyte).
- Calculate the standard deviation (s) of the peak current for the blank measurements.
- From the calibration curve obtained in Section 3.1, determine the slope (b).
- Calculate LOD and LOQ using the formulas:
- LOD = 3.3 × (s / b)
- LOQ = 10 × (s / b)
Acceptance Criteria: The LOD and LOQ should be sufficiently low for the intended application. For example, the European Union's permissible Tl contamination level in drinking water is 2 µg·L⁻¹ [11], requiring an LOD significantly below this threshold.
Repeatability (Intra-day Precision)
Protocol:
- Within a single analytical run (same day, same instrument, same operator), analyze multiple replicates (n ≥ 5) of a Tl(I) standard at low, medium, and high concentrations within the linear range.
- For each concentration level, calculate the mean peak current, standard deviation (s), and relative standard deviation (RSD).
- RSD (%) = (s / mean) × 100
Acceptance Criteria: The RSD for repeatability should generally be ≤ 10% for the medium and high concentrations, and ≤ 15% for the low concentration near the LOQ.
Reproducibility (Inter-day / Intermediate Precision)
Protocol:
- Analyze the same set of Tl(I) standard concentrations (low, medium, high) over at least three different days, using the same stock solutions but with freshly prepared AuFEs and supporting electrolyte.
- If applicable, the analysis may be performed by different operators.
- For each concentration level, pool the data from all days/operators and calculate the overall mean, standard deviation, and RSD.
Acceptance Criteria: The RSD for reproducibility is expected to be slightly higher than that for repeatability but should typically be ≤ 15-20%, demonstrating the robustness of the method.
Data Presentation and Analysis
The following table summarizes typical performance data for the determination of Tl(I) by UPD at a gold-film electrode, as established using the protocols above, alongside a comparison with an alternative bismuth-plated gold microelectrode array for context.
Table 1: Analytical Performance Data for Thallium(I) Determination
| Analytical Parameter | UPD at Rotating Gold-Film Electrode [11] | Bismuth-Plated Gold Microelectrode Array (for context) [8] |
|---|---|---|
| Linear Range | 5 – 250 µg·L⁻¹ | 0.1 – 102 µg·L¹ (for 180 s deposition) |
| Coefficient of Determination (R²) | > 0.995 | 0.9988 |
| Limit of Detection (LOD) | 0.6 µg·L⁻¹ (with 210 s accumulation) | 0.016 µg·L⁻¹ (with 180 s deposition) |
| Accumulation / Deposition Time | 210 s | 180 s |
| Supporting Electrolyte | 10 mM HNO₃ + 10 mM NaCl or Citrate medium (to eliminate Pb/Cd interference) | Acetate Buffer (pH 5.3) |
| Application in Real Samples | Drinking water, river water, black tea | Certified reference material (TM 25.5) and spiked real water samples |
| Recovery in Real Samples | Satisfactory recovery values for nanomolar spikes | 98.7 – 101.8% |
The Scientist's Toolkit: Essential Research Reagents and Materials
Table 2: Key Research Reagent Solutions and Materials
| Item | Function / Purpose |
|---|---|
| Glassy Carbon (GC) Electrode | Provides a clean, reproducible substrate for the electrodeposition of the gold film. |
| Hydrogen Tetrachloroaurate (HAuCl₄) | The precursor salt for the electrochemical deposition of the porous gold-film electrode (AuFE). |
| Thallium(I) Nitrate (TlNO₃) | The source of Tl(I) analyte for preparing standard stock and working solutions. |
| Citrate Buffer / Nitric Acid & NaCl | Supporting electrolyte; citrate medium is crucial for complexing and eliminating interference from Pb(II) and Cd(II). |
| High-Purity Nitrogen or Argon Gas | For deaeration of solutions to remove dissolved oxygen, which can interfere with the stripping signal. |
| Alumina Polishing Slurries | For mechanical polishing and renewal of the glassy carbon electrode surface prior to gold deposition. |
The protocols detailed herein provide a comprehensive framework for the rigorous validation of an analytical method for thallium(I) determination based on underpotential deposition at a gold-film electrode. By systematically evaluating linearity, LOD, LOQ, repeatability, and reproducibility, researchers can ensure that the method produces reliable, accurate, and precise data suitable for the analysis of trace thallium in complex environmental matrices such as water and tea samples. The effectiveness of this approach is confirmed by satisfactory recovery values obtained in the analysis of spiked real samples and certified reference materials [11]. This standardized application note facilitates the adoption of this sensitive and selective electrochemical technique for monitoring this critically toxic element.
Within the scope of research on the determination of thallium by underpotential deposition (UPD) at a gold-film electrode, selecting the appropriate analytical technique is paramount. This analysis directly compares the novel electrochemical method with two established spectroscopic techniques: Inductively Coupled Plasma Mass Spectrometry (ICP-MS) and Atomic Absorption Spectroscopy (AAS). The evaluation is framed around three critical practical dimensions: portability (the potential for on-site analysis), speed (analysis time and sample throughput), and operational expense (both initial investment and ongoing costs). This cost-benefit analysis provides researchers and drug development professionals with a clear framework for selecting the optimal methodology based on specific project requirements, whether for rapid screening, ultra-trace level confirmation, or routine analysis.
Comparative Analysis of Analytical Techniques
The choice between anodic stripping voltammetry (ASV) with UPD, ICP-MS, and AAS involves significant trade-offs. The following table summarizes their core performance and cost characteristics, contextualized for thallium determination.
Table 1: Comparative Analysis of Techniques for Thallium Determination
| Feature | ASV with UPD at Gold-Film Electrode | ICP-MS | AAS |
|---|---|---|---|
| Principle | Electrochemical deposition (UPD) and stripping of Tl⁺ on a gold-film electrode [11] | Ionization in high-temperature plasma and mass-based detection [67] | Absorption of element-specific light by ground-state atoms [67] |
| Detection Limit for Tl | 0.6 µg·L⁻¹ (ppb) [11] | Parts per trillion (ppt) range [67] [68] | Parts per billion (ppb) to parts per million (ppm) range [68] [69] |
| Analysis Speed / Throughput | ~5-10 minutes per sample (incl. 210s accumulation) [11] | High; simultaneous multi-element analysis [67] | Low; typically sequential single-element analysis [67] [69] |
| Portability | High; potential for compact, field-deployable instrumentation [11] [6] | Very Low; requires lab setting, stable power, and gas supply [70] | Low; benchtop instruments, not designed for field use [67] |
| Capital Cost | Low (relative to ICP-MS) [6] | High ($150,000 - $500,000+) [70] | Low to Moderate [67] [70] |
| Operational Cost | Low (minimal gas/power consumption) [6] | Very High (argon consumption, maintenance contracts ~$20k-$40k/year) [70] | Low (less gas consumption) [67] [68] |
| Multi-element Capability | Limited (can be designed for specific metals) | Excellent (simultaneous analysis of >70 elements) [67] [68] | Poor (typically one element at a time) [69] |
| Sample Matrix Tolerance | Good; interferents like Pb(II) and Cd(II) can be mitigated (e.g., citrate medium) [11] | Excellent; handles complex matrices with minimal interference [67] | Sensitive; may require extensive sample preparation [67] |
Key Insights from Comparative Data
- Portability: The UPD-ASV method stands out for field analysis. Its instrumentation is relatively simple and can be miniaturized, allowing for on-site testing of environmental water samples or preliminary screening [11] [6]. In contrast, ICP-MS and AAS are confined to the laboratory.
- Speed: While ICP-MS offers the fastest overall analysis for a large number of elements across many samples, UPD-ASV provides rapid results for a single or a few target analytes. AAS is the slowest for multi-analyte profiling due to its sequential nature [67] [69].
- Operational Expense: UPD-ASV and AAS present a significantly lower financial burden than ICP-MS. The operational costs for ICP-MS are substantial, driven by high-purity argon consumption, which can reach five figures annually, and mandatory service contracts [70]. UPD-ASV avoids these costs, utilizing inexpensive electrolytes and electrodes.
Experimental Protocols for Thallium Determination
Protocol A: Stripping Voltammetry with Underpotential Deposition at a Gold-Film Electrode
This protocol details the determination of trace Tl(I) using UPD on a rotating gold-film electrode, as described in the foundational research [11].
Research Reagent Solutions
Table 2: Essential Reagents and Materials for UPD-ASV
| Item | Function / Specification |
|---|---|
| Gold Deposition Solution | 1 mM H[AuCl₄] solution for potentiostatic electrodeposition of the gold film [11]. |
| Supporting Electrolyte | 10 mM HNO₃ + 10 mM NaCl, or citrate medium to eliminate Pb/Cd interference [11]. |
| Thallium Standard | Tl(I) nitrate standard for calibration [11]. |
| Working Electrode | Glassy carbon substrate for gold-film electrodeposition [11]. |
| Reference Electrode | Ag/AgCl (3.5 M KCl) [11]. |
| Auxiliary Electrode | Platinum wire [11]. |
Methodology
- Electrode Preparation: Prepare the gold-film working electrode by potentiostatic electrodeposition from a 1 mM H[AuCl₄] solution at -300 mV (vs. Ag/AgCl) for 300 seconds onto a glassy carbon substrate. This creates a gold film with a sub-nanoscale morphology and high surface area [11].
- Sample Pre-treatment: For complex matrices like water or digested samples, use a supporting electrolyte composed of 10 mM HNO₃ and 10 mM NaCl. If interference from Pb(II) or Cd(II) is anticipated, employ a citrate medium to resolve overlapping stripping peaks [11].
- UPD Accumulation: Introduce the sample into the electrochemical cell. With the electrode rotating, apply an accumulation potential suitable for the underpotential deposition of Tl⁺ ad-atoms onto the gold film for a defined time (e.g., 210 seconds) [11].
- Stripping & Detection: After the accumulation period, cease electrode rotation. Apply a square-wave anodic stripping voltammetry (SW-ASV) scan from the accumulation potential to a more positive potential. The resulting current is measured as Tl⁺ is oxidized (stripped) from the electrode surface [11].
- Quantification: Measure the height of the resulting Tl stripping peak. Construct a calibration curve from Tl standard solutions analyzed under identical conditions and use it to determine the unknown concentration [11].
The workflow for this protocol is summarized in the following diagram:
Protocol B: Inductively Coupled Plasma Mass Spectrometry (ICP-MS)
This protocol outlines the standard procedure for determining thallium using ICP-MS, the benchmark for ultra-trace elemental analysis.
- Sample Digestion: For solid samples (e.g., Shilajit, soils), digest typically with a mixture of nitric acid (HNO₃) and hydrogen peroxide (H₂O₂), often using microwave-assisted digestion to ensure complete dissolution of the matrix and liberation of thallium [6].
- Instrument Calibration: Prepare a series of multi-element standard solutions containing Tl across the expected concentration range. Include an internal standard (e.g., Indium) to correct for instrument drift and matrix effects.
- Sample Introduction & Ionization: The liquid sample is nebulized into an aerosol and transported by argon gas into the core of the ICP torch, where it is exposed to temperatures of ~10,000°C, causing atomization and ionization of Tl to Tl⁺ [67].
- Mass Separation & Detection: The generated ions are passed through a mass spectrometer (e.g., a quadrupole) which separates them based on their mass-to-charge (m/z) ratio. Ions with m/z 203 and 205 (for Tl) are selectively passed to the detector [67].
- Quantification: The intensity of the signal at the specific m/z ratios for Tl is compared to the calibration curve to quantify its concentration in the sample [67].
Protocol C: Atomic Absorption Spectroscopy (AAS)
This protocol describes the determination of thallium using AAS, a cost-effective technique for higher concentration levels.
- Sample Preparation: Digest solid samples as for ICP-MS. Liquid samples may require dilution or matrix modification. For greater sensitivity with graphite furnace AAS (GF-AAS), the sample is injected directly into the furnace [6].
- Instrument Setup: Install a hollow cathode lamp specific for thallium, which emits light at the characteristic wavelength for Tl. Set the instrument to the correct wavelength and slit width [67].
- Atomization:
- Flame AAS: The sample solution is aspirated into a flame (e.g., air-acetylene), where it is desolvated, vaporized, and atomized into ground-state Tl atoms [67].
- Graphite Furnace AAS: A small aliquot of sample is dispensed into the graphite tube, which is then heated through a temperature program to dry, char, and finally atomize the sample.
- Absorption Measurement: Light from the Tl lamp is passed through the cloud of atoms. The ground-state Tl atoms absorb a fraction of this light. A detector measures the attenuation of the light beam [67].
- Quantification: The amount of absorbed light is proportional to the concentration of Tl in the sample, as determined by a calibration curve prepared from standard solutions [67].
The determination of thallium using underpotential deposition at a gold-film electrode presents a compelling alternative to established techniques like ICP-MS and AAS, particularly when project constraints prioritize portability, operational cost-efficiency, and analysis speed for a specific target. UPD-ASV excels in field-based applications and scenarios where the budget is limited, offering respectable sensitivity at a fraction of the cost of ICP-MS. ICP-MS remains the undisputed choice for laboratories requiring the ultimate sensitivity, multi-element capability, and the ability to handle high-throughput, complex samples, despite its high capital and operational expenses. AAS serves as a reliable, cost-effective workhorse for laboratories focused on the routine analysis of specific elements at higher concentration levels. The optimal technique is therefore not universal but is dictated by the specific analytical needs, infrastructure, and financial resources of the research program.
Conclusion
The utilization of underpotential deposition at gold-film electrodes presents a powerful, sensitive, and selective methodology for the determination of toxic thallium, achieving detection limits as low as 8x10^-11 mol L^-1. This technique successfully bridges the gap between laboratory-grade accuracy and the need for portable, cost-effective field analysis. The contrasting UPD behavior of Tl on different gold substrates underscores the importance of electrode architecture, while optimized methodologies and interference management strategies enable reliable application in real-world environmental and potential biomedical samples. When validated against certified materials and benchmarked against ICP-MS, this electrochemical approach demonstrates compelling advantages for routine monitoring. Future directions should focus on integrating these sensors into miniaturized, point-of-care diagnostic systems for rapid thallium poisoning assessment and expanding their application to the analysis of clinical samples like blood and urine, thereby directly impacting toxicological research and public health safety protocols.
References
- 1. Underpotential deposition (UPD) Research Papers [https://www.academia.edu/Documents/in/Underpotential_deposition_UPD_]
- 2. Does Pb underpotential deposition rearrange surface-near ... [https://www.sciencedirect.com/science/article/pii/S0013468625001392]
- 3. Underpotentially-deposited silver substrates reverse the ... [https://pubs.rsc.org/en/content/articlehtml/2025/qm/d4qm00541d]
- 4. Electroanalysis overview: The determination of ... [https://www.sciencedirect.com/science/article/pii/S2666831924000055]
- 5. Thallium Toxicity: Mechanisms of Action, Available ... [https://www.mdpi.com/2673-9879/5/3/49]
- 6. Quantifying of thallium in Shilajit and its supplements to unveil ... [https://pmc.ncbi.nlm.nih.gov/articles/PMC11743217/]
- 7. Validation of Analytical Method for Determination ... [https://pmc.ncbi.nlm.nih.gov/articles/PMC9103374/]
- 8. Anodic Stripping Voltammetric Procedure of Thallium(I) ... [https://www.mdpi.com/1424-8220/24/4/1206]
- 9. The contrasting behaviour of polycrystalline bulk gold and ... [https://pubs.rsc.org/en/content/articlelanding/2008/nj/b719208h]
- 10. A Voltammetric Sensor for Trace Thallium(I) Detection [https://pmc.ncbi.nlm.nih.gov/articles/PMC12524688/]
- 11. Determination of thallium (I) by under-potential deposition- ... [https://www.sciencedirect.com/science/article/abs/pii/S0026265X25034320]
- 12. Probing Charge Transport Kinetics in a Plasmonic ... [https://pmc.ncbi.nlm.nih.gov/articles/PMC8697001/]
- 13. oxo-carboxylate cluster-chitosan composite [https://www.sciencedirect.com/science/article/abs/pii/S0026265X25032606]
- 14. Emerging interest of gold-carbon nanocomposites in water ... [https://www.sciencedirect.com/science/article/abs/pii/S2213343724010613]
- 15. Recent advances in gold electrode fabrication for low- ... [https://pubs.rsc.org/en/content/articlelanding/2023/lc/d2lc00552b]
- 16. Thallium - poisoner's poison: An overview and review of ... [https://www.sciencedirect.com/science/article/pii/S2666027X24000100]
- 17. Thallium Toxicity - StatPearls - NCBI Bookshelf [https://www.ncbi.nlm.nih.gov/books/NBK513240/]
- 18. HEALTH EFFECTS - Toxicological Profile for Thallium - NCBI [https://www.ncbi.nlm.nih.gov/books/NBK598070/]
- 19. ANALYTICAL METHODS - Toxicological Profile for Thallium [https://www.ncbi.nlm.nih.gov/books/NBK598069/]
- 20. Anodic Stripping Voltammetric Procedure of Thallium(I) ... [https://pmc.ncbi.nlm.nih.gov/articles/PMC10892365/]
- 21. Arsenic (III) detection with underpotential deposition on gold [https://www.sciencedirect.com/science/article/pii/S1572665722001461]
- 22. Improved Microelectrode Array Electrode Design for Heavy ... [https://www.mdpi.com/2227-9040/12/4/51]
- 23. A Simple, Cost-Effective Sensor for Detecting Lead Ions in ... [https://pmc.ncbi.nlm.nih.gov/articles/PMC5461074/]
- 24. Electrode Modified by Reduced Graphene Oxide for ... [https://pmc.ncbi.nlm.nih.gov/articles/PMC5923695/]
- 25. A mercury-free electrochemical sensor for the ... [https://www.sciencedirect.com/science/article/abs/pii/S0039914007000896]
- 26. Effect of Bi(III)-to-metal ion concentration ratios on stripping ... [https://pubs.rsc.org/en/content/articlehtml/2024/ra/d4ra07034h]
- 27. Application of a Novel Solid Silver Microelectrode Array for ... [https://www.mdpi.com/1420-3049/30/21/4220]
- 28. Probing the Surface of Noble Metals Electrochemically by ... [https://www.mdpi.com/2571-9637/2/2/20]
- 29. Electrochemical Deposition and Dissolution of Thallium ... [https://pmc.ncbi.nlm.nih.gov/articles/PMC4433681/]
- 30. 2.3. Modification and Preparation of the Lead Ions Sensor [https://bio-protocol.org/exchange/minidetail?id=1956200&type=30]
- 31. A modified method of separating Tl(I) and Tl(III) in aqueous ... [https://pmc.ncbi.nlm.nih.gov/articles/PMC6768029/]
- 32. Determination of thallium (I) by under-potential deposition- ... [https://www.sciencedirect.com/science/article/pii/S0026265X25034320]
- 33. Determination of Tl(III) and Tl(I) in food samples with two ... [https://www.sciencedirect.com/science/article/abs/pii/S0889157522005853]
- 34. Method Validation for Determination of Thallium by ... [https://pmc.ncbi.nlm.nih.gov/articles/PMC8588170/]
- 35. Electrode Modified by Reduced Graphene Oxide for ... [https://www.mdpi.com/1660-4601/15/4/653]
- 36. imprinted polymer and vortex-assisted liquid ... [https://www.sciencedirect.com/science/article/abs/pii/S0026265X22003551]
- 37. Regenerative Strategy of Gold Electrodes for Long-Term ... [https://pmc.ncbi.nlm.nih.gov/articles/PMC9835648/]
- 38. Achieving long-term stability of thin-film electrodes for ... [https://pubmed.ncbi.nlm.nih.gov/34020055/]
- 39. Evaluation of thallium ion as an effective ion in human ... [https://www.sciencedirect.com/science/article/abs/pii/S0013935123018303]
- 40. A calixarene-based ion-selective electrode for thallium(I) ... [https://www.sciencedirect.com/science/article/pii/S0003267014010502]
- 41. A calixarene-based ion-selective electrode for thallium(I) ... [https://pubmed.ncbi.nlm.nih.gov/25440668/]
- 42. Gold Plate Electrodes Functionalized by Multiwall Carbon ... [https://pubmed.ncbi.nlm.nih.gov/31416119/]
- 43. Surface Investigation on Electrochemically Deposited Lead ... [https://www.mdpi.com/2571-9637/2/1/6]
- 44. A review of multi-walled carbon nanotubes-based ... [https://www.sciencedirect.com/science/article/pii/S0925838825006644]
- 45. Unlocking the Future: Carbon Nanotubes as Pioneers in ... [https://www.mdpi.com/2227-9040/13/7/225]
- 46. Crown-Ether Derived Graphene Hybrid Composite for ... [https://pubmed.ncbi.nlm.nih.gov/26703780/]
- 47. Crown ether functionalized graphene oxide as ultrasensitive ... [https://inis.iaea.org/records/xjhj9-r9023]
- 48. Thiol surfactant assembled on gold nanoparticles ion ... [https://www.sciencedirect.com/science/article/abs/pii/S0925400513011635]
- 49. A study of the initial stages of the electrochemical deposition of lead... [https://eprints.soton.ac.uk/459748/]
- 50. pH and ORP Electrode Cleaning | Knowledge Center [https://www.hamiltoncompany.com/knowledge-base/article/ph-and-orp-electrode-cleaning?srsltid=AfmBOooXifLO35cyK2yUeOywkpwH3AvDufKYEY86Sf8a0U2hcJak0XCp]
- 51. A General Method for Regenerating Catalytic Electrodes [https://www.sciencedirect.com/science/article/pii/S2542435120303895]
- 52. A new approach to monitoring fouling and cleaning [https://www.sciencedirect.com/science/article/pii/S0378775319312959]
- 53. sciencedirect.com/topics/chemistry/ underpotential - deposition [https://www.sciencedirect.com/topics/chemistry/underpotential-deposition]
- 54. Investigating electrochemical deposition of gold on ... [https://pmc.ncbi.nlm.nih.gov/articles/PMC9679451/]
- 55. Ion Suppression: A Major Concern in Mass Spectrometry [https://www.chromatographyonline.com/view/ion-suppression-major-concern-mass-spectrometry]
- 56. Ion suppression; A critical review on causes, evaluation ... [https://www.sciencedirect.com/science/article/abs/pii/S0039914013001975]
- 57. Critical Assessment of Clean-Up Techniques Employed in ... [https://pmc.ncbi.nlm.nih.gov/articles/PMC8781265/]
- 58. Sample Clean-up for Persistent Organic Pollutants [https://www.sepscience.com/sample-clean-up-for-persistent-organic-pollutants-6841]
- 59. Method Validation for Determination of Thallium by ... [https://www.mdpi.com/1420-3049/26/21/6729]
- 60. Electrodeposition Process for Optimizing Cu2Se Films with ... [https://pmc.ncbi.nlm.nih.gov/articles/PMC12547517/]
- 61. Thallium standard solution traceable to SRM from NIST ... [https://www.sigmaaldrich.com/IL/en/product/mm/119801?srsltid=AfmBOop0ZbKwtG4MmQP4mMk7ie8iTRVmTCmi1VMCMWlTxrBjda3s589G]
- 62. Trace and Major Elements Analysis of Alternative Solid ... [https://www.mdpi.com/2673-4591/56/1/238]
- 63. Thallium Exposure Secondary to Commercial Kale Chip ... [https://pmc.ncbi.nlm.nih.gov/articles/PMC12386648/]
- 64. Investigation of copper underpotential deposition on ... [https://www.sciencedirect.com/science/article/pii/S1452398123197719]
- 65. Integrated three-electrode screen-printed sensor modified ... [https://pubmed.ncbi.nlm.nih.gov/30253827/]
- 66. Anodic Stripping Voltammetric Determination of Thallium at ... [https://www.sciencepublishinggroup.com/article/10.11648/j.sjac.20221004.12]
- 67. ICP-MS vs. AAS - Which Technique to Choose - Drawell [https://www.drawellanalytical.com/icp-ms-vs-aas-which-technique-to-choose/]
- 68. Lab Spectrometer Comparison - When to Choose ICP-AES, ICP-OES, ICP-MS, or AAS - Drawell [https://www.drawellanalytical.com/lab-spectrometer-comparison-when-to-choose-icp-aes-icp-oes-icp-ms-or-aas/]
- 69. ICP-AES VS AAS - 6 Key Differences Analysis - Drawell [https://www.drawellanalytical.com/icp-aes-vs-aas-6-key-differences-analysis/]
- 70. How Much Does an ICP-MS Cost? [https://www.excedr.com/blog/how-much-does-an-icp-ms-cost]